solvent extraction principles and practice-second edition...
TRANSCRIPT
4Solvent Extraction EquilibriaJAN RYDBERG* Chalmers University of Technology, Goteborg, Sweden
GREGORY R. CHOPPIN* Florida State University, Tallahassee, Florida,U.S.A.
CLAUDE MUSIKAS* Commissariat a l’Energie Atomique, Paris, France
TATSUYA SEKINE† Science University of Tokyo, Tokyo, Japan
4.1 INTRODUCTION
The ability of a solute (inorganic or organic) to distribute itself between anaqueous solution and an immiscible organic solvent has long been applied toseparation and purification of solutes either by extraction into the organic phase,leaving undesirable substances in the aqueous phase; or by extraction of theundesirable substances into the organic phase, leaving the desirable solute in theaqueous phase. The properties of the organic solvent, described in Chapter 2,require that the dissolved species be electrically neutral. Species that prefer theorganic phase (e.g., most organic compounds) are said to be lipophilic (“likingfat”) or hydrophobic (“disliking water”), while the species that prefer water(e.g., electrolytes) are said to be hydrophilic (“liking water”), or lipophobic(“disliking fat”). Because of this, a hydrophilic inorganic solute must be ren-dered hydrophobic and lipophilic in order to enter the organic phase.
Optimization of separation processes to produce the purest possible prod-uct at the highest yield and lowest possible cost, and under the most favorableenvironmental conditions, requires detailed knowledge about the solute reac-tions in the aqueous and the organic phases. In Chapter 2 we described physicalfactors that govern the solubility of a solute in a solvent phase; and in Chapter3, we presented the interactions in water between metal cations and anions by
This chapter is a revised and expanded synthesis of Chapters 4 (by Rydberg and Sekine) and 6 (byAllard, Choppin, Musikas, and Rydberg) of the first edition of this book (1992).*Retired.†Deceased.
Copyright © 2004 by Taylor & Francis Group, LLC

which neutral metal complexes are formed. This chapter discusses the equationsthat explain the extraction data for inorganic as well as organic complexes in aquantitative manner; i.e., the measured solute distribution ratio, Dsolute, to theconcentration of the reactants in the two phases. It presents chemical modelingof solvent extraction processes, particularly for metal complexes, as well as adescription of how such models can be tested and used to obtain equilibriumconstants.
The subject of this chapter is broad and it is possible to discuss only thesimpler—though fundamental—aspects, using examples that are representative.The goal is to provide the reader with the necessary insight to engage in solventextraction research and process development with good hope of success.
4.1.1 The Distribution Law
The distribution law, derived in 1898 by W. Nernst, relates to the distributionof a solute in the organic and in the aqueous phases. For the equilibrium reaction
A (aq) A (org) a� ( . )4 1
the Nernst distribution law is written
KD,Aorg
aq
Concentration of Species A in organic phase
Concentration of Species A in aqueous phase
[A]
[A]b= = ( . )4 1
where brackets refer to concentrations; Eq. (4.1) is the same as Eqs. (1.2) and(2.23). KD,A is the distribution constant (sometimes designated by P, e.g., inChapter 2; see also Appendix C) of the solute A (sometimes referred to as thedistribuend ). Strictly, this equation is valid only with pure solvents. In practice,the solvents are always saturated with molecules of the other phase; e.g., waterin the organic phase. Further, the solute A may be differently solvated in thetwo solvents. Nevertheless, Eq. (4.1) may be considered valid, if the mutualsolubilities of the solvents (see Table 2.2) are small, say <1%, and the activityfactors of the system are constant. If the solute is strongly solvated, or at highconcentration (mole fraction >0.1), or if the ionic strength of the aqueous phaseis large (>0.1 M) or changes, Eq. (4.1) must be corrected for deviations fromideality according to
Ky
y
y
yKD,A
0 A,org org
A,aq aq
A,org
A,orgD,A
[A]
[A]= = ( . )4 2
where y’s are activity coefficients [see Eq. (2.25)]. For aqueous electrolytes, theactivity factors vary with the ionic strength of the solution (see sections 2.5, and3.1.3, and Chapter 6). This has led to the use of the constant ionic mediummethod (see Chapter 3); i.e., the ionic strength of the aqueous phase is keptconstant during an experiment by use of a more or less inert “bulk” medium
Copyright © 2004 by Taylor & Francis Group, LLC
like NaClO4. Under such conditions the activity factor ratio of Eq. (4.2) is as-sumed to be constant, and KD is used as in Eq. (4.1) as conditions are varied ata constant ionic strength value. In the following derivations, we assume that theactivity factors for the solute in the aqueous and organic solvents are constant.Effects due to variations of activity factors in the aqueous phase are treated inChapter 6, but no such simple treatment is available for species in the organicphase (see Chapter 2).
The assumption that the activity factor ratio is constant has been found tobe valid over large solute concentration ranges for some solutes even at hightotal ionic strengths. For example, the distribution of radioactively labeled GaCl3
between diethyl ether and 6M HCl was found to be constant (KD,Ga � 18) at allGa concentrations between 10−3 and 10−12 M [1].
In the following relations, tables, and figures, the temperature of the sys-tems is always assumed to be 25°C, if not specified (temperature effects arediscussed in Chapters 3 and 6, and section 4.13.6). We use org to define speciesin the organic phase, and no symbol for species in the aqueous phase (see Ap-pendix C).
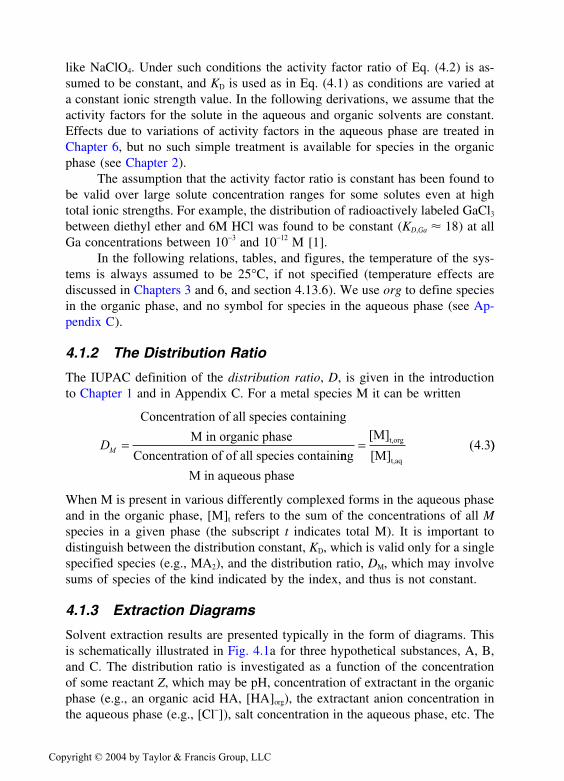
4.1.2 The Distribution Ratio
The IUPAC definition of the distribution ratio, D, is given in the introductionto Chapter 1 and in Appendix C. For a metal species M it can be written
DM =
Concentration of all species containing
M in organic phase
Concentration of of all species containinng
M in aqueous phase
[M]
[M]t,org
t,aq
= ( .4 3))
When M is present in various differently complexed forms in the aqueous phaseand in the organic phase, [M]t refers to the sum of the concentrations of all Mspecies in a given phase (the subscript t indicates total M). It is important todistinguish between the distribution constant, KD, which is valid only for a singlespecified species (e.g., MA2), and the distribution ratio, DM, which may involvesums of species of the kind indicated by the index, and thus is not constant.
4.1.3 Extraction Diagrams
Solvent extraction results are presented typically in the form of diagrams. Thisis schematically illustrated in Fig. 4.1a for three hypothetical substances, A, B,and C. The distribution ratio is investigated as a function of the concentrationof some reactant Z, which may be pH, concentration of extractant in the organicphase (e.g., an organic acid HA, [HA]org), the extractant anion concentration inthe aqueous phase (e.g., [Cl−]), salt concentration in the aqueous phase, etc. The
Copyright © 2004 by Taylor & Francis Group, LLC

Fig. 4.1 Liquid-liquid distribution plots. (a) The distribution ratios D for three differentsubstances A, B, and C, plotted against the variable Z of the aqueous phase. Z mayrepresent pH, concentration of extractant in organic phase ([HA]org), free ligand ion con-centration in the aqueous phase ([A−]), aqueous salt concentration, etc. (b) Same systemsshowing percentage extraction %E as a function of Z. D and Z are usually plotted onlogarithmic scale.
range of D is best measured from about 0.1–10, though ranges from about10−5–104 can be measured with special techniques (see section 4.15).
In many practical situations, a plot like Fig. 4.1a is less informative thanone of percentage extraction, %E, where:
% /( ) ( . )E D D= +100 1 4 4
Such a plot is shown in Fig. 4.1b for the same system as in Fig. 4.1a. Percentageextraction curves are particularly useful for designing separation schemes. Aseries of such curves has already been presented in Fig. 1.3.
A convenient way to characterize the S-shaped curves in Figs. 1.3 or 4.1b,where the extraction depends on the variable Z, is to use the log Z value of 50%extraction, e.g., log[Cl−]50. The pH50-value indicates −log[H+] for 50% extrac-tion. This is shown in Fig. 4.1 for distribuends A and B.
Copyright © 2004 by Taylor & Francis Group, LLC

Very efficient separations are often needed in industry, and a single ex-traction stage may be insufficient. The desired purity, yield, etc. can be achievedby multiple extractions, as discussed in Chapter 7 (see also section 1.2). Inthe design of separation processes using multistage extractions, other extractiondiagrams are preferred. Only single stage extraction is discussed in this chapter,while multistage extraction is discussed in the second part (Chapters 7–14) ofthis book.
4.2 THERMODYNAMICS OF EXTRACTION SYSTEMS
Extraction from aqueous solutions into organic solvents can be achieved throughdifferent chemical reactions. Some may seem very complicated, but usually oc-cur through a number of rather simple steps; we assume this in making a modelof the system. The subdivision of an extraction reaction into its simpler steps isuseful for understanding how the distribution ratio varies as a function of thetype and concentration of the reagents. Often these models allow equilibriumconstants to be measured.
As solute, we consider both nonelectrolytes (abbreviated as A or B, or-ganic or inorganic), and electrolytes (e.g., as metal-organic complexes, metalions rendered soluble in organic solvents through reactions with organic anionsA− and with adduct formers B). The system of equations shown later is onlyvalid as long as no species are formed other than those given by the equations,all concentrations refer to the free concentrations (i.e., uncomplexed), and activ-ity factors and temperatures are constant. Further, we assume that equilibriumhas been established. It may be noted that the use of equilibrium reactions meanthat the reactions take place in the aqueous phase, the organic phase or at theinterface, as is illustrated in the next examples, but do not show any intermedi-ates formed; this information can be obtained by kinetic studies, as described inChapter 5, or by “fingerprinting” techniques such as molecular spectroscopy.
Before a detailed analysis of the chemical reactions that govern the distri-bution of different solutes in solvent extraction systems, some representativepractical examples are presented to illustrate important subprocesses assumed tobe essential steps in the overall extraction processes.
4.2.1 Case I: Extraction of Uranyl Nitrateby Adduct Formation
This is a purification process used in the production of uranium. The overallreaction is given by
UO HNO TBP(org) UO NO TBP) (org)22+
3 2 3 2+ + →2 2 4 52( ) ( ( . )
where TBP stands for tributylphosphate. The organic solvent is commonly kero-sene. In Table 4.1 this extraction process is described in four steps. In Table
Copyright © 2004 by Taylor & Francis Group, LLC

Table 4.1 Schematic Representation of the Hypothetical Steps in U(VI) Extractionby TBP and Their Associate ∆G°i of Reaction
SecondFirst step step Third step Fourth step
Organic phase TBP UO2(TBP)2(NO3)2
(TBP + diluent) ↓ ↑Aqueous solution 2 HNO3 + UO2
2+ → ↓ UO2(NO3)2 + 2TBP ↑(HNO3 + UO2
2+ + UO2(NO3)2 + 2H+ TBP → UO2(TBP)2(NO3)2 UO2(TBP)2(NO3)2
H2O)
Start → Final ∆G 1° > 0 ∆G 2° > 0 ∆G 3° ≠ 0 ∆G 4°� 0∆Ge°x < 0
4.1, the sign of the free energy change, ∆G0, in each step is given by qualita-tively known chemical affinities (see Chapter 2). The reaction path is chosenbeginning with the complexation of U(VI) by NO−
3 in the aqueous phase to formthe uncharged UO2(NO3)2 complex (Step 1). Although it is known that the freeuranyl ion is surrounded by water of hydration, forming UO2(H2O)6
2+, and thenitrate complex formed has the stoichiometry UO2(H2O)6(NO3)2, water of hydra-tion is not listed in Eq. (4.5) or Table 4.1, which is common practice, in orderto simplify formula writing. However, in aqueous reactions, water of hydrationcan play a significant role. As the reactive oxygen (bold) of tributylphosphate,OP(OC4H9)3, is more basic than the reactive oxygen of water, TBP, whichslightly dissolves in water (Step 2), replaces water in the UO2(H2O)6(NO3)2 com-plex to form the adduct complex UO2(TBP)2(NO3)2. This reaction is assumed totake place in the aqueous phase (Step 3). Adduct formation is one of the mostcommonly used reactions in solvent extraction of inorganic as well as organiccompounds. (Note: the term adduct is often used both for the donor moleculeand for its product with the solute.) The next process is the extraction of thecomplex (Step 4). Even if the solubility of the adduct former TBP in the aqueousphase is quite small (i.e., DTBP very large), it is common to assume that thereplacement of hydrate water by the adduct former takes place in the aqueousphase, as shown in the third step of Table 4.1; further, the solubility of theadduct UO2(TBP)2(NO3)2 must be much larger in the organic than in the aqueousphase (i.e., DUO2 (TBP)2(NO3)2
� 1), to make the process useful. Other intermediate
reaction paths may be contemplated, but this is of little significance as ∆G0ex
depends only on the starting and final states of the system. The use of such athermodynamic representation depends on the knowledge of the ∆G0
i values asthey are necessary for valid calculations of the process.
The relation between ∆G0ex and Kex is given by
∆ Σ∆G G T Kexo
io
ex ln = = −R ( . )4 6
Copyright © 2004 by Taylor & Francis Group, LLC
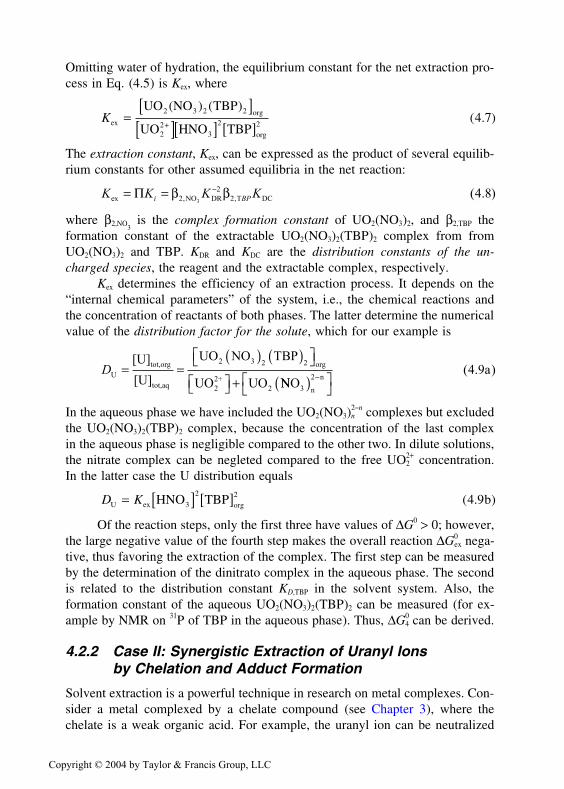
Omitting water of hydration, the equilibrium constant for the net extraction pro-cess in Eq. (4.5) is Kex, where
Kex
3 org
22+
3 org2
UO (NO TBP
UO HNO TBP=
[ ][ ][ ] [ ]
2 2 2
2 4 7) ( )
( . )
The extraction constant, Kex, can be expressed as the product of several equilib-rium constants for other assumed equilibria in the net reaction:
K K K Ki BPex NO DR2
T DC3= = −Π β β2 2 4 8, , ( . )
where β2,NO3is the complex formation constant of UO2(NO3)2, and β2,TBP the
formation constant of the extractable UO2(NO3)2(TBP)2 complex from fromUO2(NO3)2 and TBP. KDR and KDC are the distribution constants of the un-charged species, the reagent and the extractable complex, respectively.
Kex determines the efficiency of an extraction process. It depends on the“internal chemical parameters” of the system, i.e., the chemical reactions andthe concentration of reactants of both phases. The latter determine the numericalvalue of the distribution factor for the solute, which for our example is
DUtot,org
tot,aq
2 3 org
22+
2
[U]
[U]
UO NO TBP
UO UO= =
( ) ( ) +
2 2
NNOa
3 n
2 n( )
−( . )4 9
In the aqueous phase we have included the UO2(NO3)2n
−n complexes but excludedthe UO2(NO3)2(TBP)2 complex, because the concentration of the last complexin the aqueous phase is negligible compared to the other two. In dilute solutions,the nitrate complex can be negleted compared to the free UO2
2+ concentration.In the latter case the U distribution equals
D KU ex 3 org2HNO TBP b= [ ] [ ]2
4 9( . )
Of the reaction steps, only the first three have values of ∆G0 > 0; however,the large negative value of the fourth step makes the overall reaction ∆G0
ex nega-tive, thus favoring the extraction of the complex. The first step can be measuredby the determination of the dinitrato complex in the aqueous phase. The secondis related to the distribution constant KD,TBP in the solvent system. Also, theformation constant of the aqueous UO2(NO3)2(TBP)2 can be measured (for ex-ample by NMR on 31P of TBP in the aqueous phase). Thus, ∆G4
0 can be derived.
4.2.2 Case II: Synergistic Extraction of Uranyl Ionsby Chelation and Adduct Formation
Solvent extraction is a powerful technique in research on metal complexes. Con-sider a metal complexed by a chelate compound (see Chapter 3), where thechelate is a weak organic acid. For example, the uranyl ion can be neutralized
Copyright © 2004 by Taylor & Francis Group, LLC

by two TTA− (Appendix D:5e) anions to form the neutral UO2(TTA)2(H2O)2
complex. This complex is extractable into organic solvents, but only at highconcentrations of the TTA anion.
A large adduct formation constant increases the hydrophobicity of themetal complex and thus the distribution ratio of the metal. This is commonlyreferred to as a synergistic effect. Figure 4.2 illustrates the extraction of theUO2(TTA)2 complex from 0.01 M HNO3 into cyclohexane. Because the linearO−U−O group is believed to have five to seven coordination sites, where only
Fig. 4.2 Synergistic extraction: Distribution of U(VI) between 0.01 M HNO3 and mix-tures of thenoyltrifluoroacetone (TTA) and tributylphosphate (TBP), or tributylphos-phineoxide (TBPO), at constant total molarity ([TTA]org plus [TBP]org or [TBPO]org =0.02 M) in cyclohexane. (From Ref. 2.)
Copyright © 2004 by Taylor & Francis Group, LLC

four are occupied in this complex, the uranyl group is coordinativaly unsatu-rated. At the left vertical axes of Fig. 4.2, the free coordination sites are occu-pied by water and/or NO−
3, only; and the U(VI) complex is poorly extracted, logDU about −1. When TBP or TBPO (tributylphosphine oxide*) [both indicatedby B] are added while [HTTA] + [B] is kept constant, the DU value increases toabout 60 for TBP and to about 1000 for TBPO. At the peak value, the complexis assumed to be UO2(TTA)2B1 or 2. The decrease of DU at even higher [B] is dueto the corresponding decrease in [TTA−], so that at the right vertical axes ofFig. 4.2 no U(VI)—TTA complex is formed. For this particular case, at muchhigher nitrate concentrations, the U(VI) is complexed by NO−
3 and is extractedas an adduct complex of the composition UO2(NO3)2 B1–2, as discussed earlierfor Case I.
The primary cause for synergism in solvent extraction is an increase inhydrophobic character of the extracted metal complex upon addition of the ad-duct former. Three mechanisms have been proposed to explain the synergismfor metal + cheland† + adduct former. In the first suggested mechanism, thechelate rings do not coordinately saturate the metal ion, which retains residualwaters in the remaining coordination sites and these waters are replaced by otheradduct-forming molecules. The second involves an opening of one or more ofthe chelate rings and occupation by the adduct formers of the vacated metalcoordination sites. The third mechanism involves an expansion of the coordina-tion sphere of the metal ion upon addition of adduct formers so no replacementof waters is necessary to accommodate the adduct former. As pointed out before,it is not possible from the extraction constants to choose between these alterna-tive mechanisms, but enthalpy and entropy data of the reactions can be used toprovide more definitive arguments.
The HTTA + TBP system can serve to illustrate the main points of ther-modynamics of synergism. The overall extraction reaction is written as:
M + n HTTA(org) + p TBP(org) M(TTA) (TBP) (org) + p H+n p
+
n →← (( . )4 10a
We assume that the first step in the extraction equation is complexation in theaqueous phase
M n TTA M(TTA) (aq) n H bnn +z z+ − −+ +→← ( . )4 10
leading to the formation of the uncharged complex M(TTA)n, which immedi-ately dissolves in the organic phase due to its high hydrophobicity/lipophilicity
M(TTA) (aq) M(TTA) (org) cn n →← ( . )4 10
*TBPO = (C4H9)3PO, see Appendix D, example 16, at the end of this book.†Cheland or chelator is the chelating ligand.
Copyright © 2004 by Taylor & Francis Group, LLC
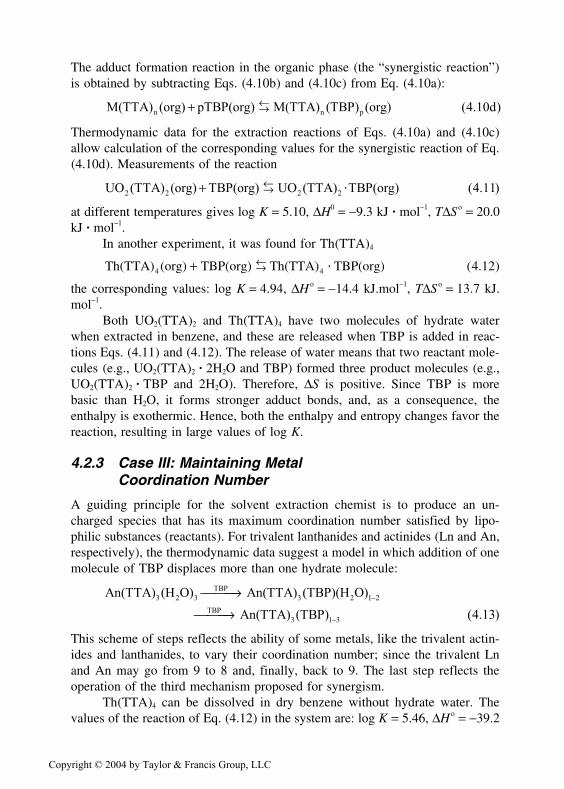
The adduct formation reaction in the organic phase (the “synergistic reaction”)is obtained by subtracting Eqs. (4.10b) and (4.10c) from Eq. (4.10a):
M(TTA) (org) pTBP(org) M(TTA) (TBP) (org) dn n p + →← ( . )4 10
Thermodynamic data for the extraction reactions of Eqs. (4.10a) and (4.10c)allow calculation of the corresponding values for the synergistic reaction of Eq.(4.10d). Measurements of the reaction
UO (TTA) (org) TBP(org) UO (TTA) TBP(org)2 2 2 2 + →← ⋅ ( . )4 11
at different temperatures gives log K = 5.10, ∆H0 = −9.3 kJ � mol−1, T∆S o = 20.0kJ � mol−1.
In another experiment, it was found for Th(TTA)4
Th(TTA) (org) TBP(org) Th(TTA) TBP(org)4 4+ →← ⋅ ( . )4 12
the corresponding values: log K = 4.94, ∆H o = −14.4 kJ.mol−1, T∆S o = 13.7 kJ.mol−1.
Both UO2(TTA)2 and Th(TTA)4 have two molecules of hydrate waterwhen extracted in benzene, and these are released when TBP is added in reac-tions Eqs. (4.11) and (4.12). The release of water means that two reactant mole-cules (e.g., UO2(TTA)2 � 2H2O and TBP) formed three product molecules (e.g.,UO2(TTA)2 � TBP and 2H2O). Therefore, ∆S is positive. Since TBP is morebasic than H2O, it forms stronger adduct bonds, and, as a consequence, theenthalpy is exothermic. Hence, both the enthalpy and entropy changes favor thereaction, resulting in large values of log K.
4.2.3 Case III: Maintaining MetalCoordination Number
A guiding principle for the solvent extraction chemist is to produce an un-charged species that has its maximum coordination number satisfied by lipo-philic substances (reactants). For trivalent lanthanides and actinides (Ln and An,respectively), the thermodynamic data suggest a model in which addition of onemolecule of TBP displaces more than one hydrate molecule:
An(TTA) (H O) An(TTA) (TBP)(H O)
3 2 3
TBP3 2 1 2 → −
An(TTA) (TBP)TBP3 1 3 → − ( . )4 13
This scheme of steps reflects the ability of some metals, like the trivalent actin-ides and lanthanides, to vary their coordination number; since the trivalent Lnand An may go from 9 to 8 and, finally, back to 9. The last step reflects theoperation of the third mechanism proposed for synergism.
Th(TTA)4 can be dissolved in dry benzene without hydrate water. Thevalues of the reaction of Eq. (4.12) in the system are: log K = 5.46, ∆H o = −39.2
Copyright © 2004 by Taylor & Francis Group, LLC

kJ � mol−1, T∆S o = −8.0 kJ � mol−1 � K−1. The negative entropy is understandableas the net degrees of freedom are decreased (two reactant molecules combineto form one product molecule). However, the ∆H o value is much more negative.
These equations do not provide complete definition of the reactions thatmay be of significance in particular solvent extraction systems. For example,HTTA can exist as a keto, an enol, and a keto-hydrate species. The metal com-bines with the enol form, which usually is the dominant one in organic solvents(e.g., K = [HTTA]enol/[HTTA]keto = �6 in wet benzene). The kinetics of the keto→ enol reaction are not fast although it seems to be catalyzed by the presenceof a reagent such as TBP or TOPO. Such reagents react with the enol form indrier solvents but cannot compete with water in wetter ones. HTTA � TBP andTBP � H2O species also are present in these synergistic systems. However, ifextraction into only one solvent (e.g., benzene) is considered, these effects areconstant and need not be considered in a simple analysis.
In section 4.13.3 we return briefly to the thermodynamics of solvent ex-traction.
4.3 OVERVIEW OF EXTRACTION PROCESSES
Many organic substances as well as metal complexes are less extracted fromaqueous solutions into organic solvents than expected from simple considera-tions such as the amount of organic matter in the solute or their solubility inorganic solvents. Such substances are hydrated (see Chapter 3). More basicdonor molecules can replace such water, forming adducts. For the most commonoxygen-containing adduct molecules, the efficiency of the replacement dependson the charge density, also referred to as basicity, of the oxygen atoms. Thesequence in which these donor groups are able to replace each other is
RCHO R CO R O ROH H O (RO) PO
< R R NCOR (2 2 2 3< < < < ≈ ′
′′ ′ ≈ RRO) RPO R PO2 3<
where R stands for organic substituend. In Chapter 3 the basicity was presentedin form of donor number. The larger the difference between the donor numberof water and the adduct former, the larger the adduct formation constant. Oftenthe donor property has to be rather strong, which is the case for many phospho-ryl compounds (like TBP, TBPO, TOPO, etc.), because the concentration ofH2O in the aqueous phase is very large (often >50 M), even though H2O is onlya moderately strong donor.
Table 4.2 gives a survey of the most common extraction processes. Ingeneral, Type I extraction refers to the distribution of nonelectrolytes, without(A) or with adduct former (B). Type II refers to extraction of (mainly organic)acids, Type III to the extraction of metal complexes, and Type IV to the special(but common) use of solvent extraction for evaluation of formation constants
Copyright © 2004 by Taylor & Francis Group, LLC

Table 4.2 Symbolic Survey of Fundamental Liquid-Liquid Distribution Processesa
Type I-A Nonelectrolyte extractionb
Solute A extracted into organic phase (solvent)(Equilibrium governed by the Nernst distribution law)Solute is the nonelectrolyte A in water
A↓↑A
Type I-B Nonelectrolyte adduct formation and extractionc
Adduct AB in organic phase (plus eventually B)
Solute A and adduct former (or extractant) B
B AB(↓↑) ↓↑
A + B ←→ AB
Type II-A Extraction of nonadduct organic acidsAcid and dimer (and possible polymers) in organic phase
Acid dissociation in aqueous phase
HA ←→ H1⁄2H2A2 + . . .
↓↑HA ←→ H+ + A−
Type II-B Extraction of acid as adductAcid adduct (and acid and adduct former) in organic phase
Acid dissociation in aqueous phase
HAB (←→) B (+) HA↓↑ (↓↑) (↓↑)HAB ←→ B + HA ←→ H+ + A−
Type III-B d Extraction of saturated metal complexNeutral, coordinatively saturated metal complex in organic phase
Metal ion Mz+ is complexed by z A− ligands
MAz
↓↑Mz+ + zA− ←→ MAz
Copyright © 2004 by Taylor & Francis Group, LLC

Type III-C Adduct extraction of unsaturated metal complexCoordinatively saturated metal complex in organic phase (and B)
Formation of saturated metal complex trough adduct former Be
B MAzBb
(↓↑) ↓↑Mz− + zA− + bB ←→ MAzBb
Type III-D Liquid anion exchange extractionsOrganic phase with anion exchanger and metal complex
Metal with complexing anions L− and organic amine
RNH+L− (RNH+)pML−n
p
↓↑ ↓↑Mz+ + nL− + pRNH+L− ←→ (RNH+)pML−
np
Type III-E Extraction of ion pairs, and other unusual complexesIon pair C+
1A−2 (and counter species) in organic phase
Aqueous cation C+1 and anion A−
2 associated into ion pair C+1A
−2
C+1A
−2
↓↑C+
1A−1 + C+
2A−2
←→ C+1A
−2 + C+
2A−1
Type IV Hydrophilic complex formation and solvent extractionCoordinatively saturated metal complex in organic phase
Formation of extractable and nonextractable complexes
MAz
↓↑Mz+ + zA− + nX− ←→ MAz + MXn
z−n
aThe organic phase (solvent, diluent) is assumed to be “inert” (shaded area). The aqueous phase (nonshaded area) is unspecified, but maycontain various salting agents, not considered here.bA nonelectrolyte solute is denoted A, an electrolyte solute is assumed to be the cation Mz+ and anion A−, L−, or X−.cThe extractant (or reactant) is denoted A− (from acid HA), or ligand L−, and by B (for adduct).dType III-A (denoted Class A in first edition of this book) is closely related to and covered by Type I-A.eIf B is undissociated HA, the self-adduct MAz(HA)x may be formed.
Copyright © 2004 by Taylor & Francis Group, LLC
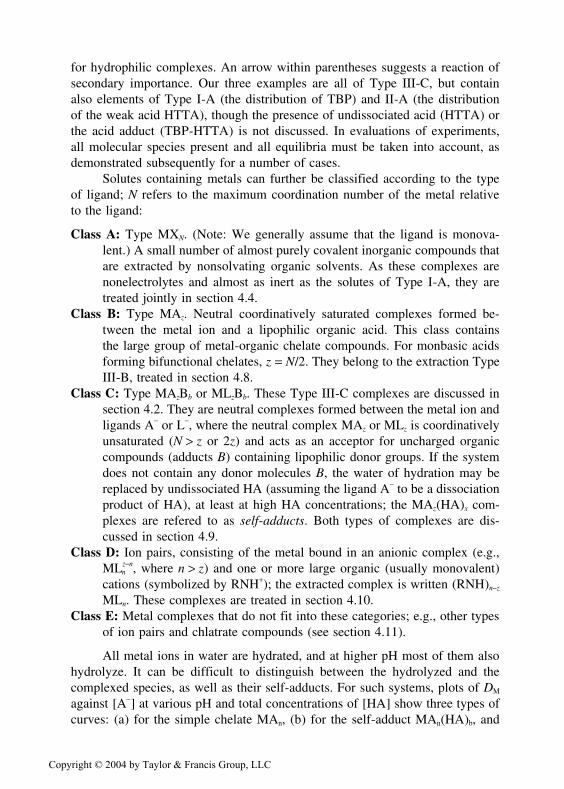
for hydrophilic complexes. An arrow within parentheses suggests a reaction ofsecondary importance. Our three examples are all of Type III-C, but containalso elements of Type I-A (the distribution of TBP) and II-A (the distributionof the weak acid HTTA), though the presence of undissociated acid (HTTA) orthe acid adduct (TBP-HTTA) is not discussed. In evaluations of experiments,all molecular species present and all equilibria must be taken into account, asdemonstrated subsequently for a number of cases.
Solutes containing metals can further be classified according to the typeof ligand; N refers to the maximum coordination number of the metal relativeto the ligand:
Class A: Type MXN. (Note: We generally assume that the ligand is monova-lent.) A small number of almost purely covalent inorganic compounds thatare extracted by nonsolvating organic solvents. As these complexes arenonelectrolytes and almost as inert as the solutes of Type I-A, they aretreated jointly in section 4.4.
Class B: Type MAz. Neutral coordinatively saturated complexes formed be-tween the metal ion and a lipophilic organic acid. This class containsthe large group of metal-organic chelate compounds. For monbasic acidsforming bifunctional chelates, z = N/2. They belong to the extraction TypeIII-B, treated in section 4.8.
Class C: Type MAzBb or MLzBb. These Type III-C complexes are discussed insection 4.2. They are neutral complexes formed between the metal ion andligands A− or L−, where the neutral complex MAz or MLz is coordinativelyunsaturated (N > z or 2z) and acts as an acceptor for uncharged organiccompounds (adducts B) containing lipophilic donor groups. If the systemdoes not contain any donor molecules B, the water of hydration may bereplaced by undissociated HA (assuming the ligand A− to be a dissociationproduct of HA), at least at high HA concentrations; the MAz(HA)x com-plexes are refered to as self-adducts. Both types of complexes are dis-cussed in section 4.9.
Class D: Ion pairs, consisting of the metal bound in an anionic complex (e.g.,MLz
n−n, where n > z) and one or more large organic (usually monovalent)
cations (symbolized by RNH+); the extracted complex is written (RNH)n−z
MLn. These complexes are treated in section 4.10.Class E: Metal complexes that do not fit into these categories; e.g., other types
of ion pairs and chlatrate compounds (see section 4.11).
All metal ions in water are hydrated, and at higher pH most of them alsohydrolyze. It can be difficult to distinguish between the hydrolyzed and thecomplexed species, as well as their self-adducts. For such systems, plots of DM
against [A−] at various pH and total concentrations of [HA] show three types ofcurves: (a) for the simple chelate MAn, (b) for the self-adduct MAn(HA)b, and
Copyright © 2004 by Taylor & Francis Group, LLC
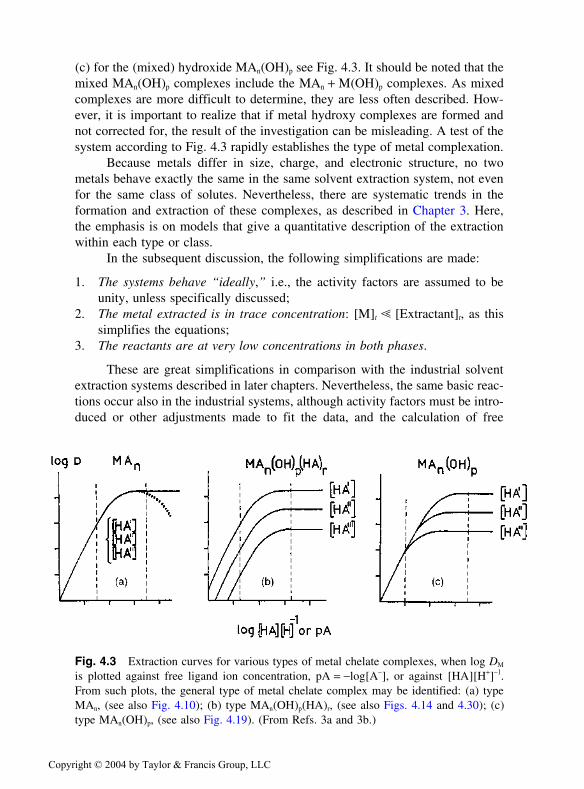
(c) for the (mixed) hydroxide MAn(OH)p see Fig. 4.3. It should be noted that themixed MAn(OH)p complexes include the MAn + M(OH)p complexes. As mixedcomplexes are more difficult to determine, they are less often described. How-ever, it is important to realize that if metal hydroxy complexes are formed andnot corrected for, the result of the investigation can be misleading. A test of thesystem according to Fig. 4.3 rapidly establishes the type of metal complexation.
Because metals differ in size, charge, and electronic structure, no twometals behave exactly the same in the same solvent extraction system, not evenfor the same class of solutes. Nevertheless, there are systematic trends in theformation and extraction of these complexes, as described in Chapter 3. Here,the emphasis is on models that give a quantitative description of the extractionwithin each type or class.
In the subsequent discussion, the following simplifications are made:
1. The systems behave “ideally,” i.e., the activity factors are assumed to beunity, unless specifically discussed;
2. The metal extracted is in trace concentration: [M]t � [Extractant]t, as thissimplifies the equations;
3. The reactants are at very low concentrations in both phases.
These are great simplifications in comparison with the industrial solventextraction systems described in later chapters. Nevertheless, the same basic reac-tions occur also in the industrial systems, although activity factors must be intro-duced or other adjustments made to fit the data, and the calculation of free
Fig. 4.3 Extraction curves for various types of metal chelate complexes, when log DM
is plotted against free ligand ion concentration, pA = −log[A−], or against [HA][H+]−1.From such plots, the general type of metal chelate complex may be identified: (a) typeMAn, (see also Fig. 4.10); (b) type MAn(OH)p(HA)r, (see also Figs. 4.14 and 4.30); (c)type MAn(OH)p, (see also Fig. 4.19). (From Refs. 3a and 3b.)
Copyright © 2004 by Taylor & Francis Group, LLC

ligand concentrations are more complex. Some of these simplifications are notused in later chapters.
4.4 EXTRACTION OF INERT MOLECULES (TYPE I-A)
Here, and in later sections, we begin with same kind of rectangular figure toindicate the type of extraction: to the right we indicate the distribution of thesolutes in a two-phase system (the organic phase is shaded); the system is alsobriefly described by the text to the left, and—of course—in detail in the maintext.
Solute A extracted into organic phase (solvent) A(Nernst distribution law for regular mixtures and solvents:) ↓↑The non-electrolyte solute A in water A
If the solute A does not undergo any reaction in the two solvents, except for thesolubility caused by the “solvation” due to the nonspecific cohesive forces inthe liquids, the distribution of the solute follows the Nernst distribution law, andthe equilibrium reaction can be described either by a distribution constant KD,A,or an (equilibrium) extraction constant Kex:
A(aq) A(org); A A D,A ex org aq→← = =K K [ ] /[ ] ( . )4 14
Kex always refers to a two-phase system. The measured distribution ratio forthe solute A, DA, equals KD,A, and is a constant independent of the concentrationof A in the system. Only “external” conditions influence the KD,A value. In“external” conditions we include the organic solvent, in addition to physicalconditions like temperature and pressure.
The noble gases and the halogens belong to the same type of stable molec-ular compounds: RuO4, OsO4, GeCl4, AsCl3, SbCl3, and HgCl2. The simplestexample is the distribution of the inert gases, as given in Table 4.3. The larger
Table 4.3 Distribution Ratios of Some Gases Between Organic Solventsand 0.01 M NaClO4 at 25°C
SolutePermittivity
Solvent ε Xenon Radon Bromine Iodine
Hexane 1.91 41 80 14.5 36Carbontetrachloride 2.24 35 59 28 86Chloroform 4.90 35 56 37 122Benzene (π-bonds) 2.57 27 55 87 350Nitrobenzene 34.8 14 21 41 178
Source: Ref. 4.
Copyright © 2004 by Taylor & Francis Group, LLC

Rn is extracted more easily than the smaller Xe, because the work to produce acavity in the water structure is larger for the larger molecule. The energy toproduce a cavity in nonpolar solvents is much less, because of the weaker inter-actions between neighboring solvent molecules. Energy is released when thesolute leaves the aqueous phase, allowing the cavity to be filled by the hydro-gen-bonded water structure. Thus the distribution constant increases with in-creasing inertness of the solvent, which is measured by the dielectric constant(or relative permittivity). The halogens Br2 and I2 show an opposite order dueto some low reactivity of halogens with organic solvents. Very inert solventswith low permittivity, such as the pure hydrocarbons, extract inert compoundsbetter than solvents of higher permittivity; conversely, liquids of higher permit-tivity are better solvents for less inert compounds. Molar volumes should beused for accurate comparisons; such data are found in Table 2.1 and in Ref. [6].
In benzene, the distribution constant depends on specific interactions be-tween the solute and the benzene pi-electrons. Table 4.4 shows the importanceof the volume effect for the mercury halide benzene system (Cl<Br<I).
Undissociated fatty acids (HA) behave like inert molecules. Figure 4.4shows the distribution (DHA = KD,HA) between benzene and 0.1 M NaClO4 offatty acids of different alkyl chain lengths (Cn, n = 1 to 5); the distribution con-stant for an acid with chain length n is given by the expression log KD,HA = −2.6+ 0.6n. Similar correlations between KD,HA and molecular size or chain lengthare observed also for other reagents (e.g., normal alcohols).
For organic solutes, not only the size but also the structure is of impor-tance. Table 4.5 gives distribution constants for substituted oxines. When thesubstitution increases the size of the molecule, the distribution constant in-creases. The variations within Table 4.5 and position of the substitution in theoxine molecule reflect structural effects. Table 4.6 shows distribution constantsfor β-diketones. The increasing KD with molecular size for the series acetylace-tone, benzoylacetone, and dibenzoylmethane, reflects the decreasing solubilityin the water phase, mainly governed by the increased energy necessary to over-come the solute-solvent interactions for the larger extractant molecules in water.Thenoyltrifluoroactetone has a greater hydrophilic character than the other β-diketones due to its O− and F− atoms, which interact with the water molecules,
Table 4.4 Distribution Constants for MercuryHalides Between Benzene and 0.5 M NaClO4
Solute Log KD Solute Log KD
HgCl2 −0.96 HgClBr −0.42HgBr2 0.15 HgICl 0.28HgI2 1.79 HgIBr 0.79
Source: Ref. 5.
Copyright © 2004 by Taylor & Francis Group, LLC

Fig. 4.4 Distribution constants KD,HA of fatty acids as a function of the number n ofcarbon atoms in the alkyl chain (C1 is acetic acid) in the system 0.1 M NaClO4/benzene.(From Ref. 7.)
Table 4.5 Dissociation, Ka, and Distribution, KD,HA,Constants for Substituted Oxinesa
Reagent pKa log KD,HA
Oxine 9.7 2.72-Methyloxine 10.0 3.45-Methyloxine 9.9 3.35-Acetyloxine 7.8 2.84,7-Dichlorooxine 7.4 3.97,7-Diiodooxine 8.0 4.25-Chloro-7-iodooxine 7.9 3.9
aAqueous phase 0.1 M NaClO4; organic phase chloroform at25°C.Source: Refs. 8a, b.
Copyright © 2004 by Taylor & Francis Group, LLC
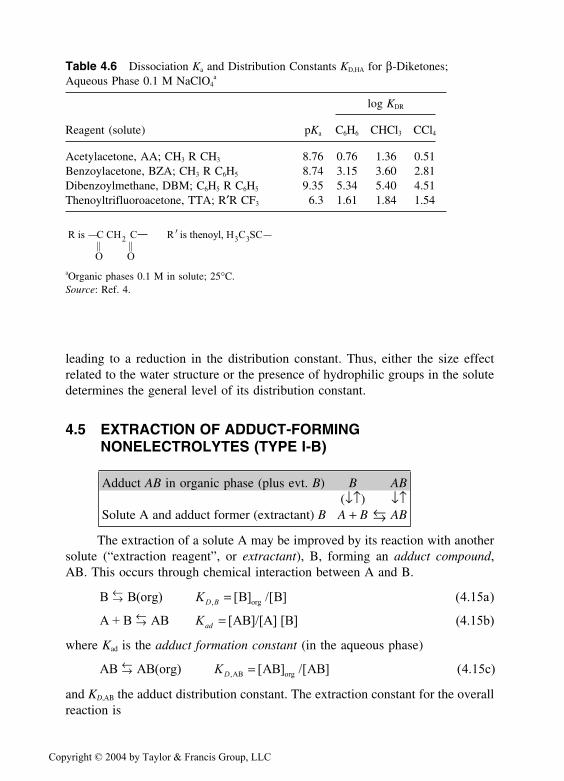
Table 4.6 Dissociation Ka and Distribution Constants KD,HA for β-Diketones;Aqueous Phase 0.1 M NaClO4
a
log KDR
Reagent (solute) pKa C6H6 CHCl3 CCl4
Acetylacetone, AA; CH3 R CH3 8.76 0.76 1.36 0.51Benzoylacetone, BZA; CH3 R C6H5 8.74 3.15 3.60 2.81Dibenzoylmethane, DBM; C6H5 R C6H5 9.35 5.34 5.40 4.51Thenoyltrifluoroacetone, TTA; R′R CF3 6.3 1.61 1.84 1.54
R is C CH C R is thenoyl, H C SC ||
2 3 3 ′ ||
O OaOrganic phases 0.1 M in solute; 25°C.Source: Ref. 4.
leading to a reduction in the distribution constant. Thus, either the size effectrelated to the water structure or the presence of hydrophilic groups in the solutedetermines the general level of its distribution constant.
4.5 EXTRACTION OF ADDUCT-FORMINGNONELECTROLYTES (TYPE I-B)
Adduct AB in organic phase (plus evt. B) B AB(↓↑) ↓↑
Solute A and adduct former (extractant) B A + B ←→ AB
The extraction of a solute A may be improved by its reaction with anothersolute (“extraction reagent”, or extractant), B, forming an adduct compound,AB. This occurs through chemical interaction between A and B.
B B(org) B B a
A + B AB
org→←
→←
=KD B, [ ] /[ ] ( . )4 15
AB]/[A] [B] (4.15b)Kad = [
where Kad is the adduct formation constant (in the aqueous phase)
AB AB(org) AB AB c AB org→← =KD, [ ] /[ ] ( . )4 15
and KD,AB the adduct distribution constant. The extraction constant for the overallreaction is
Copyright © 2004 by Taylor & Francis Group, LLC

A(aq) + B(org) AB(org) AB A B
ex org aq org→← =K [ ] /[ ] [ ]
AB ad= K KD, KKD, ( . )B d4 15
and also
D KA ex orgB e= [ ] ( . )4 15
For the extraction reaction it may suffice to write the reaction of Eq.(4.15d), though it consists of a number of more or less hypothetical steps. Asmentioned, equilibrium studies of this system cannot define the individual steps,but supplementary studies by other techniques may reveal the valid ones. Equa-tion (4.15) indicates that the reaction takes place at the boundary (interface)between the aqueous and organic phases. However, it is common to assume thata small amount of B dissolves in the aqueous phase, and the reaction takes placein the steps
A(aq) B(aq) AB(aq) AB(org)+ → →
These equations allow definition of a distribution constant for the species AB,KD,AB [see Eq. (4.15c)]. Distribution constants can also be defined for each ofthe species A, B and AB (KD,A, etc.) but this is of little interest as the concentra-tion of these species is related through Kex. A large Kex for the system indicatesthat large distribution ratios DA can be obtained in practice. As shown in Eq.(4.15), the concentration of B influences the distribution ratio DA.
Consider first the extraction of hexafluoroacetylacetone (HFA) by TOPOby Example 1, and, second, the extraction of nitric acid by TBP (Example 7).The principles of volume and water-structure effects, discussed for the solute Ain section 4.4, are also important in the distribution of the adducts.
Example 1: Extraction of hexafluoroacetylacetone (HFA) by trioctylphospineoxide (TOPO).
Abbreviating HFA (comp. structure 5e, Appendix D) by HA, and TOPOby B, we can write the relevant reactions
HA(aq) HA(org) HA HAD org→← =K [ ] /[ ]] ( . )
[ ] /
=
+ →←D
K
0 4 16a
HA(org) B(org) HAB(org) = HABad1 org [[ ] [ ] ( . )
[
HA b
HA(org) B(org) HAB (org) = H
org org
2 ad2
B
K
4 16
2+ →← AAB HA c2 org org org
2] /[ ] [ ] ( . )B 4 16
assuming that 2 adducts are formed, HAB and HAB2, the latter containing 2TOPO molecules. Equation (4.16a) denotes the distribution of “uncomplexedHA” by Do. Combining these equations yields
D D K K⋅ − = + +01
1 221 4 16ad adB] B d[ [ ] ( . )
Figure 4.5 shows the relative distribution, log D � D−o
1, of hexafluoroace-tylacetone as a function of the concentration of the adduct former TOPO. HFA
Copyright © 2004 by Taylor & Francis Group, LLC

Fig. 4.5 Relative increase, D/Do in extraction of hexafluoroacetylacetone (HFA) intohexane from 0.1M NaClO4 at pH = 2, at different concentrations of the adduct trioctyl-phosphine oxide (TOPO) in the organic phase. The fitted curve is D/Do = 1 + 104.22
[TOPO]org + 107.51[TOPO]2org. (From Ref. 9.)
is a moderately weak acid, while TOPO associates strongly with hydrogen-bond donors in nonpolar solvents like hexane. The constants were determinedto log Kad1 = 4.22 and log Kad2 = 7.51. Thus even at moderately low TOPOconcentrations, the “dimer adduct” dominates.
4.6 EXTRACTION OF NONADDUCT ORGANIC ACIDS(TYPE II-A)
Acid and dimer (and possibly HA ←→ 1⁄2 H2A2 + . . .
polymers) in organic phase ↓↑Acid dissociation in aqueous phase (H+AH) ←→ HA ←→ H+ + A−
(and protonation)
Tables 4.5–4.7 and Fig. 4.6 list organic acids commonly used as metalextractants. When the acids are not protonated, dissociated, polymerized, hy-drated, nor form adducts, the distribution ratio of the acid HA is constant in agiven solvent extraction system:
HA(aq) HA(org) K HA HA ,HA org HA→← = =D D[ ] /[ ] ( . )4 17
This is shown by the horizontal trends in Fig. 4.6, for which Eq. (4.17) is valid;i.e., the distribution constant KD,HA equals the measured distribution ratio. When
Copyright © 2004 by Taylor & Francis Group, LLC
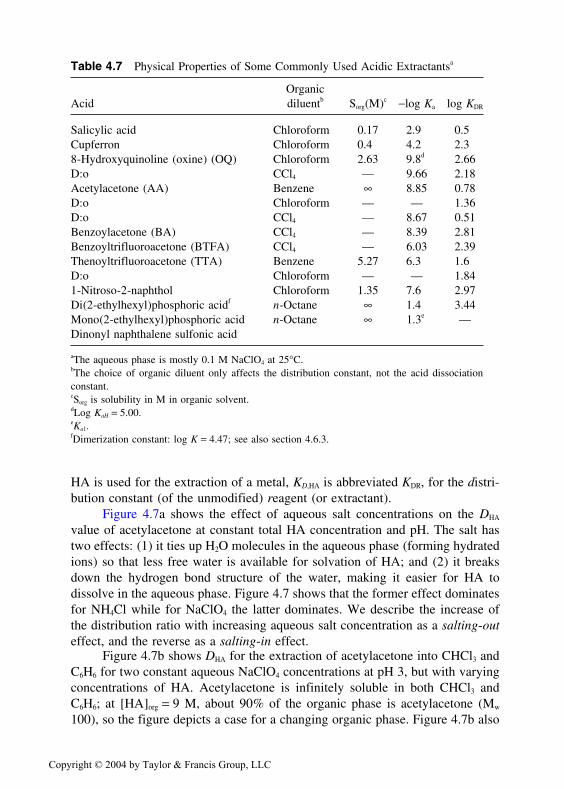
Table 4.7 Physical Properties of Some Commonly Used Acidic Extractantsa
OrganicAcid diluentb Sorg(M)c −log Ka log KDR
Salicylic acid Chloroform 0.17 2.9 0.5Cupferron Chloroform 0.4 4.2 2.38-Hydroxyquinoline (oxine) (OQ) Chloroform 2.63 9.8d 2.66D:o CCl4 — 9.66 2.18Acetylacetone (AA) Benzene ∞ 8.85 0.78D:o Chloroform — — 1.36D:o CCl4 — 8.67 0.51Benzoylacetone (BA) CCl4 — 8.39 2.81Benzoyltrifluoroacetone (BTFA) CCl4 — 6.03 2.39Thenoyltrifluoroacetone (TTA) Benzene 5.27 6.3 1.6D:o Chloroform — — 1.841-Nitroso-2-naphthol Chloroform 1.35 7.6 2.97Di(2-ethylhexyl)phosphoric acidf n-Octane ∞ 1.4 3.44Mono(2-ethylhexyl)phosphoric acid n-Octane ∞ 1.3e —Dinonyl naphthalene sulfonic acid
aThe aqueous phase is mostly 0.1 M NaClO4 at 25°C.bThe choice of organic diluent only affects the distribution constant, not the acid dissociationconstant.cSorg is solubility in M in organic solvent.dLog KaH = 5.00.eKa1.fDimerization constant: log K = 4.47; see also section 4.6.3.
HA is used for the extraction of a metal, KD,HA is abbreviated KDR, for the distri-bution constant (of the unmodified) reagent (or extractant).
Figure 4.7a shows the effect of aqueous salt concentrations on the DHA
value of acetylacetone at constant total HA concentration and pH. The salt hastwo effects: (1) it ties up H2O molecules in the aqueous phase (forming hydratedions) so that less free water is available for solvation of HA; and (2) it breaksdown the hydrogen bond structure of the water, making it easier for HA todissolve in the aqueous phase. Figure 4.7 shows that the former effect dominatesfor NH4Cl while for NaClO4 the latter dominates. We describe the increase ofthe distribution ratio with increasing aqueous salt concentration as a salting-outeffect, and the reverse as a salting-in effect.
Figure 4.7b shows DHA for the extraction of acetylacetone into CHCl3 andC6H6 for two constant aqueous NaClO4 concentrations at pH 3, but with varyingconcentrations of HA. Acetylacetone is infinitely soluble in both CHCl3 andC6H6; at [HA]org = 9 M, about 90% of the organic phase is acetylacetone (Mw
100), so the figure depicts a case for a changing organic phase. Figure 4.7b also
Copyright © 2004 by Taylor & Francis Group, LLC

Fig. 4.6 Distribution ratios calculated by Eq. (4.22) for acetylacetone (HAA); benzoyl-acetone (HBA); bezoyltrifluoroacetone (HBTFA); and oxine (8-hydroxyquinoline,HOQ), in the system 0.1 M NaClO4 /CCl4, using the following constants. (From Refs.8a, b.)
HAA HBA HBTFA HOQ
log KD 0.51 2.81 2.39 2.18log Ka 8.67 8.39 6.03 9.66log KaH — — — 5.00
indicates different interactions between the acetylacetone and the two solvents.It is assumed that the polar CHCl3 interacts with HA, making it more soluble inthe organic phase; it is also understandable why the distribution of HA decreaseswith decreasing concentration (mole fraction) of CHCl3. C6H6 and aromatic sol-vents do not behave as do most aliphatic solvents: in some cases the aromaticsseem to be inert or even antagonistic to the extracted organic species, while inother cases their pi-electrons interact in a favorable way with the solute. Foracetylacetone, the interaction seems to be very weak. The salting-in effect isshown both in Figs. 4.7a. and 4.7b.
4.6.1 Dissociation
Acids dissociate in the aqueous phase with a dissociation constant Ka
Copyright © 2004 by Taylor & Francis Group, LLC

Copyright © 2004 by Taylor & Francis Group, LLC
HA H A H A HA+a
+→← + =− −K [ ][ ] /[ ] ( . )4 18
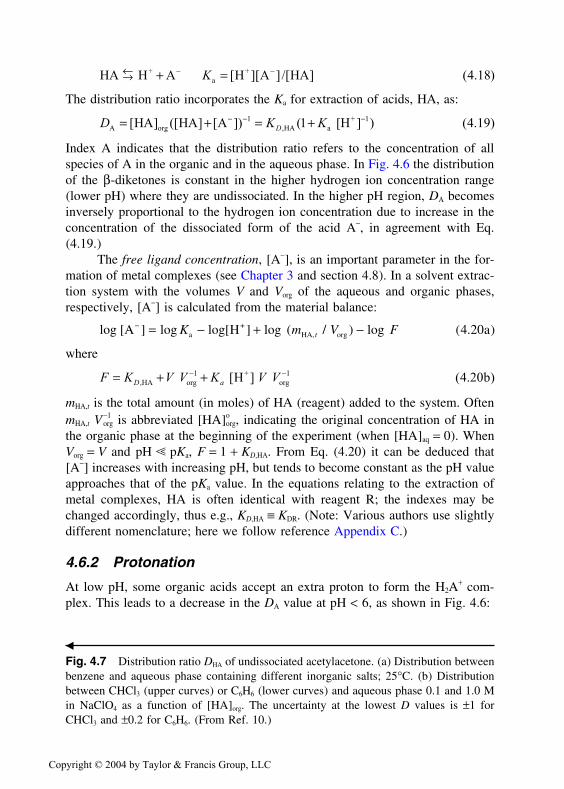
The distribution ratio incorporates the Ka for extraction of acids, HA, as:
D K KDA org HA a+HA HA A [H= + = +− − −[ ] ([ ] [ ]) ( ] ) ( . ),
1 11 4 19
Index A indicates that the distribution ratio refers to the concentration of allspecies of A in the organic and in the aqueous phase. In Fig. 4.6 the distributionof the β-diketones is constant in the higher hydrogen ion concentration range(lower pH) where they are undissociated. In the higher pH region, DA becomesinversely proportional to the hydrogen ion concentration due to increase in theconcentration of the dissociated form of the acid A−, in agreement with Eq.(4.19.)
The free ligand concentration, [A−], is an important parameter in the for-mation of metal complexes (see Chapter 3 and section 4.8). In a solvent extrac-tion system with the volumes V and Vorg of the aqueous and organic phases,respectively, [A−] is calculated from the material balance:
log [A ] H ( aa+
HA, org− = − + −log log[ ] log / ) log ( . )K m V Ft 4 20
where
F K V V K V VD a= + +− −,HA org
+org H b1 1 4 20[ ] ( . )
mHA,t is the total amount (in moles) of HA (reagent) added to the system. OftenmHA,t V−1
org is abbreviated [HA]oorg, indicating the original concentration of HA in
the organic phase at the beginning of the experiment (when [HA]aq = 0). WhenVorg = V and pH � pKa, F = 1 + KD,HA. From Eq. (4.20) it can be deduced that[A−] increases with increasing pH, but tends to become constant as the pH valueapproaches that of the pKa value. In the equations relating to the extraction ofmetal complexes, HA is often identical with reagent R; the indexes may bechanged accordingly, thus e.g., KD,HA ≡ KDR. (Note: Various authors use slightlydifferent nomenclature; here we follow reference Appendix C.)
4.6.2 Protonation
At low pH, some organic acids accept an extra proton to form the H2A+ com-
plex. This leads to a decrease in the DA value at pH < 6, as shown in Fig. 4.6:
�
Fig. 4.7 Distribution ratio DHA of undissociated acetylacetone. (a) Distribution betweenbenzene and aqueous phase containing different inorganic salts; 25°C. (b) Distributionbetween CHCl3 (upper curves) or C6H6 (lower curves) and aqueous phase 0.1 and 1.0 Min NaClO4 as a function of [HA]org. The uncertainty at the lowest D values is ±1 forCHCl3 and ±0.2 for C6H6. (From Ref. 10.)
Copyright © 2004 by Taylor & Francis Group, LLC

HA H H A HA H H A+2
+aH
+2
++ =→← K [ ][ ] /[ ] ( . )4 21
Because H2A+ is ionic, it is not extracted into the organic phase, and thus the
distribution ratio becomes
D
K K
A org 2+
D,HA aH+
HA] H A HA] A
= [H
= + +
+
− −
−
[ ([ ] [ [ ])
( ]
1
1 11 4 221 1+ − −Ka+H[ ] ) ( . )
as illustrated in Fig. 4.6 for oxine.
4.6.3 Dimerization
Figure 2.1 illustrates a number of orientations by which two linear acids mayform a dimer. The partial neutralization of the hydrophilic groups leads to in-creased solubility of the acid in the organic solvent, but is not observed in theaqueous phase. The dimerization can be written as:
2HA(org) H A (org) H A ] /[HA]2 2 di 2 2 org org2→← =K [ ( . )4 23
The distribution ratio for the extraction of the acid becomes:
D
K KD
A org 2 2 org
,HA d
HA] [H A ] )([HA] A
=
= + +
+
− −([ [ ])
(
2
1 2
1
ii ,HA aq a HA] (1 [H]K KD [ ) ( . )+ − −1 1 4 24
The last term can be expressed in several different ways. Because the distribu-tion ratio DA reflects the analytical concentration of A in the organic phase, thedimer concentration is given as 2[H2A2], although it is a single species (onemolecule). Figure 4.8 illustrates how the dimerization leads to an increase ofacid distribution ratio with increasing aqueous acid concentration. For propionicacid logKa = −4.87, logKD,HA = −1.90 and logKdi = 3.14 in the system. The ex-traction increases as the size of the acid increases. A dimeric acid may formmonobasic complexes with metal ions, as is illustrated by the formulas in Ap-pendix D:14 b–d, for the M(H(DEHP)2)3 and UO2((DEHP)2)2 complexes. Thesituation may be rather complex. For example, at very low concentrations ininert solvents, dialkylphosphates (RO)2POOH act as a monbasic acid, but atconcentrations >0.05 M they polymerize, while still acting as monobasic acids(i.e., like a cation exchanger). The degree of dimerization/polymerization de-pends on the polarity of the solvent [11b].
4.6.4 Hydration
In solvent extraction, the organic phase is always saturated with water, and theorganic extractant may become hydrated. In the extraction of benzoic acid, HBz(Appendix D:2), it was found that the organic phase contained four different
Copyright © 2004 by Taylor & Francis Group, LLC
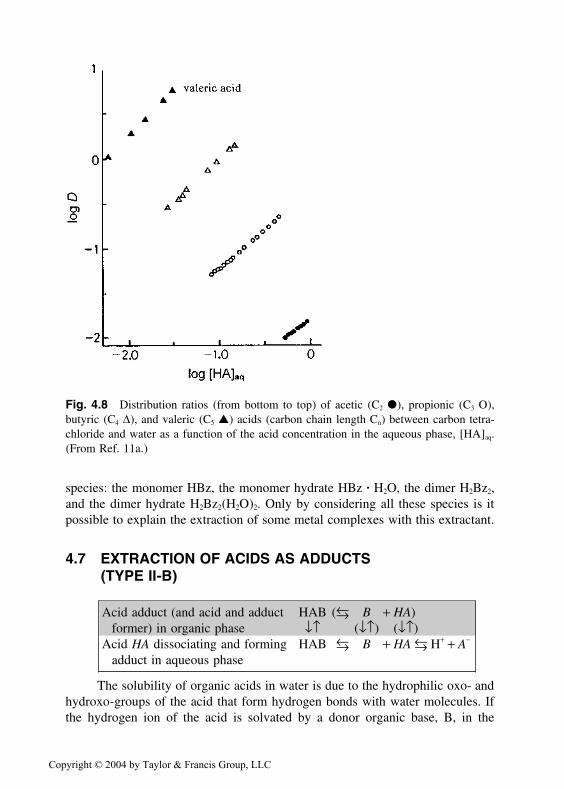
Fig. 4.8 Distribution ratios (from bottom to top) of acetic (C2 ●), propionic (C3 O),butyric (C4 ∆), and valeric (C5 ▲) acids (carbon chain length Cn) between carbon tetra-chloride and water as a function of the acid concentration in the aqueous phase, [HA]aq.(From Ref. 11a.)
species: the monomer HBz, the monomer hydrate HBz � H2O, the dimer H2Bz2,and the dimer hydrate H2Bz2(H2O)2. Only by considering all these species is itpossible to explain the extraction of some metal complexes with this extractant.
4.7 EXTRACTION OF ACIDS AS ADDUCTS(TYPE II-B)
Acid adduct (and acid and adduct HAB (←→ B + HA)former) in organic phase ↓↑ (↓↑) (↓↑)
Acid HA dissociating and forming HAB ←→ B + HA ←→ H+ + A−
adduct in aqueous phase
The solubility of organic acids in water is due to the hydrophilic oxo- andhydroxo-groups of the acid that form hydrogen bonds with water molecules. Ifthe hydrogen ion of the acid is solvated by a donor organic base, B, in the
Copyright © 2004 by Taylor & Francis Group, LLC

organic phase, the adduct B–HA is likely to have much greater solubility in theorganic phase.
4.7.1 Weak (Organic) Acids, HA
In extraction of weak organic acids (abbreviated HA) from acidic aqueous solu-tions, the concentration of undissociated acid, HA, exceeds the concentration ofits dissociated anions, A−, as long as pKa > pH. The acid may then act as adduct-forming nonelectrolyte; see section 4.5 and Example 1.
4.7.2 Strong (Inorganic) Acids, HL
To avoid confusion with weak organic acids, strong inorganic acids are denotedby HL. Most strong acids are completely dissociated and both cations andanions are hydrated in aqueous solutions even at pHs as low as 0. The hydrationmakes them lipophobic and almost insoluble in inert organic solvents. The hy-drogen ion is a Lewis acid (Chapter 3) and is solvated by strong organic (donoror base) molecules, such as those in Table 4.8 (e.g., alcohols, ethers, ketones,esters, amines, phosphoryls, etc.). This results in greater lipophilicity, and theacid becomes more soluble in inert organic solvents. The structure of these“solvated hydrogen salts” is not well known, but may be represented symboli-cally by HB+
b L−, where B refers to the adduct former or the solvating solvent; bmay have a value of 1–4.
The order of extractability changes with aqueous acidity, but in generalfollows the order HClO4 � HNO3 > HI > HBr > HCl > H2SO4 (see Table 4.8).Since the hydration energies of the acids follow the opposite order, dehydrationis an essential step in the solvent extraction process. This order of acids has apractical significance: acids higher can be replaced by the acids lower in thesequence; e.g., HF and HNO3 are extracted from acidic stainless steel picklingwaste solutions into kerosene by addition of H2SO4 (see Chapter 14 of this book).
The extraction of most acids is accompanied by extraction of water. Inthe extraction of HNO3 by TBP into kerosene, many different species have beenidentified, several of which involve hydration. The ratio of acid:adduct is notvery predictable. For example, HClO4 apparently is extracted into kerosene with1–2 molecules of TBP, HCl into ethylether with one molecule of ethylether,etc. Also, the extracted acid may dimerize in the organic solvent, etc. Example2 illustrates the complexity of the extraction of HNO3 by TBP into kerosene.
Assuming that B is almost insoluble in the aqueous phase, the equilibriumreaction can be written in two ways:1. The interface extraction model assumes that HA reacts with B at the interface.Thus
HA(aq) bB(org) HAB (org) a+ →← b ( . )4 25
Copyright © 2004 by Taylor & Francis Group, LLC

Table 4.8 Basicity (Electron Pair-Donating Tendency) of Some Ionsand Molecules (R is an alkyl or aryl group)
Basicity of some common anionsrelative to the (hard type) actinide cationsClO−
4 < I− < Br− < Cl− < NO−3 < SCN− < acetate− < F−
Basicity of some organic moleculesAmine compounds R3N
a < R2NHb < RNH2c < NH3
Arsine compounds R3AsPhosphine compounds R3P
Oxo-compounds � PhosphorylsArsenylsCarbonylsSulfurylsNitrosyls
(RO)3POd < R′(RO)2POe < R2′(RO)POf < R3′POg
R3AsOh
RCHO < R2CO (≤R2O < ROH < H2O)i
(RO)2SO2j < R2SO2
k < (RO)2SOl < R2SOm
RNO2n < RNOo
Substitutions causing basicity decrease of oxo compounds(CH3)2CH— < CH3(CH2)n— < CH3— < CH3O— < ClCH2—
a–cTertiary, secondary, and primary amines.dtri-R phosphate.edi-R-R′ phosphonate.fR-di-R′ phosphinate.gtri-R′ phosphine oxide.harsine oxide.iether and hydroxo compounds.jsulfates.ksulfones.lsulfites.msulfoxides.nnitro compounds.onitroso compounds.Source: Ref. 12.
Since [HA]aq and [B]org are easily measurable quantities, it is common to definethe extraction constant Kex for this model:
K bex org orgb[HAB ] [HA] [B] b= − −1 4 25( . )
2. The organic phase reaction model assumes all reactions take place in theorganic phase. Thus one assumes
HA(org) bB(org) HAB (org) a + →← b ( . )4 26
The equilibrium constant for this reaction is
K bb
ad,bB org org orgHAB ] [HA] [B] b= − −[ ( . )1 4 26
Copyright © 2004 by Taylor & Francis Group, LLC

Rydberg_5063-2_Ch05_R3_02-09-04 11:29:21
where Kad,bB is the (organic phase) adduct formation constant. The distributionratio of the acid in this system becomes
HA] HAB ] HA] A
=
A org org
,HA a
D
K K
b
D
= + +
+
− −([ [ )([ [ ]
(
1
1 Σ dd,bB org a+B] H c[ ) /( [ ]) ( . )b K1 4 26+
Equation (4.25b) becomes identical to Eq. (4.26b) if Kex is replaced by KD,HA
Kad,bB. Equilibrium measurements do not allow a decision between the two reac-tion paths.
Example 2: Extraction of nitric acid by pure TBP.Many metals can be extracted from nitrate solutions by TBP. In those
systems it is important to account for the HNO3-TBP interactions. The next setof equations were derived by [13] and are believed to be valid for the extrac-tion of HNO3 at various nitrate concentrations into 30% TBP in kerosene. Ab-breviating HNO3 as HL, and TBP as B, and including hydration for all specieswithout specification, one derives1. The formation of an acid monoadduct:
H L B(org) HLB(org) a+ + +− →← ( . )4 27
For simplicity, we write the adduct HLB, instead of HB+L−. The extractionconstant is
Kex1 org orgHLB] [H] L] [B] b= − − −[ [ ( . )1 1 1 4 27
2. The formation of a diacid monoadduct:
2 H L B(org) (HL) B(org) a
HL) B] H]
+
2
ex2 2 org
+ + →←
=
−
−
2 4 28( . )
[( [K 22 2 1 4 28 [L] [B] borg
− − ( . )
3. Ion pair association:
H L H L a
H ] [L ]/[H L b
+ +
ass
+ +
+ →←
=
− −
− −
( . )
[ ] ( . )
4 29
4 29K
This reaction only occurs under strong acid conditions, and the equilibriumconstant may be <1.4. The distribution of nitric acid is then given by
DNO3 org 2 org
+HLB] HL) B] . . L H L ])= + + +− − −([ [( . )([ ] [ ( . )2 4 301
5. Furthermore, the dimerization of TBP in the organic phase must be takeninto account:
2 B B a
B B] b
2
di 2 org org
→←
=
( . )
[ ] /[ ( . )
4 31
4 312K
yielding the total concentration of TBP in the organic phase
[ [ ( . )TBP] [B] B]org, org di org
2
t K= + 2 4 32
Copyright © 2004 by Taylor & Francis Group, LLC

Rydberg_5063-2_Ch05_R3_02-09-04 11:29:21
6. The distribution ratio in terms of only [H+] and monomeric [B]org can thenbe expressed by
D K K KNO3 ass org ex1 ex2
+ [B] [H= +−1 22 4 33( ] ) ( . )
In this equation it is assumed [H+]=[L−] (electroneutrality in the aqueousphase). Equation (4.33) has been tested, and the results agreed with >2300experiments under varying conditions, see Fig. 4.9. The example illustrates therather complicated situation that may occur even in such “simple” systems asthe extraction of HNO3 by TBP.
4.8 EXTRACTION OF COORDINATIVELYSATURATED METAL CHELATE TYPECOMPLEXES (TYPE III-B)
Neutral, coordinatively saturated metal complex MAz
in organic phase ↓↑Metal ion Mz+ is complexed by z A− ligands to Mz+ + zA− ←→ MAz
form neutral MAz
Fig. 4.9 Test of the equations in Example 2 for extraction of 0.01–0.5 M nitric acidwith 30% TBP in kerosene at temperatures 20–60oC. (From Ref. 13.)
Copyright © 2004 by Taylor & Francis Group, LLC
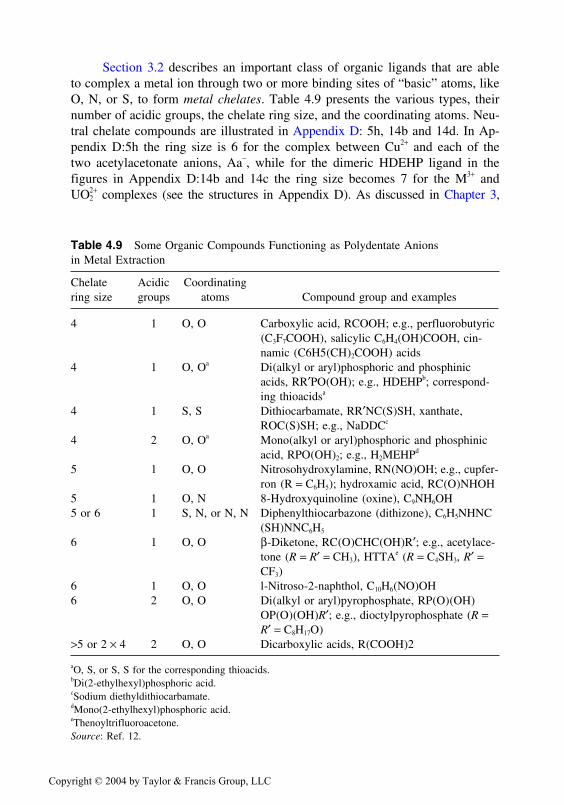
Section 3.2 describes an important class of organic ligands that are ableto complex a metal ion through two or more binding sites of “basic” atoms, likeO, N, or S, to form metal chelates. Table 4.9 presents the various types, theirnumber of acidic groups, the chelate ring size, and the coordinating atoms. Neu-tral chelate compounds are illustrated in Appendix D: 5h, 14b and 14d. In Ap-pendix D:5h the ring size is 6 for the complex between Cu2+ and each of thetwo acetylacetonate anions, Aa−, while for the dimeric HDEHP ligand in thefigures in Appendix D:14b and 14c the ring size becomes 7 for the M3+ andUO2
2+ complexes (see the structures in Appendix D). As discussed in Chapter 3,
Table 4.9 Some Organic Compounds Functioning as Polydentate Anionsin Metal Extraction
Chelate Acidic Coordinatingring size groups atoms Compound group and examples
4 1 O, O Carboxylic acid, RCOOH; e.g., perfluorobutyric(C3F7COOH), salicylic C6H4(OH)COOH, cin-namic (C6H5(CH)2COOH) acids
4 1 O, Oa Di(alkyl or aryl)phosphoric and phosphinicacids, RR′PO(OH); e.g., HDEHPb; correspond-ing thioacidsa
4 1 S, S Dithiocarbamate, RR′NC(S)SH, xanthate,ROC(S)SH; e.g., NaDDCc
4 2 O, Oa Mono(alkyl or aryl)phosphoric and phosphinicacid, RPO(OH)2; e.g., H2MEHPd
5 1 O, O Nitrosohydroxylamine, RN(NO)OH; e.g., cupfer-ron (R = C6H5); hydroxamic acid, RC(O)NHOH
5 1 O, N 8-Hydroxyquinoline (oxine), C9NH6OH5 or 6 1 S, N, or N, N Diphenylthiocarbazone (dithizone), C6H5NHNC
(SH)NNC6H5
6 1 O, O β-Diketone, RC(O)CHC(OH)R′; e.g., acetylace-tone (R = R′ = CH3), HTTAe (R = C4SH3, R′ =CF3)
6 1 O, O l-Nitroso-2-naphthol, C10H6(NO)OH6 2 O, O Di(alkyl or aryl)pyrophosphate, RP(O)(OH)
OP(O)(OH)R′; e.g., dioctylpyrophosphate (R =R′ = C8H17O)
>5 or 2 × 4 2 O, O Dicarboxylic acids, R(COOH)2
aO, S, or S, S for the corresponding thioacids.bDi(2-ethylhexyl)phosphoric acid.cSodium diethyldithiocarbamate.dMono(2-ethylhexyl)phosphoric acid.eThenoyltrifluoroacetone.Source: Ref. 12.
Copyright © 2004 by Taylor & Francis Group, LLC
chelation provides extra stability to the metal complex. The formation and extrac-tion of metal chelates are discussed extensively also in references [14–16].
In Chapter 3 we described how an uncharged metal complex MAz isformed from a metal ion Mz+ (central atom) through a stepwise reaction withthe anion A− (ligand ) of a monobasic organic acid, HA, defining a stepwiseformation constant kn, and an overall formation constant βn, where
βn n+MA M A= − −[ ] /[ ][ ] ( . )z n z n 4 34
The MAz complex is lipophilic and dissolves in organic solvents and the distri-bution constant KDC is defined (index C for complex):
KDC z org zMA MA= [ ] /[ ] ( . )4 35
Taking all metal species in the aqueous phase into account, the distributionof the metal can be written (omitting the index aq for water)
DK
z n
z
zMz org
n
DC z
z
[MA
[MA
A
A = =−
−
−
]
]
[ ]
[ ]( . )
Σ Σβ
β4 36
The distribution ratio depends only on the free ligand concentration, whichmay be calculated by Eq. (4.20). Most coordinatively saturated neutral metalcomplexes behave just like stable organic solutes, because their outer molecularstructure is almost entirely of the hydrocarbon type, and can therefore be ex-tracted by all solvent classes 2–5 of Chapter 2. The rules for the size of thedistribution constants of these coordinatively saturated neutral metal complexesare then in principle the same as for the inert organic solutes of section 4.4.However, such complexes may still be amphilic due to the presence of electro-negative donor oxygen atoms (of the chelating ligand) in the chelate molecule.In aqueous solution such complexes then behave like polyethers rather thanhydrocarbons. Narbutt [17] has studied such outer-sphere hydrated complexesand shown that the dehydration in the transfer of the complex from water to theorganic solvent determines the distribution constant of the complex. This isfurther elaborated in Chapter 16.
Example 3: Extraction of Cu(II) by acetylacetone.Simple β-diketones, like acetylacetone (Appendix D: 5d) can coordinate
in two ways to a metal atom, either in the uncharged keto form (through twoketo oxygens), or in dissociated anionic enol form (through the same oxygens)as shown in Appendix D: 5c, 5h. It acts as an acid only in the enolic form.Figure 4.10 shows the extraction of Cu(II) from 1 M NaClO4 into benzene atvarious concentrations of the extractant acetylacetone (HA) [18]. Acetylace-tone reacts with Cu(II) in aqueous solutions to form the complexes CuA+ andCuA2. Because acetylacetone binds through two oxygens, the neutral complexCuA2 contains two six-membered chelate rings; thus four coordination posi-tions are taken up, forming a planar complex (Appendix D: 5f). This complexis usually considered to be coordinatively saturated, but two additional very
Copyright © 2004 by Taylor & Francis Group, LLC

Fig. 4.10 Extraction of Cu(II) from 1 M NaClO4 into benzene as a function of pH(large figure) and of free acetylacetonate ion concentration (insert) at seven differenttotal concentrations of acetylacetone ([HA]aq 0.05–0.0009 M). (From Ref. 18.)
weak bonds can be formed perpendicular to the plane; we can neglect themhere.
The distribution of copper, DCu, between the organic phase and water isthen described by
DCu
2 org
2+ +
2
[CuA
[Cu CuA CuA =
+ +]
] [ ] [ ]( . )4 37
One then derives
DK K
CuDC 2 DC 2
n
n
[A [A A
A A
=+ +
=−
− −
−
−
ββ β
ββ
]] [ ]
[ ][ ]
( .2
1 2
2
2
14 3
Σ88)
where KDC refers to the distribution constant of the uncharged complex CuA2.In Eq. (4.37), log D is a function of [A−], the free ligand concentration,
only, and some constants. In Fig. 4.10, log Dcu is plotted vs. log [H+] (= −pH).Through Eqs. (4.17) and (4.18) it can be shown that log DCu is a function ofpH only at constant [HA]org (or [HA]aq), while at constant pH the log DCu de-pends only on [HA]org (or [HA]aq).
Copyright © 2004 by Taylor & Francis Group, LLC

In the insert of Fig. 4.10, log D is plotted as a function of log [A−],where [A−] has been calculated from pH, [HA]0
org, phase volumes, and Ka andKDR (same as KD,HA) for HA by means of Eq. (4.20); it is found that all curvescoincide into one at high pH (high [A−]), as expected from Eq. (4.38). Thedistribution curve approaches two asymptotes, one with a slope of 2 and onehorizontal (zero slope). From Eq. (4.38) it follows that, at the lowest [A−]concentration (lowest pH), the concentration of CuA+ and CuA2 in the aqueousphase becomes very small; Eq. (4.38) is then reduced to
lim [ ] /[ ] [ ] ( . )[ ]A
Cu 2 org
2+
DC 2CuA Cu A− →
−= =0
2 4 39D K β
At the highest A− concentrations a horizontal asymptote is approached:
lim [ ] /[ ] ( . )[ ]A
Cu 2 org 2 DCCuA CuA− →∞
= =D K 4 40
The horizontal asymptote equals the distribution constant of CuA2, i.e., KDC.From the curvature between the two asymptotes, the stability constants β1 andβ2 can be calculated.
This example indicates that in solvent extraction of metal complexes withacidic ligands, it can be more advantageous to plot log D vs. log[A−], ratherthan against pH, which is the more common (and easy) technique.
In order to calculate DM from Eq. (4.36), several equilibrium constants aswell as the concentration of free A− are needed. Though many reference worksreport stability constants [19, 20] and distribution constants [4, 21], for practicalpurposes it is simpler to use the extraction constant Kex for the reaction
M (aq) zHA(org) MA org) zH (aq) az+z
++ +→← ( ( . )4 41
in which case the MAzn-n complexes in the aqueous phase are neglected. The
relevant extraction equations are
Kex z org+ z z+
orgzMA ] [H ] [M ] [HA] b= − −[ ( . )1 4 41
and
D KMz= −
ex orgz +HA] [H c[ ] ( . )4 41
Thus only one constant, Kex, is needed to predict the metal extraction for givenconcentrations [H+] and [HA]org. Tables of Kex values are found in the literature(see references given).
Equation (4.41) is valid only when the complexes MAnz−n can be neglected
in the aqueous phase. Comparing Eqs. (4.37b) and (4.41c), it is seen that nohorizontal asymptote is obtained even at high concentrations of A−, or HA andH. Thus, for very large distribution constant of the uncharged complex (i.e.,�1000) a straight line with slope −z is experimentally observed, as in the casefor the Cu(II)-thenoyltrifluoroacetone (HTTA) system (Appendix D: 5g).
Copyright © 2004 by Taylor & Francis Group, LLC
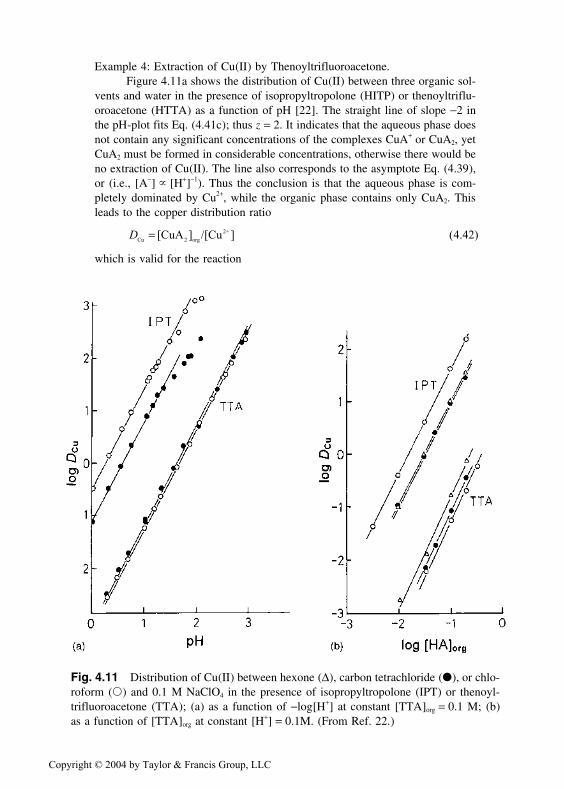
Example 4: Extraction of Cu(II) by Thenoyltrifluoroacetone.Figure 4.11a shows the distribution of Cu(II) between three organic sol-
vents and water in the presence of isopropyltropolone (HITP) or thenoyltriflu-oroacetone (HTTA) as a function of pH [22]. The straight line of slope −2 inthe pH-plot fits Eq. (4.41c); thus z = 2. It indicates that the aqueous phase doesnot contain any significant concentrations of the complexes CuA+ or CuA2, yetCuA2 must be formed in considerable concentrations, otherwise there would beno extraction of Cu(II). The line also corresponds to the asymptote Eq. (4.39),or (i.e., [A−] � [H+]−1). Thus the conclusion is that the aqueous phase is com-pletely dominated by Cu2+, while the organic phase contains only CuA2. Thisleads to the copper distribution ratio
DCu 2 org
2+[CuA ] /[Cu ] = ( . )4 42
which is valid for the reaction
Fig. 4.11 Distribution of Cu(II) between hexone (∆), carbon tetrachloride (●), or chlo-roform (�) and 0.1 M NaClO4 in the presence of isopropyltropolone (IPT) or thenoyl-trifluoroacetone (TTA); (a) as a function of −log[H+] at constant [TTA]org = 0.1 M; (b)as a function of [TTA]org at constant [H+] = 0.1M. (From Ref. 22.)
Copyright © 2004 by Taylor & Francis Group, LLC

Cu HA(org) CuA (org) H a2+
2
+ + +→←2 2 4 43( . )
The extraction constant is
Kex 2 org
+ 2+
org
2CuA [H Cu [HA] b= [ ] ] /[ ] ( . )2 4 43
and combining with Eq. (4.42)
D KCu ex org
2 + [HA] [H= −] ( . )2 4 44
From Eq. (4.44) a plot of log D against −log[H+] should yield a straightline with slope +2, as in Fig. 4.11a, and a plot against log [HA]org as in Fig. 4.11bshould also yield a straight line with slope +2. Continued in Example 14.
This example illustrates a case of considerable analytical importance, es-pecially for the determination of complex formation constants for hydrophiliccomplexes, as discussed in section 4.12, when the equilibrium constants forthe stepwise metal-organic complexes are of secondary interest. Kex values aretabulated in several reference works. Kex is a conditional constant and only validprovided no other species are formed besides the extracted one.
The distribution constant of the neutral complex MAz, KDC, has been re-ferred to several times. In favorable cases, when both the organic and the aque-ous phases are dominated by the same uncharged complex over a larger concen-tration region, KDC can be directly measured, as is the case for most of the datain Table 4.10 [22–23b]. Otherwise KDC can be estimated or calculated from Kex
data combined with βn, Ka, and KDR [see Eqs. (4.8) and (4.46)].
4.9 EXTRACTION OF METAL COMPLEXESAS ADDUCTS (TYPE III-C)
Coordinatively saturated metal adduct B MAzBb
complex in organic phase (and B) (↓↑) ↓↑Formation neutral complex cordinatively Mz+ + zA− + bB ←→ MAzBb
saturated by adduct former B
If the neutral metal complex is coordinatively unsaturated, it forms MAz
(H2O)x in the aqueous phase, where 2z + x (A being bidentate) equals the maxi-mum coordination number. In the absence of solvating organic solvents, this com-plex has a very low distribution constant. Obviously, if water of hydration can bereplaced by organic molecules B, the result is a more lipophilic adduct complexMAzBb; many adduct formers are listed in Appendix D and several tables. De-pending on the ligand, several types of such adducts exist: (i) type MAzBb, whereA and B are different organic structures; (ii) type MXzBb, where MXz is a neutralinorganic compound (salt); and (iii) type MAz(HA)b, where A and HA are thebasic and neutral variant of the same molecule (so-called self-adducts).
Copyright © 2004 by Taylor & Francis Group, LLC

Table 4.10 Distribution Constants for Acetylacetone (HA) and Some MetalAcetylacetonates Between Various Organic Solvents and 1 M NaClO4 at 25°C
log KDC
ε log KDR
Organic solventa Solvent HA ZnA2 CuA2 NpA4
n-Hexane (1) 1.88 −0.022 −1.57 — 0.5Cyclohexane (3) 2.02 0.013 −1.16 −0.04 0.8Carbon tetrachloride (4) 2.24 0.52 −0.39 0.85 2.7Mesityleneb (6) 2.28 0.44 — 0.43 —Xylene (7) 2.27 0.57 −0.47 0.80 —Toluene (8) 2.38 0.66 −0.37 0.85 —Benzene (9) 2.28 0.77 −0.21 1.04 3.3Dibutylether (2) 3.06 — −1.05 — —Methylisobutylketone (5) 13.1 0.77 −0.15 0.61 —Chloroform (10) 4.9 1.38 0.83 2.54 —Benzonitrile (11) 25.2 0.21 — —
aNumbers in parentheses refer to Figs. 4.23 and 4.26.b1,3,5-trimethylbenzene.Source: Refs. 22–23.
4.9.1 Metal-Organic Complexes with Organic AdductFormers, Type MAzBb
The extraction of the metal complex adduct can be written
M (aq) zHA(org) bB(org) MA B (org) zH (aq) az+z b
++ + +→← ( . )4 45
The extraction constant is defined by
Kz
exz b org
+
z+orgz
orgb
[MA B ] [H
[M [HA] [B]b=
]
]( . )4 45
or
K Dex M+ z
orgz
orgb [H [HA] [B] c= − −] ( . )4 45
Thus the distribution of the metal, DM, is shown to depend on the concentrationsof H+ and HAorg to the power z of the charge of the metal ion, and on theconcentration of B to the power of b (i.e., number of adduct formers in theextracted complex).
It can be shown that
K K K K Kex az
z DRz
DC ad,bB = −β ( . )4 46
Copyright © 2004 by Taylor & Francis Group, LLC
where (omitting ionic charges) Ka = [H][A]/[HA] is the acid dissociation con-stant [see Eq. (4.18)], KDR = [HA]org/[HA] is the distribution constant for theundissociated acid HA [see Eq. (4.17)], and
Kad,bB z b org z orgbMA B MA= [ ] /[ ] ( . )4 47
is the formation constant for the adduct MAzBb in the organic phase [see Eqs.(4.15), (4.16), and (4.26)]. The five parameters Ka, βn, KDR, KDC, and Kad,bB arein principle unrelated, even though it may not always be possible to change onewithout affecting the others, as each molecular species may take part in severalequilibria. Without considering the independent parameters, it is often difficultto understand why Kex varies in the fashion observed, and it may be impossibleto predict improvements of the system. A good example is the extraction ofZn(II) by β-diketones and TBP:
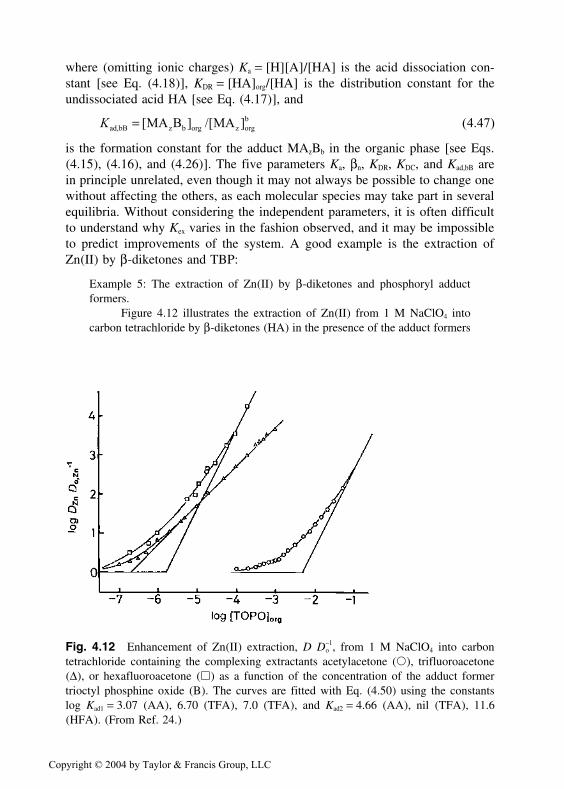
Example 5: The extraction of Zn(II) by β-diketones and phosphoryl adductformers.
Figure 4.12 illustrates the extraction of Zn(II) from 1 M NaClO4 intocarbon tetrachloride by β-diketones (HA) in the presence of the adduct formers
Fig. 4.12 Enhancement of Zn(II) extraction, D D−o
1, from 1 M NaClO4 into carbontetrachloride containing the complexing extractants acetylacetone (�), trifluoroacetone(∆), or hexafluoroacetone (�) as a function of the concentration of the adduct formertrioctyl phosphine oxide (B). The curves are fitted with Eq. (4.50) using the constantslog Kad1 = 3.07 (AA), 6.70 (TFA), 7.0 (TFA), and Kad2 = 4.66 (AA), nil (TFA), 11.6(HFA). (From Ref. 24.)
Copyright © 2004 by Taylor & Francis Group, LLC

TBP and TOPO (B) [12]. The extracted neutral complex is ZnA2Bb. The distri-bution ratio becomes
DZn
2 org 2 org 2 2 org
2
ZnA ZnA B] ZnA B
Zn] ZnA] ZnA =
+ + ++ + +
[ ] [ [ ]
[ [ [ ]
L
LL( . )4 48a
To analyze these systems, the overall extraction reaction must be broken intoits partial reactions, or by introducing Eq. (4.47), to obtain
DK K K
Zn
DC
2
ad,1 org ad,2 org
2
n
n
A] (1 B] B]
[A]=
+ + +ββ
2 4 4[ [ [ )
( .L
Σ88b)
where the adduct formation constant is defined by
Kad,b 2 b org 2 org org
bZnA B [ZnA [B]= − −[ ] ] ( . )1 4 49
In the absence of any adduct former, DZn is given as a function of the freeligand concentration by Eq. (4.36), i.e.,0 the parentheses in Eq. (4.48b) equals1; denoting this DZn-value as Do, and introducing it into Eq. (4.48) gives
′ = + + +D D K KZn ado org ad,2 org
2 (1 B] B] , [ [ ) ( . )1 4 50L
DZn′ (instead of DZ′n) indicates that this expression is valid only at constant[A−], or, better, constant [H+] and [HA]org [see Eqs. (4.36) and (4.41c)]. In Fig.4.12, log DZ′n D−
o1 is plotted as a function of log [B]org. The distribution ratio
proceeds from almost zero, when almost no adduct is formed, towards a limit-ing slope of 2, indicating that the extracted complex has added two moleculesof B to form ZnA2B2. From the curvature and slope the Kad,b-values were deter-mined (see section 4.10). The calculation of the equilibrium constants is furtherdiscussed under Example 13.
Tables 4.11–4.13 presents adduct formation constants according to Eq.(4.47). For the alkaline earths TTA complexes in carbon tetrachloride in Table4.11, the TBP molecules bond perpendicular to the square plane of the two TTArings, producing an octahedral complex. The higher the charge density of the
Table 4.11 Adduct Formation Constantsfor the Reaction M(TTA)2 + bTBPXM(TTA)2(TBP)b in CCl4 Showing Effectof Charge Density
Mz+ (r pm) log Kad1 log Kad2
Ca2+ (100) 4.11 8.22Sr2+ (118) 3.76 7.52Ba2+ (135) 2.62 5.84
Source: Ref. 4.
Copyright © 2004 by Taylor & Francis Group, LLC

Table 4.12 Adduct Formation Constants for the Reaction EuA3(org) +bTBP(org)X EuA3(TBP)b(org), Eq. (4.26a), Where org = CHCl3,and HA Substituted Acetylacetone Ligands
Ligand (A) Log Ka Log Kad1 Log Kad2
Acetylacetone, AA 8.76 1.90 —Benzoylacetone, BZA 8.74 1.60 —Trifluoroacetone, TFA — 3.32 4.64Benzoyltrifluoroacetone, BTA — 3.64 5.282-Furoyltrifluoroacetone, FTA — 3.50 5.00Thenoyltrifluoroacetone, TTA 6.3 3.34 5.28
Source: Ref. 4.
central atom, the stronger is the adduct complex with TBP. Note: Charge densityrefers to the electrostatic interaction between ions of opposite charge accordingto the Born equation [see (2.13), and (3.13)] (based on the Coulomb interac-tion). It is mostly given as the ratio between the ionic charge, z+ (or z+z−) andthe ionic radius r+ (or r+r−). Table 4.12 compares the adduct formation of theeuropium β-diketone complexes with TBP in chloroform. In Eu(TTA)3 theTTAs only occupy six of the eight coordination positions available; the twoempty positions have been shown to be occupied by water. Though the tendencyis not strong, the stronger the acid (i.e., the larger its electronegativity), thelarger is the adduct formation constant. Table 4.13 compares the adduct forma-tion tendency of the Eu(TTA)3 complex with various adductants. The basicityof the donor oxygen atom increases in the order as shown in Table 4.13, as doesthe adduct formation constant; this is in agreement with the order of basicity inTable 4.8 and the donor numbers of Table 3.3; see also section 4.2.
Table 4.13 Constants for Formation of Eu(TTA)3Bb AdductsAccording to Eq. (4.26a)
Chloroform Carbon tetrachlorideAdduct formingligand (B) log Kad1 log Kad2 log Kad1 log Kad2
TTA(self-adduct) 0.56 — >0.5 —Hexone 1.16 1.52 1.71 2.34Quinoline 3.29 — 3.48 5.16TBP 3.63 5.40 5.36 8.96TOPO 5.40 7.60 7.49 12.26
Source: Ref. 4.
Copyright © 2004 by Taylor & Francis Group, LLC

The difference between the two solvent systems is likely a result of CHCl3
solvating the Eu complex to some extent, while CCl4 is inert. This has twoeffects: the KDC value increases due to the solvation by CHCl3 (not shown in thetable), while the adduct formation constant Kad decreases as the solvation hindersthe adduct formation; the more inert solvent CCl4 causes an opposite effect, alower KDC and a larger Kad.
4.9.2 Metal Inorganic Complexes with OrganicAdduct Formers, Type MXzBb
The extraction of mineral salts is generally less complicated than the extractionof mineral acids. Metal salts with monodentate univalent anions like Cl−, ClO−
4,SCN−, and NO−
3 are strongly hydrated in the aqueous phase and have quite small,if any, solubility in inert solvents. In order to extract these acids, they musteither form an adduct with a strongly basic extractant like TBP or TOPO, or bein solvating solvents such as ethers, ketones, alcohols, or esters. Examples ofextracted metal salt adducts are: Br3(EtO)b, PaCl3(MIBK), UO2(NO3)2(TBP)2,Co(ClO4)2(octanol)b, etc. (b is uncertain). Tables of the extraction of a largenumber of metal salts by solvating solvents or commercial adduct formers dis-solved in kerosene are given (see Ref. [5]).
It has been shown [25] that monomeric metal hydroxides can be extractedby strong donor molecules; e.g., in the form of the adducts Ln(OH)3(TOPO)b
into CHCl3, where b is 2–3. Under favorable conditions, the DLn value mayexceed 1, though the fraction of hydroxide is quite low.
When the solvent is a good solvater, the determination of the solvationnumber b is difficult, unless the dependence of the extractant concentration onthe solvent can be obtained. Solvation numbers can be obtained in mixtures ofa solvating extractant and an inert diluent like hexane. Further, in these systemsthe extraction of the metal commonly requires high concentrations of salt oracid in the aqueous phase, so the activity coefficients of the solutes must betaken into account.
Example 6: Extraction of Zn(II) thiocyanate complexes by TOPO.Figure 4.13 shows the extraction of Zn(II) from aqueous thiocyanate
(L−) solutions into 0.001 M TOPO (B) in hexane; the aqueous phase is 1.0 MNa(SCN−, ClO−
4) at a pH around 5 [26]. Zn(II) is known to form a number ofweak Zn(SCN)n
n−2 complexes in the aqueous phase. The uncharged one is as-sumed to accept TOPO to form the adducts Zn(SCN)2(TOPO)b, where b = 1or 2.
Assume that the reaction between the neutral complex and the solvatingmolecule takes place at the interface (to assume the reaction to take place inthe organic phase would be unrealistic, as the zinc thiocyanate is insoluble inhexane); thus the etxraction reaction is
Copyright © 2004 by Taylor & Francis Group, LLC

Fig. 4.13 Distribution ratio of Zn(II) when extracted from 1 M Na(SCN−,ClO−4) into
0.001 M TOPO in hexane, as a function of aqueous SCN− concentration. The followingequilibrium constants were obtained with Eq. (4.53): β1 3.7, β2 21, β3 15, Kex 2.5 107 forb = 2. (From Ref. 26.)
ZnL b B(org) ZnL B (org)2 2 + →← b ( . )4 51
for which we may define an equilibrium constant Kex,bB.Because more than one solvated species may be extracted, the distribution ratiobecomes
DZn
2 org 2 org
2 3
ZnL B] ZnL B
Zn] ZnL] ZnL ZnL =
+ ++ + + +
[ [ ]
[ [ [ ] [ ](2 4
L
L.. )52
Inserting the partial equilibrium constants [see Eq. (4.46)],
DK b
nZn
2 ex,bB org
n
L] [B]
L]=
+β
β2
14 53
[
[( . )
ΣΣ
where both summations are taken from 1. The solvation number b can be deter-mined from the dependence of D on [B]org while [L] is kept constant. From theslope of the line in Fig. 4.13 at low SCN− concentrations, it follows that b =2; thus only one adduct complex is identified: Zn(SCN)2(TOPO)2. The authorswere able to calculate the formation constants βn from the deviation of thecurve from the straight the line at constant [B]org, assuming b constant. With
Copyright © 2004 by Taylor & Francis Group, LLC
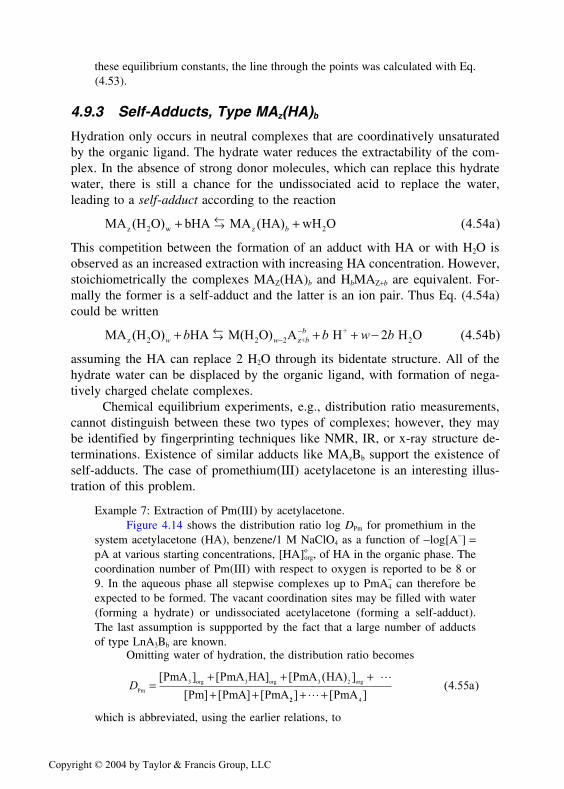
these equilibrium constants, the line through the points was calculated with Eq.(4.53).
4.9.3 Self-Adducts, Type MAz(HA)bHydration only occurs in neutral complexes that are coordinatively unsaturatedby the organic ligand. The hydrate water reduces the extractability of the com-plex. In the absence of strong donor molecules, which can replace this hydratewater, there is still a chance for the undissociated acid to replace the water,leading to a self-adduct according to the reaction
MA (H O) bHA MA HA) wH O az 2 w z 2+ +→← ( ( . )b 4 54
This competition between the formation of an adduct with HA or with H2O isobserved as an increased extraction with increasing HA concentration. However,stoichiometrically the complexes MAZ(HA)b and HbMAZ+b are equivalent. For-mally the former is a self-adduct and the latter is an ion pair. Thus Eq. (4.54a)could be written
MA (H O) HA M(H O) A H H O bz 2 2 z++
2w w bbb b w b+ + + −→← −
−2 2 4 54( . )
assuming the HA can replace 2 H2O through its bidentate structure. All of thehydrate water can be displaced by the organic ligand, with formation of nega-tively charged chelate complexes.
Chemical equilibrium experiments, e.g., distribution ratio measurements,cannot distinguish between these two types of complexes; however, they maybe identified by fingerprinting techniques like NMR, IR, or x-ray structure de-terminations. Existence of similar adducts like MAzBb support the existence ofself-adducts. The case of promethium(III) acetylacetone is an interesting illus-tration of this problem.
Example 7: Extraction of Pm(III) by acetylacetone.Figure 4.14 shows the distribution ratio log DPm for promethium in the
system acetylacetone (HA), benzene/1 M NaClO4 as a function of −log[A−] =pA at various starting concentrations, [HA]o
org, of HA in the organic phase. Thecoordination number of Pm(III) with respect to oxygen is reported to be 8 or9. In the aqueous phase all stepwise complexes up to PmA−
4 can therefore beexpected to be formed. The vacant coordination sites may be filled with water(forming a hydrate) or undissociated acetylacetone (forming a self-adduct).The last assumption is suppported by the fact that a large number of adductsof type LnA3Bb are known.
Omitting water of hydration, the distribution ratio becomes
DPm
org 3 org 3 2 orgPmA PmA HA] PmA HA)
Pm] PmA] PmA=
+ + ++ +
[ ] [ [ ( ]
[ [ [3 L
22 4PmAa
] [ ]( . )
+ +L4 55
which is abbreviated, using the earlier relations, to
Copyright © 2004 by Taylor & Francis Group, LLC

Fig. 4.14 Extraction of Pm(III) by acetylacetone (HAa) from 1 M NaClO4 into ben-zene at three different original concentrations of HAa in the organic phase. pA =−log[Aa−] is calculated according to Eq. (4.20). The analysis of the system yielded theconstants log β1 5.35, log β2 9.20, log β3 13.22, log β4 14.06, Kad1 7, Kad2 3, and KDC
0.008, shown for Pm in Fig. 4.15. (From Refs. 27a,b.)
DK K K
Pm
DC 3
3
ad1 org ad2 org
2
n
A] (1 HA] HA]
A]b=
+ + +
3
ββ
[ [ [ )
[( . )
L
Σ4 55
where KDC refers to the distribution of uncharged PmA3 between the benzeneand the aqueous phase
KDC 3 org 3PmA PmA= [ ] /[ ] ( . )4 56
Kad,b is the equilibrium constant for the self-adduct formation in the organicphase, i.e.,
PmA B(org) b HA(org) PmA HA) (org) a
PmA (
3 3 b
ad,b 3
+ →←
=
( ( . )
[
4 57
K HHA) ] PmA ] [HA] bb org 3 org org[ ( . )− −1 4 57b
For pedagogic reasons we rewrite Eq. (4.55b)
Copyright © 2004 by Taylor & Francis Group, LLC
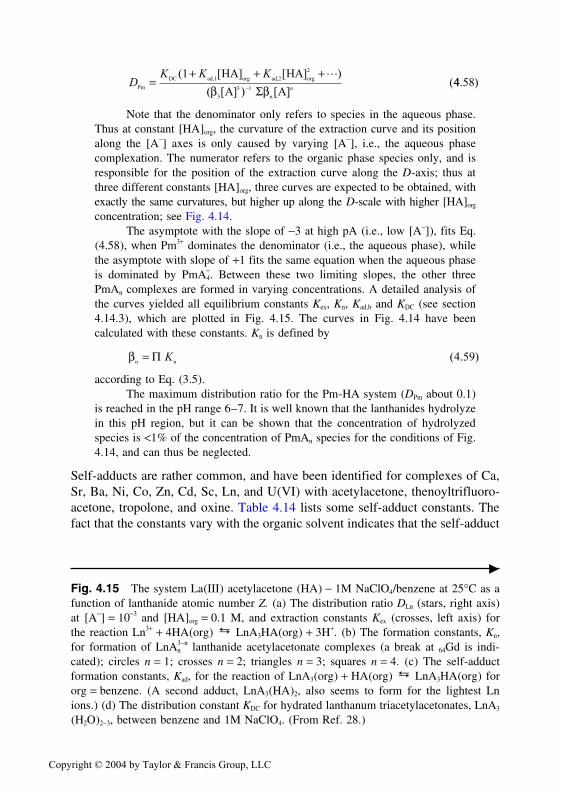
DK K K
nPm
DC ad,1 org ad,2 org
2
n
(1 HA] HA]
A] A]=
+ + +
3−
[ [ )
( [ ) [(
L
β β3 1 Σ44 58. )
Note that the denominator only refers to species in the aqueous phase.Thus at constant [HA]org, the curvature of the extraction curve and its positionalong the [A−] axes is only caused by varying [A−], i.e., the aqueous phasecomplexation. The numerator refers to the organic phase species only, and isresponsible for the position of the extraction curve along the D-axis; thus atthree different constants [HA]org, three curves are expected to be obtained, withexactly the same curvatures, but higher up along the D-scale with higher [HA]org
concentration; see Fig. 4.14.The asymptote with the slope of −3 at high pA (i.e., low [A−]), fits Eq.
(4.58), when Pm3+ dominates the denominator (i.e., the aqueous phase), whilethe asymptote with slope of +1 fits the same equation when the aqueous phaseis dominated by PmA−
4. Between these two limiting slopes, the other threePmAn complexes are formed in varying concentrations. A detailed analysis ofthe curves yielded all equilibrium constants Kex, Kn, Kad,b and KDC (see section4.14.3), which are plotted in Fig. 4.15. The curves in Fig. 4.14 have beencalculated with these constants. Kn is defined by
βn n = Π K ( . )4 59
according to Eq. (3.5).The maximum distribution ratio for the Pm-HA system (DPm about 0.1)
is reached in the pH range 6–7. It is well known that the lanthanides hydrolyzein this pH region, but it can be shown that the concentration of hydrolyzedspecies is <1% of the concentration of PmAn species for the conditions of Fig.4.14, and can thus be neglected.
Self-adducts are rather common, and have been identified for complexes of Ca,Sr, Ba, Ni, Co, Zn, Cd, Sc, Ln, and U(VI) with acetylacetone, thenoyltrifluoro-acetone, tropolone, and oxine. Table 4.14 lists some self-adduct constants. Thefact that the constants vary with the organic solvent indicates that the self-adduct
�
Fig. 4.15 The system La(III) acetylacetone (HA) − 1M NaClO4/benzene at 25°C as afunction of lanthanide atomic number Z. (a) The distribution ratio DLn (stars, right axis)at [A−] = 10−3 and [HA]org = 0.1 M, and extraction constants Kex (crosses, left axis) forthe reaction Ln3+ + 4HA(org) X LnA3HA(org) + 3H+. (b) The formation constants, Kn,for formation of LnA3
n−n lanthanide acetylacetonate complexes (a break at 64Gd is indi-
cated); circles n = 1; crosses n = 2; triangles n = 3; squares n = 4. (c) The self-adductformation constants, Kad, for the reaction of LnA3(org) + HA(org) X LnA3HA(org) fororg = benzene. (A second adduct, LnA3(HA)2, also seems to form for the lightest Lnions.) (d) The distribution constant KDC for hydrated lanthanum triacetylacetonates, LnA3
(H2O)2−3, between benzene and 1M NaClO4. (From Ref. 28.)
Copyright © 2004 by Taylor & Francis Group, LLC

Rydberg_5063-2_Ch05_R3_02-09-04 11:29:22
Copyright © 2004 by Taylor & Francis Group, LLC

Table 4.14 Constants for the Formation of Some Metal Self-AdductsAccording to MAz(org) + b HA(org)X→ MAz(HA)b
Metal ion Mz+ Ligand and adduct former HA Organic solvent Log Kad
Zn(II) Isopropyltropolone, IPT CHCl3 1.72Zn(II) Isopropyltropolone, IPT CCl4 1.9La(III) Acetylacetone, AA C6H6 2.6Eu(III) Thenoyltrifluoroacetone, TTA CHCl3 0.56Eu(III) Thenoyltrifluoroacetone, TTA CCl4 0.5Eu(III) Isopropyltropolone, IPT CHCl3 2.1Eu(III) Isopropyltropolone, IPT CCl4 2.0U(VI) Acetylacetone, AA CHCl3 1.16U(VI) Thenoyltrifluoroacetone, TTA C6H6 0.50
Source: Ref. 4.
reaction probably occurs in the organic phase. Table 4.14 contains both veryinert (e.g., CCl4), polar (CHCl3), and pi-bonding solvents (C6H6).
4.10 METAL EXTRACTION BY LIQUID ANIONEXCHANGERS (TYPE III-D)
Organic phase with anion RNH+L− (RNH+)pML−n
p
exchanger and metal complex ↓↑ ↓↑Aqueous phase: metal with Mz+ + nL− + pRNH+L− ←→ (RNH+)pML−
np
complexing anions L−
and amine
Metals that react with inorganic ligands to form negatively charged com-plexes as described in Chapter 3 can be extracted into organic solvents withlarge organic cations in a process referred to as liquid anion exchange.
4.10.1 Two Industrially Important Cases
Extraction of metals from chloride solutions into kerosene containing trioctylamine (TOA), as illustrated by Fig. 1.3, has found application in the productionof pure Co and Ni metals from their ores, as discussed in Chapter 11. Theaqueous phase contains the Co and Ni in addition to other metals in chloridesolution, where the chloride concentration goes to 300 g/L (i.e., about 8.5 M).At this high aqueous ionic strength, a rigorous mathematical treatment of thesystem would require the use of activities in order to explain the extraction
Copyright © 2004 by Taylor & Francis Group, LLC

diagram; however, here it suffices to use concentrations. An interesting featurein Fig. 1.3 is the differences between metals in various oxidation state, notablyFe(II) and Fe(III), the latter being much more easily extracted than the formerbecause Fe(III) forms much stronger complexes with Cl− ions. The requirementfor extraction of metals by an aminelike TOA, or by its amine salt, TOAH+Cl−,is the formation of negatively charged metal chloride complexes in the aqueousphase. The complex formation from Mz+ to MClz
n−n, where z − n ≤ −1, proceeds
in the stepwise manner described in Chapter 3. For example, Fe(III) forms thecomplex FeCl−
4, while cobalt forms CoCl24
−. The extraction reaction for Co canbe written
CoCl RNH Cl (org) (RNH) CoCl org) Cl a42 +
2 4− − −+ +→←2 2 4 60( ( . )
Amine extraction is used also in another important industrial process, theextraction of uranium from sulphuric acid leached ores, which uses trilaurylamine (TLA). In that case, the extraction reaction is
UO (SO (RNH ) SO (org)
2 4
+2 4
2)42 2− −+
→←← + − (RNH) UO SO org) SO b4 2 4 4
2( ) ( ( . )3 4 60
These processes are referred to as liquid anion exchange, because theaqueous anionic metal complex replaces the anions Cl− or SO2
4− of the large
organic amine complex. The amine complex is an ion pair, or salt, RNH+L−,where R is a large hydrocarbon group. The amine salt is highly soluble in theorganic (e.g., kerosene) phase, and almost insoluble in the aqueous phase. Thereaction is presumed to occur either at the interface or in the aqueous phase witha low concentration of dissolved RNH +L−. Before discussing these reactions interms of molecular species, it is necessary to consider more specific aspects ofliquid anion exchangers.
4.10.2 Properties of Liquid Anion Exchangers
As mentioned earlier, hydrogen ions can be solvated by strong donor moleculeslike TBP, sometimes leading to the extraction of a solvated hydrogen salt,HB+
bL−; in Example 2, TBP extracts nitric acid, HNO3, in the form of the adduct
complex TBP � HNO3, which could be considered as the complex HTBP+NO−3
ion pair. The amines form stronger adducts with hydrogen ions; in fact, they areso strong that they remain protonated while exchanging the anion. A classicalreaction is the formation of the ammonium ion NH+
4 when NH3 is dissolved inwater.
The organic amines (the amine base RN) have a nitrogen atom N attachedto a large organic molecule R usually containing >7 aliphatic or aromatic carbonatoms. They are highly soluble in organic solvents (diluents) and almost insolu-ble in water. In contact with an aqueous phase containing HL, the amine base
Copyright © 2004 by Taylor & Francis Group, LLC

RN reacts with the acid HL to form RNH +L−, but extracts with an excessamount of acid HL (over the 1:1 HL:RN ratio) into the organic solvent, andalso with additional water. The practical concentration of amine in the organicsolvent is usually less than 20%; at higher concentrations the amine salt solu-tions become rather viscous. The amine salts dissociate in highly polar solvents,while in more inert diluents they easily polymerize to form micelles, and athigher concentrations a third phase. For example, in xylene (TLA � HBr)n aggre-gates with n = 2, 3, and 30 have been identified, and in other systems aggrega-tion numbers above 100 have been reported. TLA � HNO3 is mainly trimeric inm-xylene at concentrations 0.002–0.2 M, but larger aggregates are formed athigher amine concentrations. These aggregates seem to behave like monofunc-tional species, each extracting only one anionic metal complex. The aggregationcan be reduced, and the third phase formation avoided, by using aromatic diluentsand/or by adding a modifier, usually another strong Lewis base (e.g., octanol orTBP). Such additions often lead to considerable reduction in the Kex value.
Four types of organic amines exist, as shown in Table 4.8: primary aminesRNH +
3, secondary R2NH +2, tertiary R3NH +, and quaternary R4N
+(Appendix D).The hydrocarbon chain R is usually of length C8−C12, commonly a straightaliphatic chain, but branched chains and aromatic parts also occur. In generalthe amines extract metal complexes in the order tertiary > secondary > primary.Only long-chain tertiary and—to a smaller extent—quarternary amines are usedin industrial extraction, because of their suitable physical properties; trioctylam-ine (TOA, 8 carbons per chain) and trilauryl amine (TLA, 12 carbons per chain)are the most frequently used. For simplicity we abbreviate all amines by RN,and their salts by RNH +L−.
The tertiary and quaternary amine bases are viscous liquids at room tem-perature and infinitely soluble in nonpolar solvents, but only slightly soluble inwater. The solubility of the ion-pair RNH +L− in organic solvents depends onthe chain length and on the counterion, L−: the solubility of TLA � HCl in wetbenzene is 0.7 M, in cyclohexane 0.08 M, in CHCl3 1.2 M, and in CCl4 0.7 M.Nitrate and perchlorate salts are less soluble, as are lower molecular weightamines.
The formation of the ion pair salt can be written
RN(org) H L RNH L org) + +ex,am+ + − −→← ( ( . )K 4 61
Table 4.15 gives the equilibrium constants Kex,am (for extraction, amine) for thisreaction with trioctylamine in various solvents. Although the ion pairs are onlyslightly soluble in water, they can exchange the anion L− with other anions, X−,in the aqueous phase. (Note that we use L− to indicate any anion, while X− isused for (an alternative) inorganic anion.)
RNH (org) NH org) + +ex,chL X X L K− − − −+ +→← ( ( . )4 62
Copyright © 2004 by Taylor & Francis Group, LLC

Table 4.15 Equilibrium Constants Kex,am for Formationof Trioctyl Amine Salts [Eq. (4.61)]
Anion Solvent Log Kex,am
F− Toluene 3.0Cl− Toluene 5.9Cl− Carbontetrachloride 4.0Cl− Benzene 4.1Br− Toluene 8.0NO−
3 Toluene 6.6NO−
3 Carbontetrachloride 5.0SO2
4− a Carbontetrachloride 6.7
SO24− a Benzene 8.3
aThe equilibrium constant refers to the formation of (R3NH)2SO4.Source: Ref. 5.
The equilibrium constant (Kex,ch for extraction, exchange) for this reaction in-creases in the order ClO−
4 < NO−3 < Cl− < HSO−
4 < F−. From Chapter 3 it followsthat the formation constants for the metal complex MLn
z−n usually increases inthe same order. Therefore, in order to extract a metal perchlorate complex, veryhigh ClO−
4 concentrations are required; the perchlorate complex is easily re-placed by anions higher in the sequence.
All negatively charged metal complexes can be extracted by liquid anionexchangers, independent of the nature of the metal and the complexing ligand.Liquid anion exchange has extensive industrial application, and many examplesare given in later chapters. Lists of extraction values are found in other works[e.g., 5, 21].
4.10.3 Equations for Liquid AnionExchange Extractions
The discussion on the properties of the amine salts serves to explain why, inmetal amine extractions, it is difficult to obtain simple mathematical relationsthat agree well with the experimental data. While there is no difficulty, in princi-ple, in obtaining reasonably good values for the formation of the negativelycharged metal complexes in the aqueous phase, there is a major problem indefining the organic phase species, which may consist of free amine [RN], mono-meric [RNHL], and polymeric [RNHL]n amine salt, and several extracted metalcomplexes [(RNH+)p(MLp
n−)]. A contributing difficulty in practice is the need to
use high ligand concentrations, [L−], in the aqueous phase in order to obtain thenegatively charged complexes (see Fig. 1.3).
Copyright © 2004 by Taylor & Francis Group, LLC
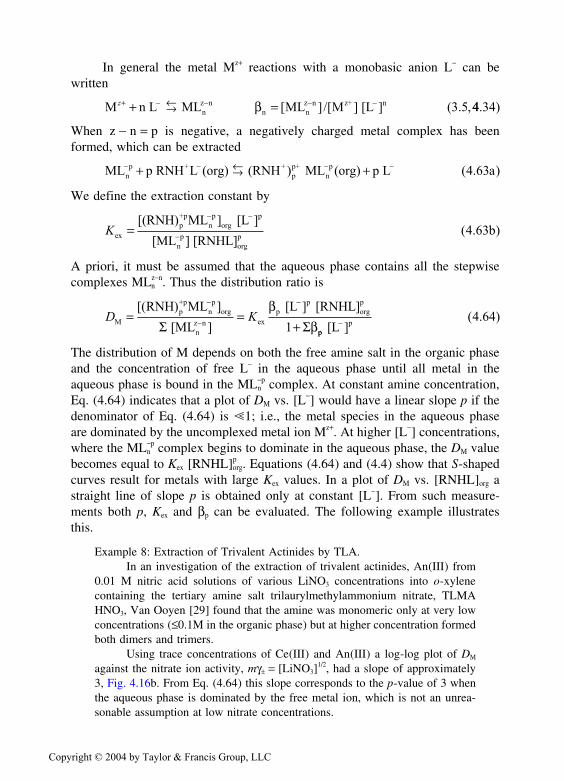
In general the metal Mz+ reactions with a monobasic anion L− can bewritten
M n L ML ML M [Lnz n
n nz n z+ nz+ − − − −+ =→← β [ ]/[ ] ] ( . ,3 5 44 34. )
When z − n = p is negative, a negatively charged metal complex has beenformed, which can be extracted
ML p RNH L (org) (RNH ) ML (org) p L anp + +
pp+
np− − − −+ +→← ( . )4 63
We define the extraction constant by
Kexp+p
np
orgp
np
orgp
[(RNH) ML [L
[ML ] [RNHL]b=
− −
−
] ]( . )4 63
A priori, it must be assumed that the aqueous phase contains all the stepwisecomplexes MLz
n−n. Thus the distribution ratio is
D KMp+p
np
org
nz n ex
pp
orgpRNH) ML
[ML
[L [RNHL]= =
+
−
−
−[( ]
]
]
Σ Σβ
β1 ppp [L− ]
( . )4 64
The distribution of M depends on both the free amine salt in the organic phaseand the concentration of free L− in the aqueous phase until all metal in theaqueous phase is bound in the ML−
np complex. At constant amine concentration,
Eq. (4.64) indicates that a plot of DM vs. [L−] would have a linear slope p if thedenominator of Eq. (4.64) is �1; i.e., the metal species in the aqueous phaseare dominated by the uncomplexed metal ion Mz+. At higher [L−] concentrations,where the ML−
np complex begins to dominate in the aqueous phase, the DM value
becomes equal to Kex [RNHL]porg. Equations (4.64) and (4.4) show that S-shaped
curves result for metals with large Kex values. In a plot of DM vs. [RNHL]org astraight line of slope p is obtained only at constant [L−]. From such measure-ments both p, Kex and βp can be evaluated. The following example illustratesthis.
Example 8: Extraction of Trivalent Actinides by TLA.In an investigation of the extraction of trivalent actinides, An(III) from
0.01 M nitric acid solutions of various LiNO3 concentrations into o-xylenecontaining the tertiary amine salt trilaurylmethylammonium nitrate, TLMAHNO3, Van Ooyen [29] found that the amine was monomeric only at very lowconcentrations (≤0.1M in the organic phase) but at higher concentration formedboth dimers and trimers.
Using trace concentrations of Ce(III) and An(III) a log-log plot of DM
against the nitrate ion activity, mγ± = [LiNO3]1/2, had a slope of approximately
3, Fig. 4.16b. From Eq. (4.64) this slope corresponds to the p-value of 3 whenthe aqueous phase is dominated by the free metal ion, which is not an unrea-sonable assumption at low nitrate concentrations.
Copyright © 2004 by Taylor & Francis Group, LLC
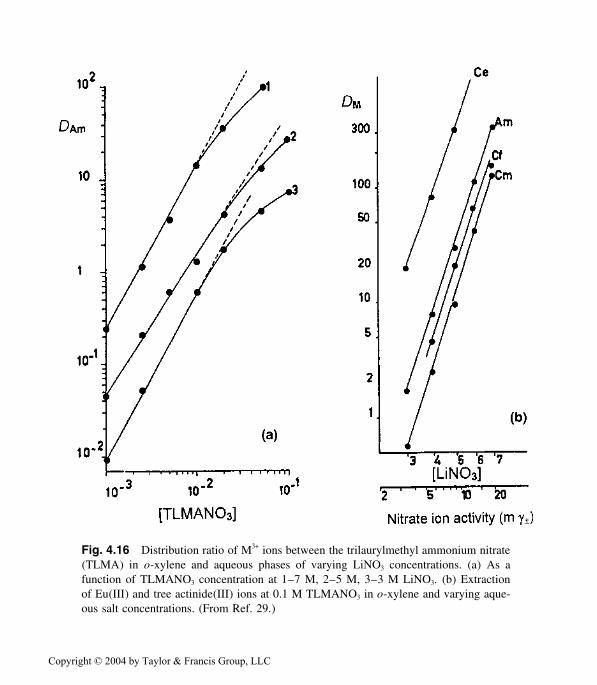
Fig. 4.16 Distribution ratio of M3+ ions between the trilaurylmethyl ammonium nitrate(TLMA) in o-xylene and aqueous phases of varying LiNO3 concentrations. (a) As afunction of TLMANO3 concentration at 1–7 M, 2–5 M, 3–3 M LiNO3. (b) Extractionof Eu(III) and tree actinide(III) ions at 0.1 M TLMANO3 in o-xylene and varying aque-ous salt concentrations. (From Ref. 29.)
Copyright © 2004 by Taylor & Francis Group, LLC

In plots of log DAm against [TLMA � NO3]org at different nitrate concen-trations, the curves in Fig. 4.16a had straight slopes of 1.5–1.8 at low concen-trations of TLMA NO3, but bending at higher concentrations, was explainedby the formation of polymeric amine species. If Eq. (4.64) is valid, these slopescorrespond to the number of TLMA HNO3 groups attached to the extractedAm species. Thus Van Ooyen described his complex as {(TLMA NO3)n}2
Am(NO3)3, for which n = 1 only at the very low amine concentrations. Thusfor n = 1 the complex could as well be written (TLMA)2Am(NO3)5. The Ceand other An complexes would have similar configurations.
4.11 OTHER EXTRACTABLE METAL COMPLEXES(TYPE III-E)
Ion pair (and possibly “counter species”) (C+X− and Y+A−) C+A−
in organic phase ↓↑Aqueous cation C+ and anion A− associated C+ + A− ←→ C+A−
into ion pair C+A−
There are a few types of complexes that do not fit well into the previousclassifications: monovalent metals that form extractable complexes with largeorganic monobasic anions, and, conversely, monovalent inorganic anions thatform extractable complexes with large organic cations. Though the amine-typeliquid anion exchangers could fit into the latter group, it is simpler to treat themas a separate homogenous group (class III-D). The large monovalent ion pair,tetraphenylarsonium tetraphenylborate (Ph4As+ Ph4B
−), which has been suggestedas a reference in solvent extraction (see Chapter 2), also belongs to this class.
Of some importrance is the extraction of alkali ions by tetraphenylborateand by crown ethers (Appendix D: 21), of fluoride by tetraphenylantimoniumions, and of perrhenate by tetraphenylarsonium ions. Because most of the vol-ume of these complexes is taken up by organic groups, the complexes are highlylipophilic and, therefore, extractable into organic solvents without additionalsolvation. Though these systems have limited applications, the crown ethers offersome interesting extraction systems. The ethers form cage compounds (“clath-rates”); i.e., the metal cation fits into a cage formed by the crown structure. Be-cause the cage can be designed to fit almost any ion of a certain size, ratherselective extractions are possible with this system, as described in Chapter 15.
Example 9: Extraction of K+ by tetraphenylborate.Consider the extraction of K+ from aqueous solution into the organic
solvent nitrobenzene by addition of NaPh4B. Abbreviating Ph4B− by A−, the
extracted complex is the ion pair K+A−. In an inert solvent this is a stable ionpair, but in a highly polar solvent like nitrobenzene, the ion pair may dissociate.The organic phase may thus contain both solvated K+ and K+A− species, while
Copyright © 2004 by Taylor & Francis Group, LLC

the only potassium species in the aqueous phase is free K+.The extraction equilibria may be written
K A K A (org) Equil. const. + +
ex+ − −→← K ( . )4 65
while for the reaction in the organic phase
K A (org) K (org) A (org) Equil. const. + +
ass
− −→← + K ( . )4 66
The distribution ratio of K+ becomes
D K KK
+
org
+
org
+
ex ass orgK A ] + K ] [K A A K= = +− − − −([ [ ) ] [ ]( /[ ] ) [1 1 ]] 1− ( . )4 67
When A− is added into the aqueous phase as a Na+ salt in large excess to K+,the dissociation in the organic phase becomes negligible and Eq. (4.67) is re-duced to
D KK ex A= −[ ] ( . )4 68
Figure 4.17 shows the distribution ratio of K+ when a large excess ofNa+A− is added to the system. Although the extracted complex should be com-
Fig. 4.17 Distribution ratio of potassium(I) between nitrobenzene and water as a functionof initial aqueous tetraphenylborate concentration in 0.1M NaClO4. (From Refs. 30a,b.)
Copyright © 2004 by Taylor & Francis Group, LLC
pletely dissociated in the nitrobenzene, the ionic concentration of the organicphase is large enough to suppress dissociation, and the distribution ratio thusbecomes proportional to the concentration of the extractant in the aqueous phase.
4.12 STUDIES OF HYDROPHILIC COMPLEXATIONBY SOLVENT EXTRACTION (TYPE IV)
Coordinatively saturated metal MAz
complex in organic phase ↓↑Formation of extractable and Mz+ + zA− + nX− ←→ MAz + MXz
n−n
nonextractable complexes
Solvent extraction has become a common technique for the determination offormation constants, βn, of aqueous hydrophilic metal complexes of type MXn,particularly in the case when the metal is only available in trace concentrations,as the distribution can easily be measured with radioactive techniques (see alsosection 4.15). The method requires the formation of an extractable complex ofthe metal ion, which, in the simplest and most commonly used case, is an un-charged lipophilic complex of type MAz. The metal-organic complex MAz
serves as a probe for the concentration of metal Mz+ ions in the aqueous phasethrough its equilibrium with the free Mz+, section 4.8.2. This same principle isused in the design of metal selective electrodes (see Chapter 15). Extractantstypically used for this purpose are β-diketones like acetylacetone (HAA) orthenoyltrifluoroacteone (TTA), and weak large organic acids like dinonyl naph-talene sulphonic acid (DNNA).
The pertinent distribution equation is
DMz org
nn
pp
[MA
M]{1 [A] [X]=
+ +]
[ }( . )
Σ Σβ β4 69
(summed from 1 to n or p) where the formation constants for MAn are βn andthose for the MXp complexes βp and summations are taken from 1. In the ab-sence of MXp complexes, the distribution ratio of M is defined by DM
o :
DMo
z org nnMA M] (1 A]= +[ ] /[ [ ) ( . )Σβ 4 70
If the conditions are chosen so that the aqueous complexes of HA can be ne-glected [see Eq. (4.41) and Example 4], DM
o of Eq. (4.70) equals DM of Eq.(4.41c); i.e.,
D D KMo
M ex orgz + z [of Eq. (4.41c)] [HA] [H c, = = −] ( . . )4 41 4 71
for which linear correlations are obtained in plots of log DM against log [HA]org
at constant pH, or against pH at constant [HA]org. Dividing Eq. (4.69) by Eq.(4.70) gives
Copyright © 2004 by Taylor & Francis Group, LLC

D Do1 2
23
3/ [X] [X] [X]= + + + +1 4 72β β β L ( . )
Thus a plot of Do/D against [X] provides a polynomial from which the βps canbe calculated (see section 4.14).
Example 10: Determination of formation constants for Be(II) oxalate com-plexes.
Figure 4.18 shows the extraction of beryllium with HTTA into hexoneas a function of the concentration of oxalate ions, Ox2−, in the aqueous phase.Here the conditions have been chosen so that the aqueous complexes of TTAcan be neglected as has been described earlier, and thus Eq. (4.71) is valid,and the relation DM
o = Kex [HA]2org [H]−2 so that
log log [HA] [H]
=
o
ex org
2D D D K/ = − −1 2
−− + +− −log (1 Ox Ox210 10 4 733 55 2 5 40 2. .[ ] [ ]) ( . )
The parameter values on the right-hand side of the equation, are the βn values,and were determined by a curve fitting technique (section 4.14). Introducingthese values in Eq. (4.71) gives the solid line through the points in Fig. 4.18.The advantage of this “strange” ordinate is that the curvature only reflects theoxalate complexation.
Hydrolysis of some metals begins at very low pH (e.g., Zr at pH � 0.4, Th(IV)and U(VI) at pH 1–2, the lanthanides at pH 3–5, etc.). However, if complex
Fig. 4.18 Decrease in distribution ratio of Be(II) as a function of oxalate ion (Ox2−)concentration due to formation of aqueous BeOx2
n−2n complexes. The extraction system is
0.03 M TTA in methylisobutylketone and 1.0 M Na(0.5 Ox2−, ClO−4). See Eq. (4.72) for
ordinate function. (From Ref. 31.)
Copyright © 2004 by Taylor & Francis Group, LLC

formation strongly dominates over hydrolysis, the latter can be neglected. In theoverview in section 4.3, it was shown in Fig. 4.3 that the general shape of theextraction curves indicates the type of complexes formed. Thus, the extractionof gallium(III) with acetylacetone, Fig. 4.19, indicates a behavior according toFig. 4.3c. in the plot of log D vs. free ligand concentration, [A−].
Example 11: Formation of hydrolyzed Ga(III) acetylacetonates.Figure 4.19 shows the extraction of Ga(III) by acetylacetone into ben-
zene at various concentrations of total acetylacetone, [HA]t, and constant ionicstrength, using the AKUFVE technique (see section 4.15.3). By comparingwith Fig. 4.3, one may guess that hydroxy complexes are formed (diagram c).If the general complex is designated GamAn(OH)p, a first investigation showed
Fig. 4.19 The distribution of Ga(III) between benzene and 1 M NaClO4 as a functionof pA = −log[A−] at 6 different acetylacetone (HA) concentrations (0.06–0.0006 M).Thedifferent curves are due to different extent of hydrolysis in the aqueous phase. The con-centration of HA decreases from the upper left corner, where [HA]aq is 0.06 M (▲),toward the right lower corner, where it is 0.0006 M (�). (From Ref. 32.)
Copyright © 2004 by Taylor & Francis Group, LLC

that no polynuclear complexes were formed, i.e., m = 1, as the extractioncurves were independent of the Ga(III) concentration. This was also expectedas the total concentration of Ga(III) ranged from 10−4 to 10−6 M. Next, using acomputer program, the formation constants for the following complexes weredetermined: GaA2+, GaA+
2, GaA3, Ga(OH)3 and Ga(OH)−4 [32]. It was concluded
that no mixed complexes with both A− and OH− were formed. The organicphase contained only GaA3 (which was hydrated).
In using this technique accurately, it is necessary to consider possiblesources of errors. A rather extensive summary of this technique applied to hy-drophilic actinide complexation by practically all inorganic ligands, as well asa considerable number of weak organic acids, has recently been presented[33a,33b].
4.13 EFFECTS AND CORRELATIONS
Because of the many parameters involved in solvent extraction, chemical aswell as physical, it is a difficult task to draw reliable conclusions about thereactions that are responsible for the observed distribution values. In the intro-ductory part of this chapter, section 4.2, the extraction reaction described by Kex
was shown to be a product of a number of parameters related to the differentsteps involved in the formation of the extracted complex. Sections 4.4–4.11have described these various subreactions, which are described by Eq. (4.46):
K K K K Kzex a
zz DR DC ad,bB = −β ( . , . )4 46 4 74
Examples of how Kex data may be interpreted in more fundamental terms follow.In the lack of information on the independent parameters of Eq. (4.74), tenableconclusions can be drawn about their size and effects from known correlationsbetween the parameters. This section explores the effect of such correlations.
4.13.1 Effects of the Dissociation Constantof Acidic Ligands and Formation Constantsof the Corresponding Metal Complexes
4.13.1.1 The Ligand (Acid) Dissociation Constant KaAccording to Eq. (4.74) Kex increases to the z power of the dissociation constant,Ka, for the extractant acid HA. Thus it appears desirable to use stronger acidsas extractants, i.e., those with large Ka (or small pKa). Thus factors that affectthe dissociaton constant of an acid are of importance for extraction behavior.
The acidity of organic acids increases (i.e., pKa decreases) by electrophilicsubstitution in the carbon chain. For example, replacing an H atom in the CH3
group of acetic acid (pKa 4.75) by I, Br, Cl, and F atoms yields monohalideacetic acids with pKa of 3.0, 2.9, 2.8, and 2.7, respectively. The mono-, di-,and trichloroactic acids have pKa 2.8, 1.48, and about 1.1, respectively. Other
Copyright © 2004 by Taylor & Francis Group, LLC

electrophilic groups which can increase acidity are HO−, NC−, NO2−, etc.Conversely, nucleophilic substitution by aliphatic or aromatic groups usuallyhas little effect on the pKa, though it may affect the distribution constant KDR
(see section 4.13.2): e.g., the addition of a CH3− or C6H5− group in acetic acidchanges the pKa to 4.9 (propionic acid) and 4.3 (phenyl acetic acid). The furtherthe substitution is from the carboxylic group, the less the effect: e.g., while pKa
for benzoic acid is 4.19, a Cl in orthoposition yields pKa 2.92 and in the parapos-ition, 3.98.
These general rules hold rather well for the acidic organic extractants andcan be used to extrapolate from related compounds to new ones as well as todevelop new extractants. The effect of various substituends on pKa is extensivelydiscussed in textbooks on organic chemistry [e.g., 14, 34].
4.13.1.2 The Complex Formation (or Stability)Constant βn
Kex also increases with increasing formation constant of the uncharged metalcomplex, βz. Thermodynamic factors and geometrical aspects that influence thesize of βn are discussed in Chapter 3. Some further observations follow.
To achieve the highest possible D value, the concentration of the extracteduncharged complex (MAz, MAzBb or BbMLz+b) must be maximized. A largevalue for the formation constant of the neutral complex favors this goal. InChapter 3 it was pointed out that for hard acids the complex formation constantincreases with the charge density of the metal ion, provided there is no sterichindrance. This is seen for the metal fluoride complexes in Fig. 3.4 (no sterichindrance). For the lanthanide acetylacetonates in Fig. 4.15b, the increase in βn
from 57La to 64Gd is due to a reduction in the ionic radius and, accordingly, tothe increased charge density. It should be noted that the diminishing lanthanidesize leads to a successive diminution of the coordination number (from 9 to 8for H2O) for La → Gd; for Gd → Lu the coordination number is probably con-stant, as is inferred from Fig. 4.15c; see also [35].
4.13.1.3 Correlations Between Ka and βnBecause the H+ ion acts as a hard metal ion, one should expect a close correla-tion between the formation constants for HA and for MAz. Since Ka is definedas the dissociation constant of HA, while βz is the formation constant of MAz,a correlation is therefore expected between pKa (= −logKa) and logβz. The corre-lations in Figs. 3.5 and 3.6 show that large logβn values are usually observedfor organic acids with large logKa. Since Kex is directly proportional to both βz
and K za [see Eq. (4.74)], and a large βz value is likely to be accompanied by a
small Ka value (large pKa); in Eq. (4.74) the two parameters counteract eachother. Thus in order to obtain high free ligand concentrations, which favors theformation of the MAz complex, [H+] must be low, i.e., pH must be high. How-
Copyright © 2004 by Taylor & Francis Group, LLC

ever, at high pH the metal may be hydrolyzed. A careful balance must be struckbetween βz, Ka, and pH to achieve an optimum maximum concentration of theuncharged complex.
4.13.2 Effects of Molecular Volume and WaterStructure Upon KD
Chapters 2 and 3 factors are discussed which affect the distribution of unchargedspecies between the organic and aqueous phases, the most important being (1)the interaction of the species (complex or extractant) with the solvents (solva-tion); and (2) energy released or required when an uncharged species leaves itsoriginal phase (cavity closure) and that required when it enters the new phase(cavity formation). Sections 4.4 and 4.5 discuss the distribution of inert species,including undissociated acid HA, KDR. From Eq. (4.74) it is seen that Kex isnegatively influenced by a large distribution constant for the extractant reagent,but favored by a large KDC for the extraction of the metal complex.
4.13.2.1 Metal Complexes, KDCThere are rather limited data on systematics for the distribution constants KDC
of metal complexes. Table 4.10 gives distribution constants for Zn(II), Cu(II),and Np(IV) acetylacetonates in various solvents. The zinc complex has an octa-hedral coordination: four oxygen atoms from the ligands and two oxygen atomsfrom water molecules can occupy six positions in an almost spherical geometryaround the zinc atom. The copper complex has a square planar configurationwith four oxygen atoms from the acetylacetones in the plane; a fifth (and possi-bly sixth) position perpendicular to the plane and at a longer distance from thecopper atom can be occupied by an oxygen from a water molecule. The zinccomplex has a larger degree of hydration in the aqueous phase and consequentlya lower distribution constant. The NpA4 structure is likely a square antiprismwith no hydrate water. It has a larger molecular volume than the two othercomplexes, and its larger distribution constant is in agreement with this, reflect-ing the release of more water structuring energy when leaving the aqueousphase.
Two further observations can be made from Table 4.10: (1) the distribu-tion constant seems to increase with increasing polarity of the solvent; (2) whenthe reagent acetylacetone has a large KDR, the metal complexes also show a largeKDC value.
The lanthanide ions, Ln3+, are known to contract with increasing atomicnumber (Z), from La3+ with a hydrated radius of 103 pm to Lu3+ of 86 pm(lanthanide contraction). Thus one expects that the neutral LnA3 complex be-comes smaller with increasing atomic number, and consequently that β3 shouldincrease and KDC decrease with increasing Z. Figure 4.15d shows that measured
Copyright © 2004 by Taylor & Francis Group, LLC

KDC values for the lanthanide acetylacetonates are the reverse from that expectedfor the size effect. The explanation is likely that the neutral complex with theformula LnA3 is coordinatively unsaturated, which means that a hydrated com-plex exists in the aqueous phase (possibly also in the organic phase). The morecoordinatively unsaturated lanthanide complexes (of the larger ions) can accom-modate more water and thus are more hydrophilic. The result is a KDC severalorders of magnitude lower for the lightest, La, than for the heaviest, Lu.
The tetravalent metal acetylacetonates [36] have all coordination numbers(CN) 8 or 9 in the neutral complexes. For Th (radius 109 pm at CN 9) there isoften one molecule of water in ThA4, whereas for the corresponding complexesof U(IV) and Np(IV) (radius 100 and 98 pm, respectively, CN = 8), there seemsto be none. The measured distribution constants (log KDC) are for Th 2.55 andfor U and Np 3.52 and 3.45, respectively, in 1 M NaClO4/benzene. This agreeswith the greater hydrophilic nature of the ThA4 � H2O complex.
4.13.2.2 Correlations Between KDR and KDCQualitatively, the distribution constants of the complexing reagent and the corre-sponding neutral metal complex are related due to their similar outer surfacetoward the solvents. Thus it is reasonable that there should be good correlationbetween KDR and KDC for homologous series of reagents or complexes. This isindeed the case, as is seen when KD,R is plotted vs. KD,C, in Fig. 4.20 for acomplex with a variation of the solvent, and in Fig. 4.21 for complexes ofrelated reagents with the same solvent. This correlation can be related to thesolubility parameter concept discussed later.
4.13.3 The Solubility Parameter
In Chapter 2 we learned that the cohesive forces that keep molecules togetherin a solution can be described by
δ2 a= −( ) / ( . ; . )∆H T VV R 2 1 4 75
where δ2 is the cohesive energy density, and δ, the solubility parameter, V, themolar volume and ∆HV, the molar heat of vaporization. This holds for regularsolutions [37] that show ideal entropy effects in mixing solute and solvent, andno interactions occur besides the cohesive forces between the solute and solventmolecules. [Note: Regular solutions exhibit heat changes when mixed, while forideal solutions, the heat of mixing is zero (see section 2.4.1).] There is nochange of state in association or in orientation. Thus the work required to pro-duce a cavity, ∆Gcav, by the solute in the solvent is given by
∆G A Vcav cav B2 b= δ ( . ; . )2 10 4 75
where Acav is a proportionality factor and VB is the molar volume of the solute B.
Copyright © 2004 by Taylor & Francis Group, LLC

Fig. 4.20 Distribution constants KDC for uncharged metal complexes MAz, vs. distribu-tion constants KDR for the corresponding undissociated reagent, the acid ligand HA, forvarious organic solvents and 1 M NaClO4: open circles Cu(II), solid circles Zn(II). Num-bers refer to solvents listed in Table 4.10. (From Ref. 36.)
Pioneering work on the application of this theory for correlating and pre-dicting distribution ratios was done in the 1960s [38a–40c]. Several reviews onthe use of this theory for two-phase distribution processes are also available[41,42]. Recently this theory has been refined by the use of Hansen solubilityparameters [6,43,44], according to which
δ δ δ δtotal dispersion polar hydrogen c2 2 2 2 4 75= + + ( . )
where interactions between the solute and the solvent are described by contribu-tions from the various types of cohesive forces. In general, the dispersion (orLondon) forces dominate. In Fig. 4.22 the measured distribution ratios of anamericium complex between an aqueous nitrate solution and various organicsolvent combinations are compared with distribution ratios calculated from tabu-lated Hansen parameter values [45].
Few solubility parameters are available for the metal-organic complexesdiscussed in this chapter. Another approach is then necessary. The distributionconstant for the reagent (extractant), R, can be expressed as:
Copyright © 2004 by Taylor & Francis Group, LLC

Fig. 4.21 Distribution constants, KDC, for uncharged metal complexes MAz vs. distribu-tion constants KDR for the corresponding undissociated acid ligand HA; solid circlesZn(II), solid triangles Co(III). Variation with ligand composition: HFA hexafluoroace-tylacetone, TFA trifluoroacetylacetone, AA acetylacetone, FTA 2-furoyltrifluoroacetone,TTA 2-thenoyltrifluoroacetone, PTA pivaloyltrifluoroacetone, BFA benzoyltrifluoroace-tone, BZA benzoylacetone. (From Ref. 36.)
Copyright © 2004 by Taylor & Francis Group, LLC

Fig. 4.22 Comparison of measured and calculated distribution ratios DAm of americi-um(III)-terpyridine-decanoic acid complexes between 0.05 M HNO3 and various organicsolvent combinations. The calculated values are obtained with the Hansen partial solubil-ity parameters. (From Ref. 45.)
R RT K V T V V V ln + DR R aq R org R R org aq= − − − −[( ) ( ) ] ( / / ) (δ δ δ δ2 2 1 1 4.. )76
where KDR is given in terms of mole fractions. The solubility parameter of waterhas to be empirically estimated. The thermodynamic value is 48, but, since thesystem may be sensitive to the choice of δaq, it is better to select a “reference δaq”in each set of experiments, assuming constant values for the aqueous systems inthe two different two-phase systems. Molar volumes and solubility parametervalues are listed in Table 2.1 and Refs. [6,44].
The overall enthalpy and entropy changes for the distribution reaction(i.e., transfer of the metal complex from the aqueous to the organic phase) canbe obtained from the temperature dependence of KDR according to
R ln DRT K H T S= − +∆ ∆ ( . )4 77
An enthalpy term corresponding to −VR[(δaq − δR)2 − (δorg − δaq)2] and an entropy
term corresponding to R VR(1/Vorg − 1/Vaq) can be obtained formally from Eq.(4.76). If the distribution constant for a standard system is used as a reference,changes in enthalpy and entropy relative to this standard system can be assessedby replacing δaq and Vaq with the corresponding data for the organic diluent inthe reference system, δref
org and V reforg.
Copyright © 2004 by Taylor & Francis Group, LLC

Thus from solubility parameters, which are specific for the various solutesand solvents, and molar volumes, values for KDR can be estimated, or deviationsfrom regularity can be assessed. These deviations can be estimated quantita-tively and, in individual systems, can be ascribed to specific reactions in eitherof the phases, e.g., hydration, solvation, adduct formation, etc.
From Eq. (4.76) the relation
log log const.DC C R DRK V V K= +( / ) ( . )4 78
can be derived; the subscript C refers to the neutral metal complex. The molarvolume ratio is close to or smaller than z, where z is the number of singlycharged anionic species attached to the central metal ion Mz+. From Fig. 4.23 aratio of ca. 1.5 (for z = 2) is obtained. This equation is useful for estimating KDR
values in extraction systems where the corresponding KDC value is known.Rearrangement of Eq. (4.75) shows that log KDR/(δaq − δorg) vs. δ, where
δ δ δ δ= − −− − −org aq org org
1aq (RT V V( ) ) ( . )1 1 4 79
should yield a straight line with slope VR / RT ln10. A plot of this relation inFig. 4.23 demonstrates a satisfactory correlation between distribution constantsand solvent parameters, indicating the usefulness of the solubility parameterconcept in predicting KDR as well as KDC values.
Fig. 4.23 Application of the regular solution theory for correlation of distribution con-stants for ZnA2 and CuA2 with solvent properties (solubility parameters); the numbersrefer to the solvents listed in Table 4.10. (From Ref. 22.)
Copyright © 2004 by Taylor & Francis Group, LLC

4.13.4 Effects of the Solvent (Diluent) Composition
The composition of the organic phase solvent (diluent) influences the distribu-tion of both the neutral metal organic complex MAz and the complexing reagentHA, through similar interactions ranging from that of cavity formation for veryinert diluents like hexane, through dipole-dipole interactions, pi electron interac-tion, and hydrogen bonding for the more reactive solvents. The expected degreeof interaction can be judged from values of permittivity and solubility parame-ters. Previous tables have illustrated some of these aspects: Table 4.1 on thedistribution of inert solutes (hole formation), Table 4.7 on distribution of organicacids (polarity), and especially Table 4.10 on distribution of metal acetylaceto-nates (solvent permittivity), discussed in section 4.13.2.1. These cases involvethe aqueous phase, so some phenomena may be attributed to the interaction withwater molecules.
Figure 4.24 shows a decrease in KD for acetylacetone with increasing num-ber of methyl groups in the substituted benzene solvent. Since acetylacetone ismore soluble in aromatics than in aliphatics, as illustrated by the KDR sequence:
Fig. 4.24 Distribution constants KDR of acetylacetone between methyl-substituted ben-zenes at different aqueous ionic strengths: (a) 0.001 M, (b) 0.1 M, and (c) 1.0 M NaClO4
at 25°C. The number of methyl groups, n, changes the aromatic character at n = 0 tomore aliphatic at n = 3. (From Ref. 46.)
Copyright © 2004 by Taylor & Francis Group, LLC

hexane 0.95, cyclohexane 1.03, ethylbenzene 3.31, and benzene 5.93 (aqueousphase 1 M NaClO4), the decrease observed in Fig. 4.24 may simply be an effectof the increasing aliphatic character of the solvents.
4.13.5 Effects of the Aqueous Medium
The effect of the water activity of the aqueous phase, discussed in Chapters 2,3, and 6, is determined by the total concentration and nature of the salts. Gener-ally, the distribution constant for a neutral metal complex would increase withincreasing ionic strength, as illustrated in Fig. 4.25. This salting-out effect isoften ascribed to a reduction in free water available for hydration. On the otherhand, the salt also breaks down the water structure, which could reduce theenergy to form a hole in the phase.
4.13.6 Effects of the Temperature
The introduction of a neutral complex into a solution phase involves a numberof processes that can be associated with large changes in enthalpy (solvationprocesses) and in entropy (solvent orientation and restructuring), leading to con-siderable temperature effects; see Chapter 2. In general, the distribution of aneutral metal complex increases with increasing temperature for complexes withsignificant hydrophobic character. The metal acetylacetonate systems in Fig.4.26 illustrate this effect. In these particular systems, the free energy of distribu-tion between the organic and aqueous phases is dominated by the enthalpy term.
Fig. 4.25 The distribution constant KDC for zinc diacetylacetonate, ZnA2, between ben-zene and various concentrations of NaClO4 in the aqueous phase; 25°C. (From Ref. 36.)
Copyright © 2004 by Taylor & Francis Group, LLC

Fig. 4.26 Distribution constant KDC for metal diacetylacetonates, MA2, between or-ganic solvents and 1 M NaClO4 as a function of temperature: Cu(II) (open circles) andZn(II) (solid circles) with various solvents (numbers refer to the solvents given in Table4.10). (From Ref. 36.)
From measurements of the temperature dependency of the equilibriumconstant, thermodynamic parameters may be deduced (section 3.4). Very fewenthalpy and entropy constants have been derived for the distribution reactionMAz(aq) ←→ MAz(org) of neutral complexes; such investigations give informa-tion about hydration and organic phase solvation.
4.13.7 Further Structural Considerations
In Chapters 2 and 3 several physicochemical factors of importance to solventextraction have been described, and many of their effects have been illustratedin this chapter. Here, we summarize some observed regularities. The effect ofvarious structures on the bond strengths in metal organic complexes has beenextensively treated in other publications [47–49].
4.13.7.1 Chelate Ring SizeFormation of metal-organic chelate complexes results in stronger complexation(i.e., larger βn values) compared to interaction with monodentate ligands (Chap-ter 3). The common types of bidentate ligands are presented in Table 4.9; thechemistry of these complexes has been extensively discussed in the literature[14,47]. Chapter 3 presents the most important factors in the formation of suchcomplexes: (1) the type of binding atom; (2) the chelate ring size (or “bite”);
Copyright © 2004 by Taylor & Francis Group, LLC

and (3) the number of chelate rings formed (mono- or polydentate). The follow-ing diagram illustrates the general structure of UO2
2+ and Am3+ diamide chelate
complexes: two oxygen binding atoms; ring size is 5 + n, 2–3 chelate rings percomplex; the −O−M−O− part is commonly referred to as the “claw.”
| N C H N / \ / \
n 2n
|
/ \ CH CH O O \ / M
The extractants TBOA, TBMA, and TBSA are very similar, but their structuraldifferences (see formulas in Table 4.16) allow the formation of only one typeof metal chelate complex: 5-, 6-, and 7-membered rings, respectively. Similar-ily, the reactants DMDOMA and DMDOSA form only 6- and 7-memberedchelates. Table 4.16 shows that extraction (i.e., largest Kex value) is favored by6-membered rings. This is not unexpected as the Kex values in this case reflectthe stability constants βn acc. to Eq. (4.74).
The electron shells of the M3+ elements with unfilled or partially filled 3d,4d, and 5f orbitals contract as these shells are being filled with electrons, in-creasing the charge density (z/r) of the cation, leading to increasing stabilityconstants for the MA3 complexes with increasing atomic number. For bidentateligands the f-electron (lanthanide) MA3 complexes are coordinatively unsatu-rated, i.e., only six of eight available coordination sites are filled. Therefore, thetwo remaining sites are occupied by H2O or HA or some other donor moleculesB, leading to the self-adduct MA3HA−1 or adduct MA3B1–2. It has been shownthat the adduct formation constants for the reaction MA3 + B → MA3B decrease
Table 4.16 Consultants for Extraction of Actinide Amidesfrom Nitrate Solutions into an Organic Solvent Showing the Effectof Chelate Ring Size
RingMetal ion Extractanta Kex size Ref.
UO22
+ TBOA 0.005 5 [50]UO2
2+ TBMA 10.6 6 [50]
UO22
+ TBSA 9.3 7 [50,51]Am3+ DMDOMA 0.47 6 [52]Am3+ DMDOSA <0.0002 7 [52]
aTBOA (C4H9)2NCO2; TBMA [(C4H9)2NCO]2CH2; TBSA [(C4H9)2NCO]2(CH2)2;DMDOMA (CH3C8H17NCO)2CH2; DMDOSA (CH3C8H17NCO)2(CH2)2.
Copyright © 2004 by Taylor & Francis Group, LLC
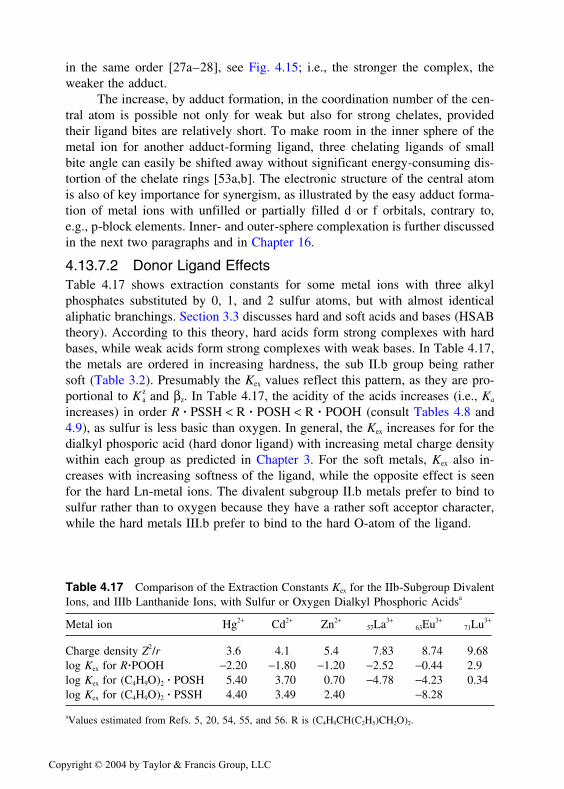
in the same order [27a–28], see Fig. 4.15; i.e., the stronger the complex, theweaker the adduct.
The increase, by adduct formation, in the coordination number of the cen-tral atom is possible not only for weak but also for strong chelates, providedtheir ligand bites are relatively short. To make room in the inner sphere of themetal ion for another adduct-forming ligand, three chelating ligands of smallbite angle can easily be shifted away without significant energy-consuming dis-tortion of the chelate rings [53a,b]. The electronic structure of the central atomis also of key importance for synergism, as illustrated by the easy adduct forma-tion of metal ions with unfilled or partially filled d or f orbitals, contrary to,e.g., p-block elements. Inner- and outer-sphere complexation is further discussedin the next two paragraphs and in Chapter 16.
4.13.7.2 Donor Ligand EffectsTable 4.17 shows extraction constants for some metal ions with three alkylphosphates substituted by 0, 1, and 2 sulfur atoms, but with almost identicalaliphatic branchings. Section 3.3 discusses hard and soft acids and bases (HSABtheory). According to this theory, hard acids form strong complexes with hardbases, while weak acids form strong complexes with weak bases. In Table 4.17,the metals are ordered in increasing hardness, the sub II.b group being rathersoft (Table 3.2). Presumably the Kex values reflect this pattern, as they are pro-portional to K a
z and βz. In Table 4.17, the acidity of the acids increases (i.e., Ka
increases) in order R � PSSH < R � POSH < R � POOH (consult Tables 4.8 and4.9), as sulfur is less basic than oxygen. In general, the Kex increases for for thedialkyl phosporic acid (hard donor ligand) with increasing metal charge densitywithin each group as predicted in Chapter 3. For the soft metals, Kex also in-creases with increasing softness of the ligand, while the opposite effect is seenfor the hard Ln-metal ions. The divalent subgroup II.b metals prefer to bind tosulfur rather than to oxygen because they have a rather soft acceptor character,while the hard metals III.b prefer to bind to the hard O-atom of the ligand.
Table 4.17 Comparison of the Extraction Constants Kex for the IIb-Subgroup DivalentIons, and IIIb Lanthanide Ions, with Sulfur or Oxygen Dialkyl Phosphoric Acidsa
Metal ion Hg2+ Cd2+ Zn2+57La3+
63Eu3+71Lu3+
Charge density Z2/r 3.6 4.1 5.4 7.83 8.74 9.68log Kex for R�POOH −2.20 −1.80 −1.20 −2.52 −0.44 2.9log Kex for (C4H9O)2 � POSH 5.40 3.70 0.70 −4.78 −4.23 0.34log Kex for (C4H9O)2 � PSSH 4.40 3.49 2.40 −8.28
aValues estimated from Refs. 5, 20, 54, 55, and 56. R is (C4H9CH(C2H5)CH2O)2.
Copyright © 2004 by Taylor & Francis Group, LLC

4.13.7.3 Inner and Outer Sphere CoordinationThe extractabilities of metal-organic complexes depend on whether inner orouter sphere complexes are formed. Case I, section 4.2.1, the extraction of ura-nyl nitrate by TBP, is a good example. The free uranyl ion is surrounded bywater of hydration, forming UO2(H2O)2
6+, which from nitric acid solutions can
be crystallized out as the salt UO2(H2O)26
+(NO3)22−, though it commonly is written
UO2(NO3)2(H2O)6. Thus, in solution as well as in the solid salt, the UO22
+ issurrounded by 6 H2O in an inner coordination sphere. In the solid nitrate salt,the distance dU-O(nitrate) between the closest oxygen atoms of the nitrate anions,(O)2NO, and the U-atom is longer than the corresponding distance, dU-O(water),to the water molecules, OH2, i.e., dU-O(nitrate) > dU-O(water); thus the nitrateanions are in an outer coordination sphere.
When the adduct former TBP is added, the OP(OC4H9)3 groups are closerto the U-atoms than the OH2’s, dU-O(TBP) < dU-O(water), two waters are ex-pelled, although the OP- bond only occupies one coordination site. The chargedistribution around the UO2-group allows the nitrate group to enter the innercoordination sphere of the uranyl complex. The resulting configuration is shownin Fig. 4.27. Thus, the extraction reaction can more correctly be written
UO (H O) NO TBP(org)2 2 62+
3
+ +−2 2
UO TBP) (NO (org) 6 H O b2 2 3 2→← +( ) ( . )2 4 5
In many systems it is difficult to distinguish between inner and outersphere complexation. In that case, knowledge about the thermodynamic parame-ters ∆H and ∆S may be of help. For inner sphere complexes, the hydration isdisrupted more extensively and the net enthalpy and entropy changes are posi-tive. In Eq. (4.5b) it is noted that the number of entities increases from five toseven, an entropy increase. This entropy effect (i.e., −T∆S ) is obviously largerthan the enthalphy effect, as the overall energy change ∆G is negative. In outersphere complexes, the dehydration is less disrupted, and the net enthalpies andentropies are negative owing to the complexation with its decrease in random-ness without a compensary disruption of the hydration spheres.
Migration experiments have shown that the hydrated cations not onlycarry with them the water in the inner coordination sphere, but also one or moreshells of additional water molecules, for typical total values of 10–15. When themetal ion leaves the aqueous phase in the solvent extraction step, this orderedcoordinated water returns to the bulk water structure, contributing an additionalfactor to consider in evaluating the thermodynamics of extraction.
4.13.7.4 Steric HindranceThe closer the reactive ligand atoms get to the central metal ion, the strongerthe bond, and, consequently, the greater the formation constant. This can be
Copyright © 2004 by Taylor & Francis Group, LLC
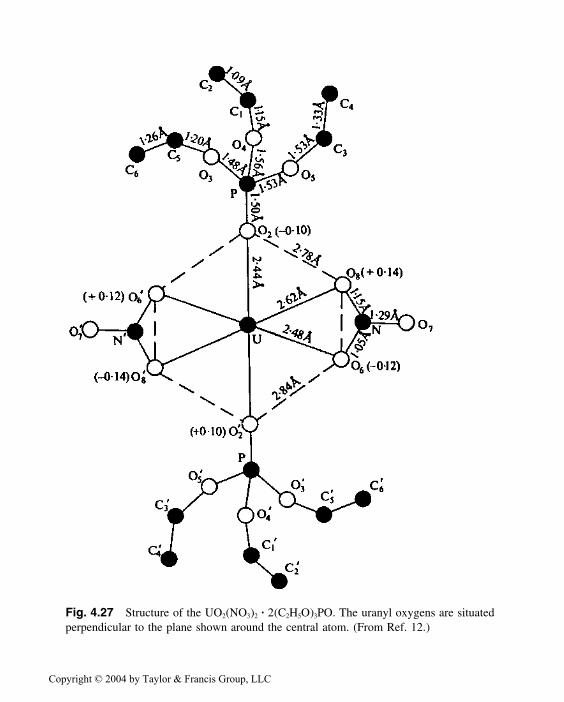
Fig. 4.27 Structure of the UO2(NO3)2 � 2(C2H5O)3PO. The uranyl oxygens are situatedperpendicular to the plane shown around the central atom. (From Ref. 12.)
Copyright © 2004 by Taylor & Francis Group, LLC
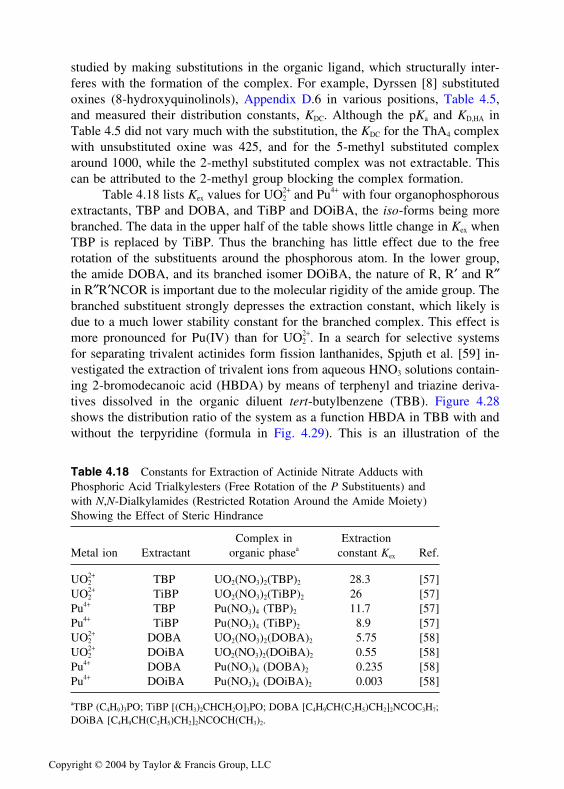
studied by making substitutions in the organic ligand, which structurally inter-feres with the formation of the complex. For example, Dyrssen [8] substitutedoxines (8-hydroxyquinolinols), Appendix D.6 in various positions, Table 4.5,and measured their distribution constants, KDC. Although the pKa and KD,HA inTable 4.5 did not vary much with the substitution, the KDC for the ThA4 complexwith unsubstituted oxine was 425, and for the 5-methyl substituted complexaround 1000, while the 2-methyl substituted complex was not extractable. Thiscan be attributed to the 2-methyl group blocking the complex formation.
Table 4.18 lists Kex values for UO22
+ and Pu4+ with four organophosphorousextractants, TBP and DOBA, and TiBP and DOiBA, the iso-forms being morebranched. The data in the upper half of the table shows little change in Kex whenTBP is replaced by TiBP. Thus the branching has little effect due to the freerotation of the substituents around the phosphorous atom. In the lower group,the amide DOBA, and its branched isomer DOiBA, the nature of R, R′ and R″in R″R′NCOR is important due to the molecular rigidity of the amide group. Thebranched substituent strongly depresses the extraction constant, which likely isdue to a much lower stability constant for the branched complex. This effect ismore pronounced for Pu(IV) than for UO2
2+. In a search for selective systems
for separating trivalent actinides form fission lanthanides, Spjuth et al. [59] in-vestigated the extraction of trivalent ions from aqueous HNO3 solutions contain-ing 2-bromodecanoic acid (HBDA) by means of terphenyl and triazine deriva-tives dissolved in the organic diluent tert-butylbenzene (TBB). Figure 4.28shows the distribution ratio of the system as a function HBDA in TBB with andwithout the terpyridine (formula in Fig. 4.29). This is an illustration of the
Table 4.18 Constants for Extraction of Actinide Nitrate Adducts withPhosphoric Acid Trialkylesters (Free Rotation of the P Substituents) andwith N,N-Dialkylamides (Restricted Rotation Around the Amide Moiety)Showing the Effect of Steric Hindrance
Complex in ExtractionMetal ion Extractant organic phasea constant Kex Ref.
UO22
+ TBP UO2(NO3)2(TBP)2 28.3 [57]UO2
2+ TiBP UO2(NO3)2(TiBP)2 26 [57]
Pu4+ TBP Pu(NO3)4 (TBP)2 11.7 [57]Pu4+ TiBP Pu(NO3)4 (TiBP)2 8.9 [57]UO2
2+ DOBA UO2(NO3)2(DOBA)2 5.75 [58]
UO22
+ DOiBA UO2(NO3)2(DOiBA)2 0.55 [58]Pu4+ DOBA Pu(NO3)4 (DOBA)2 0.235 [58]Pu4+ DOiBA Pu(NO3)4 (DOiBA)2 0.003 [58]
aTBP (C4H9)3PO; TiBP [(CH3)2CHCH2O]3PO; DOBA [C4H9CH(C2H5)CH2]2NCOC3H7;DOiBA [C4H9CH(C2H5)CH2]2NCOCH(CH3)2.
Copyright © 2004 by Taylor & Francis Group, LLC

Fig. 4.28 Extraction of Eu(III) and Am(III) from K,HNO3 with 0.02 M oligopyridineor triazine and 1 M 2-bromodecanoic acid in tert-butylbenzene. (From Ref. 59.)
necessity to achieve synergistic effects by using adduct formers for extractionof metal ions that otherwise are too strongly hydrated to be extractable. Thestructures of the terphenyls (adduct formers) tested are listed in Fig. 4.29 withthe distribution ratios achieved for Am(III), DAm. For example, in the systemwith DODOXY, DAm is 4.2, while with TADPTZ it is 359. The triazine TAD-PTZ is more branched (the terphenyl DODOXY more linear) and has a slightlylarger molar volume, but the difference may also be attributed to the greaterbasicity (i.e., smaller Ka) compared to terphenyl. However, the 100 times larger
Copyright © 2004 by Taylor & Francis Group, LLC

Fig. 4.29 Structure of various oligopyridine and triazine adducts, and distribution ra-tios (inserts) for Am(III) complexes with these oligopyridines (0.02 M) and 2-bromode-canoic acid (0.00025 M) in tert-butylbenzene and 0.01 M HNO3. (From Ref. 59.)
Copyright © 2004 by Taylor & Francis Group, LLC

Rydberg_5063-2_Ch05_R3_02-09-04 11:29:22
extraction by the triazine cannot be explained by the HSAB theory; variousexplanations are suggested [59]. Steric hindrance can be predicted by modelingthe molecular structures and chemical reactions. Advanced programs requiremainframe computers, but useful programs are available for desktop computers[49].
4.14 CALCULATION OF EQUILIBRIUM CONSTANTS
Earlier sections presented chemical models for the extraction of acids and metalsinto organic solvents, and show that these models, expressed mathematically,agree with experimental data at trace metal concentrations and at constant activ-ity coefficients. These models provide a rationale for understanding the chemi-cal principles of solvent extraction.
From plots of the distribution ratio against the variables of the system—[M], pH, [HA]org, [B], etc.—an indication of the species involved in the solventextraction process can be obtained from a comparison with the extraction curvespresented in this chapter; see Fig. 4.3. Sometimes this may not be sufficient,and some additional methods are required for identifying the species in solventextraction. These and a summary of various methods for calculating equilibriumconstants from the experimental data, using graphical as well as numerical tech-niques is discussed in the following sections. Calculation of equilibrium con-stants from solvent extraction is described in several monographs [60–64].
4.14.1 Identification of Species
An initial step in data analysis is to develop an equation that represents theexperimental data reasonably. Although previous sections dealt with this issue,the approach assumed that certain species are formed. Two alternatives to thisprocedure are discussed here, both yielding the approximate stoichiometry ofthe complexes formed in the system. The most elementary is referred to as Job’smethod, while the ligand number method, developed by J. Bjerrum, is slightlymore advanced.
4.14.1.1 Job’s MethodWhen a metal M with a ligand A forms an extractable complex of the chemicalform MmAa, the extraction is at maximum when the molar ratio of these two inthe system is m:a. Similarily, if the extracted species is MAaBb, a plot of themole ratios of A and B yields a maximum at the ratio a:b. This is illustrated inFig. 4.2 for the extraction of U(VI) in the TTA-TBP (or TBPO) system. Thecurves are almost symmetrical around the mole fractions 0.5:0.5, indicating thatthe extracted species has a 1:1 ratio of TTA to TBP. Because the complex mustcontain 2 TTA (for electroneutrality), there should also be 2 TBP (or TBPO)molecules in the complex, i.e., MA2B2.
Copyright © 2004 by Taylor & Francis Group, LLC
This method is useful when only one species is extracted, but it has little valuefor the study of solvent extraction systems that contain several complex species.
4.14.1.2 Ligand Number MethodThis method [65–67] is useful for identifying the average composition of themetal species in the system. Consider Eq. (4.36a) for the extraction of MAz, andassume—for the moment—that only one species, MAn, exists in the aqueousphase. Taking the derivative of the logarithm of Eq. (4.36) yields
d D d z n log log [A]/ ( . )= − 4 80
In 1941, J. Bjerrum [65] developed the useful concept of average ligand num-ber, n, defined as the mean number of ligands per central atom:
n n= Σ [MA M]n t] /[ ( . )4 81
It can be shown [66a–67] that n equals n in Eq. (4.79), which can be rewritten
n z d D d= − log log [A]/ ( . )4 82
For example, in Fig. 4.10 (Example 3), the slope of the plot of log DCu vs. log[A−] can be used to conclude what species dominate the system at a given [A−]value. The relation in Eq. (4.82) indicates an asymptote of slope 2, so the aque-ous phase is dominated by uncomplexed Cu2+ (n = 0), while for slope 0 theneutral complex CuA2 dominates the system (n = 2). Equation (4.82) shows thatany tangent slope of the curve (i.e., d log D / d log [A]) yields the differencez − n in these simple systems.
Example 12: Extraction of Th(IV) by acetylacetone.Figure 4.30 shows a smoothed curve of measurements of the distribution
of Th(IV) from 0.1 M NaClO4 into chloroform containing the extractant acetyl-acetone (HA) [66a,b]. Taking the derivative of this curve according to Eq.(4.79) the average ligand number is derived as shown in the lower insert.Th(IV) is successively complexed by A− forming ThA3+, ThA2
2+, ThA+
3 and un-charged ThA4, which is extracted. At pA > 8.5 the n-value is zero, i.e., Th isuncomplexed, while at pA < 3.5 the average ligand number of 4 is reached,i.e., Th is fully complexed as ThA4. See also Example 15.
The average ligand number can be used to obtain approximate equilibrium con-stants, as described by [65], assuming that at half integer n-values the two adja-cent complexes dominate: e.g., at n = 0.5 the species Mz+ and MAz−1 dominate,while at n = 1.5 MAz−1 and MA2
z−2 dominate, etc.. The following expression forthe stepwise formation constant is approximately valid at
n n Kn n= − ≈ −0 5 4 83. , ( . ) log log [A]
This method of obtaining an estimate of the formation constants was done as afirst step in the Th(IV)-acetylacetone system in Fig 4.30, where in the lower
Copyright © 2004 by Taylor & Francis Group, LLC

Fig. 4.30 Upper curve: the distribution of Th(IV) between benzene and 0.1 M NaClO4
as a function of aqueous acetylacetonate ion concentration; pA = −log[A−]; the asymp-totes have slopes 0 and −4. Lower curve: The average number of ligands per centralatom, n, in same system, as obtained from a derivation of the log D(pA) curve. Usingthe ligand number method, the following equilibrium constants were estimated (withvalues from graphical slope analysis within parenthesis): logK1 8.0 (7.85), logK2 7.6(7.7), logK3 6.4 (6.3), and logK4 5.1 (5.0). Log KD4 2.50 is obtained from the horizontalasymptote. (From Refs. 66a,b.)
figure, n is plotted against −log [A−], yielding the preliminary log Kn valuesgiven in Fig. 4.3. In a similar manner, the adduct formation constants can bedetermined:
Example 13: The extraction of Zn(II) by β-diketones and phosphoryl adductformers (cont. of Example 5).
Consider the formation of adducts of the type MAzBb, as described inExample 5 (Fig. 4.12). The derivative of Eq. (4.48b) with respect to [B] atconstant [A] yields
d D d b log log [B]/ ( . )= 4 84
where b is the average number of adduct forming molecules in the moleculeat given [B] value. In Fig. 4.12 the asymptote has a slope of 2, indicating thata maximum of two molecules of TBP (or TOPO) bind to the neutral metalcomplex. From the lower slopes of the curve, the average number, b, can beestimated according to Eq. (4.83).
Copyright © 2004 by Taylor & Francis Group, LLC

4.14.2 Graphic Slope Analysis
For a rational application of slope analysis it is important to measure the varia-tion of the distribution ratio D with one component x at a time while the others,C, are kept constant. The solvent extraction equation can then be expressed inthe form of a simple polynomial of type
y a a x a x= + + +0 1 22 4 85L ( . )
where y is a function of the distribution ratio Dconst.C and x a function of thevariable (e.g., pH, the free ligand ion concentration [A−], the concentration offree extractant HA or adduct former B in the organic phase, etc.).
4.14.2.1 Linear PlotsWhen the distribution equation can be expressed in the form y = a0 + a1 x, froma plot of y vs. x the intercept on the y axis yields the a0 parameter and the slopethe a1 parameter. This treatment is referred to as the limiting value method.
Example 14: The extraction of Cu(II) by HTTA (cont. from Example 4).Example 4 (Fig. 4.11a), is represented by Eq. (4.44), which in logarith-
mic form is written
log log log [HA] pHCu ex orgD K= + +2 2 4 86( . )
For constant [HA]org (Fig. 4.11a), a plot of log DCu vs. pH yields a line of slope2, which intercepts pH = 0 at log DCu = log Kex + 2log [HA]org. Another plot oflog DCu against log [HA]org at constant pH yields a line that intercepts [HA]org
= 0 at log DCu = log Kex + 2pH (Fig. 4.11b). In either case, the HTTA systemyields log Kex = −1.25 for the CHCl3, and −1.08 for the CCl4 system. The corre-sponding values for the IPT system are 1.60 and 0.95, respectively.
Example 15: Extraction of Th(IV) by acetylacetone (cont. from Example 12).In Example 12, it was concluded from Fig. 4.30 that the aqueous phase
contained all ThAn-complexes with 0 < n < 4, and the organic phase only theuncharged ThA4 complex. We can therefore write the distribution of Th(IV)between chloroform and water
D KTh 4 org n DC 4
4
n
nThA [ThA [A] [A]= =[ ] / ] / ( . )Σ Σβ β 4 87
This is rearranged to yield
D F a x a x a a x Kx
Th DC a− − − − −= = + + + +1
0 1
1
2
2
3
3
4
41 4 88( ) / ( . )
where KDC is the distribution constant of ThA4, x equals [A], and a4−n = βn/β4.In a plot of F0 against x−1, the intercept becomes K−1
DC and the slope is a1/KDC.In the next step the function F1 is calculated
F K D x a a x a x1
1
1 2
1
3
21 4 88= − = + + +− − −( ) ( . )DC bL
Copyright © 2004 by Taylor & Francis Group, LLC
A plot of F1 vs. x−1 yields a1 at the intercept and a2 as the slope. In third step,F2 = (F1 − a1) x = a2 + a3 x−1 + a4 x−2 is calculated, yielding a2 and a3, etc. Usingthis technique all four an values are obtained, from which one can deduce theβn values [actually the Kn values in Eq. (3.5)] and the KDC value.
Dyrssen and Sillen [68] pointed out that distribution ratios obtained byconventional batchwise techniques are often too scattered to allow the determi-nation of as many parameters as used in Examples 15 and 16. They suggesteda simplified graphic treatment of the data, based on the assumption that there isa constant ratio between successive stability constants, i.e., Kn/Kn+1 = 102b, andthat all distribution curves can be normalized so that N−1 log βN = a, where N isthe number of ligands A− in the extracted complex. Thus, the distribution curvelog DM vs. log[A−] is described by the two parameters a and b, and the distribu-tion constant of the complex, KDC. The principle can be useful for estimationswhen there is insufficient reliable experimental data.
4.14.2.2 Nonlinear PlotsIt is not possible to obtain simple linear relations between D and the variableswhen both the aqueous or organic phase contain several metal species. Insteada double polynomial such as
D Yb b b y b y
a a x a x a x
b y
a xii
nn
= = + + + ++ + + +
=0 1 22
33
0 1 22
33
4 89L
L
ΣΣ
( . )
is obtained for which there is no simple solution.
Example 16: Extraction of U(VI) by acetylacetone.Fig. 4.31 shows the extraction of U(VI) by acetylacetone (HA) from
nitric acid solutions, DU, as a function of pA = −log [A−] at six different totalconcentrations of HA. A comparison with Fig. 4.3 indicates that we can expectcomplexes of the type MAn(OH)p(HA)r, which formally is equivalent toHr+pMAn+r. The extraction reaction is of the type Eq. (4.86), as one expects aseries of self-adduct complexes MAn(HA)r in the organic phase, and one ortwo series of stepwise complexes MAn and M(OH)p in the aqueous phase. Thusthe extraction reaction is of the type Eq. (4.89) with a ratio of several polyno-mials. Even in this case, a graphic extrapolation technique was useful by deter-mining a set of intermediary constants for each constant [HA]org from logDU
vs. pA. Plotting these intermediate constants vs. [HA]org, a new set of constantswere obtained, from which both the stepwise formation constants βn,p and theadduct formation constants Kad, 1 and Kad,2 for the reaction UO2A2(H2O)2–3 +nHA ←→ UO2A2(HA)1–2 in the organic phase. A more detailed analysis also al-lowed the determination of formation constants for UO2(OH)p (p = 1 and 2).There may be other explanations to the extraction results. However, with themodel used and the constants calculated, log DU could be correctly predictedover the whole system range [U]tot 0.001–0.3 M, pH 2–7, and [HA]org 0.01–1.0M. See also Example 17.
Copyright © 2004 by Taylor & Francis Group, LLC

Fig. 4.31 Extraction of U(VI) by acetylacetone (HA) from 0.1 M NaClO4 into chloro-form as a function of pH at different total concentrations of HA. (From Ref. 69.)
Copyright © 2004 by Taylor & Francis Group, LLC
Rydberg_5063-2_Ch05_R3_02-09-04 11:29:22
4.14.3 Numerical Methods
The most complicated equations presented in this chapter are of the types shownby Eq. (4.89), where a series of complexes are formed in the organic phase and,at the same time, one or a series of complexes in the aqueous phase. Morecomplicated equations would be obtained if mixed complexes and/or polynu-clear complexes are present, and if varying activity factors are introduced, butthese cases are not discussed here. Thus the solvent extraction equations can beexpressed by Eq. (4.89), where x and y are independent variables and an and bn
are unknown independent parameters. The polynomial in the denominator refersto the formation of aqueous phase complexes; in the case that the metal formsseveral series of complexes with different ligands A−, L−, etc., the denominatorcontains several polynomials: c0 + c1z + . . ., etc. The polynomial in the numera-tor always refers to the formation of organic phase complexes.
There is no exact numerical solution to Eq. (4.89) when both x and y > 0.In practice, therefore, one variable must be kept constant (or zero), while thevalue of the other changes. This was described for Example 16. Thus, if x iskept constant, the double polynomial is reduced to a simple one
y C y C a a x a xx ii
x= = + + +− (Σβ 10 1 2
2 4 90L) ( . )
where Cx is a constant at constant x. The problem is therefore reduced to thedetermination of the parameters of a simple polynomial, to which many numeri-cal methods have been applied with varying degrees of success. The main re-quirement is that all computed parameters should be positive numbers (or zero).
In order to solve an algebraic system of n parameters, only n equationsare needed (a minimum with no error estimates). When the solvent extractionreaction can be described by Eq. (4.90), there are as many equations as thereare experimental points. Commonly, in solvent extraction 10–50 points areneeded to cover the whole concentration range of interest, while the number ofunknown parameters in simple cases is <5. In evaluating the parameters, it isimportant to use the complete suite of experimental data, as that gives greatersignificance to the an or bn values.
There are several ways to solve a large number of polynomials like Eq.(4.90) for the an parameters, e.g., by minimizing the sum of the residuals, theleast square method (LSQ) being the standard procedure. It is an objective re-gression analysis method, which yields the same results for a given chemicalsystem, independent of method of investigation, provided there are no errors inthe technique or fundamental chemical assumptions. Because the method maybe applied in somewhat different ways, it may sometimes give slightly differentresults. Therefore, in judging a set of equilibrium constants, it is useful to learnhow an author has applied the minimization technique.
In Eq. (4.91) x is usually the free ligand concentration [A−], or concentra-tion [B] of the adduct former, while y is a simple function of the distribution
Copyright © 2004 by Taylor & Francis Group, LLC

ratio D. The least square method requires that S (the weighted squared residu-als) in expression Eq. (4.91) is minimized
S w a x yii
L
n in
in
N
= −
= =∑ ∑
1 0
2
4 91( ) ( . )
where N + 1 is the number of parameters, and L the number of experimentalspoints; N + L − 1 is referred to as the number of degrees of freedom of thesystem; each point has a value xi / yi. Because experiments are carried out overa large range of D, [A−] and/or [B] values, the points carry different algebraicweight (e.g., the value 1000 obscures a value of 0.001). Therefore, in order touse the LSQ technique properly, each point must be correctly weighted, wi. Thiscan be done in several ways, the most common being to weight it by yi, or byσ−
i2, or by a percentage value of yi ; σi is the standard deviation in the measure-
ment of yi. The difference an xni − yi (the residual) is not zero, because the differ-
ence is to be taken between a measured value, yi (meas.), and the correspondingcalculated value, yi (calc.), by the an xn
i function [i.e., yi(calc.) − yi(meas.)], usingthe actual an values at the time of the operation.
The principle of the LSQ technique is to compute the set of positive an
values that give the smallest sum of the residuals; Eq. (4.91) reaches the Smin
value. If the residuals equal zero (which rarely occurs in practice), Smin wouldbe zero, and there would be a perfect fit between the experimental points andthe calculated curve.
There are several mathematically different ways to conduct the minimiza-tion of S [see Refs. 70–75]. Many programs yield errors of internal consistency(i.e., the standard deviations in the calculated parameters are due to the devia-tions of the measured points from the calculated function), and do not considerexternal errors (i.e., the uncertainty of the measured points). The latter can beaccommodated by weighting the points by this uncertainty. The overall reliabil-ity of the operation can be checked by the χ2 (chi square) test [71], i.e., Smin/(L+ N − 1) should be in the range 0.5–1.5 for a reasonable consistency betweenthe measured points and the calculated parameters.
Example 17: Extraction of Pm(III) by acetylacetone.In Example 7, it was concluded that a number of self-adducts PmA3
(HA)b were formed in the organic phase (0 < b < 2) in addition to the PmAn
complexes in the aqueous phase (0 < n < 4); some extraction curves are givenin Fig. 4.14. Equation (4.55) is of the same form as Eq. (4.89); rewriting Eq.(4.55b)
Y D K Kn= = + +Pm n 3
3
DC ad1 org [A] [A] [HA]Σβ β/ ( ) ( . )1 4 92L
which can be subdivided into
Y C K K[A] 1 DC ad1 org [HA] a= + +( ) ( . )1 4 93L
Copyright © 2004 by Taylor & Francis Group, LLC

and
Y C D[HA]org 2 Pm n
n
3
3 [A] [A] (4 b= Σβ β/ . )93
Y[HA]org contains the measured DPm, the [A] values, and the βn values. It can thusin principle be treated as an Example 16 to yield the βn values and the C2 values(one for each [HA]org), remembering that a0 = 1. Because Y[A] /C1 = Y[HA]org/C2
= Y ′, a second plot of Y ′ against [HA]org yields the KD3 and Kadb values. Theanalysis of the system yielded KDC = 0.008, Kad,1 = 7 and Kad,2 = 3. In these cal-culations, a SIMPLEX program was used [75].
In comparisons of equilibrium constants collected from the literature (e.g.,Fig. 4.22 or [47]), or correlations of data for a large number of systems (e.g.,Figs. 4.20–4.23), it is desirable to present both the statistical uncertainty of each“point,” which is often given by the standard deviation (one or several σ’s) ofthe point, and the general reliability (statistical significance) of the whole corre-lation [76], for which the chi-square test offers a deeper insight into the reliabil-ity of the experimental results [77]. More advanced statistical tests for systemsof our kind have been described by Ekberg [78].
4.15 EXPERIMENTAL DETERMINATIONOF DISTRIBUTION RATIOS
The studies described above have the purpose of identifying the reacting speciesin a solvent extraction process and developing a quantitative model for theirinteractions. The fundamental parameter measured is the distribution ratio, fromwhich extraction curves are derived. Solvent extraction work can still be carriedout with simple batchwise (or point-by-point) technique, but continuous on-linemeasurements give faster and more accurate results.
4.15.1 Stirred Cell Semicontinuous Techniques
Each point-by-point experiment requires a complete set of mixing, separation,sampling, and analysis. This usually leads to scattered results, though it maynot be critical, if the D values cover a limited range from 0.1–10. However, themore the D values deviate from 1, the more accurate must be the measurements;also the number of points required for a reliable extraction curve usually in-creases. To reduce the uncertainty and labor involved with the batch technique,the stirred cell technique has become popular.
Figure 4.32 shows a typical thermostated stirred cell. The liquid volumesare commonly 50 + 50 mL. The stirrer may consist of a single paddle at theinterface, or a double paddle, one in the center of each phase. The cell maycontain baffles, etc., to improve the mixing. Stirring may be violent, completelydestroying the interface and producing very small (�1 mm) droplets, or slow
Copyright © 2004 by Taylor & Francis Group, LLC
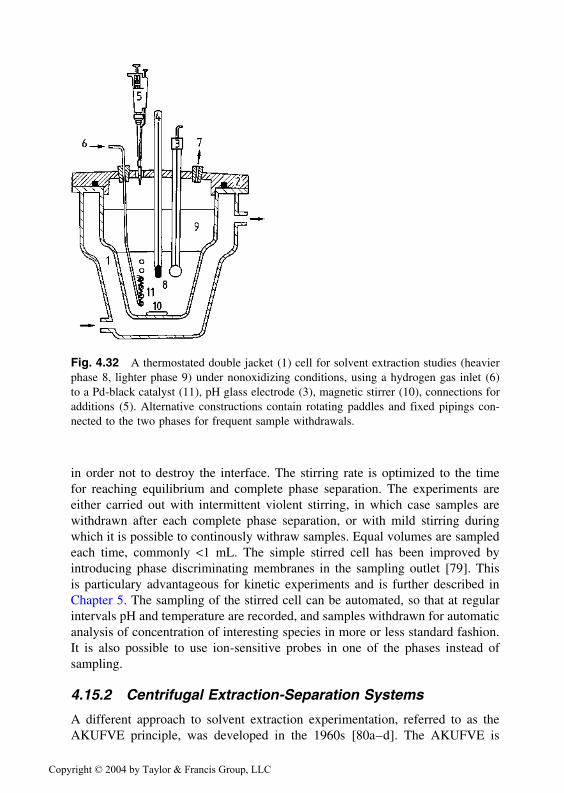
Fig. 4.32 A thermostated double jacket (1) cell for solvent extraction studies (heavierphase 8, lighter phase 9) under nonoxidizing conditions, using a hydrogen gas inlet (6)to a Pd-black catalyst (11), pH glass electrode (3), magnetic stirrer (10), connections foradditions (5). Alternative constructions contain rotating paddles and fixed pipings con-nected to the two phases for frequent sample withdrawals.
in order not to destroy the interface. The stirring rate is optimized to the timefor reaching equilibrium and complete phase separation. The experiments areeither carried out with intermittent violent stirring, in which case samples arewithdrawn after each complete phase separation, or with mild stirring duringwhich it is possible to continously withraw samples. Equal volumes are sampledeach time, commonly <1 mL. The simple stirred cell has been improved byintroducing phase discriminating membranes in the sampling outlet [79]. Thisis particulary advantageous for kinetic experiments and is further described inChapter 5. The sampling of the stirred cell can be automated, so that at regularintervals pH and temperature are recorded, and samples withdrawn for automaticanalysis of concentration of interesting species in more or less standard fashion.It is also possible to use ion-sensitive probes in one of the phases instead ofsampling.
4.15.2 Centrifugal Extraction-Separation Systems
A different approach to solvent extraction experimentation, referred to as theAKUFVE principle, was developed in the 1960s [80a–d]. The AKUFVE is
Copyright © 2004 by Taylor & Francis Group, LLC
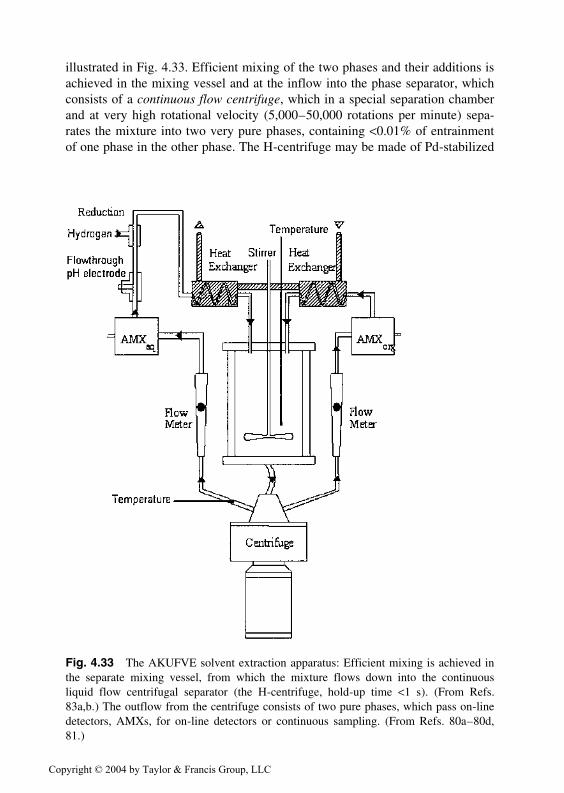
illustrated in Fig. 4.33. Efficient mixing of the two phases and their additions isachieved in the mixing vessel and at the inflow into the phase separator, whichconsists of a continuous flow centrifuge, which in a special separation chamberand at very high rotational velocity (5,000–50,000 rotations per minute) sepa-rates the mixture into two very pure phases, containing <0.01% of entrainmentof one phase in the other phase. The H-centrifuge may be made of Pd-stabilized
Fig. 4.33 The AKUFVE solvent extraction apparatus: Efficient mixing is achieved inthe separate mixing vessel, from which the mixture flows down into the continuousliquid flow centrifugal separator (the H-centrifuge, hold-up time <1 s). (From Refs.83a,b.) The outflow from the centrifuge consists of two pure phases, which pass on-linedetectors, AMXs, for on-line detectors or continuous sampling. (From Refs. 80a–80d,81.)
Copyright © 2004 by Taylor & Francis Group, LLC

Ti, or PEEK (polyether ether ketone) to allow measurements under very corro-sive conditions. The separated phases pass AMX gadgets for on-line detection(radiometric, spectrophotometric, etc.) or phase sampling for external measure-ments (atomic absorption, spectrometric, etc.), depending on the system studied.The aqueous phase is also provided with cells for pH measurement, redox con-trol (e.g., by reduction cells using platinum black and hydrogen, metal ion deter-mination, etc.) and temperature control (thermocouples).
The AKUFVE technique allows a large number of points (50–100) to bedetermined in a one-day experiment over a D-range of better than 103 to 10−3,not counting time of preparation. In a special version of this technique (LISOLfor LIquid Scintillation On Line) [82], the D range 10−5 to 104 has been accu-rately covered, as for the Pm-acetylacetone system, Example 7 and Fig. 4.14.
The centrifugal separator of the AKUFVE system is also used for phaseseparation in the SISAK technique [84]. SISAK is a multistage solvent extrac-tion system that is used for studies of properties of short-lived radionuclides,e.g., the chemical properties of the heaviest elements, and solvent extractionbehavior of compounds with exotic chemical states. In a typical SISAK experi-ment, Fig. 4.34, radionuclides are continuously transported from a production
Fig. 4.34 A typical SISAK setup used for studies of α-decaying nuclides, e.g., trans-actinides. (From Ref. 84.)
Copyright © 2004 by Taylor & Francis Group, LLC
site in an accelerator or a research reactor to the SISAK equipment via a gas-jet transport system. The nuclides are dissolved in an aqueous phase that is fedinto a centrifuge battery comprising 1–4 solvent extraction steps. The productsolution leaving the last step is pumped, e.g., to a nuclear radiation detectionsystem. The transport time from the target site to the detection system dependson the centrifuge size, number of centrifuge steps, and flow rate. For a one-stepchemistry, i.e., dissolution step and a single centrifuge extraction, and maximumflow rates, the overall transport time is around 2.5 s. This fast transport hasallowed detailed γ-spectroscopic studies of radionuclides with half-lives around1 s. Recently the SISAK equipment was succesfully applied to studies of theheaviest elements, and solvent extraction data were obtained for element 104 Rf[85]. Fast chemical separation systems have been developed for quite a largenumber of elements [86].
Centrifugal extractors have been designed for a number of industrial uses(see succeeding chapters). In some cases they have been scaled down to labora-tory size but mainly been used for developing industrial multistage processes.
4.15.3 Liquid Partition Chromatography
In liquid partition chromatography a solute distributes itself between a mobileliquid phase and an immobile solvent attached to a solid matrix (in the earliestexperiments a claylike kieselguhr). It is outside the scope of this chapter todiscuss this technique, which, however, is briefly described in Chapter 15.
4.16 CONCLUSION AND FINAL COMMENTS
The solvent extraction process is usually described by a single net reaction,defined by the extraction constant Kex. Variations in Kex caused by modificationsof the solvent system, such as changes in the temperature or aqueous ionicstrength, or by replacing one solvent by another, or making substitutions in theextractant molecule, may be explained by careful consideration of the parame-ters of the system. However, such studies are difficult and not always sufficientfor predicting new systems. A better foundation for understanding the extractionprocess is to consider the steps in the process contributing to the net extractionreaction, particularily when these steps are governed by regularities. Knowledgeof these regularities helps in interpreting systems as well as in predicting newones. Extension of these distribution data to thermodynamic constants is likelyto give benefits in increased chemical knowledge of the behavior of solutes indifferent solvent systems. Advanced quantum chemistry calculations and com-puter modeling of extraction processes can help us in designing new, selectivesolvent extraction systems, as well as in interpreting extraction phenomena (seeChapter 16).
Copyright © 2004 by Taylor & Francis Group, LLC
REFERENCES
1. Grahame, D. C.; Seaborg, G. T. J. Am. Chem. Soc. 1938, 60:2524.2. Irving, H. p. 91, ISEC’66, Solvent Extraction Chemistry Dyrssen, D.; Liljenzin,
J. O.; Rydberg, J. Eds.; North Holland, Amsterdam (1967).3a. Rydberg, J. Arkiv Kemi 1954, 8:101.3b. Rydberg, J. Rec. Trav. Chim. 1956, 75:737.4. Sekine, T.; Hasegawa, Y. Solvent Extraction Chemistry, Marcel Dekker, New
York, 1977.5. Marcus, Y.; Kertes, S. Ion Exchange and Solvent Extraction of Metals, Wiley-
Interscience, Chichester, 1969.6. Barton, A. F. M. CRC Handbook of Solubility Parameters and Other Cohesion
Parameters, CRC Press, 1991.7. Kojima, I.; Yoshida, M.; Tanaka, M. J. Inorg. Nucl. Chem. 1970, 32:987.8a. Dyrssen, D. Svensk Kem. Tidskr. 1956, 68:212.8b. Dyrssen, D. Svensk Kem. Tidskr. 1952, 64:213.9. Sekine, T. et al. Bull. Chem. Soc. Jap. 1983, 56:700.
10. Rydberg, J. Svensk Kem. Tidskr. 1950, 62:179.11a. Sekine, T.; Isayama, M.; Yamaguchi, S.; Moriya, H. Bull. Chem. Soc. Jap. 1967,
40:27.11b. Dyrssen, D. Private communication. See also Acta Chem. Scand. 1960, 14:1091.12. Ahrland, S.; Liljenzin, J. O.; Rydberg, J. The Chemistry of the Actinides. In Com-
prehensive Inorganic Chemistry, Pergamon Press, London, 1973.13. Jassim, T. M.; Fridemo, L.; Liljenzin, J. O. in T. M. Jassim, Co-Extraction of
Pertechnetate with some Metal Nitrates in TBP-Nitric Acid Systems. Diss. Chal-mers Techn. Univ., Gothenburg (1986).
14. Martell, A. E.; Calvin, M. Chemistry of the Metal Chelate Compounds, Prentice-Hall, Englewood Cliffs, N.J., 1952.
15. Stary, J. The Solvent Extraction of Metal Chelates, Pergamon Press, New York,1964.
16. Zolotov, Yu. Extraction of Chelate Compounds, Humprey Sci. Publ., Ann Arbor,London, 1970.
17a. Narbutt, J. J. Inorg. Nucl. Chem. 1981, 43:3343.17b. Narbutt, J. J. Phys. Chem. 1991, 95:3432.17c. Narbutt, J.; Fuks, L. Radiochimca Acta 1997, 78:27.18. Liljenzin, J. O.; Stary, J.; Rydberg, J. ISEC’68, Solvent Extraction Research,
Kertes, A. S.; Marcus, Y., Eds., J. Wiley and Sons, New York, 1969.19. Sillen, L. G.; Martell, A.; Hogfeldt, E., Eds., Stability Constants of Metal-Ion Com-
plexes. The Chemical Society Spec. Publ. No. 25, Burlington House, London, 1971.20. Martell, A. E.; Smith, R. M. Critical Stability Constants, Vol. 1–5, Plenum Press,
New York 1974–1982.21. Marcus, Y.; Kertes, A. S.; Yanir, E. Equilibrium Constants of Liquid-liquid Distri-
bution Reactions, Part 1, Butterworths, London, 1974.22. Sekine, T.; Dyrssen, D. J. Inorg. Nucl. Chem. 1964, 26:1727.23a. Allard, B.; Johnsson, S.; Rydberg, J. ISEC’74, Proc. Int. Solvent Extraction Conf.,
Lyon, 1974.
Copyright © 2004 by Taylor & Francis Group, LLC

23b. Allard, B.; Johnsson, S.; Narbutt, J; Lundquist, R. ISEC ‘77, CIM Special Volume21, 1977.
24. Sekine, T.; Ihara, N. Bull. Chem. Soc. Jap. 1971, 44:2942.25. Cecconie, T.; Freiser, H. Anal. Chem. 1990, 62:622.26. Moryia, H.; Sekine, T. Bull. Chem. Soc. Jap. 1971, 44:3347.27a. Rydberg, J.; Albinsson, Y. J. Solv. Extr. Ion Exch. 1989, 7:577.27b. Albinsson, Y.; Rydberg, J. Radiochim. Acta 1989, 48:49.27c. Albinsson, Y. Acta Chem. Scand. 1989, 43:919.28. Albinsson, Y. Development of the AKUFVE-LISOL Technique. Solvent Extraction
Studies of Lanthanide Acetylacetonates. Diss. Chalmers Univ. Techn., Gothenburg(1988).
29. Van Ooyen, J.; Dyrssen, D.; Liljenzin, J. O.; Rydberg, J. (Eds.) Solvent ExtractionChemistry (ISEC 1966), North-Holland Publ. Co., Amsterdam, 1967.
30a. Sekine. T.; Dyrssen, D. Anal. Chim. Acta 1969, 45:433.30b. Sekine, T.; Fukushima, T.; Hasegawa, Y. Bull. Chem. Soc. Japan 1970, 43:2638.31. Sekine, T.; Sakairi, M. Bull. Chem. Soc. Jap. 1967, 40:261.32. Liljenzin, J. O.; Vadasdi, K.; Rydberg, J. Coordination Chemistry in Solution Hog-
feldt, E. Swedish Nat. Res. Council; Trans.Roy. Inst.Techn., 280, Stockholm, 1972.33a. Rydberg, J. Rev. Inorg. Chem. 1999, 19:245.33b. Rydberg, J. Min. Pro. Ext. Met. Rev. 2000, 21:167.34. Carey, F. A.; Sundberg, R. J. Advanced Organic Chemistry, Third Edition, Plenum
Press, New York, 1990.35. Fuks, L.; Majdan, M. Min. Pro. Ext. Met. Rev. 2000, 21:25.36. Allard, B. The Coordination of Tetravalent Actnide Chelate Complexes with β-
Diketones, Diss. Chalmers Univ. Techn. Gothenburg, 1975.37. Hildebrand, J. H.; Scott, R. C. Solubilities of Nonelectrolytes, Dover Publishers,
1964.38a. Siekierski, S. J. Inorg. Nucl. Chem. 1962, 24:205.38b. Siekierski, S.; Olszer, R. J. Inorg. Nucl. Chem. 1963, 24:1351.39. Buchowski, H. Nature 1962, 194:674.40a. Wakahayashi, T.; Oki, S.; Omori, T.; Suzuki, N. J. Inorg. Nucl. Chem. 1964, 26:
2255.40b. Omori, T.; Wakahayashi, T.; Oki, S.; Suzuki, N. J. Inorg. Nucl. Chem. 1964, 26:
2265.40c. Oki, S.; Omori, T.; Wakahayashi, T.; Suzuki, N. J. Inorg. Nucl. Chem. 1965, 27:
1141.41. Irving, H. M. N. H. Ion Exchange and Solvent Extraction, Vol. 6, (Marinsky, J.;
Marcus, Y. Eds.) Marcel Dekker, New York, 1973.42. Siekierski, S. J Radioanal. Chem. 1976, 73:335.43. Hansen, C.; Skaaup, K. Dansk Kemi 1967, 48:81.44. Hansen, C. Hansen Solubility Parameters: A Users Handbook, CRC Press, 2000.45. Nilsson, M. Influence of Organic Phase Composition on the Extraction of Trivalent
Actinides, Dipl. work, Dept. Nucl. Chem., Chalmers Univ. of Techn., Gothenburg,2000.
46. Johansson, H.; Rydberg, J. Acta Chem. Scand. 1969, 23:2797.47. Hancock, R. D.; Martell, A. Chem. Rev., 1989, 89:1875–1913.
Copyright © 2004 by Taylor & Francis Group, LLC

48. Hancock, R. D. Prog.Inorg.Chem. 1989, 36:187–290.49. CambridgeSoft Corp., 100 Cambridge Park Drive, Cambridge, Mass. (1999).50. Siddall, T. H., III; Good, M. L. J. Inorg. Nucl. Chem. 1967, 29:149.51. Charbonnel, M. C.; Musikas, C. Solv. Extr. Ion Exch. 1989, 7:1007.52. Musikas, C.; Hubert, H. Solv. Extr. Ion Exch. 1987, 5:877.53a. Narbutt, J.; Krejzler, J. Inorg. Chim. Acta 1999, 286:175.53b. Narbutt, J.; Czerwinski, M.; Krejzler, J. Eur. J. Inorg. Chem. 2001, 3187 pp.54. Handley, T. H.; Dean, J. A. Anal. Chem. 1962, 35:1312.55. Patee, D.; Musikas, C.; Faure, A.; Chachaty, C. J. Less Common Metals 1986, 122:
295.56. Handley, T. H. Anal. Chem. 1963, 35:991.57. Schultz, W. W.; Navratil, J. (Eds.), Science and Technology of TBP, Vol. 1, CRC
Press, Boca Raton, (1984).58. Condamines, N. Commissariat l’Energie Atomique, Report R5519, 1990.59. Spjuth, L. Solvent Extraction Studies with Substituted Malonamides and Oligopyri-
dines, Diss. Chalmers Univ. Techn., Gothenburg, 1999.60. Rossotti, F. J. C.; Rossotti, H. Determination of Stability Constants, McGraw Hill,
New York, 1961.61. Froneus, S. Technique of Inorganic Chemistry (Jonassen, H. B.; Weissberger, A.,
Eds.) Wiley-Interscience, Chichester, 1963.62. Beck, M. T. Chemistry of Complex Equilibria, Van Nostrand Reinhold, New York,
1970.63. Hartley, F. R.; Burgess, C.; Alcock, R. Solution Equilibria, Ellis Hoorwood, John
Wiley and Sons, New York, 1980.64. Meloun, M.; Havel, J.; Hogfeldt, E. Computation of Solution Equilibria, John Wi-
ley Sons, New York, 1988.65. Bjerrum, J. Metal Amine Formmation in Aqueous Solutions, Diss. Copenhagen,
1941.66a. Rydberg, J. Acta Chem. Scand. 1950, 4:1503.66b. Rydberg, J. Arkiv Kemi 1953, 5:413.67. Irving, H.; Williams, R. J. P.; Rossotti, F. J. C. J. Chem. Soc. 1955, 1955:1906.68. Dyrssen, D.; Sillen, L. G. Acta Chem. Scand. 1953, 7:663.69. Rydberg, J. Arkiv Kemi 1954, 8:113.70. Deming, W. E. Statistical Adjustment of Data, John Wiley and Sons, NewYork,
1948.71. Fisher, R. A. Statistical Methods for Research Workers, Hafner Publishing, New
York, 1958.72a. Sullivan, J. C.; Rydberg, J.; Miller, W. F. Acta Chem. Scand. 1959, 13:2023.72b. Rydberg, J. Acta Chem. Scand. 1960, 14:57.72c. Rydberg, J. Acta Chem. Scand. 1961, 15:1723.73a. Sillen, L. G. Acta Chem. Scand. 1962, 16:159.73b. Liem, D. H. Acta Chem. Scand. 1971, 25:1521.73c. Liem, D. H. Acta Chem. Scand. 1979, A33:481.74. Dixon, L. C. W. Nonlinear Optimization, English University Press, 1972.75. Albinsson, Y.; Mahmood, A.; Majdan, M.; Rydberg, J. Radiochim. Acta 1989, 48:49.
Copyright © 2004 by Taylor & Francis Group, LLC

76. Meinrath, G.; Ekberg, C.; Landgren, A.; Liljenzin, J. O. Talanta, 2000, 51:231.77. Rydberg, J.; Sullivan, J. Acta Chem. Scand. 1959, 13:2057.78. Ekberg, Ch. Uncertainties in Actinide Solubility Calculations Illustrated Using the
Th−OH−PO4 System, Diss. Chalmers tekniska hogskola, Goteborg, 1999.79. Watari, H.; Cunningham, L.; Freiser, H. Anal. Chem. 1982, 54:2390.80a. Reinhardt, H.; Rydberg, J. Solvent Extraction Chem. (ISEC) 1966, North-Holland
Publ. Co. Amsterdam, 612 pp.80b. Reinhardt, H.; Rydberg, J. Chem. Ind. 1970, 488 pp.80c. Rydberg, J., et al. Acta Chem. Scand. 1969, 23:647.80d. Rydberg, J., et al., Acta Chem., 1969, 2773, 2781, 2797 pp.81. MEAB Metal Extraction Co Ltd, V. Frolunda, Sweden.82. Albinsson, Y.; Ohlsson, L. E.; Persson, H.; Rydberg, J. Appl. Radiat. Isot. 1988,
39:113.83a. Rydberg, J.; Reinhardt, H. Centrifuge for complete phase separation of two liquids,
U.S.Patent 3,442,445, 1966.83b. Reinhardt, H. En kontinuerlig separator for tva-fas vatskeblandningar, Diss. Chal-
mers Univ. Techn., Gothenburg, 1973.84. Persson, H.; Skarnemark, G.; Skalberg, M.; Alstad, J.; Liljenzin, J. O.; Bauer, G.;
Heberberger, F.; Kaffrell, N.; Rogowski, J.; Trautmann, N. Radiochim. Acta 1989,48:177.
85. Skarnemark, G., et al., J. Nucl. Radiochem. Sci. 2002, 3:1.86. Skarnemark, G. J. Radioanl. Nucl. Chem. 2000, 243(1):219.
Copyright © 2004 by Taylor & Francis Group, LLC