vanadium : leaching and solvent extraction
TRANSCRIPT

Vanadium : leaching and solvent extraction
by
Mohammadreza Tavakolikhaledi
B. Sc., Sharif University of Technology, 2005
M. Sc., Sharif University of Technology, 2007
A THESIS SUBMITTED IN PARTIAL FULFILLMENT OF
THE REQUIREMENTS FOR THE DEGREE OF
DOCTOR OF PHILOSOPHY
in
The Faculty of Graduate and Postdoctoral Studies
(Materials Engineering)
THE UNIVERSITY OF BRITISH COLUMBIA
(Vancouver)
May 2014
© Mohammadreza Tavakolikhaledi, 2014

ii
Abstract
The fundamental understanding of vanadium hydrometallurgy was developed in three
phases: vanadium (V) leaching, vanadium (III) oxidative leaching, and solvent extraction
of vanadium (V&IV).
In the first section, V2O5 leaching was studied in three steps. First, vanadium leaching
and solubility of VO2+ at different pH’s and temperatures were investigated in sulfuric
acid. Secondly, the kinetics of vanadium leaching in pH 5 and pH 8 solutions, and the
reductive leaching of vanadium pentoxide using sodium sulfite were studied. It was
shown that the kinetics of acid leaching is rapid but suffers from low solubility of VO2+
in solution. Thirdly, the shrinking sphere model was employed to analyze the kinetics of
reductive leaching.
In the second step, V2O3 oxidative leaching was studied from 30°C to 90°C in sulfuric
acid. This study has also been done in three different sections. First, the kinetics of
oxidative leaching using oxygen was investigated. It was shown that this oxidative
leaching is chemical reaction rate controlled with an activation energy of 69 kJ/mol. In
the next step, it was shown that the presence of ferric enhanced kinetics significantly.
Finally, oxidative leaching using a constant ferric-ferrous ratio from 1 to 300 was studied.
The addition of KMnO4 solution to the leach reactor was found to be a suitable oxidant
for controlling solution potential. The oxidation rate using the constant ferric-ferrous ratio
was very sensitive to temperature, with a large activation energy (38 kJ/mol) and the rate
was proportional to the Fe(III)/Fe(II) concentration to the power of 0.47.

iii
In the third part, purification of synthetic vanadium-containing solutions using the solvent
extraction technique was investigated. Various solvent extractants have been tested for
vanadium recovery from acid leachates. One of the biggest problems for purification of
the vanadium solution is iron separation. Therefore, this research assesses selectivity of
vanadium over iron. The extraction of vanadium (V&IV), iron (III&II) with phosphinic
acid (CYANEX 272), phosphonic acid (IONQUEST 801), phosphoric acid (D2EHPA)
and phosphine oxide (CYANEX 923) extractants is reported. In addition, the extraction
reactions for vanadium (V) and (IV) extraction using CYANEX 923 and D2EHPA were
also studied.

iv
Preface
This research work was conducted as a part of an NSERC grant awarded to The University of
British Columbia. The journal papers listed below have been prepared from work presented
in the dissertation. I am the primary contributor for all of them, and the contributing co-
authors are as follows: Dr. David Dreisinger (supervisor) and Scott Dornian who contributed
to the first paper as a coop student in the summer of 2012. Chapter 4, 5 and 6 of this thesis
are based on paper 1, 2 and 3 respectively.
1- Tavakoli, M. R., Dornian, S. and Dreisinger, D. B., 2014. The leaching of
vanadium pentoxide using sulfuric acid and sulfite as a reducing agent,
Hydrometallurgy 141, 59-66.
2- Tavakoli, M. R. and Dreisinger, D. B., 2014. The kinetics of oxidative leaching of
vanadium trioxide”, Hydrometallurgy (Hydrometallurgy, In Press, Accepted).
3- Tavakoli, M. R. and Dreisinger, D. B., 2014. Separation of vanadium from iron
by solvent extraction using acidic and neutral organophosphorus extractants,
Hydrometallurgy 141, 17-23.

v
Table of Contents
Abstract ...................................................................................................................................... ii
Preface ....................................................................................................................................... iv
Table of Contents .......................................................................................................... v
List of Tables ................................................................................................................ ix
List of Figures ................................................................................................................ x
Nomenclature ......................................................................................................................... xiv
Acknowledgments .................................................................................................................. xvi
Dedication .............................................................................................................................. xvii
1 Introduction ............................................................................................................... 1
1.1 History ........................................................................................................................... 2
1.2 Properties of vanadium ............................................................................................... 3
1.3 Primary and secondary sources and vanadium products ........................................ 3
2 Literature review ...................................................................................................... 6
2.1 Aqueous chemistry ....................................................................................................... 7
2.2 Leaching and metallurgical processes ...................................................................... 12
2.2.1 Roasting ................................................................................................................... 13
2.2.2 Leaching .................................................................................................................. 16
2.2.2.1 Oil and combustion ashes .............................................................................................16
2.2.2.2 Spent catalysts ..............................................................................................................21
2.2.2.3 Kinetic studies ..............................................................................................................26
2.2.3 Summary .................................................................................................................. 27
2.3 Separation and purification: solvent extraction ...................................................... 31
2.3.1 Solvent extraction of vanadium in industry ............................................................. 31
2.3.2 Recent researches..................................................................................................... 31

vi
2.3.2.1 Solvent extraction using cation extractants ..................................................................31
2.3.2.2 Solvent extraction using anion extractants ...................................................................41
2.3.2.2.1 Problems with using amines ....................................................................................47
2.4 Summary ..................................................................................................................... 47
2.5 Objectives .................................................................................................................... 48
3 Experimental ........................................................................................................... 49
3.1 Leaching ...................................................................................................................... 50
3.1.1 Vanadium (V) .......................................................................................................... 50
3.1.1.1 Material ........................................................................................................................50
3.1.1.2 Experimental procedure ...............................................................................................50
3.1.2 Vanadium (III) ......................................................................................................... 52
3.1.2.1 Material ........................................................................................................................52
3.1.2.2 Experimental procedure ...............................................................................................52
3.2 Solvent extraction ....................................................................................................... 54
3.2.1 Materials .................................................................................................................. 54
3.2.2 Experimental procedure ........................................................................................... 55
3.3 Magnitude of errors in the experiments ................................................................... 56
4 Vanadium (V) leaching ........................................................................................... 58
4.1 Thermodynamics of the vanadium –water system .................................................. 59
4.2 Solubility ..................................................................................................................... 60
4.3 Leaching of vanadium in pH 5-8 solution ................................................................ 68
4.4 Reductive leaching ..................................................................................................... 70
4.4.1 Effect of temperature ............................................................................................... 72
4.4.2 Effect of particle size ............................................................................................... 76
4.4.3 Effect of stirring speed............................................................................................. 77
4.4.4 Effect of sodium sulfite concentration ..................................................................... 79

vii
4.4.5 Effect of pH ............................................................................................................. 82
4.4.6 Chemistry and electrochemistry of the reaction ...................................................... 83
5 Vanadium (III) leaching ......................................................................................... 88
5.1 V2O3 leaching using oxygen ....................................................................................... 89
5.1.1 Effect of particle size ............................................................................................... 94
5.1.2 Effect of stirring speed............................................................................................. 95
5.1.3 Effect of sulfuric acid concentration ........................................................................ 97
5.2 V2O3 leaching using oxygen and ferric ................................................................... 100
5.2.1 Effect of initial ferric concentration....................................................................... 101
5.2.2 Effect of temperature ............................................................................................. 101
5.2.3 Effect of pH ........................................................................................................... 102
5.3 Vanadium trioxide leaching using ferric-ferrous solutions .................................. 103
5.3.1 Effect of temperature ............................................................................................. 104
5.3.2 Effect of particle size ............................................................................................. 107
5.3.3 Effect of ferric-ferrous ratio ................................................................................... 108
6 Solvent extraction.................................................................................................. 114
6.1 Extraction of vanadium (V) in the presence of iron (III) ..................................... 115
6.1.1 Effect of pH value on selectivity ........................................................................... 115
6.1.2 Effect of contact time............................................................................................. 116
6.1.3 Vanadium (V) extraction mechanism using CYANEX 923 .................................. 117
6.1.4 Stripping vanadium from CYANEX 923 .............................................................. 121
6.1.5 Role of sulfate on vanadium (V) solvent extraction .............................................. 123
6.2 Extraction of vanadium (IV) in the presence of iron (III) .................................... 124
6.2.1 Effect of pH on selectivity ..................................................................................... 124
6.3 Extraction of vanadium (IV) in the presence of iron (II) ..................................... 124

viii
6.3.1 Effect of pH on selectivity ..................................................................................... 124
6.3.2 Vanadium (IV) extraction mechanism using D2EHPA ......................................... 127
7 Conclusions and recommendations for future work ......................................... 130
7.1 Conclusions ............................................................................................................... 131
7.2 Recommendations for future work......................................................................... 134
References ...................................................................................................................... 136

ix
List of Tables
Table 1.1. Physical properties of vanadium ........................................................................ 3
Table 1.2. Vanadium world annual production (metric tonne) by country ........................ 5
Table 2.1. Characteristics of some vanadium species in aqueous solutions ....................... 9
Table 2.2. Thermodynamic data for aqueous vanadium species at standard state ........... 11
Table 2.3. Roasting condition for vanadium recovery ...................................................... 15
Table 2.4. The analysis of the used ashes ......................................................................... 19
Table 2.5. Percentage of materials dissolved on water leaching of roasted catalysts ....... 23
Table 2.6. Summary of Vanadium leaching studies ......................................................... 29
Table 2.7. Scrub of V, Fe, and Al from the loaded solvent .............................................. 35
Table 2.8. Strip of Mo from the scrubbed solvent (CYANEX272) .................................. 36
Table 2.9. Strip of vanadium from loaded solvent (CYANEX272) ................................. 37
Table 2.10. Stripping of vanadium from TOMAC and TOA solutions with various
aqueous media ................................................................................................................... 38
Table 2.11. Influence of stripping agent and concentration on vanadium stripping from
loaded organic phase ......................................................................................................... 45
Table 2.12. Extraction of V (V) 1 g/L from alkaline NaOH solution (pH 12.8) using
various extractants ............................................................................................................ 46
Table 3.1. Chemicals used and composition of the synthetic feed solution ...... 54
Table 4.1. Thermodynamic data for equation 4.1 ............................................................. 64
Table 5.1. Thermodynamics data for reaction 5.1 ............................................................ 89
Table 5.2. Thermodynamic data for reaction 5.3 ............................................................ 100
Table 6.1. Strip of Vanadium (V) from the loaded solvent ............................................ 123
Table 6.2. Strip of Vanadium (IV) from the loaded solvent ........................................... 129

x
List of Figures
Figure 1.1. Consumption of vanadium in various end use categories ................................ 2
Figure 2.1. Stability relationships of vanadium ions and the compounds in aqueous media
at 25℃ ................................................................................................................................. 8
Figure 2.2. Vanadium species in water as a function of pH with a total VO2+
concentration of 14.3 mM ................................................................................................. 10
Figure 2.3. Treatment of vanadium raw materials ............................................................ 12
Figure 2.4. Extraction yield of vanadium versus the molarity of the H2SO4 leaching
solution at room (white circles) and boiling temperature (black circles) with a liquid/solid
ratio of 3 mL/g .................................................................................................................. 19
Figure 2.5. Metallurgical processes for spent HDS catalysts involving acid leaching ..... 23
Figure 2.6. Metallurgical processes for spent HDS catalysts involving caustic leaching 24
Figure 2.7. Chemical structures and pKa values of the commercial extractants .............. 32
Figure 2.8. Percentage of extraction of metals from sulfate solutions as a function of
equilibrium pH with 20% CYANEX 272 dissolved in Exxsol D80 ................................. 33
Figure 2.9. Percentage of extraction of metals from sulfate solutions as a function of
equilibrium pH with 20% PIA-8 dissolved in Exxsol D80............................................... 33
Figure 2.10. Percentage of extraction of metals from sulfate solutions as a function of
equilibrium pH with 20% PC-88A dissolved in Exxsol D80 ........................................... 34
Figure 2.11. Percentage of extraction of metals from sulfate solutions as a function of
equilibrium pH with 20% TR-83 dissolved in EXXSOL D80 ......................................... 34
Figure 2.12. Effect of the solution pH on the percent extraction of vanadium from
Na2CO3-synthesized solution; TOA (tri-n-octylamine), TOMAC (tri-n-
octylmethylammonium chloride) ...................................................................................... 38
Figure 2.13. pH dependence on the extraction of individual metal ions from sulfuric acid
solutions by 20 vol% LIX63 dissolved in Exxsol 80 ........................................................ 40
Figure 2.14. Effect of pH on the extraction of metal values with 0.5M LIX63 in Shellsol
D70 at an A/O ratio of 1:1 and 40℃ ................................................................................. 41
Figure 2.15. Effect of pH on the solvent extraction of V(V) ............................................ 43
Figure 2.16. pH influence of vanadium extraction for different extractants .................... 44

xi
Figure 2.17. Effect of Aliquat-336 concentration on the extraction of Vanadium (1 g/L)
from 3 M HCl solution at 25°C and phase ratio O/A=1 ................................................... 46
Figure 3.1. The experimental set up for solvent extraction tests ...................................... 56
Figure 4.1. Speciation of vanadium (V) in aqueous media at 25℃ .................................. 59
Figure 4.2. The effect of solid to liquid ratio on V2O5 leaching; (a) vanadium extraction,
(b) vanadium molarity....................................................................................................... 61
Figure 4.3. The effect of pH on vanadium leaching at 30°C ............................................ 62
Figure 4.4. The effect of pH on vanadium leaching at 50°C ............................................ 62
Figure 4.5. The effect of pH on Vanadium leaching at 70°C ........................................... 63
Figure 4.6. The effect of pH on vanadium leaching at 90°C ........................................... 63
Figure 4.7. The effect of different solvent and adding different salts on vanadium
solubility .......................................................................................................................... 66
Figure 4.8. Raman spectra for vanadium solution to confirm vanadium complexation in
the presence of sulfate ....................................................................................................... 67
Figure 4.9. The effect of temperature on vanadium leaching ........................................... 68
Figure 4.10. The effect of temperature on vanadium leaching ......................................... 70
Figure 4.11. The effect of temperature on vanadium reductive leaching ......................... 72
Figure 4.12. (a) Plot of ))1(1( 3
1
X versus time for various temperature test; (b) Plot of
))1(1( 3
2
X versus time for various temperature tests ........................................................ 74
Figure 4.13. Arrhenius plot for activation energy calculation for reductive leaching ...... 75
Figure 4.14. SEM image for (a) the initial particle; (b) after 20 minutes of leaching at
30°C; (c) after 20 minutes of leaching at 90°C ................................................................. 76
Figure 4.15. The effect of particle size on vanadium reductive leaching ......................... 77
Figure 4.16. (a) Plot of ))1(1( 3
1
X versus time for various particle sizes (b) The effect of
particle size on the rate of dissolution of vanadium ......................................................... 78
Figure 4.17. The effect of stirring speed on vanadium reductive leaching ....................... 79
Figure 4.18. The effect of sulfite concentration on vanadium reductive leaching ........... 80
Figure 4.19. Plot of ))1(1( 3
1
X versus time for various sulfite concentration tests .......... 81
Figure 4.20. The effect of initial sulfite concentration on the rate of dissolution of
vanadium ........................................................................................................................... 81

xii
Figure 4.21. The effect of pH on vanadium reductive leaching ....................................... 82
Figure 4.22. Plot of ))1(1( 3
1
X versus time for various pH ............................................... 87
Figure 5.1. The effect of temperature on vanadium leaching ........................................... 90
Figure 5.2. (a) Plot of ))1(1( 3
1
X versus time for various temperature test; (b) Plot of
))1(1( 3
2
X versus time for various temperature test ......................................................... 93
Figure 5.3. Arrhenius plot for activation energy calculation for oxidative leaching using
oxygen ............................................................................................................................... 94
Figure 5.4. The effect of particle size on the rate of vanadium oxidative leaching .......... 95
Figure 5.5. (a) Plot of ))1(1( 3
1
X versus time for various particle sizes (b) The effect of
particle size on the rate of dissolution of vanadium ......................................................... 96
Figure 5.6. The effect of stirring speed on vanadium oxidative leaching ......................... 97
Figure 5.7. The effect of sulfuric acid concentration on vanadium oxidative and non
oxidative leaching ............................................................................................................. 98
Figure 5.8. (a) Plot of ))1(1( 3
1
X versus time for various particle sizes; (b) The effect of
particle size on the rate of dissolution of vanadium ......................................................... 99
Figure 5.9. The effect of initial ferric concentration on the kinetics of vanadium oxidative
leaching ........................................................................................................................... 101
Figure 5.10. The effect of temperature on vanadium oxidative leaching ....................... 102
Figure 5.11. The effect of temperature on vanadium oxidative leaching ....................... 105
Figure 5.12. (a) Plot of ))1(1( 3
1
X versus time for various temperature tests; (b) Plot of
))1(1( 3
2
X versus time for various temperature test ....................................................... 106
Figure 5.13. Arrhenius plot for activation energy calculation ........................................ 107
Figure 5.14. The effect of particle size on the rate of vanadium oxidative leaching ...... 108
Figure 5.15. (a) Plot of ))1(1( 3
1
X versus time for various particle sizes; (b) The effect of
particle size on the rate of dissolution of vanadium ....................................................... 109
Figure 5.16. The effect of ferric/ferrous ratio on vanadium oxidative leaching ............. 110
Figure 5.17. (a) Plot of ))1(1( 3
1
X versus time for various particle; (b) The vanadium
dissolution rate dependence of ferric/ferrous ratio ......................................................... 111

xiii
Figure 5.18. The effect of stirring speed on vanadium oxidative leaching ..................... 112
Figure 5.19. Effect of pH on vanadium oxidative leaching ............................................ 113
Figure 6.1. Extraction of V (V) and Fe (III) from sulfate solution as a function of
equilibrium pH with 5% D2EHPA & IONQUEST 801 dissolved in SX-ORFOM12 ... 115
Figure 6.2. Percentage of extraction of V (V) and Fe (III) from sulfate solution as a
function of equilibrium pH with 5% CYANEX 272 & CYANEX 923 dissolved in SX-
ORFOM12 ...................................................................................................................... 116
Figure 6.3. Effect of mixing time on the extraction yield of vanadium with 40%
CYANEX 923 in SX-ORFOM 12 at pH 2 ..................................................................... 117
Figure 6.4. Effect of CYANEX 923 concentration on vanadium extraction .................. 118
Figure 6.5. Percentage of extraction of V (IV) and Fe (III) from sulfate solution as a
function of equilibrium pH with 5% D2EHPA & IONQUEST 801 dissolved in SX-
ORFOM12 ...................................................................................................................... 125
Figure 6.6. Percentage of extraction of V (IV) and Fe (III) from sulfate solution as a
function of equilibrium pH with 5% CYANEX 272 & CYANEX 923 dissolved in SX-
ORFOM12 ...................................................................................................................... 125
Figure 6.7. Percentage of extraction of V (IV) and Fe (II) from sulfate solution as a
function of equilibrium pH with 5% D2EHPA & IONQUEST 801 dissolved in SX-
ORFOM12 ...................................................................................................................... 126
Figure 6.8. Percentage of extraction of V (IV) and Fe (II) from sulfate solution as a
function of equilibrium pH with 5% CYANEX 272 & CYANEX 923 dissolved in SX-
ORFOM12 ...................................................................................................................... 126
Figure 6.9. Effect of pH on distribution coefficient (D2EHPA and vanadium (IV)) ..... 128
Figure 6.10. Effect of D2EHPA concentration on vanadium (IV) extraction ................ 129

xiv
Nomenclature
A- Anion monomeric
b Stoichiometric coefficient of the reaction
C Concentration of H+ in the bulk solution (mol/L)
(Caq)I
Solubility of oxygen (molal)
d Particle size (m)
D Distribution coefficient
De Diffusion coefficient (m2/s)
E Potential (mV)
Ea Activation energy (kJ/mol)
Em Mixed potential (mV)
F Faraday constant (A/mol)
i Current density (A/m3)
Ke Equilibrium constant
ks Rate constant (1/min)
n Number of electrons
Average radius of spherical particle (µm)
t Time (min)
T Temperature (K)
X Fraction of particle converted

xv
Z Number of electron transfer in charge transfer process
α Charge transfer coefficient
β Complexation equilibrium constant
ρ Density (kg/m3)
τ Time to complete dissolution (min)

xvi
Acknowledgments
I am very thankful to my supervisor, Dr. David Dreisinger, whose encouragement,
guidance and support from the initial to the final level enabled me to develop an
understanding of the subject. Thanks are also given to Dr. David Dixon and Dr. Berend
Wassink for their helpfulness and many useful discussions. I also acknowledge the rest of
my thesis committee as well for their assistance. (Dr. Akram Alfantazi and Dr. Warren
Poole).
I also thank Scott Dornian for his help in running experiments in the summer 2012. I
wish to thank Dr. Robin Stoodley and Paula Parkinson for their assistance in using the
ICP instrument for chemical analysis.
It has been a great privilege to spend these years of graduate studies in the Department of
Materials Engineering at the University of British Columbia. Its members and memories
will always remain in my mind. Special thanks to all colleagues and officemates for
providing a friendly environment that was always a pleasure to work in.
Special thanks are owed to my family for all the love, encouragement and support the
have provided throughout my life.

xvii
Dedication
To my beloved family

1
1 Introduction
2
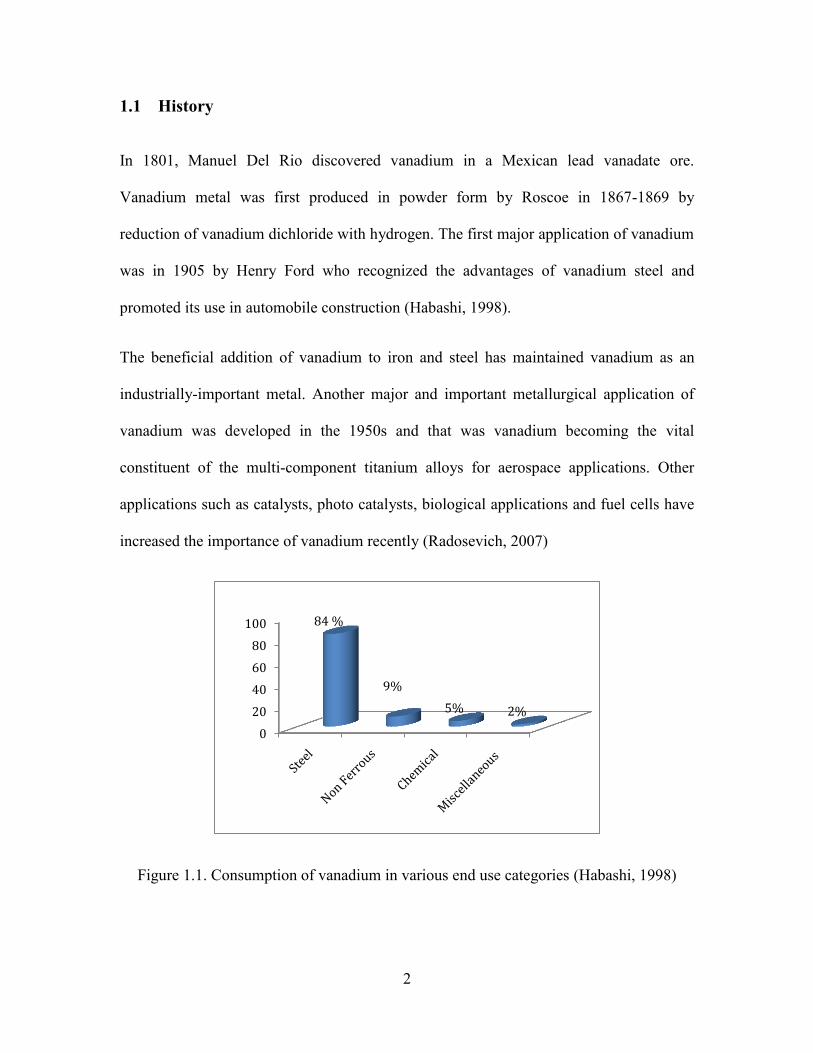
1.1 History
In 1801, Manuel Del Rio discovered vanadium in a Mexican lead vanadate ore.
Vanadium metal was first produced in powder form by Roscoe in 1867-1869 by
reduction of vanadium dichloride with hydrogen. The first major application of vanadium
was in 1905 by Henry Ford who recognized the advantages of vanadium steel and
promoted its use in automobile construction (Habashi, 1998).
The beneficial addition of vanadium to iron and steel has maintained vanadium as an
industrially-important metal. Another major and important metallurgical application of
vanadium was developed in the 1950s and that was vanadium becoming the vital
constituent of the multi-component titanium alloys for aerospace applications. Other
applications such as catalysts, photo catalysts, biological applications and fuel cells have
increased the importance of vanadium recently (Radosevich, 2007)
Figure 1.1. Consumption of vanadium in various end use categories (Habashi, 1998)
0
20
40
60
80
100 84 %
9%
5% 2%

3
1.2 Properties of vanadium
Vanadium belongs to the group VB in the periodic table and is a body centered cubic
(bcc) metal. Table 1.1 shows some important physical properties of vanadium.
Table 1.1. Physical properties of vanadium (Habashi, 1998)
Atomic number 23
Atomic weight 50.94
Density (g/cm3) 6.11
Melting point (ºC) 1910
Boiling point (ºC) 3409
Latent heat of fusion (KJ/mol) 16.74
Entropy (J/mol.K) 28.95
1.3 Primary and secondary sources and vanadium products
Vanadium is present in over 50 different minerals and is the 22nd
most abundant element
in the Earth’s crust (Moskalyk and Alfantazi, 2003). Vanadium is used in metal alloys
with iron to produce high-strength steels which have a wide range of uses, including
structural applications such as reinforcing bars in building and construction, gas and oil
pipelines, tool steel, the manufacturing of axles and crankshafts for the motor vehicle
industry, and in jet engines for the aircraft industry. Non-steel uses include welding and
alloys in nuclear engineering and superconductors. Other applications such as catalysts,
biological applications and fuel cells have increased the importance of vanadium
recently. To summarize, vanadium is known as an important element and it can be
anticipated that its importance will be expanded in the future because:
1- It is extremely important in the use of high-strength steel. High-strength, low-

4
alloy steel uses very small amounts of vanadium. About 0.5% of vanadium
content approximately doubles the strength of steel and therefore could lead to
less use or weight of steel for sensitive applications. Therefore, the amount of iron
ore and energy consumption needed for the manufacturing of steel decreases as
well.
2- Besides all of its non-steel uses, vanadium may be used for mass storage redox
batteries. The only really good long-term, cost-effective solution for mass storage
energy is vanadium mass-storage batteries. The vanadium redox flow battery is a
type of rechargeable flow battery that employs vanadium ions in different
oxidation states to store chemical potential energy. The vanadium redox battery
exploits the ability of vanadium to exist in solution in four different oxidation
states and uses this property to make a battery that has just one electroactive
element instead of two. The main advantages of the vanadium redox battery are
that it can offer almost unlimited capacity simply by using larger storage tanks. It
can be left completely discharged for long periods with no ill effects, it can be
recharged simply by replacing the electrolyte if no power source is available to
charge it, and if the electrolytes are accidentally mixed, the battery suffers no
permanent damage. The main disadvantages with vanadium redox technology are
a relatively poor energy-to-volume ratio and the system complexity in comparison
with standard storage batteries.
As shown in Table 1.2, about 74 thousand tonnes per annum of vanadium are produced in
the world by different countries (http://minerals.usgs.gov).

5
Table 1.2. Vanadium world annual production by country (http://minerals.usgs.gov)
Country
2008
2009
2010
2011
2012
China (thousand tonnes)
26
29
32
36
39
United States (tonnes)
520
230
1060
590
272
Russia (thousand tonnes)
14.5
14.5
15
15
15
South Africa (thousand tonnes)
23.3
22.6
23.7
23.5
20
Total (thousand tonnes)
61.1
58
71
74
74
Japan, petroleum residues, ash
spent catalysts (tonne) 560
560
560
560
560
Grand total
(thousand tonnes) 62
59
72
74
74
Vanadium is a relatively abundant trace element and occurs in a large number of minerals
and deposits. Vanadium is not only produced from primary resources, but is also obtained
from secondary production, or processing of steelmaking slag, oil and coal residues,
spent catalysts and uranium co-products. Characteristics of vanadium in secondary
resources are completely different and depend on the sources (Das et al., 2007); the
average concentration of vanadium varies in different sources.
In addition of source variety, vanadium usage has been expanding to different industries,
such as the battery industry. This requires better understanding of the hydrometallurgy of
vanadium to overcome complexities involved in its recovery process. Therefore, building
a fundamental understanding for vanadium leaching and solvent extraction can help us to
plan for increased vanadium production from new and varied sources.

6
2 Literature review

7
2.1 Aqueous chemistry
The chemistry of vanadium in aqueous solutions is complex. The most common
oxidation states for vanadium are +2, +3, +4, and +5. In an aqueous system, the oxidation
state of vanadium can be +3, +4, and +5. The vanadium (II) oxidation state is not stable
in aqueous solutions. The redox potential of vanadium (II)(aq) is such that hydrogen ions
will be reduced to hydrogen (gas) and vanadium (III)(aq) forms.
Since most of the vanadium products have been produced as vanadium (V), the most
important cation in the chemistry of vanadium production is VO2+. Moreover, aqueous
vanadium (IV) exists in various ionic states depending on the pH including VO(H2O)5+2
,
VO(OH)(H2O)+, and the dimer, (VOOH)2(H2O)n
+2. In this cationic form, which occurs
under acidic conditions, V (IV) is highly water-soluble. However, under mildly acidic
conditions, about pH 4, where it is largely non-ionic, it forms a hydrous oxide VO2.nH2O
(Ksp~10-22
), thus limiting the solution concentration to low values. Under basic
conditions, the oxide can be redissolved to form the anionic species (Tracey and Crans,
1998; Tracey et al., 2007).
Figure 2.1 is a diagram showing the equilibrium Eh-pH diagram for the vanadium-water
system. In this figure, five solid substances are considered (V, V2O2, V2O3, V2O4 and
V2O5). A total of 10 aqueous species appear on the diagram at the concentration level of
around 1 g/L vanadium species (V+2
, V+3
, V(OH)+2
, VO+2
, V4O9-2
,VO2+, H2V10O28
-4,
HV10O28-5
,V4O12-, V2O7
3-) (Pourbaix, 1949).

8
Figure 2.1. Stability relationships of vanadium ions and the compounds in aqueous media
at 25℃ (Pourbaix, 1949)
Table 2.1 summarizes a variety of complex speciation and oxidation states in aqueous
solutions. Vanadium (V) exists in a series of polyanions such as decavanadate V10O286-
,
or metavanadate V4O124-
, that are partially protonated according to the pH value.
Vanadium speciation in solution depends on its concentration and the pH value of
solution (Zeng and Yong Cheng, 2009).

9
Table 2.1. Characteristics of some vanadium species in aqueous solutions (Zeng and
Yong Cheng, 2009)
Oxidative state Species Medium Colour
V(II) [V(H2O)6]+2
Acidic Purple
V(III) [V(H2O)6]+3
Acidic Green
V(IV) VO+2
Acidic Blue
VO4-4
Acidic
V(V) VO4-3
pH˃12.6 Achromaticity
V2O7-4
pH=9.6-10 Achromaticity
VO3- pH=7-7.5
V3O9-3
pH=7-7.5 Achromaticity
V4O12-4
pH=7-7.5
V10O28-6
pH=2-6.5 Orange-Red
VO2+ pH=1-2 Yellow
Olazabal et al (1992) presented the distribution diagram (Figure 2.2) of vanadium (V)
species in water as a function of the pH by computer simulation based on the ISP
software package. This program (made at the Royal Institute of Technology in Sweden)
solves the mass balance equations of the different components of a chemical system in
terms of equilibrium and stoichiometric formation constants. The cationic vanadium (V)
species is predominant at pH<2. Polynuclear anionic species are predominant in the range
2<pH<9, while mononuclear anionic species are the most important at pH>9.

10
Figure 2.2. Vanadium speciation in water as a function of pH with a total VO2+
concentration of 14.3 mM (Olazabal et al., 1992)
It is apparent from the account given above that vanadium has many chemical forms in
solution. The controlling of vanadium speciation by changing the pH is essential in the
processing of vanadium, especially in the purification and precipitation recovery steps.
Table 2.2 shows some available thermodynamic data of the aqueous species of vanadium
(V), (IV), and (III).

11
Table 2.2. Thermodynamic data for aqueous vanadium species at standard state (Barner
and Scheueman, 1978; Evans and Garrels, 1958; Wanty and Goldhaber, 1992)
Formula ΔH°f
(kJ/mol)
ΔG°f
(kJ/mol)
S°
(kJ/mol.K)
V (V)
VO2+ -649.8 -587 -42.3
VO3- -888.3 -783.7 50
VO4-3
- -899.1 -
HVO4-2
-1159 -974.9 17
H2VO4-2
-1174 1020.9 121
H3VO4 - -1040.3 -
V2O7-4
- -1720 -
HV2O7-3
- -1792 -
H3V2O7- - -1864 -
V3O9-3
- -2356 -
V4O12-4
- -3202 -
V10O28-6
- -7675 -
HV10O28-5
-8694 -7708 1544
H2V10O28-4
- -7729 -
VO2.H2O2+ - -746.4 -
VO.H2O2+3
- -523.4 -
V (IV)
VO+2
-486.6 -446.4 -133.9
VOOH+ - -657 -
(VOOH)2+2
-1331 -
V4O9-2
- -2784 -
V (III)
V+3
-259 -251.3 -230
VO+ - -451.8 -
VOH+ - -471.9 -

12
2.2 Leaching and metallurgical processes
There are many processes to treat vanadium raw materials. Figure 2.3 illustrates many of
the processes which have been used for the recovery of vanadium.
Figure 2.3. Treatment of vanadium raw materials (Habashi, 1998)
On the left side of this figure, the processes for primary vanadium recovery are shown.
Pyrometallurgy, hydrometallurgy, and pyro-hydro metallurgy methods have been used
for the recovery of vanadium. Since vanadium has a high melting point (1910°C),
13
pyrometallurgy methods are not feasible to reduce vanadium oxide to elemental
vanadium. Hydrometallurgy and pyro-hydrometallurgy processes are popular methods to
extract vanadium from different resources. Either direct leaching as a hydrometallurgy
method or salt roasting and leaching together as a pyro-hydrometallurgy method has been
used for vanadium recovery. Salt roasting of vanadium oxides, which have low solubility,
make metavanadate phases, which have more solubility. All of the conditions for roasting
and acidic or basic leaching of different vanadium resources, as illustrated in Figure 2.3
will be discussed in this chapter.
2.2.1 Roasting
Salt-roasting changes the mineral of vanadium to an oxide anion in its maximum valence
state. Vanadium in the feed materials converts on roasting with a source of sodium under
oxidizing conditions to form soluble sodium salts (Gupta, 1992; Zhang et al., 2012):
2NaCl + O2 + H2O + V2O3 = 2NaVO3 + 2HCl (2.1)
Or
2NaCl + V2O5 + H2O = 2NaVO3 + 2HCl (2.2)
Or
2NaCl + V2O3+ 3/2 O2 = 2NaVO3 + Cl2 (2.3)
The formation of sodium metavanadate by reaction 2.3 is slow; so, in practical
conditions, reaction 2.1 for the lower valent vanadium and reaction 2.2 for the
pentavalent vanadium oxide occur predominantly.

14
Some other sources of sodium for salt roasting have been used such as sodium carbonate
and sodium sulfate (Gupta, 1992; Geyrhofer et al., 2003; Hukkanen and Walden, 1985;
Rohrmann, 1985):
Na2CO3 + V2O5 = 2NaVO3 + CO2 (2.4)
Na2SO4 + V2O5 = 2NaVO3 + SO3 (2.5)
In general, it can be mentioned that the temperature of salt roasting of vanadium due to
vanadium characteristics and additive reagent can be varied between 700°C and 1200°C.
Roasting can be done in a rotary kiln or multiple hearth furnace (Geyrhofer et al., 2003)
The role of roasting on the increasing of vanadium leaching efficiency from different
sources of vanadium has been shown in various reports. This happens because of
changing vanadium composition to the more soluble vanadium component.
Holloway and Etsell (2004) reported that the optimum roasting conditions for processing
"carbon-free1" ash from oil sands were determined to be 2 to 3 hours of roasting at 850°C
to 900°C with NaCl additions of 20 to 30%. This condition resulted in vanadium
extractions of 75 to 85% for all of the tested samples from Suncor's oil sands which
contained 2.86 to 3% V, Al, Ca, Fe, Mo, Ni, Si, Ti and different amount of carbon and
sulfur. Moreover, Li and Xie (2012) reported that increasing temperature from 500°C to
850°C increases vanadium recovery by leaching; however, it was revealed that increasing
the temperature to more than 850°C can decrease vanadium recovery because of
sintering.
1 - Carbon (and sulfur) were removed from the fly ash samples prior to salt roasting by heating as-received
fly ash at 500°C to constant weight in a muffle furnace

15
However, Shelwit and Alibrahim (2006) reported more than 90%wt of sulfur and 60%wt
of vanadium could be extracted by the salt-roasting treatment using about 25%wt of NaCl
or Na2CO3 at a temperature of 400°C for 1 hour followed by Na2CO3 leaching at a
temperature of 70-80°C. They used a low range of temperature for removing vanadium
from petroleum coke. This low range of temperature is generally not a suitable range for
vanadium roasting.
It was shown that increasing the temperature in the roasting of spent catalysts from
450°C to 800°C could lead to an increase of vanadium leaching from 45% to about 85%
(Chen et al., 2006). In addition, Tavakoli et al (2010) confirmed the significant effect of
temperature in the roasting of bottom ashes; moreover, they studied the effect of adding
sodium carbonate and sodium chloride as an additive for roasting and reported sodium
carbonate can increase vanadium recovery more than sodium chloride.
Table 2.3 shows the summary of the roasting conditions for vanadium recovery.
Table 2.3. Roasting condition for vanadium recovery
Material Additive
Additive
amount
(%wt)
Temperature
(°C)
Roasting
Time
(Hours)
References
Vanadium
content
NaCl,
Na2CO3,
Na2SO4
(Rarely1)
25-40 70 - 1100 1-3
(Biswas et al., 1985; Chen
et al., 2006; Gomez-
Bueno et al., 1981;
Holloway and Etsell,
2004; Tavakoli et al.,
2010; Zeng and Cheng,
2009)
1 - Because of the cost of sodium sulfate and higher temperature needed for roasting compared other
additives

16
2.2.2 Leaching
The methods of vanadium dissolution used in vanadium source processing include:
1- Water leaching of the salt-roasted vanadium source
2- Acid leaching of the salt-roasted vanadium source
3- Basic leaching of the salt-roasted vanadium source
4- Direct acid pressure or atmospheric leaching
5- Direct basic pressure or atmospheric leaching
Roasting of vanadium sources is an effective method for vanadium extraction; however,
roasting needs a high temperature and a lot of additives to make sodium metavanadate.
Therefore, there is a rational interest to dissolve vanadium directly.
The past reports for vanadium leaching and solvent extraction were studied carefully and
are summarized below.
2.2.2.1 Oil and combustion ashes
Fuel oil and petroleum coke burned in power stations produce two types of waste ash:
bottom ash and fly ash. The characteristics of ash depend on the type and origin of the
fuel used as well as the boiler conditions. Fly ash consists of inorganic, incombustible
matter and during combustion some of the components partially transform into a glassy,
amorphous structure. Fly and coal ashes damage the environment and cause some serious
human health problems. Some research (Cenni et al., 1998; Fernandez et al., 2003; Gavett
et al., 1997; Pritchard, 1996; Veranth et al., 2000) showed that inhaling fly ashes by mice
resulted in lung damage. On the other hand, fly ashes can be a good secondary resource

17
for vanadium and nickel. As an example, it was reported that more than 420 tonnes of fly
ash that contains vanadium, nickel and magnesium is produced by Jordan power stations
every year (Abdel-latif, 2002; Al-Ghouti et al., 2011). The gross reserve of vanadium in
stone coal is 118 million tonnes in terms of V2O5 in China, which accounts for more than
87% of the domestic reserve of vanadium (Lan Yao-Zhong, 2005; Zhu et al., 2010).
Okuwaki et al (1988) investigated vanadium recovery from electrostatic precipitator ash.
The vanadium extraction was 88% or greater with 0.5M H2SO4 at 60-90°C, with an
extraction time of 45 minutes and H2SO3 as a reducing agent.
Akita et al (1995) reported that 22.7% of vanadium from oil fly ash was extracted by 2M
HCl at 50°C. The vanadium leaching efficiency was low in this case but Ni, Fe, Al and
Mg were also co-extracted. The reagents Na2CO3, (NH4)2CO3 and NH4Cl were then
tested for vanadium leaching. It was shown that 2M Na2CO3 dissolves 60% of the
vanadium at 70°C after 7 hours while the leaching of other metals is suppressed. NH4Cl
leached nickel and magnesium preferentially and about 20% of vanadium was leached as
well. In the case of leaching by (NH4)2CO3 leaching, vanadium was not leached at all. It
seems that ammonium solutions cannot leach vanadium but alkaline solutions can leach
vanadium selectively.
Tsai and Tsai (1998) showed that the extraction of vanadium from fly ash in ammonia
water (around 40%) appears to be less than that of leaching in either 2M sulfuric acid or
2M sodium hydroxide (more than 90% at room temperature for 2 hours). They suggested
the two-stage leaching method for nickel and vanadium: in the first stage, the soluble

18
nickel compounds are leached in an ammoniacal solution; in the second stage the residue
left from the extraction of nickel is leached in an alkaline solution to recover vanadium.
Figure 2.4 shows four kinds of fly ash (Table 2.4) leached in different concentrations of
sulfuric acid by Vitolo et al (2000). They showed that the yield of extraction increased
with the acidity of the leaching solution but it had a higher effect on samples B and C
than on A. In addition, the effect of liquid to solid ratio was studied. Generally, an
increase in the L/S ratio led to an increase in the extraction yield, however, different
behavior was observed in different samples. An increase in L/S from 2 to 3 mL/g had no
effect on the extraction yield of sample A, whilst an increase in the yield of 5% and
15.5% was observed for samples B and C respectively. This result may be related to the
wettability of the fly ashes, which decreases with carbonaceous fraction. This means that
a higher L/S ratio is necessary for ashes with a high carbonaceous fraction to ensure an
adequate contact between the solid and the liquid phases. They reported different
behaviours of vanadium leaching in different types of ashes in other research as well
(Vitolo et al., 2001; Vitolo et al., 2000).

19
Table 2.4. The analysis of the used ashes (Vitolo et al., 2000)
Main constituents of the fly ashes (%wt)
Oil fly ashes
Orimulsion fly ashes A B C
Moisture 1.9 0.9 1.5 5.2
C 33.1 39.6 79.1 7.1
V 2.6 3.3 1.3 11.7
Fe 3.5 3.9 4 0.6
Na 2.3 2.4 0.2 1.1
K 0.2 0.2 0.1 not revealed
Ni 1.3 1.2 0.7 2.5
Si 2.5 0.7 0.8 not revealed
Al 2.1 0.4 0.6 3.2
Ti 0.1 Traces Traces 0.1
S 12.6 11.3 11.6 13.2
P 0.1 0.1 0.1 traces
Figure 2.4. Extraction yield of vanadium versus the molarity of the H2SO4 leaching
solution at room (white circles) and boiling temperature (black circles) with a liquid/solid
ratio of 3 mL/g (Vitolo et al., 2000)

20
In other research, the mobility of water-soluble major and trace elements in six fly ashes
was studied at 90°C. They reported that the leaching rate of the different trace impurities
in the six different fly ashes can be sorted, in decreasing order,
(Querol et al., 2001). It was shown by Choi et al (2002) that chemical composition of
the fly ashes is size-dependent for most elements. Some of the elements are associated
with the surfaces of particles and some others are incorporated in the glassy form.
Generally, the fractions incorporated in the glass matrix might be dissolved more slowly
compared with readily-leachable elements associated with surfaces.
Extraction of Egyptian boiler ash containing 20% vanadium was also considered by
pressure leaching and leaching following roasting. Amer (2002) compared pressure
leaching and pyro-hydrometallurgical treatment for extraction of vanadium. He claimed
consumption of sulfuric acid (10%) is cheaper than the amount of soda required for alkali
roasting (50%). In addition, the selectivity of the processing is achieved where both
vanadium and nickel are leached as sulfates while the other impurities which are mainly
represented by iron are precipitated as jarosite. However, leaching of vanadium after the
alkali roasting forms soluble sodium vanadate while the precipitate contains both the
nickel and iron which needs further techniques for nickel removal. So, the pyro-
hydrometallurgical approach is technically feasible, but it is not cost effective in
comparison to the pressure leaching because of the salt consumption, energy demanded,
and selectivity.
Guibal et al (2003) reported that both acidic and alkali leaching are effective for the
leaching of vanadium from fly ash. They reported almost the same recovery for high L/S

21
ratios, while Navarro et al (2007) reported that extraction efficiency with the alkaline
procedure is lower than that reported with an acidic treatment. However, the alkaline
process is significantly better in terms of selective recovery of vanadium. Direct acid
leaching of vanadium from heavy oil and combustion ashes was studied. The researchers
investigated direct acid leaching and leached more than 75% of vanadium.
There is a wide range of contradictory results for the effect of additives on vanadium
leaching. It is claimed that both reductive and oxidative agents can increase leaching. Li
et al (2009) reported that more than 90% of vanadium from black shale was leached by
350 g/L sulfuric acid at 180°C with a liquid/solid ratio of 1.2 mL/g for 3 hours.
Moreover, the effect of FeSO4 as an additive was studied as a reducing agent and no
significant effect on vanadium leaching was reported while they reported that adding
FeSO4 increased vanadium recovery by about 7.7% in another study (Li et al., 2010c).
However, NaClO as an oxidative agent on vanadium leaching in their paper in 2010 (Li
et al., 2010) was studied and it was shown that the recovery of vanadium increased from
80% to 85.1% by adding 1 g/L NaClO at 95°C, 87.5 g/L H2SO4, 15 g/L HF and a
liquid/solid ratio of 4 mL/g for 6 hours. Moreover, Chen et al (2010) studied the effect of
an additive reagent on vanadium ore (V2O5: 1.09%). They suggested MnO2 and H2O2
could increase vanadium recovery by about 5% while FeSO4 decreased it by about 2%.
2.2.2.2 Spent catalysts
The petroleum refining industry and sulfuric acid plants are using some special catalysts
containing vanadium and molybdenum. These catalysts have limited life cycles, and after
utilization, are generated as spent catalysts (Kar et al., 2005). This kind of spent catalyst
forms an important secondary source of many valuable metals. A spent hydro-refining

22
catalyst mainly consists of 10–30% Mo, 0–12% V2O5, 0.5–6% NiO, 6–8% CaO, 8–12%
S, 10–12% carbon and the balance is Al2O3 (Marafi and Stanislaus, 2003; Sun et al.,
1998; Sun et al., 2001).
There are two main routes to process spent catalysts in the acid stage. One is direct acid
leaching under pressure or high temperature; the other one is roasting around a
temperature of 500-700°C followed by acid leaching with or without pressure and high
temperature. Pre-treatments of the recovery processes such as roasting and washing the
catalysts have been used to remove sulfur and carbon from the catalysts and increase the
recovery. In direct leaching, sulfuric, hydrochloric, and nitric acids and some organic
acids such as oxalic and citric acids are used for leaching-spent catalysts. Some solvents
such as oxalic and citric acid were used as a complexing agent to selectively extract
vanadium from the spent catalyst (Lee et al., 1992). The same amount of vanadium
extraction for both oxalic and citric leaching was reported, however, it was revealed that
citric acid is not as selective as oxalic acid for vanadium over molybdenum and nickel.
Dilute sulfuric acid leaching usually gave low recoveries of metal values of spent
catalysts. Biswas et al (1985) investigated the effects of the temperature and the flowing
gas on the leaching of spent catalysts in water after salt roasting at 850°C. Table 2.5
shows that more than 80% of vanadium was leached at 100°C.

23
Table 2.5. Percentage of materials dissolved on water leaching of roasted catalysts
(Leaching time 1hour; roasting temperature 850℃; gas flow rate during 1 l L/minute;
water vapour pressure 0.253 bar; S/L ratio 1/10.66 g/mL) (Biswas et al., 1985)
Flow
gas
Leaching
Temperature
(℃)
Percentage of material dissolved
V Mo Al Co Ni
N2 100 81.85 81.78 0.25 0.05 0.31
N2 80 78.52 73.9 0.25 0.04 0.18
N2 52 76.54 65.1 0.22 0.09 0.12
N2 35 69.2 58.05 0.22 0.08 0.1
Air 100 70.32 65.7 0.42 0.13 3.33
H2 100 14.95 63.66 1.47 0.15 1.8
Figure 2.5 summarized all of the processes which have been used for acidic vanadium
leaching from spent catalysts.
Figure 2.5. Metallurgical processes for spent HDS catalysts involving acid leaching
(Zeng and Cheng, 2009)

24
Figure 2.6 illustrates the processes for spent HDS catalysts (Hydrodesulfurization)
involving caustic leaching. Alkali leaching can be used for HDS catalysts. It also
dissolves some aluminum but leaves nickel, cobalt, and iron in the residue to some
degree.
Figure 2.6. Metallurgical processes for spent HDS catalysts involving caustic leaching
(Zeng and Cheng, 2009)
In the case of roasting/leaching, Villareal et al (1999) used the spent petroleum catalyst
containing 27.28% V2O5 and 1.92% MoO3 to recover vanadium and molybdenum. After
some pre-treatment procedures such as washing by ethanol and heating for 24 hours at
450°C to remove carbon and sulfur, vanadium and molybdenum leaching was tested by
NaOH and NH3. It was shown that both solvents can leach vanadium more than 90% at
temperatures around 95°C. In addition, they concluded that an NH3 solution is more
useful for the selective extraction of vanadium than NaOH. Moreover, Chen et al (2006)
reported that more than 90% of vanadium and molybdenum could be extracted by
roasting with sodium carbonate at 750°C followed by caustic leaching at a pH of 10.5.

25
The main routes for direct leaching, which are dilute, or concentrated atmospheric or
pressure leaching were studied as well. Yasuhara (1982) could leach over 95% of
vanadium with a 4% caustic solution in an autoclave while Grzechowiak et al (1987)
used a high sulfuric acid concentration and high temperature (around 180°C) to leach that
amount of vanadium.
In the case of NaOH/NaAlO2, leaching was performed at high temperature in the range of
150-250°C and sodium aluminate was used to convert molybdenum and vanadium to
sodium molybdate and sodium vanadate (Wiewiorowski et al., 1986).
Mishra et al (2010) tried to compare alkali leaching using (NH4)2CO3 and acidic leaching
by H2SO4. They reported that 20 g/L of (NH4)2CO3 can leach 34% of vanadium while 20
g/L of sulfuric acid can extract 60% of vanadium at a temperature of 30°C, pulp density
10% (w/v) for 1 hour. They also observed that the kinetics of dissolution of vanadium
increased by increasing the pulp density from 10 to 40% but they did not mention any
reason for this result.
Moreover, there are many other resources for vanadium production from primary
vanadium ores (Gupta and Krishanmurphy, 1992). A similar technique for vanadium
production has been applied for these different resources. As an example, carnotite
(K2(UO2)2(VO4)2·3H2O) can be considered for vanadium and uranium production. This
ore is mostly found in United States, Australia, Congo and Kazakhstan
(www.wikipedia.org). Both roasting-leaching and direct leaching using caustic or acidic
solution have been tried for leaching of this kind of ore. It seems that high recovery of
uranium and vanadium in leaching was obtained using different methods; however, the
26
problem is separation of uranium and vanadium in the solution (Fischer, 1942). Different
methods such ion exchange for removing uranium (Bibler, 1990), selective loading using
different extractants such as amines and D2EHPA (El-Enein et. al., 2014) or selective
stripping after loading by D2EHPA (Crouse and Brown, 1959) have been offered to
complete the flowsheet.
2.2.2.3 Kinetic studies
Few researches have been reported to investigate the kinetics of vanadium leaching.
Aarabi et al (2010) studied the kinetics of vanadium leaching from an LD (Linz–
Donawitz) converter slag of a steelmaking plant. Based on their kinetic results, two
leaching stages for vanadium leaching were reported. During stage one (the first 15
minutes), a sharp increase in the amount of vanadium extracted was observed (fast
leaching rate) and during stage two (more than 30 minutes), a slower leaching rate was
encountered. The rate of leaching of vanadium is controlled by chemical reaction at low
temperature whereas it is controlled by diffusion through the solid product layer at higher
temperature. Amer (1994) showed that the most favorable conditions for the extraction of
95% of the vanadium present as vanadium trioxide in the black shale are: temperature
180°C, acid concentration 10% by weight, grain size 61-88 µm and leaching time 40
minutes. It was indicated that the kinetics of vanadium dissolution is under mixed control
and the overall activation energy of the reaction was reported around 30 kJ/mol. Li et al
(2012) observed that oxidative conditions can increase leaching efficiency from black
shale containing a mixture of vanadium (V) and (III) oxides. The activation energy for
the kinetics study was reported to be 40.1 kJ/mol. Pressure oxidation of pure vanadium
trioxide in sulfuric acid was studied (Zhou et. al., 2012). It was shown that vanadium

27
trioxide can be completely leached in about 20 minutes by 1M sulfuric acid, oxygen
partial pressure 1MPa, and 140°C. A reaction control mechanism was reported with an
activation energy of 43.46 kJ/mol. However, a shrinking core model was used for pure
vanadium trioxide while no ash layer was reported. Qiu et al (2011) investigated the
pressure oxidative leaching of vanadium trioxide using sodium hydroxide. They found
that about 90% of vanadium can be dissolved in 2M sodium hydroxide, oxygen partial
pressure 500 kPa, and 130°C in about 40 minutes. They offered two stage kinetic models
for the leaching: the chemical control regime for the initial step and the diffusion
mechanism for the later stage. Unfortunately, they also applied the shrinking core model
for starting pure materials without mentioning any ash layer or showing the constant
particle size through the leaching. Wang-Xing et al (2010) studied the kinetics of calcium
vanadate containing 65.5% vanadium by Na2CO3 leaching. They claimed that the reaction
rate constant increases with increasing pH and stirring speed and an activation energy of
38.98 kJ/mol was obtained.
2.2.3 Summary
From the literature review, the important parameters for leaching are temperature, solvent
concentration, S/L ratio, time of leaching and additive reagents. Table 2.6 summarizes all
of the important reports about vanadium leaching but, as it was shown, there is a wide
range of contradictory results for the impact of different parameters in vanadium
leaching.
In most of the reports, temperature and solvent concentration have a prominent effect on
the recovery of vanadium in leaching. However, Li et al (2010) reported the optimum
concentration for sulfuric acid for vanadium leaching. In some other parameters such as

28
S/L ratio or additive reagents, a wide range of contradictory results have been reported.
For instance, some other researchers (Li et al., 2011; Navarro et al., 2007; Vitolo et al.,
2001; Vitolo et al., 2000) suggested that by decreasing the S/L ratio, the efficiency of
leaching decreases. However, Li et al (2009) and Arabi et al (2010) without clarifying
with any proper reason, reported the optimum condition for solid to liquid ratio to obtain
maximum vanadium recovery in leaching. Mishra et al (2010) observed the kinetic of
dissolution of vanadium increased by increasing the pulp density from 10 to 40%.
Generally, increasing the S/L ratio would increase the extraction of vanadium, and this is
limited by the concentration of protons available in the solution.
In addition, there is a similar story for the effect of oxidizers and reducers on vanadium
leaching in literature. Li et al (2009) and Chen et al (2010) investigated NaClO and
MnO2, respectively, as oxidizers to increase the vanadium recovery in leaching; while
Okuwaki (1988) and Li et al (2010) studied H2SO3 and FeSO4, respectively, as reductive
agents to increase the leaching recovery. Moreover, Li et al (2009) showed that FeSO4
has no effect on vanadium leaching while Chen et al (2010) reported FeSO4 decreases
vanadium recovery.

29
Table 2.6. Summary of vanadium leaching studies
No Source
Vanadium
Content (%)
Extraction
(%) Solvent
Solvent
Conc.
Temp.
(°C)
S/L ratio
(g/L)
Time
(min) Ref.
1 HDS
Catalyst 15 81.8 H2O
-
Boiling -
(Biswas et al., 1985)
2 EP ash 1.93
- 3.36 95 H2SO4
0.5 M
70 0.125 45 (Okuwaki et al., 1988)
3 Fly ash 1.8 63 Na2CO3
2 M
25 0.2 420 (Akita et al., 1995b)
10 NH4Cl
2 M
25 0.2 420 (Akita et al., 1995b)
20 (NH4)2CO3
2 M
25 0.2 420 (Akita et al., 1995b)
4 Fly ash 0.41 & 1.91 95 H2SO4
2 M
30 0.2 120 (Tsai and Tsai, 1998)
75 NaOH
2 M
30 0.2 120 (Tsai and Tsai, 1998)
48 NH4OH
2 M
30 0.2 120 (Tsai and Tsai, 1998)
5 Spent petroleum
Catalyst 27.28 (V2O5)
90 NH3
15 M
95 100 1440 (Villarreal et al., 1999)
90 NaOH
pH=8
95 100 1440 (Villarreal et al., 1999)
6 Fly ash 1.3 - 3.3 80 – 95 H2SO4
2 M
Boiling 333.34 30 (Vitolo et al., 2000)
7 Fly ash 3.8 (19wt% after burning) 97 H2SO4
2 M
Boiling 142.85 60 (Vitolo et al., 2001)
8 Boiler ash 20 98 H2SO4
0.6 M
220 0.5 30 (Amer, 2002)

30
9 Fly ash 0.93 80 NaOH
5 M
100 5760 (Guibal et al., 2003)
0.93 90 H2SO4
0.5 M
Ambient 100 1440 (Guibal et al., 2003)
10 Spent
Catalyst 0.42 90.1 Water
-
80-90 0.5 15 (Chen et al., 2006)
11 Fly ash 1.6 98 H2SO4
0.5 M
Ambient 250 1440 (Navarro et al., 2007)
56 NaOH
2 M
Ambient 250 1440 (Navarro et al., 2007)
60 Na2CO3
0.66 M
Ambient 250 1440 (Navarro et al., 2007)
12 Black
Shale mine
3.26
(V2O5) 75 H2SO4
2 M
180 833.34 240 (Li et al., 2009)
13 Black Shale
Mine 0.56
(V2O5) 86 H2SO4
0.87 M
95 250 8640 (Li et al., 2010)
14 Stone coal 1.09 85 H2SO4
1 M
95 333.34 120 (Chen et al., 2010)
15 Steel Slag 8.46
(V2O5) 90 NaOH
0.4 M
240 500 350 (Xiao et al., 2010)
16 LD convertor
Slag 1.97
(V2O5) 90 H2SO4
3 M
70 0.067 140 (Aarabi-Karasgani et al., 2010)
17 Black Shale
Mine
6.15
(V2O5) 70 H2SO4
2 M
150 14.28 60 (Li et al., 2010)
18 Calcium vanadate 65.5
(V2O5) 95 Na2CO3
1.2 M
80 40 60 (Wang-xing et al., 2010)
19 Spent petroleum
Catalyst 9 80 H2SO4
1 M
30 0.1 120 (Mishra et al., 2010)
20 Stone coal 1.82 91 H2SO4
0.3 M
150 0.833 240 (Deng et al., 2010)

31
2.3 Separation and purification: solvent extraction
2.3.1 Solvent extraction of vanadium in industry
Liquid-liquid extraction (solvent extraction) refers to the distribution of a solute between two
immiscible liquid phases in contact with each other. The whole process essentially consists of
three steps: extraction, scrubbing and stripping.
Because of different kinds of species of vanadium in solution, different solvent extractants have
been used to extract vanadium. Solutions containing vanadium in the feed solution to solvent
extraction may be neutral, basic, or acidic. Acid or alkali leaching solutions can contain
impurities such as iron, chromium, and molybdenum, in addition to vanadium, depending upon
the vanadium source treated.
Many extractants have been used for vanadium solution purification. Among these, Di-2-ethyl-
hexyl phosphoric acid (D2EHPA) and amines have been used in plant operations while the
others have been essentially confined to laboratory or pilot scale studies.
2.3.2 Recent researches
Since vanadium solution in different concentration and pH’s make different species (Figure 2.2),
different kinds of solvents have been used for solvent extraction under different conditions. In
the sections below, some recent studies for solvent extractions of vanadium will be considered.
2.3.2.1 Solvent extraction using cation extractants
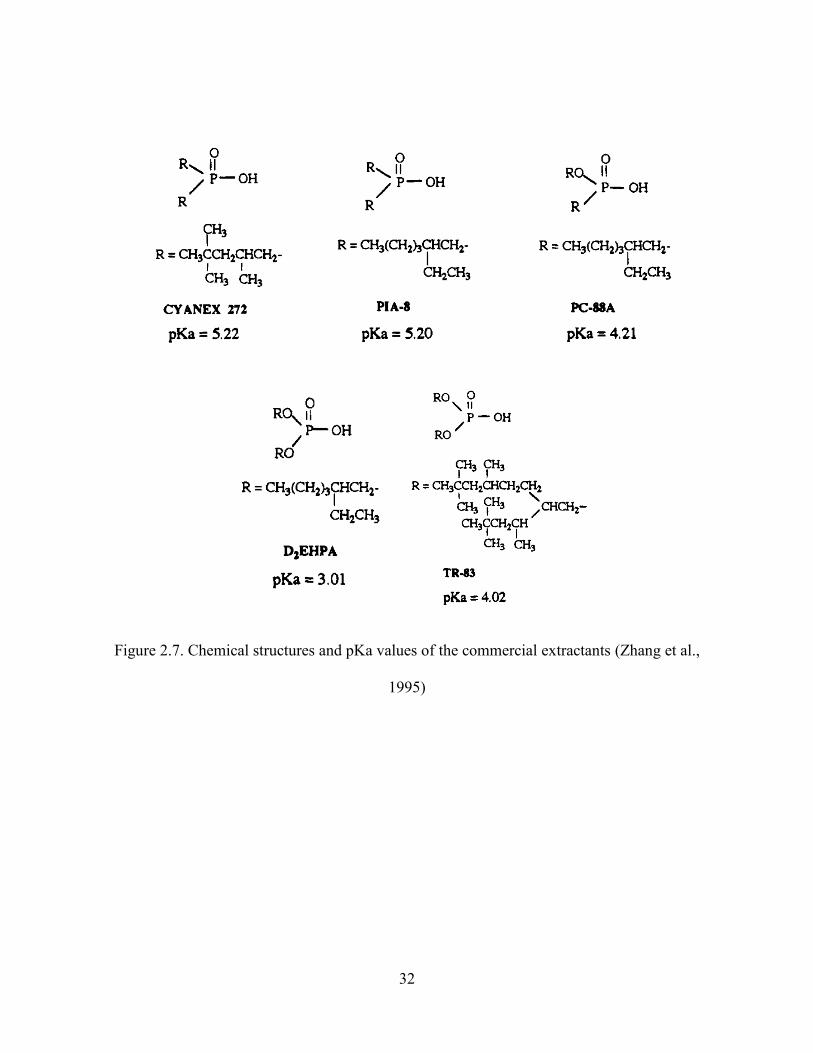
Inoue and Zhang (1995) studied liquid-liquid extraction of vanadium (V) in sulfuric acid using
some commercial acidic organophosphorus reagents such as TR-83, PC-88A, PIA-8, and
CYANEX 272 (Figure 2.7). Figure 2.8 to Figure 2.11 show the experimental results for
vanadium recovery at different pH values.
32
Figure 2.7. Chemical structures and pKa values of the commercial extractants (Zhang et al.,
1995)

33
Figure 2.8. Percentage of extraction of metals from sulfate solutions as a function of equilibrium
pH with 20% CYANEX 272 dissolved in Exxsol D80 (Zhang et al., 1995)
Figure 2.9. Percentage of extraction of metals from sulfate solutions as a function of equilibrium
pH with 20% PIA-8 dissolved in Exxsol D80 (Zhang et al., 1995)

34
Figure 2.10. Percentage of extraction of metals from sulfate solutions as a function of
equilibrium pH with 20% PC-88A dissolved in Exxsol D80 (Zhang et al., 1995)
Figure 2.11. Percentage of extraction of metals from sulfate solutions as a function of
equilibrium pH with 20% TR-83 dissolved in EXXSOL D80 (Zhang et al., 1995)

35
They concluded that CYANEX 272 and PIA-8 are likely to be suitable extractants for the
selective separation and recovery of molybdenum and vanadium from aluminum, cobalt, and
nickel from sulfuric acid media at low pH. However, vanadium, iron, and small amount of
aluminum co-extracted together with molybdenum into the solvent phase. Since Mo cannot strip
by sulfuric acid, they tried to use sulfuric acid for scrubbing the solution. Table 2.7 shows the
result of scrubbing tests.
Table 2.7. Scrub of V, Fe, and Al from the loaded solvent
(The organic solvent was 40% CYANEX 272 and the metal loading was (ppm): 2870 Mo, 760
V, 35 Fe, 40 Al) (Zhang et al., 1995)
scrub reagent
(H2SO4, M) % scrub of metals
Mo V Fe Al
2.75 0.1 68.3 100 100
2.15 0.07 62.1 100 100
1.45 0 54.5 74.3 100
Stripping of molybdenum from the loaded solvent is a key problem in the recovery of
molybdenum by extraction with acidic organophosphorus compounds. Because molybdenum
gives rise to anionic species with an acidic organophosphorus extractant in alkaline solutions and
it is a requirement to recover it as ammonium molybdate for its reuse, aqueous ammonia was
chosen as the strip reagent and its optimum concentration for stripping was determined. As
Table 2.8 shows, the strip performance of molybdenum is largely dependent upon the content of
ammonia. On the other hand, when the content of ammonia solutions was greater than 7%, the
formation of a second organic phase was observed and the viscosity in both phases increased,
making phase separation difficult. It was observed that good phase separation was obtained in
the range of 5-7% ammonia (Table 2.8).

36
Table 2.8. Strip of Mo from the scrubbed solvent (CYANEX272) (Zhang et al., 1995)
NH4OH
(v/v, %)
strip solution (ppm) % strip
of Mo phase separation
pH Mo V
2 - - - - aq white turbid
4 - - - - aq white turbid
5 8.21 2590 80 90.2 clear, good
5.5 8.27 2580 86 89.9 clear, good
6 8.3 2590 94 90.2 clear, good
7 8.43 2640 110 92 clear, good
8 - - - - third phase, viscous
10 -
third phase, viscous
15 - - - - third phase, viscous
20 - - - - third phase, viscous
Vanadium can then be further recovered from the scrub solution containing iron and aluminum
with 40% CYANEX 272 in Exxol D80 and the pH was adjusted to around 1.5 by adding calcium
hydroxide powder. Therefore, 92% of vanadium and nearly 100% of iron were extracted while
aluminum was not extracted at all under the selected conditions. They tried to separate iron and
vanadium by using NH4OH as a stripping agent. Table 2.9 shows that stripping with 2.75 molar
in H2SO4 solution recovered only 82.7% of the vanadium and most of the co-extracted iron.
However, 92.6% stripping of vanadium could be achieved with 6% aqueous ammonia solution
and, in addition, the small amount of co-extracted iron was not stripped at all.

37
Table 2.9. Strip of vanadium from loaded solvent (CYANEX272) (Zhang et al., 1995)
strip agent
strip solution (ppm)
V strip, % Mo V Fe
2.75 M H2SO4 0 330 24 82.7
6% NH4OH 2.0 384 0 96.2
(Solvent loading (ppm): 2 Mo, 399 V, 29 Fe)
Giavarini (1982) showed that a D2EHPA-TBP mixture is less effective than D2EHPA under
similar conditions to extract vanadium from fly ash leach liquor. Extraction of vanadium by tri-
n-octylamine (TOA) and tri-n-octylmethylammonium chloride (TOMAC) is shown in
Figure 2.12 and stripping results are shown in Table 2.10. Alkaline solutions provide favorable
characteristics for the stripping: NaOH is more effective compared with Na2CO3 and NH4Cl
whereas aqueous solutions of salt (NaC1) and acid (HCl) were not suitable for the stripping
(Akita et al., 1995).

38
Figure 2.12. Effect of the solution pH on the percent extraction of vanadium from Na2CO3-
synthesized solution; TOA (tri-n-octylamine: white circles), TOMAC (tri-n-
octylmethylammonium chloride: dark circles) (Akita et al., 1995)
Table 2.10. Stripping of vanadium from TOMAC and TOA solutions with various aqueous
media (Akita et al., 1995)
% stripping
NaOH
2M
Na2CO3
2M
NH4Cl + NH4OH
3M (pH 9.8)
NaCl
1M
HCl
2M
TOMAC 87.6 85.1 68.3 27.9 -
TOA 98.5 86.4 63.4 28.4 17.3
Vw=20 cm3, V°=20 cm3, [V]=179 ppm, 4 hours
The kinetics of solvent extraction was studied by some researchers and they claimed that the
kinetics of extraction of V (IV) by D2EHPA is in the chemical reaction rate control regime
(Hughes and Biswas, 1991; Ipinmoroti and Hughes, 1990). Ipinmoroti and Hughes (1990)
reported a rate constant of 2.8×10⁻³
mol1/2
/S for the extraction of vanadium (IV) by D2EHPA at
28ºC .
39
However, the kinetics of extraction of the forward extraction of VO2+
from the sulfate-acetate
medium by D2EHPA in toluene was studied and it was found that the reaction
(A- is anion of monomeric D2EHPA) occurred at the aqueous film of the interface or in the
bulk aqueous phase as the rate-determining step. It was shown that at higher temperature, Ea˂20
kJ/mol and so the process becomes diffusion-controlled (diffusion of A- to the bulk aqueous
phase or to the aqueous film of the interface becomes slow). However, at lower temperature,
Ea>50 kJ/mol indicating the process is chemical reaction rate controlled (Biswas and Mondal,
2003).
Furthermore, Deng et al (2010) also used Na2SO3 to reduce ferric to ferrous in a solution
containing iron and vanadium. Using 10% P204 (di(2-ethylhexyl) phosphoric acid), 5% TBP,
and 85% kerosene, the authors extracted 94% vanadium and 4.91% iron at pH 2.3, A/O=2 and
contact time 10 minutes.
The extraction of various elements using LIX 63 has been reported by Zhang et al (1996).
Figure 2.13 shows that an increase in pH enhanced the extraction of vanadium (IV) and
percentage extraction reached almost 100% when the pH rose to approximately 2, whereas
aluminum (III), cobalt (II), and nickel (II) were still not extracted. The extraction of iron (III)
was also negligible while molybdenum (VI) and vanadium (IV) can be accomplished by
simultaneous extraction. A pure vanadium (IV) product can be recovered as a sulfate by
selectively stripping vanadium (IV) from the loaded solvent by 2 M sulfuric acid solution (Zhang
et al., 1996).

40
Figure 2.13. pH dependence on the extraction of individual metal ions from sulfuric acid
solutions by 20 vol% LIX63 dissolved in Exxsol 80 (Zhang et al., 1996)
Furthermore, solvent extraction of molybdenum and vanadium from sulfuric acid solution of
spent catalysts was investigated. Both molybdenum (VI) and vanadium (V) can be selectively
extracted over iron (III), aluminum (III), nickel (II), and cobalt (II) from the catalysts using 0.4
M LIX63 in the pH range of 1-2. Over 99.9% of Mo (VI) and V (V) were extracted in a single
contact with only 28 mg/L Al being extracted. The extraction pH isotherm of vanadium (IV) in
Figure 2.13 was quite different from V (V) in Figure 2.14. At pH 1, over 50% of vanadium (IV)
was extracted, while over 97%V was extracted for V (V) (Zeng and Cheng, 2010).

41
Figure 2.14. Effect of pH on the extraction of metal values with 0.5M LIX63 in Shellsol D70 at
an A/O ratio of 1:1 and 40℃ (Zeng and Cheng, 2010)
Mishra et al (2010) also studied the recovery of metal values from spent catalysts. They observed
that after the extraction of Mo by LIX-84I (10%), vanadium could be extracted to greater than
80% at an A/O ratio of 1/5 in 2 stages.
2.3.2.2 Solvent extraction using anion extractants
Vanadium (V) can form the anion species in the mildly acidic and basic range of pH; therefore,
anion extractant solvents are popular in this range. Much research has been done using anion
extractants for vanadium solvent extraction (Meawad et al., 2010). Amines being cations in
character extract vanadium from solution as an anionic complex. As only pentavalent vanadium
forms anionic complexes, it is necessary to oxidize all the vanadium in the solution to the
pentavalent state prior to solvent extraction by amines. The oxidation of V (IV) to V (V) can be
accomplished by oxidants such as H2O2 and the reaction can be written as:
2 VO+2
+ H2O2 = 2 VO2+ + 2H
+ (2.1)

42
The VO2+ formed is solvated according to the reaction:
2 VO2+ + 3H2O = H3V2O7
- + 3 H
+ (2.2)
and extracted by amine. Except in strongly acidic solutions, anionic vanadium complexes exist
over a wide pH range. So it is important to include many results published in the field of the
extraction of vanadium by amines. Secondary, tertiary, and quaternary amines have been used
for vanadium extraction. Tertiary amines (Alamine 336) extract better than the quaternary amine
(Aliquat 336) in the mild acidic pH around 2 to 3. In this section, some of the recent publications
about vanadium extraction using amines will be studied.
Olazabal et al (1992) reported a quantitative extraction of vanadium using different amine
extractants dissolved in Toluene. Vanadium (V) can be extracted by Alamine 336/Toluene in a
wide pH range where mono and polynuclear species of vanadium are present. In addition,
Aliquat 336/Toluene quantitatively extracted vanadium in the range 3.5<pH<9. The extraction
with quaternary ammonium salt is favoured in the region where aqueous polynuclear species are
predominant.
Moreover, Nekovar and Schrotterova (2000) claimed vanadium (V) polymerized at low pH
(within the approximate pH range 2-6) to form polyanions V10O28-n (OH)n(6-n)-
(n=0, 1, 2) and
Primene JMT can extract vanadium in this range effectively.
Figure 2.15 illustrates the percentage of vanadium extracted from leach solutions (3.88 g/L V
(V)) with organic phase made up of amine (5% v/v), isodecanol (5% v/v) as a modifier, and
kerosene using O/A ratio of 1. It can be seen that Primene 81R allows a broad pH range for the
extraction of V (V). However, Alamine 336 is restricted to pH values below 4. pH50 values for
Alamine 336 and Primene 81R were obtained as 4.67 and 7.98, respectively. The authors

43
postulated that the extracted species for vanadium at pH 4.5 is (H2-xV10O28)x-6
with x= 0, 1, 2
while at pH 8, they suggested the extracted vanadium anion species consist of several vanadates:
(V4O12)4-
, (V2O7)4-
, and (VO4)3-
. Extraction isotherms showed that the loading capacity for the
primary amine is six times greater than for the tertiary amine and the primary amine can be used
in the broad pH range (Lozano and Godínez, 2003).
Figure 2.15. Effect of pH on the solvent extraction of V(V) (Lozano and Godínez, 2003)
Bal et al (2004) showed that V (V) in the acidic range as decavanadate species is rapidly
extracted by Aliquat 336 in kerosene modified by n-decanol according to a mechanism of anion
exchange, but the reddish extracted species turns olive green within a few days at room
temperature while a black-greenish solid precipitated. This solid third phase is composed of
mixed-valence decavanadate compounds such as (R3R’N)4(HV3IV
V7VO26) and/or
(R3R’N)4(HV7IV
V3VO24) and when cyclohexanol and ethyl-4-phenol were used as phase
modifiers instead of n-decanol, the precipitation of mixed-valance decavanadates is no longer
observed.

44
Figure 2.16 shows the effect of pH for vanadium extraction using a primary amine (Primene
JMT), a secondary amine (Amberlite LA-2), a tertiary amine (Alamine 304, Alamine 336), and
quaternary ammonium salt (Aliquat 336). Aliquat 336 showed increasing vanadate recovery
efficiency with increasing pH while the other extractants showed a sharp optimum pH.
Moreover, it was shown that 20 mM of Aliquat 336, Primine JMT, Alamine 336, Amberlite LA2
and Alamine 304 could extract about 100, 75, 85, 95, and 70% of vanadium, respectively. So
they concluded Aliquat 336 is more appropriate for vanadium extraction (Navarro et al., 2007).
Figure 2.16. pH influence of vanadium extraction for different extractants (Navarro et al., 2007)
Table 2.11 compares the stripping efficiency of different chemical agents for vanadium recovery
from the loaded organic phase. In the case of Amberlite LA-2, vanadium recovery was readily
achieved using alkaline media (NaOH, ammonia) and mixed media (ammonia and ammonium
salt) with quantitative recovery of the metal. In the case of Aliquat 336, the stripping was much
more difficult and a severe selection of the stripping agent was required. The quantitative
recovery of vanadium was only achieved using a concentrated mixed solution of ammonia and
ammonium salt (1.5M NH3 + 1.5M NH4NO3 or NH4Cl). However, Al was simultaneously and

45
partially extracted with V and the difficulty in stripping V and Al from the loaded organic phase
strongly limits the possibility of the using amine extractants for the treatment of alkaline and
acidic leachates (Navarro et al., 2007).
Table 2.11. Influence of stripping agent and concentration on vanadium stripping from loaded
organic phase (Navarro et al., 2007)
Stripping agent Stripping efficiency (%)
Aliquat 336 Amberlite LA-2
NH4Cl/NH3 (1.5 M each) 100 94
NH4Cl/NH3 (1 M each) 50 Not determined
NH4NO3/NH3 (1.5 M each) 94 100
NH4NO3/NH3 (1 M each) 48 Not determined
NaOH (1 M) 28 98
NH3 (0.5 M) Not determined 98
NH3 (1 M) 3 100
NH3 (2 M) Not determined 100
H2SO4 (1 M) 2 5
In another research (El-Nadi et al., 2009), a comparative study of the solvent extraction of
vanadium (V) of spent catalysts from hydrochloric acid and sodium hydroxide media
(Table 2.12) was separately carried out using an Aliquat-336 extractant dissolved in kerosene
containing 10% n-octanol as a phase modifier. The results indicated that the extraction from the
sodium hydroxide solution is better than from the hydrochloric acid media. However, the acidic
route of leaching and extraction avoids the complication of molybdenum being present in most
of the spent catalysts as an interfering metal.

46
Table 2.12. Extraction of V (V) 1 g/L from alkaline NaOH solution (pH 12.8) using various
extractants (El-Nadi et al., 2009)
Extractant Concentration, M Extraction (%)
Cupferron 0.1 14
8-Hydroxyquinoline 0.1 24
Thenoyltrifluoroacetone 0.1 5.4
Aliquat-336 0.1 45.6
CYANEX 301 0.1 0
CYANEX 302 0.1 0
It was shown in Figure 2.17 that the slope of the log-log linear relationship between Aliquat 336
concentrations with the corresponding distribution ratios is around four, which indicates the
participation of four molecules of the extractant in the extracted V (V) species in the investigated
system.
Figure 2.17. Effect of Aliquat-336 concentration on the extraction of Vanadium (1 g/L) from 3
M HCl solution at 25°C and phase ratio O/A=1(El-Nadi et al., 2009)

47
2.3.2.2.1 Problems with using amines
Pentavalent vanadium species can oxidize amines easily. This limits the use of amines for V (V).
Amines extract rapidly but phase separation is slow. As compared to D2EHPA, the time required
for the amine phase disengagement is large. Stripping of vanadium from amines has to be
controlled as well. Vanadium is stripped from the amine solvents using ammonium solutions.
Stripping with an ammonium salt converts the extracted decavanadate into a metavanadate
species. The low aqueous solubility of ammonium metavanadate (NH4VO3) may results in
crystallization in the aqueous strip liquor (Gupta, 1992).
2.4 Summary
Since vanadium forms different species at different pH, different extractants have been used for
its solvent extraction. Vanadium forms anionic species in a broad range of pH from mildly acidic
to basic; therefore, anionic extractants are popular for vanadium purification. However, amines
have some problems as well. On the other hand, some other cationic extractants showed poor
selectivity, especially with respect to iron, aluminum, and molybdenum. It seems that
understanding the behavior of different vanadium valences (V and IV) and extractants along with
studying the extraction chemistry of iron can make a key contribution to the solvent extraction
processes of vanadium.

48
2.5 Objectives
Considering the literature review, this research has been based on two categories: leaching and
solvent extraction.
Due to the lack of consistent results for vanadium leaching and the lack of deep understanding in
previous research, the goal of the leaching work was identified. It was planned to investigate the
chemistry and kinetics of vanadium leaching over a range of pH values using pure vanadium
oxides as starting material. To reach the goals, the following investigations have been carried
out:
Studying vanadium (V2O5) atmospheric leaching at different pHs to understand the
leaching efficiency in different media as well as the kinetics of leaching
Investigating the impact of reductive agents on vanadium (V2O5) leaching kinetics at
acidic pH
Studying vanadium (V2O3) oxidative leaching in sulfuric acid using different additives
The goals of the solvent extraction work are elaborated as follows:
Study of the extraction chemistry of V (V) and V (IV) and different acid and solvating
extractants
Investigation of separation factors for V (V) and V (IV) over Fe (III) and Fe (II) under a
range of extraction conditions.
Study of extraction stoichiometry of V (V) and V (IV) in the acidic pH range
Study of stripping of metals from loaded solvent.

49
3 Experimental

50
3.1 Leaching
Considering the literature review and the lack of consistent results for vanadium leaching in
various reports, chemical grades of vanadium oxides have been selected to study the behavior of
vanadium leaching by aiming to understand its fundamental hydrometallurgy. Vanadium
pentoxide and vanadium trioxide are the most known and available sources of vanadium oxide.
Therefore, investigating the effect of different parameters on leaching efficiency as well as the
kinetics of leaching could possibly lead to better processes.
3.1.1 Vanadium (V)
3.1.1.1 Material
Chemical grade vanadium pentoxide (V2O5) from Fisher Scientific was used for leaching
experiments. The purity of vanadium pentoxide was greater than 99.6% with low levels of iron
(0.01% max), aluminum (0.03% max), silicon dioxide (0.01% max), sulfur (0.01% max), and
phosphorus (0.01% max). The effect of impurities was not considered in our experiments.
Chemical grade sodium sulfite was used for reductive leaching. The vanadium pentoxide was
screened to various particle size fractions for the study. The -106+75 μm fraction was used for
leaching and solubility studies.
3.1.1.2 Experimental procedure
The experiments to measure leaching rates and vanadium solubility were performed in a Pyrex
reactor equipped with a magnetic stirrer and a reflux condenser. A water bath was used for
controlling the temperature. The final solution was filtered using ashless syringe filter paper and
analyzed for vanadium content with Inductively Coupled Plasma spectroscopy (ICP,
PerkinElmer model Optima 7300). The pH was controlled and recorded via a data acquisition
51
system connected to a computer. The pH was kept constant ( 01.0 ) during the leaching process
by the addition of concentrated sulfuric acid from an acid stock tank on a digital scale connected
to an accurate pump and controller. The vanadium extraction was confirmed using mass balance
by weighing the remaining solid after each test and calculating the extent of leaching. Solubility
of vanadium in different solvents at pH 1 and 30ºC was studied. Vanadium species was also
investigated by Raman spectroscopy. The final vanadium solution after leaching pure vanadium
pentoxide in HCl, H2SO4, and H2SO4 with 0.55 Na2SO4 at pH 1 and 30ºC was analyzed by
Raman spectroscopy. Raman spectra of each sample using a Raman micro-spectrometer that
fibre-couples an IPS 300 mW, 785 nm diode laser to an Olympus BX-51 microscope. This
system collects backscattered light with a six-around-one fibre bundle. The bundle exit, arranged
as a vertical fibre stack, forms a 100 micrometer slit at the entrance of an Acton 300 mm
monochromator coupled to a Princeton instruments PIXIS back-illuminated CCD detector. A
laboratory computer reads the CCD, and bins the pixels in each column, t, from 1 to 1400 to
form a spectrum of scattered-light intensity versus Raman shifted wavelength. Samples were
prepared for analysis by filling a 100 microliter aluminum well plate. Spectral acquisitions
combine the signals recorded from five accumulations using a 5 s exposure time for each.
In the second phase, the kinetics of vanadium pentoxide leaching by weak acid solution (pH 5)
and dilute sodium hydroxide solution (pH 8) was studied. In these tests, pH was kept constant by
adding sodium hydroxide during the experiment. Vanadium (V) concentration was also analyzed
by ICP. It should be clarified that in all of the experiments, kinetics of the overall reaction was
investigated and mechanism of the reaction was not considered.
In the last step, the kinetics of the reductive leaching of vanadium (V) using sodium sulfite was
investigated. The effects of pH, temperature, and sulfite concentration on the kinetics were

52
studied. For this part of the project, UV-spectroscopy (PerkinElmer model Lambda 35) was
applied to analyze vanadium (IV) concentration in the leach solution samples (Kanamori et al.,
1999; Yang and Gould, 2003). UV spectroscopy showed a suitable accuracy for vanadium (IV)
standard solutions in sulfuric acid.
3.1.2 Vanadium (III)
3.1.2.1 Material
Chemical grade vanadium trioxide (V2O3), iron (III) sulfate pentahydrate and iron (II) sulfate
heptahydrate made by Fisher Scientific were used for experiments. The vanadium trioxide was
screened to various particle size fractions for the study. The -106+75 μm fraction was used for
leaching studies.
3.1.2.2 Experimental procedure
The procedure involved leaching vanadium trioxide in 0.5 L sulfuric acid solution in a 1 L Pyrex
reactor equipped with a magnetic stirrer for agitation and a reflux condenser to prevent water
loss. The pH was also controlled in these experiments. The pH was monitored using a glassy pH
electrode from Applisens (model: Z001023551) connected to the controller. The pH was
calibrated using standard buffer of 1.68, 4 and 7 with temperature adjustment. At 30°C, 94 g/L of
sulfuric acid made a solution of pH 0. For experiments at higher temperature, higher sulfuric acid
concentrations were added to keep an initial pH of 0. The reactor was immersed in a water bath
to control the temperature. Samples of solution were withdrawn with time to follow the kinetics
of leaching. The final slurry was filtered using ashless syringe filter paper and analyzed for
vanadium content with ICP or UV spectroscopy (Kanamori et al., 1999; Yang and Gould, 2003).
The leaching kinetics were investigated in three steps. First, the acid oxidation leaching of
53
vanadium trioxide using oxygen was studied. A flow of 480 mL/min of oxygen with a purity of
more than 99.5% was injected into the solution containing 1 g/L of V2O3 in sulfuric acid. The
effects of temperature, pH, particle size, and stirring speed on the leaching of vanadium were
studied. Secondly, a mixture of ferric and oxygen as oxidative agents was used for oxidative
leaching of vanadium. For these experiments, 180 mL/min of oxygen was applied during these
experiments, again at 1 g/L of vanadium trioxide. The effects of the initial ferric concentration,
temperature, and pH were then studied. Finally, in the third step, a constant potential (Bouffard
et al., 2006) was applied to study the kinetics of vanadium oxidative leaching. This technique
involves adding a solution of potassium permanganate to maintain a constant ferric/ferrous ratio
in leaching. For these experiments, 1 g/L of vanadium trioxide was leached in sulfuric acid
solution at pH 0. Leaching tests were performed under constant potential conditions which
involved the control of every relevant variable during leaching. The addition of 0.5 M potassium
permanganate solution was controlled to a constant potential (ferric/ferrous ratio) set point using
a controller connected to ORP electrode. The ORP electrode was a single junction platinum
electrode with an Ag/KCl internal reference electrode which was made by Analytical Sensors &
Instruments as a special electrode for UBC (Model: R0DM-0006). Since the ferric-ferrous redox
reaction is reversible on the platinum surface, it can be assumed that potential is controlled by
that ratio. Hence by maintaining constant potential, the ferric/ferrous ratio was maintained
constant. The mass of the oxidant solution was continually monitored via a digital scale
connected to a computer for continuous data capture. Potassium permanganate is highly soluble
in acidic media and rapidly re-oxidizes the ferrous ion to ferric ion. Permanganate has simple
aqueous chemistry in pH 2 solutions and generates five electron-moles of oxidation per mole of
reduced permanganate. The use of permanganate for constant potential leaching tests has been
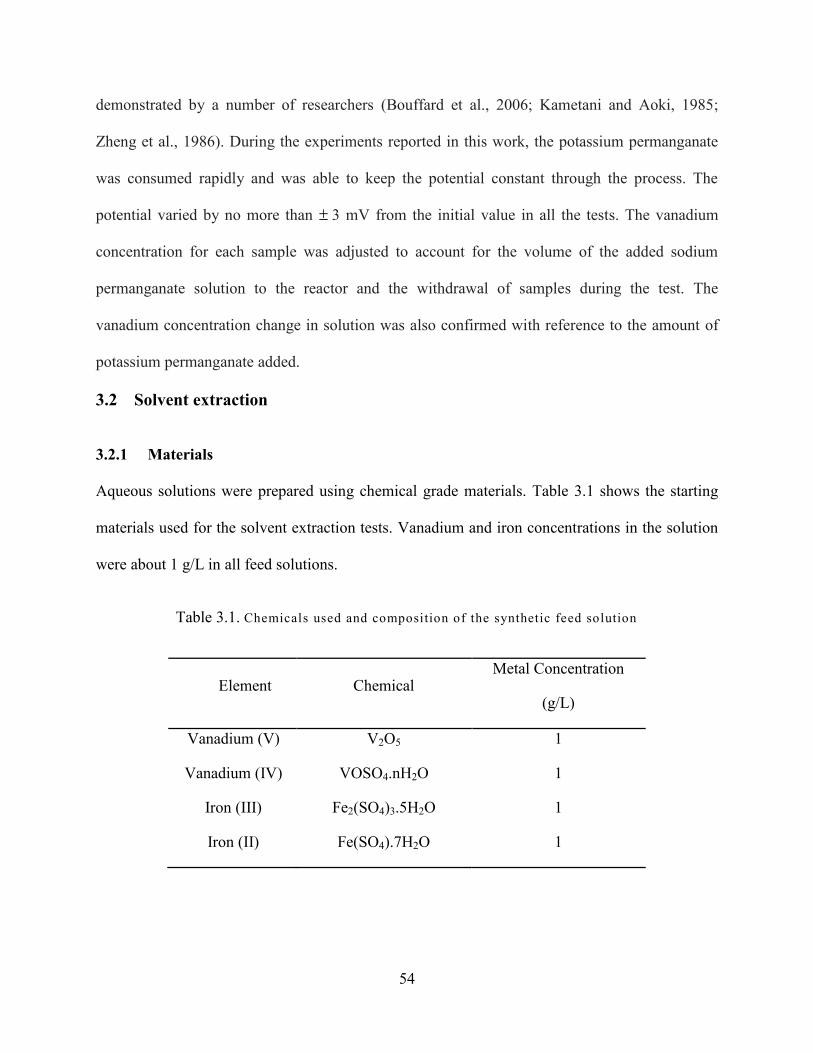
54
demonstrated by a number of researchers (Bouffard et al., 2006; Kametani and Aoki, 1985;
Zheng et al., 1986). During the experiments reported in this work, the potassium permanganate
was consumed rapidly and was able to keep the potential constant through the process. The
potential varied by no more than 3 mV from the initial value in all the tests. The vanadium
concentration for each sample was adjusted to account for the volume of the added sodium
permanganate solution to the reactor and the withdrawal of samples during the test. The
vanadium concentration change in solution was also confirmed with reference to the amount of
potassium permanganate added.
3.2 Solvent extraction
3.2.1 Materials
Aqueous solutions were prepared using chemical grade materials. Table 3.1 shows the starting
materials used for the solvent extraction tests. Vanadium and iron concentrations in the solution
were about 1 g/L in all feed solutions.
Table 3.1. Chemicals used and composition of the synthetic feed solution
Element Chemical Metal Concentration
(g/L)
Vanadium (V) V2O5 1
Vanadium (IV) VOSO4.nH2O 1
Iron (III) Fe2(SO4)3.5H2O 1
Iron (II) Fe(SO4).7H2O 1
55
All of the extractants (CYANEX 272, IONQUEST 801, D2EHPA, and CYANEX 923) were
used as-received without any further purification. ORFOM SX-12 supplied by Chevron Phillips
was used as a diluent of the organic phase in the experimental program.
3.2.2 Experimental procedure
Extraction studies were carried out by mechanical stirring of the aqueous and organic solutions
in a glass reactor at 30°C with a stirring speed of 900 rpm for 20 minutes (Figure 3.1). The pH
was stable after the first few minutes for all cases. All of the reported points for the extraction
were obtained by running a single batch-single element experiment. The pH was kept constant
by adding 2M sulfuric acid or 4M sodium hydroxide. After extraction, phase separation was
performed using separatory funnels at room temperature. The aqueous solutions were then
filtered through Whatman 3 filter paper and analyzed by Inductively Coupled Plasma (ICP) or
Atomic Absorption Spectroscopy (AAS). The organic phase was filtered through Whatman 1PS
filter paper for stripping tests. Only the metal concentrations in aqueous samples were analyzed
and the extraction was calculated from the initial and final aqueous solution concentrations. For
each test, 100 mL of organic and 100 mL of aqueous solution were mixed together. Nitrogen was
injected into the ferrous solution before the solvent extraction to remove oxygen from the
solution. Since precipitation of ferric occurred above pH 2, solvent extraction tests were
conducted below pH 2.

56
Figure 3.1. The experimental set up for solvent extraction tests
3.3 Magnitude of errors in the experiments
Error was minimized in the experimental work because pure materials were used for this project,
and the experimental conditions were carefully controlled.. However, the following errors should
be considered:
1- 1- All of the results were reported using analytical techniques such as ICP, AA and UV-
spectroscopy. For these techniques, it is expected that an error of ± 3-5% in analysis can
take place. This typically means that leach extractions and solvent extraction recovery
values are accurate within the same range of values. There are some error involved in pH
measurement for strong acidic solution in high temperature. However, it was attempted to
minimize this error by calibration using acidic buffer solutions at different temperatures.
A range of error of ± 0.1 pH units might be expected for the experiments completed.

57
2- Particle size of the starting materials was obtained using different mesh sizes. The
analyses were reported for an average particle size in a round shape. This error should not
have any significant contribution on the total error.
Repeat analyses of solutions and measurements of vanadium extraction showed errors in the
ranges cited above.

58
4 Vanadium (V) leaching

59
4.1 Thermodynamics of the vanadium –water system
Vanadium has a wide range of stable oxidation states with the most common states being +2, +3,
+4, and +5. Vanadium can form a variety of complex species and oxidation states in aqueous
solutions (Barner and Scheueman, 1978; Gupta, 1992; Tracy et al., 2007).
In order to understand vanadium leaching, it is important to examine vanadium chemistry.
Vanadium (V) species versus pH was depicted in Figure 4.1 using Medusa software
(Puigdomenech, 2004). It can be seen below that vanadium (V) ion has a very complex
chemistry in aqueous solution. A pentavanadyl cation VO2+ forms at low pH, and, at higher pH
values a variety of anions are present.
Figure 4.1. Speciation of vanadium (V) in aqueous media at 25℃

60
4.2 Solubility
The kinetics of V2O5 leaching at different solid to liquid ratios was studied. As Figure 4.2 shows,
the kinetics of vanadium (V) leaching is rapid at 90°C. However, at a high solid to liquid ratio,
the leaching halted abruptly after a short time, apparently because the vanadium solution had
reached its solubility limit. In fact, the solution has been saturated by vanadium to the same
concentration for the experiments performed at 5 and 10 g/L solid to liquid ratio. This means that
when there is enough sulfuric acid in the solution, the leaching can be completed quickly.
However, acid concentration must be kept high through the leaching process. This suggests that
the final leach solution will have significant amounts of sulfuric acid which should be neutralized
by sodium hydroxide before the purification step.
The solubility of VO2+ was studied at different pHs from 0.3 to 1.4 and at varying temperatures.
Figure 4.3 through Figure 4.6 illustrate vanadium extraction versus time at different pH’s at 30,
50, 70, and 90°C. The limiting concentration reached in each experiment represents the solubility
of pentavalent vanadium in each leach solution at the temperature used for leaching.

61
Figure 4.2. The effect of solid to liquid ratio on V2O5 leaching; (a) vanadium extraction, (b)
vanadium molarity (60g/L H2SO4, 90 °C, 90 µm, and 600 rpm)

62
Figure 4.3. The effect of pH on vanadium leaching at 30°C
(at 10 g/L V2O5, 90 µm, and 600 rpm)
Figure 4.4. The effect of pH on vanadium leaching at 50°C
(at 10 g/L V2O5, 90 µm, and 600 rpm)
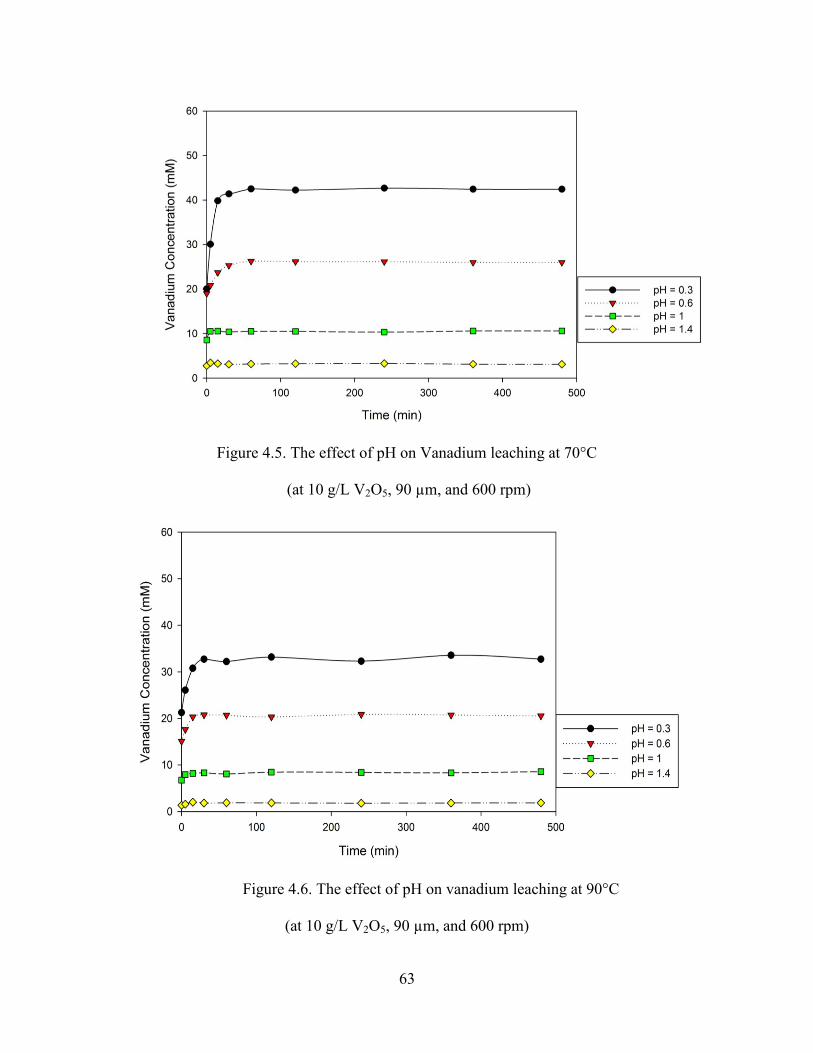
63
Figure 4.5. The effect of pH on Vanadium leaching at 70°C
(at 10 g/L V2O5, 90 µm, and 600 rpm)
Figure 4.6. The effect of pH on vanadium leaching at 90°C
(at 10 g/L V2O5, 90 µm, and 600 rpm)

64
The results show that the vanadium leaching to VO2+ is rapid but this species suffers from low
solubility. Thermodynamic data were studied for comparison with the experimental results and
clarification. Table 4.1 shows the thermodynamic data for the following reaction, which can be
expected to occur in acidic media. It should be mentioned that for solubility calculations, the
activity coefficients for the aqueous species of vanadium was assumed to be 1.
V2O5 + 2H+ = 2VO2
+ + H2O (4.1)
Table 4.1. Thermodynamic data for equation 4.1 (Barner and Scheueman, 1978; Evans and
Garrels, 1958; Wanty and Goldhaber, 1992)
Temperature
(°C)
ΔH°
(kJ)
ΔS°
(J/K)
ΔG°
(kJ) K
Calculated Vanadium Solubility (mM)
pH 0.3 pH 0.6 pH 1 pH 1.4
30 -35.18 -147.73 9.60 2.21×10⁻²
74.57 37.37 14.87 5.92
50 -38.06 -156.95 12.65 9.01×10⁻³
47.56 23.83 9.49 3.77
70 -40.70 -164.89 15.87 3.83×10⁻³
31.03 15.55 6.19 2.46
90 -43.34 -172.35 19.24 1.70×10⁻³
20.68 10.36 4.13 1.64
As shown, the solubility of this cation is affected significantly by temperature and pH.
Considering thermodynamic data and Le Chatelier’s principle, it would be expected that, by
decreasing pH and temperature, the solubility of VO2+
increases. However, the experimental data
reported higher values for solubility than that presented in Table 4.1. This can be explained with
reference to the complexation of vanadium in sulfate media. In a solution containing
sulfate/bisulfate anions, a mono sulfate or mono bisulfate complex may be formed according to
the following reactions:

65
VO2+ + SO4
-2 = VO2SO4
-
(4.2)
VO2+ + HSO4
- = VO2HSO4
β
(4.3)
The equilibrium constant (Log β1) for reaction 4.2 has been reported as 0.98 (Ivakin, 1966), 1.3
(Rakib and Durand, 1996), and 1.72 (Puigdomenech, 2004). Besides, the equilibrium constant
(Log β1) for reaction 4.3 was also reported -0.136 (Ivakin, 1966). In fact, in non-complexing
aqueous acidic solution, the pentavanadyl ion (
2VO ) is the only dominant cation in the solution.
However, the formation of the vanadium sulfate complex can increase solubility of vanadium in
sulfuric acid media. To investigate in more detail, the solubility of vanadium in different acid
media and the effect of ionic strength and complexation have been studied. Figure 4.7 shows
vanadium solubility in sulfuric acid, nitric acid, and hydrochloric acid. The results after 2 hours
leaching were depicted because vanadium had reached its solubility limit in all the experiments.
Moreover, each test was continued for 8 hours to make sure that the solubility number did not
change significantly. It can be seen that the solubility of vanadium in nitric and hydrochloric acid
is almost the same at pH 1 and 30°C. However, the solubility of vanadium in sulfuric acid is
greater. To investigate the effect of added salt on vanadium solubility considering ionic strength
and complexation (Butler, 1998), the solubility of vanadium in hydrochloric acid was studied by
adding 0.33 and 1.65 molar sodium chloride and 0.11 and 0.55 molar sodium sulfate separately.
The results shown in Figure 4.7 confirm that by increasing the sulfate concentration in solution,
the solubility of vanadium increases. This is believed to be due to the complexation of the
vanadyl ion by sulfate.

66
Figure 4.7. The effect of different solvent and adding different salts on vanadium solubility
(at 10 g/L V2O5, 90 µm 30°C, pH 1, and 600 rpm)
Some techniques have been developed to study speciation in solution. Raman spectroscopy is
one of the well-known methods for this purpose. This technique has been used to detect different
cations in vanadium solutions formed with various acids and complexing salt additions (Bal et
al., 2004; Chagnes et al., 2010; Hurley et al., 2011; Tomikawa and Kanno, 1998; Tracy et al.,
2007). The final solutions after leaching at pH 1 by hydrochloric acid with no salt and 0.55 M
sodium sulfate as well as sulfuric acid with no additives were characterized by Raman
spectroscopy. As Figure 4.8 shows, when the matrix is hydrochloric acid, soluble vanadium only
appears as one cation, VO2+. However, when sulfate is available in the solution, vanadium has
been confirmed to complex as . Lastly, with the addition of sodium sulfate to the
hydrochloric acid solution, the formation of appears on the Raman spectra.

67
Figure 4.8. Raman spectra for vanadium solution to confirm vanadium complexation in the
presence of sulfate
As discussed above, acid leaching of vanadium pentoxide suffers from the low solubility of
vanadium. However, it was shown that by increasing the sulfate concentration in the system, the
vanadium solubility will increase due to complexation. Two alternate strategies for overcoming
the low solubility of vanadium have been investigated. Leaching at higher pH and reductive
leaching have been applied to change the vanadium species in solution in an attempt at
increasing solubility.

68
4.3 Leaching of vanadium in pH 5-8 solution
The kinetics of vanadium leaching using mildly acidic or mild basic solution was investigated.
According to Figure 4.1, vanadium (V) can form decavanadate anion in solution at pH 5. The
formation of decavanadate can proceed by the following reaction:
5V2O5 + 5OH- = HV10O28
-5 + 2H2O ΔG
°298K= -648.02 kJ/mol (4.4)
This reaction is highly favorable. The decavanadate species has a high solubility in water.
Therefore, solubility limits should not impede leaching of vanadium under conditions designed
to form decavanadate. During the leaching process, the pH was kept constant by adding sodium
hydroxide to the solution. Figure 4.9 shows the effect of temperature on vanadium leaching.
Temperature has a significant effect on vanadium leaching. Vanadium pentoxide was nearly
completely leached in 90 minutes at 90°C. However, less than 40% of the vanadium was leached
in that same time at 30°C.
Figure 4.9. The effect of temperature on vanadium leaching
(at pH 5, 10 g/L, 90 µm, and 600 rpm)

69
Moreover, leaching at higher pH has also been studied. Reactions 4.5 and 4.6 show the
chemical reactions that form the two anion species that dominate at pH 8 (Pourbaix,
1949; Puigdomenech, 2004):
3V2O5 + 6OH- = 2V3O9
-3 + 3H2O ΔG
°298K= -221.9 kJ/mol (4.5)
2V2O5 + 4OH- = V4O12
-4 + 2H2O ΔG
°298K= -208.6 kJ/mol (4.6)
According to the thermodynamic data, all of these anion species in the solution have high
solubility. Therefore, the effect of temperature on the kinetics of vanadium leaching in mildly
basic media was investigated. Figure 4.10 represents the effect of temperature on vanadium
leaching. It was observed that the temperature has a significant effect on vanadium leaching in
mildly basic media. Moreover, the molar ratio of sodium hydroxide consumption to vanadium
pentoxide was determined to be 2.09 for leaching at pH 8 and 90°C. This value is very close to
the ratio from reactions 4.5 and 4.6. In addition, it was shown that by increasing the pH from 5 to
8, the kinetics of vanadium leaching improved drastically. For instance, at 90ºC, the leaching
was completed in one hour at pH 8; while it required 2 hours at pH 5. At other temperatures, the
time to obtain similar recovery for vanadium was almost double at pH 5 compared with pH 8.

70
Figure 4.10. The effect of temperature on vanadium leaching
(at pH 8, 10 g/L, 90 µm, and 600 rpm)
4.4 Reductive leaching
Since vanadium (IV) has higher solubility than vanadium (V) in acidic media (Puigdomenech,
2004), reductive leaching can be applied to increase vanadium extraction at a modest pH and
hence decrease acid consumption in the leaching and vanadium recovery process. The kinetics of
reductive vanadium pentoxide leaching using sodium sulfite was investigated. The effects of
varying temperature, particle size, stirring speed, pH, and sodium sulfite concentration were
studied. For the kinetic study, since pure vanadium pentoxide was used and all spherical particles
were shrunk through the leaching process (without formation of an “ash layer”), the shrinking
sphere model was applied to describe the reductive leaching of vanadium. For the reaction of this
kind, the following three steps occurring in succession:
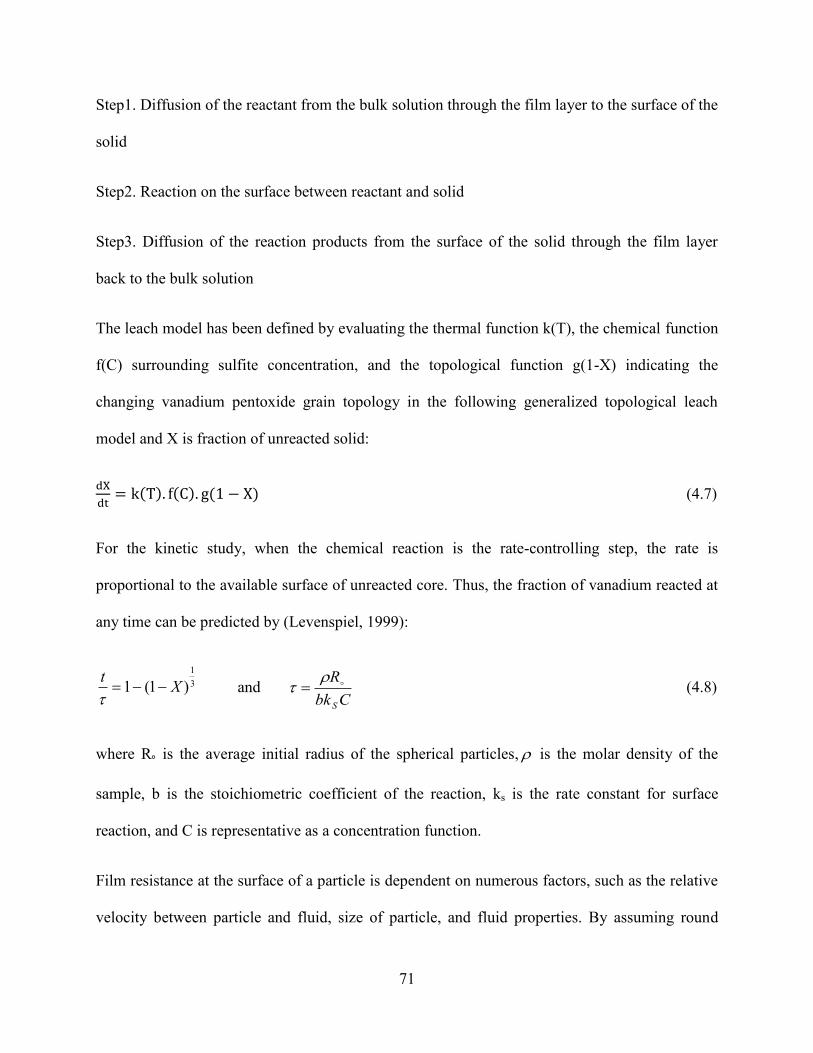
71
Step1. Diffusion of the reactant from the bulk solution through the film layer to the surface of the
solid
Step2. Reaction on the surface between reactant and solid
Step3. Diffusion of the reaction products from the surface of the solid through the film layer
back to the bulk solution
The leach model has been defined by evaluating the thermal function k(T), the chemical function
f(C) surrounding sulfite concentration, and the topological function g(1-X) indicating the
changing vanadium pentoxide grain topology in the following generalized topological leach
model and X is fraction of unreacted solid:
(4.7)
For the kinetic study, when the chemical reaction is the rate-controlling step, the rate is
proportional to the available surface of unreacted core. Thus, the fraction of vanadium reacted at
any time can be predicted by (Levenspiel, 1999):
3
1
)1(1 Xt
and Cbk
R
S
(4.8)
where R is the average initial radius of the spherical particles, is the molar density of the
sample, b is the stoichiometric coefficient of the reaction, ks is the rate constant for surface
reaction, and C is representative as a concentration function.
Film resistance at the surface of a particle is dependent on numerous factors, such as the relative
velocity between particle and fluid, size of particle, and fluid properties. By assuming round

72
particles in the same size, , equations 4.9 can be obtained. This equation represents the fraction
of vanadium reacted at any time when the resistance to diffusion through the hydrodynamic film
controls the rate of the reaction (Levenspiel, 1999):
3
2
)1(1 Xt
and CbD
R
e2
2
(4.9)
where , R , b, and C are defined as equation 4.9 and De is the diffusion coefficient.
4.4.1 Effect of temperature
Figure 4.11 illustrates the effect of temperature on vanadium extraction. It shows that by
increasing the temperature, the rate of the reaction also increases.
Figure 4.11. The effect of temperature on vanadium reductive leaching
(at 10 g/L V2O5, 10.39 g/L Na2SO3, 90 µm, pH 1, and 600 rpm)
73
Figure 4.12 was obtained for experiments with constant pH and sodium sulfite concentration
using equations 4.8 and 4.9. The model showed a suitable fit based on chemical control
compared to diffusion control. The data fit the required linear relationship with extrapolation
through the origin. Therefore, it can be concluded that the reductive leaching of vanadium using
sulfite is controlled by the reaction at the surface of the particle.
Using the data obtained at the various temperatures, the apparent activation energy of the
reaction using an Arrhenius relationship has been obtained. Using the slope of the Arrhenius
curve in Figure 4.13, an activation energy of 33 kJ/mol is calculated.

74
Figure 4.12. (a) Plot of ))1(1( 3
1
X versus time for various temperature test; (b) Plot of ))1(1( 3
2
X
versus time for various temperature test (at 10 g/L V2O5, 10.39 g/L Na2SO3, 90 µm, pH 1, and
600 rpm)

75
Figure 4.13. Arrhenius plot for activation energy calculation for reductive leaching
The particles were studied during leaching by taking intermediate samples and observing using
SEM (Hitachi model S-3000N). Figure 4.14 shows SEM pictures for particle shape after 20
minutes of leaching at pH 1 at temperatures of 30 and 90°C. It was shown that the particles are
roughly round. As the leaching rate increases with temperature, the particles shrink and the
porosity on the surface increases.

76
Figure 4.14. SEM image for (a) the initial particle; (b) after 20 minutes of leaching at 30°C; (c)
after 20 minutes of leaching at 90°C (at 10 g/L V2O5, 10.39 g/L Na2SO3, 90 µm, pH 1, and 600
rpm; white right corner rectangle shows the scale bar for 50 µm)
4.4.2 Effect of particle size
The fraction reacted versus time plots are shown in Figure 4.15 in different particles sizes. As
shown, the kinetics of the leaching reaction increased with decreasing particle size. A shrinking
sphere model was used to analyze the experimental data.
Figure 4.16 shows the linear relation between the reaction rate and 1/d and confirms the reaction
control mechanism for reductive leaching (equation 4.8).

77
Figure 4.15. The effect of particle size on vanadium reductive leaching
(at 70°C, 10 g/L V2O5, 10.39 g/L Na2SO3, pH 1, and 600 rpm)
4.4.3 Effect of stirring speed
In order to rule out mass transfer as a possible rate control mechanism, the effect of stirring
speed variation on vanadium reductive leaching was investigated at 500, 600, and 700 rpm.
Figure 4.17 represents that stirring speed has no significant effect on the kinetics of leaching.
Therefore, considering the obtained results for activation energy, particle size, and stirring speed,
it can be positively claimed that the kinetics of leaching is controlled by chemical reaction rate,
not mass transfer.

78
Figure 4.16. (a) Plot of ))1(1( 3
1
X versus time for various particle sizes (b) The effect of particle
size on the rate of dissolution of vanadium (at 70°C, 10 g/L V2O5, 10.39 g/L Na2SO3 , pH 1, and
600 rpm)

79
Figure 4.17. The effect of stirring speed on vanadium reductive leaching
(at 10 g/L V2O5, 10.39 g/L Na2SO3, 90 µm, pH 1)
4.4.4 Effect of sodium sulfite concentration
To investigate the effect that reductive additive concentration had on leaching efficiency, 10 g/L
of V2O5 was leached using different amounts of sodium sulfite. The temperature was set at 70°C,
pH 1, and the stirring speed was adjusted to 600 rpm. As shown in Figure 4.18, by increasing the
amount of sulfite, the leaching rate also increased.
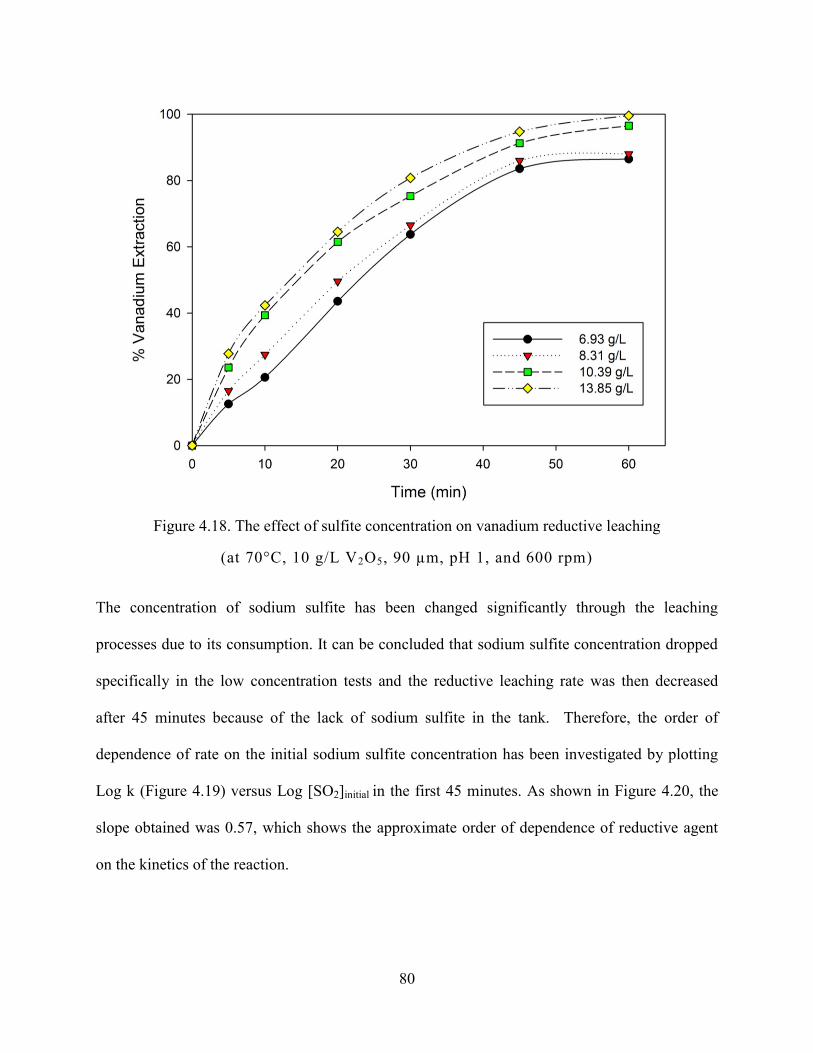
80
Figure 4.18. The effect of sulfite concentration on vanadium reductive leaching
(at 70°C, 10 g/L V2O5, 90 µm, pH 1, and 600 rpm)
The concentration of sodium sulfite has been changed significantly through the leaching
processes due to its consumption. It can be concluded that sodium sulfite concentration dropped
specifically in the low concentration tests and the reductive leaching rate was then decreased
after 45 minutes because of the lack of sodium sulfite in the tank. Therefore, the order of
dependence of rate on the initial sodium sulfite concentration has been investigated by plotting
Log k (Figure 4.19) versus Log [SO2]initial in the first 45 minutes. As shown in Figure 4.20, the
slope obtained was 0.57, which shows the approximate order of dependence of reductive agent
on the kinetics of the reaction.

81
Figure 4.19. Plot of
versus time for various initial sulfite concentration tests
(at 70°C, 10 g/L V2O5, 90 µm, pH 1, and 600 rpm)
Figure 4.20. The effect of initial sulfite concentration on the rate of dissolution of vanadium (at
70°C, 10 g/L V2O5, 90 µm, pH 1, and 600 rpm)

82
4.4.5 Effect of pH
The effect of pH on leaching is seen in Figure 4.21 which indicates that pH has a significant
effect on vanadium reductive leaching rates. The leaching process was completed in less than 30
minutes at pH 0.5 and about 1 hour at pH 1; however, less than 70% of vanadium was dissolved
at pH 1.5 after one hour.
Figure 4.21. The effect of pH on vanadium reductive leaching
(at 70°C, 10 g/L V2O5, 10.39 g/L Na2SO3,90 µm, and 600 rpm)
Since pH can affect the leaching reaction and can change sulfite species as a reductive additive in
the solution, it can be considered as an independent parameter. Therefore, to investigate the
effect pH has on the kinetics of vanadium leaching, both chemistry and electrochemistry have
been considered for vanadium reductive leaching.
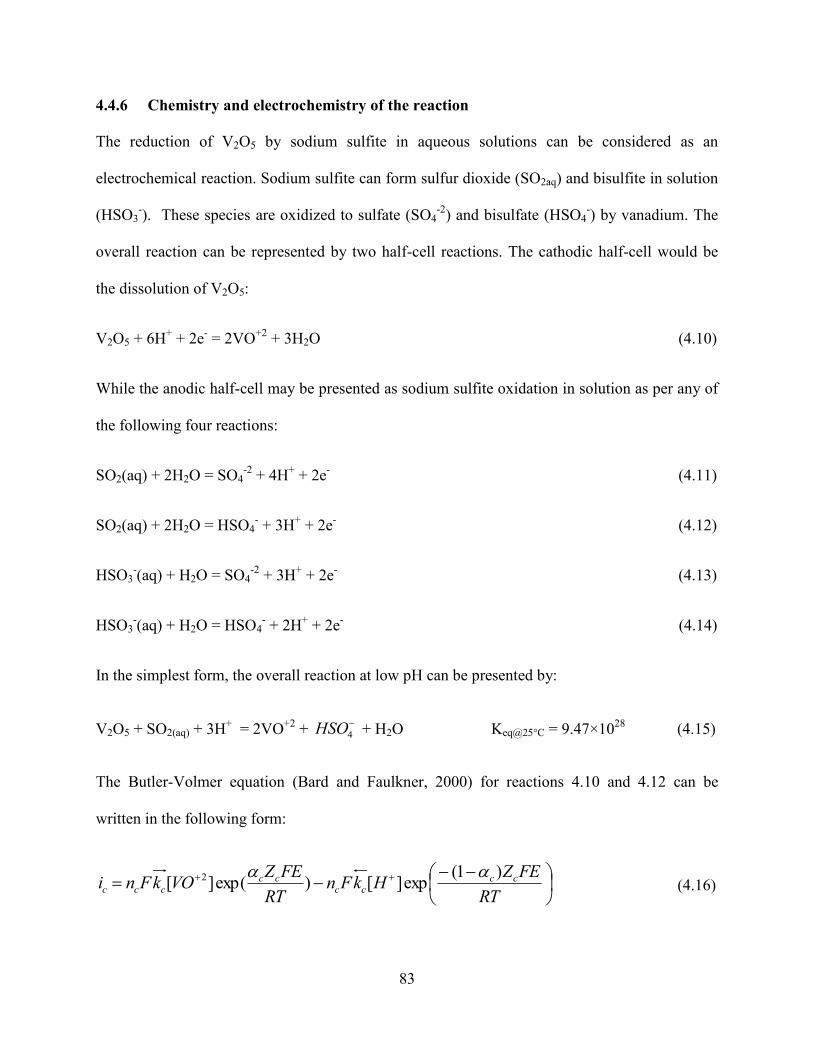
83
4.4.6 Chemistry and electrochemistry of the reaction
The reduction of V2O5 by sodium sulfite in aqueous solutions can be considered as an
electrochemical reaction. Sodium sulfite can form sulfur dioxide (SO2aq) and bisulfite in solution
(HSO3-). These species are oxidized to sulfate (SO4
-2) and bisulfate (HSO4
-) by vanadium. The
overall reaction can be represented by two half-cell reactions. The cathodic half-cell would be
the dissolution of V2O5:
V2O5 + 6H+ + 2e
- = 2VO
+2 + 3H2O (4.10)
While the anodic half-cell may be presented as sodium sulfite oxidation in solution as per any of
the following four reactions:
SO2(aq) + 2H2O = SO4-2
+ 4H+ + 2e
- (4.11)
SO2(aq) + 2H2O = HSO4- + 3H
+ + 2e
- (4.12)
HSO3-(aq) + H2O = SO4
-2 + 3H
+ + 2e
- (4.13)
HSO3-(aq) + H2O = HSO4
- + 2H
+ + 2e
- (4.14)
In the simplest form, the overall reaction at low pH can be presented by:
V2O5 + SO2(aq) + 3H+ = 2VO
+2 +
4HSO + H2O Keq@25°C = 9.47×1028
(4.15)
The Butler-Volmer equation (Bard and Faulkner, 2000) for reactions 4.10 and 4.12 can be
written in the following form:
RT
FEZHkFn
RT
FEZVOkFni cc
cccc
ccc
)1(exp][)exp(][ 2
(4.16)

84
RT
FEZHSOkFn
RT
FEZSOkFni aa
aaaa
aqaaa
)1(exp][)exp(][ 42
(4.17)
where nc, na are total charge transfer, ck , ck , ak ,and ak are the rate constant for forward and
reverse reactions for the cathodic and anodic, respectively. Zc and Za are the number of electrons
transferred in the charge transfer process. It was assumed that Zc and Za are one. αc and αa are the
transfer coefficients for equations 4.16 and 4.17 that represent the symmetry of the activation
barrier for the cathodic and anodic charge-transfer reaction.
It was assumed that the potential difference is large enough that backward reactions kinetics are
slow and can be neglected. Therefore, cathodic and anodic reactions can be rewritten as below:
RT
FEZHkFi cc
cc
)1(exp][2
(4.18)
)exp(][2 2RT
FEZSOkFi aa
aqaa
(4.19)
The net current density is zero at the mixed potential:
)()(0)( mamc
yields
m EiEiEi (4.20)
Then, the exchange current density can be derived by the following relationship:
)exp(][2)1(
exp][2 2RT
FEZSOkF
RT
FEZHkFi maa
aqamcc
c
(4.21)
RT
FE
Hk
SOkmac
c
aqa )1(exp
][
][ 2 (4.22)

85
It is common to assume symmetric electron transfer in the Butler Volmer equation and this often
agrees well with experimental Tafel plots. This assumption is also mathematically convenient.
Therefore, by assuming αc=αa=0.5:
(4.23)
Considering Faraday’s law, the rate of the overall electrochemical reaction can be obtained as:
Fn
iA
dt
dn
dt
dn
c
ccSOOV aq
252
(4.24)
5.0
2
5.0*
5.0
2][][
][
][][)
2exp(][52
aq
c
aqa
ccm
cc
OVSOHk
Hk
SOkHkA
RT
FEHkA
dt
dn
(4.25)
On the other hand, SO2 can be considered as a weak acid in the solution that dissociates as
follows:
SO2(aq) + H2O = H+
+ HSO3- ,
5.0
2
3
][
]][[
aq
eSO
HSOHK
(4.26)
And the total concentration of SO2 would be:
[SO2]total = [HSO3-] + [SO2]aq (4.27)
Combining equations (4.26) and (4.27):
][1
][][ 2
2
H
K
SOSO
e
total
aq (4.28)
Considering equations (4.24) and (4.28), the rate of vanadium pentoxide dissolution would be:
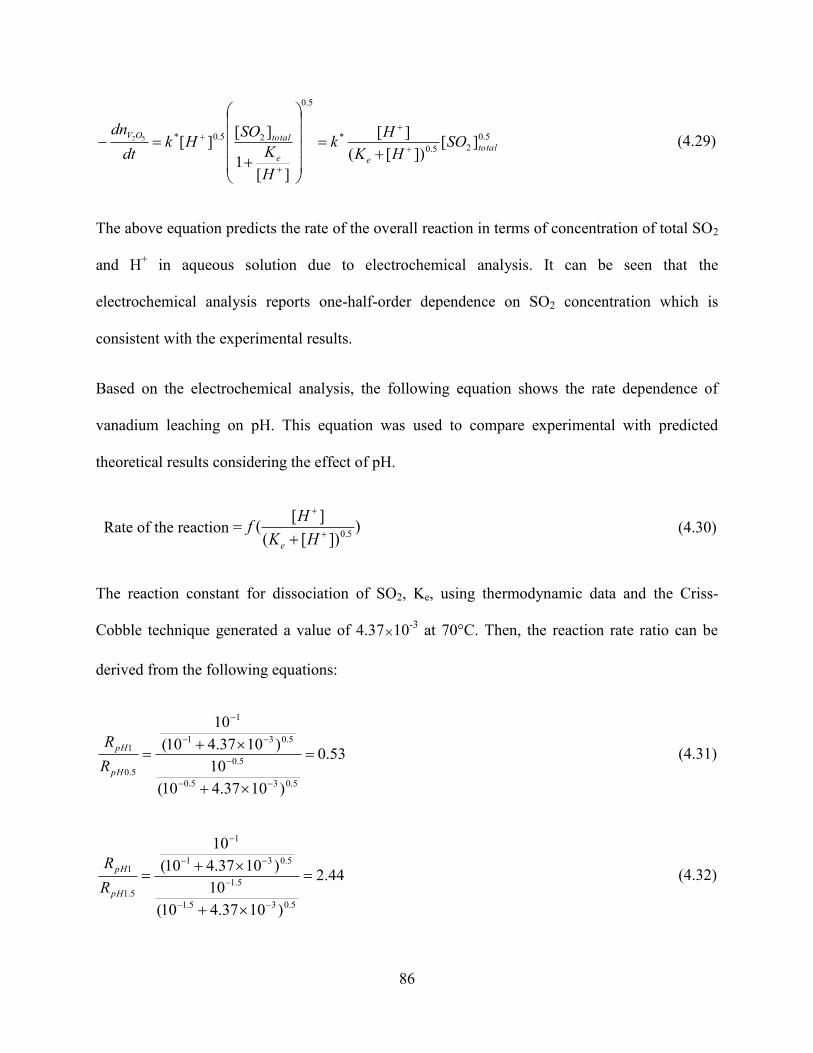
86
5.0
25.0
*
5.0
25.0* ][])[(
][
][1
][][52
total
ee
totalOVSO
HK
Hk
H
K
SOHk
dt
dn
(4.29)
The above equation predicts the rate of the overall reaction in terms of concentration of total SO2
and H+ in aqueous solution due to electrochemical analysis. It can be seen that the
electrochemical analysis reports one-half-order dependence on SO2 concentration which is
consistent with the experimental results.
Based on the electrochemical analysis, the following equation shows the rate dependence of
vanadium leaching on pH. This equation was used to compare experimental with predicted
theoretical results considering the effect of pH.
Rate of the reaction = )])[(
][(
5.0
HK
Hf
e
(4.30)
The reaction constant for dissociation of SO2, Ke, using thermodynamic data and the Criss-
Cobble technique generated a value of 4.37×10⁻³
at 70°C. Then, the reaction rate ratio can be
derived from the following equations:
53.0
)1037.410(
10
)1037.410(
10
5.035.0
5.0
5.031
1
5.0
1
pH
pH
R
R (4.31)
44.2
)1037.410(
10
)1037.410(
10
5.035.1
5.1
5.031
1
5.1
1
pH
pH
R
R (4.32)

87
Considering Figure 4.22, the rate of the reaction in different pH tests was obtained. 5.01 pHpH RR
and 5.11 pHpH RR are found to be 0.51 and 2.57, respectively. The predicted ratios in
electrochemical analysis are consistent with the experimental results.
Figure 4.22. Plot of
versus time for various pH
(at 70°C, 10 g/L V2O5, 10.39 g/L Na2SO3,90 µm, and 600 rpm)

88
5 Vanadium (III) leaching

89
5.1 V2O3 leaching using oxygen
In this section, a model for the kinetics of vanadium leaching with oxygen is developed. The
effects of varying parameters on the leaching rate are also studied. The leaching of vanadium
trioxide using oxygen is thermodynamically favorable and exothermic as summarized in
Table 5.1.
2V2O3 + O2(g) + 8H+
= 4VO+2
+ 4H2O (5.1)
Table 5.1. Thermodynamic data for reaction 5.1 (HSC)
Temperature
(°C)
ΔH°
(kJ/mol)
ΔS°
(kJ/mol.k)
ΔG°
(kJ/mol) Log K
30 -653.20 -640.18 -459.13 79.12
50 -642.52 -606.03 -446.68 72.21
70 -633.22 -578.08 -434.85 66.20
90 -625.18 -555.31 -423.52 60.92
Figure 5.1 illustrates the effect of temperature on vanadium extraction. Note that by increasing
temperature from 50°C to 70°C, the rate of the reaction increases dramatically.

90
Figure 5.1. The effect of temperature on vanadium leaching
(at 1 g/L V2O3, 480 mL O2/min, 90 µm, pH 0, and 600 rpm)
Temperature has an effect on the solubility of oxygen, the diffusion of oxygen in the solution,
and the chemical reaction rate. The solubility of oxygen in a solution at different temperatures
can be expressed by equations 5.2 (Tromans, 1998; Tromans, 2001):
)()(1
1)(C
2aq TfPCk
Oy
I
I
(5.2)
Where
T
TTT
TT
Tf314.8
10591.20)298)(092.0378.299()298
ln(35.203046.0
exp)(
32

91
Where (Caq)I is the molal solubility of oxygen and the coefficient k and the exponents y and η are
solute-specific parameters (2.02, 1.25, and 0.17, respectively for sulfuric acid solution). As
shown in equation 5.2, the solubility of oxygen is a temperature function which has a minimum
of around 95°C. This means that oxygen solubility decreases by increasing temperature in the
range of 30°C T 90°C. Moreover, it can be seen from equation 5.2 that increasing acid
concentration as well as decreasing the partial pressure of oxygen has a negative effect on the
concentration of dissolved oxygen in the solution. However, by increasing temperature from
30°C to 90°C, water steam pressure increases significantly from around 0.041 to 0.69 atm
(Hammett and Chapman, 1934; Romanov, 2009; Wexler, 1976). Thus, since total pressure above
the solution is 1 atm at sea level in Vancouver, increasing temperature will lead to decreased
partial pressure of oxygen, which means decreasing solubility of oxygen in the solution.
Therefore, for a solution of 0.85m H2SO4, the dissolved oxygen concentration was calculated at
about 9.75×10⁻⁵
, 7.08×10⁻⁵
, 4.09×10⁻⁵
, and 2.1×10⁻⁵
m for temperatures of 30, 50, 70, and 90°C,
respectively.
Likewise, it should be considered that by increasing temperature, the diffusion coefficient of
oxygen in the solution increases about three times from 30°C to 90°C (Tromans, 2001).
However, since the solubility of dissolved oxygen decreases by a factor of nearly five when
increasing temperature from 30°C to 90°C, it can be assumed that the mass transfer rate for
oxygen is not increasing fast enough to produce the rapid increase in vanadium leaching kinetics,
shown in Figure 5.1. On the other hand, temperature also plays a significant role in the kinetics
of the oxidative reaction on the surface. It is obvious that increasing temperature has led to
increased kinetics of vanadium oxidative leaching.

92
Since pure vanadium trioxide has been used in this study, particles have decreased in size
through the leaching process. There is no ash layer formed during leaching and all of the
particles are fully depleted at the end of the process. Similar to acid leaching of vanadium
pentoxide, the shrinking sphere model for small particles has then been chosen as a possible
model for describing the kinetics of oxidative vanadium trioxide leaching.
As shown in Figure 5.2, comparing diffusion and reaction control models, there is an appropriate
conformity of the derived reaction control model and experimental results. Therefore, the
chemical control model based on shrinking spheres can be applied for the leaching kinetics.
Using equation 4.8, the rate constant for the surface oxidation reaction was obtained by factoring
out the changing dissolved oxygen concentration with temperature (from equation 5.2). The
activation energy of the reaction using an Arrhenius relationship has been then calculated to be
69 kJ/mol for the reaction as shown in Figure 5.3. This high value of activation energy supports
the postulate that the kinetic of the leaching is reaction controlled (Levenspiel, 1999).

93
Figure 5.2. (a) Plot of
versus time for various temperature test; (b) Plot of
versus time for various temperature test (at 1 g/L V2O3, 480 mL/min, 90 µm,
pH 0, and 600 rpm)

94
Figure 5.3. Arrhenius plot for activation energy calculation for oxidative leaching using oxygen
5.1.1 Effect of particle size
The fraction reacted versus time plot is shown in Figure 5.4 for different initial particles sizes. As
shown, the kinetics of the leaching reaction increased with decreasing particle size. Considering
equation 4.8, the rate constant of the reaction versus 1/d was investigated. Figure 5.4 shows the
linear relation between the reaction rate and 1/d, which this confirms the reaction control
mechanism for oxidative leaching.

95
Figure 5.4. The effect of particle size on the rate of vanadium oxidative leaching
(at 70°C, 1 g/L V2O3, 480 mL/min oxygen, pH 0, and 600 rpm)
5.1.2 Effect of stirring speed
In order to rule out mass transfer as a possible rate control mechanism, the effect of stirring
speed variation on vanadium oxidative leaching was investigated at 500, 600 and 700 rpm.
Figure 5.6 represents that stirring speed has no significant effect on the kinetics of leaching. This
data further confirms that the kinetics of leaching is controlled by the chemical reaction rate, not
mass transfer.

96
Figure 5.5. (a) Plot of
versus time for various particle sizes (b) The effect of
particle size on the rate of dissolution of vanadium (at 70°C, 1 g/L V2O3, 480 mL/min oxygen,
pH 0, and 600 rpm)

97
Figure 5.6. The effect of stirring speed on vanadium oxidative leaching
(at 70°C, 1 g/L V2O3, 480 mL/min oxygen, 90 µm, and pH 0)
5.1.3 Effect of sulfuric acid concentration
Vanadium trioxide has been leached at different pHs. Temperature, stirring speed, and average
particle size were constant at 70ºC, 600 rpm, and 90 µm, respectively. The results are given in
Figure 5.7, which illustrates that sulfuric acid concentration does not have a significant influence
on vanadium leaching. Figure 5.8 shows the order of the reaction which is 0.14 for the sulfuric
acid concentration. To investigate the effect of pH in more detail, direct leaching of vanadium
trioxide in the presence of nitrogen in the same conditions was also studied. As shown in
Figure 5.7, the kinetics of direct vanadium trioxide in non-oxidative conditions is slow and
decreasing the pH promoted the leaching rate slightly. Therefore, it is possible, based on these

98
results, that the non-oxidative leaching of V (III) followed by homogeneous oxidation of V (III)
with oxygen may make a small contribution to the overall reaction rate.
Figure 5.7. The effect of sulfuric acid concentration on vanadium oxidative and non oxidative
leaching (at 70°C, 1 g/L V2O3, 480 mL/min oxygen, 90 µm, and 600 rpm)

99
Figure 5.8. (a) Plot of
versus time for various particle sizes; (b) The effect of
particle size on the rate of dissolution of vanadium (at 70°C, 1 g/L V2O3, 480 mL/min oxygen,
pH 0, and 600 rpm)

100
5.2 V2O3 leaching using oxygen and ferric
It was found that leaching of vanadium trioxide using oxygen is slow; therefore, a mixture of
oxygen and ferric has been studied for vanadium leaching. Table 5.2 shows the thermodynamic
data for vanadium trioxide leaching using ferric. It can be seen that the oxidative vanadium (III)
leaching using ferric is thermodynamically favorable.
V2O3 + 2Fe+3
+ 2H+ = 2VO
+2 + H2O + 2Fe
+2 (5.3)
Table 5.2. Thermodynamic data for reaction 5.3 (HSC)
Temperature
(°C)
ΔH°
(kJ/mol)
ΔS°
(kJ/mol.k)
ΔG°
(kJ/mol) Log K
30 -125.99 56.06 -142.99 24.64
50 -120.16 74.70 -144.30 23.33
70 -114.94 90.37 -145.95 22.22
90 -110.15 103.96 -147.90 21.28
In addition, oxygen can oxidize ferrous in the solution:
4Fe+2
+ O2(g)+ 4H+
= 4Fe+3
+ 2H2O (5.4)
This means that at least five different oxidation reactions can occur in the system concurrently,
that of oxidation of V2O3, Fe (II), and V (III) by oxygen, and the oxidation of V2O3 and V (III)
by Fe (III). All these oxidation reactions are thermodynamically `favorable (HSC). However, the
relative kinetics of these reactions will control the overall rate process.

101
5.2.1 Effect of initial ferric concentration
The effect of the initial concentration of ferric has been studied. It can be seen in Figure 5.9 that
by increasing the initial ferric concentration, the kinetics of leaching is also increased. Compared
to the results for the oxidation of vanadium (III) using oxygen, oxidation of vanadium (III) in the
presence of ferric is very rapid. This means that ferric plays a key role in the system for the
oxidation of vanadium (III).
Figure 5.9. The effect of initial ferric concentration on the kinetics of vanadium oxidative
leaching (at 70°C, 1 g/L V2O3, 180 mL/min oxygen, 90 µm, pH 0, and 600 rpm)
5.2.2 Effect of temperature
Figure 5.10 illustrates the effect of temperature on vanadium leaching in the presence of ferric
and oxygen and it can be seen that vanadium leaching is strongly dependent on temperature. It

102
was shown that the leaching would be finished in about 20 minutes at 90°C, while less than 80%
of vanadium has been leached in an hour at 30°C.
Figure 5.10. The effect of temperature on vanadium oxidative leaching (at 1 g/L V2O3, 1.5 g/L
ferric, 180 mL/min oxygen, 90 µm, pH 0, and 600 rpm)
5.2.3 Effect of pH
The effect of pH on vanadium leaching has been investigated through the leaching of 1 g/L of
vanadium trioxide with 1.5 g/L of ferric and 180 mL/min of oxygen at temperature 70°C and 600
rpm at pHs of 0, 0.3, 0.6, and 0.9. Leaching of vanadium using ferric was not studied beyond pH
0.9 because precipitation was observed in the solution in higher pHs. The results showed that pH
does not have any significant effect on vanadium leaching. Morgan and Lahav (2007) claimed
that the oxidation of ferrous by oxygen in aqueous solution is independent of pH in the acidic
range of pH (below pH 4). Therefore, since the leaching has been controlled by the oxidation of
ferrous to ferric and oxidation of ferrous is independent of pH, it could be expected that
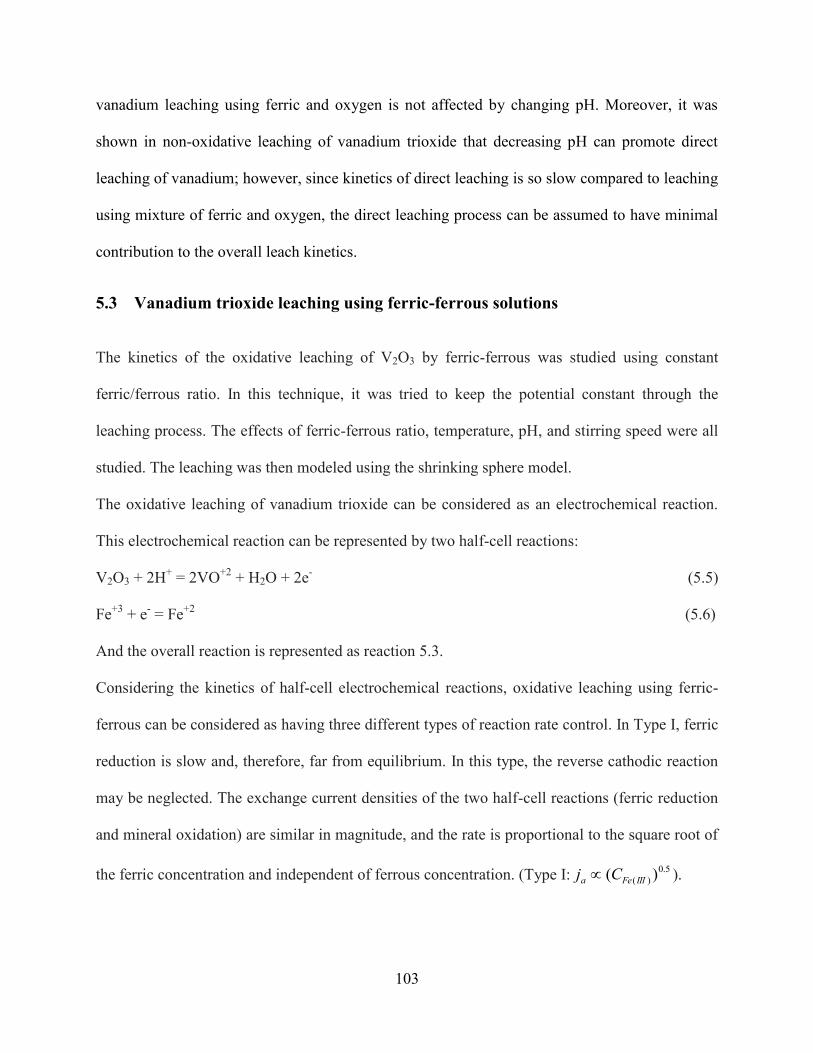
103
vanadium leaching using ferric and oxygen is not affected by changing pH. Moreover, it was
shown in non-oxidative leaching of vanadium trioxide that decreasing pH can promote direct
leaching of vanadium; however, since kinetics of direct leaching is so slow compared to leaching
using mixture of ferric and oxygen, the direct leaching process can be assumed to have minimal
contribution to the overall leach kinetics.
5.3 Vanadium trioxide leaching using ferric-ferrous solutions
The kinetics of the oxidative leaching of V2O3 by ferric-ferrous was studied using constant
ferric/ferrous ratio. In this technique, it was tried to keep the potential constant through the
leaching process. The effects of ferric-ferrous ratio, temperature, pH, and stirring speed were all
studied. The leaching was then modeled using the shrinking sphere model.
The oxidative leaching of vanadium trioxide can be considered as an electrochemical reaction.
This electrochemical reaction can be represented by two half-cell reactions:
V2O3 + 2H+ = 2VO
+2 + H2O + 2e
- (5.5)
Fe+3
+ e- = Fe
+2 (5.6)
And the overall reaction is represented as reaction 5.3.
Considering the kinetics of half-cell electrochemical reactions, oxidative leaching using ferric-
ferrous can be considered as having three different types of reaction rate control. In Type I, ferric
reduction is slow and, therefore, far from equilibrium. In this type, the reverse cathodic reaction
may be neglected. The exchange current densities of the two half-cell reactions (ferric reduction
and mineral oxidation) are similar in magnitude, and the rate is proportional to the square root of
the ferric concentration and independent of ferrous concentration. (Type I:5.0
)( )( IIIFea Cj ).

104
In Type II, ferric reduction is fast and, therefore, essentially at equilibrium. In this case, the
exchange current density of the oxidizing couple is higher than that of the dissolution reaction by
several orders of magnitude and the mixed potential thus corresponds to the reversible potential
of the oxidizing (potential determining) couple. In this type, the leaching rate is proportional to
the square root of the Fe(III)/Fe(II) ratio (Type II: 5.0
)(
)()(
IIFe
IIIFe
aC
Cj ).
In some systems, there is a third type where the leaching reaction is particularly fast and the
leaching rate is limited by mass transfer of the oxidant to the mineral surface. In this situation,
the leaching reaction will proceed at the limiting current density of the oxidant and the leaching
rate is proportional to the oxidant concentration (Type III: )( )(IIIFea Cj .
5.3.1 Effect of temperature
The effect of temperature on vanadium (III) leaching was investigated by the leaching of 1 g/L of
V2O3 in sulfuric acid at pH 0 and temperatures of 30, 50, 70, and 90°C. In all experiments, the
initial ferric concentration was 0.1 molar and the ferric-ferrous ratio was kept constant at 10 by
using potassium permanganate. ORP was reported 496, 532, 563 and 611 mV for 30, 50, 70, and
90°C respectively. Figure 5.11 shows the effect of temperature on vanadium leaching. It can be
seen that by increasing temperature, the rate of leaching increases. It was shown that at the
higher temperature, vanadium was completely leached in about 20 minutes, however, it took
about 3 hours to leach around 90% of vanadium in the lowest temperature.

105
Figure 5.11. The effect of temperature on vanadium oxidative leaching
(at 1 g/L V2O3, [Fe+3
]/[Fe+2
]=10, 90 µm, pH 0, and 600 rpm)
The shrinking sphere model was applied to formulate the kinetics of leaching. Similar to oxygen
leaching (section 5.1), the kinetics model using equations 4.8 and 4.9 was investigated. As can be
seen in Figure 5.12, the shrinking sphere model based on chemical reaction control showed a
suitable agreement with the experimental data. Activation energy of the reaction was then
calculated as 38 kJ/mol using the Arrhenius equation in Figure 5.13.

106
Figure 5.12. (a) Plot of
versus time for various temperature tests; (b) Plot of
versus time for various temperature test (at 70°C, 1 g/L V2O3, [Fe+3
]/[Fe+2
]=10,
90 µm, pH 0, and 600 rpm)
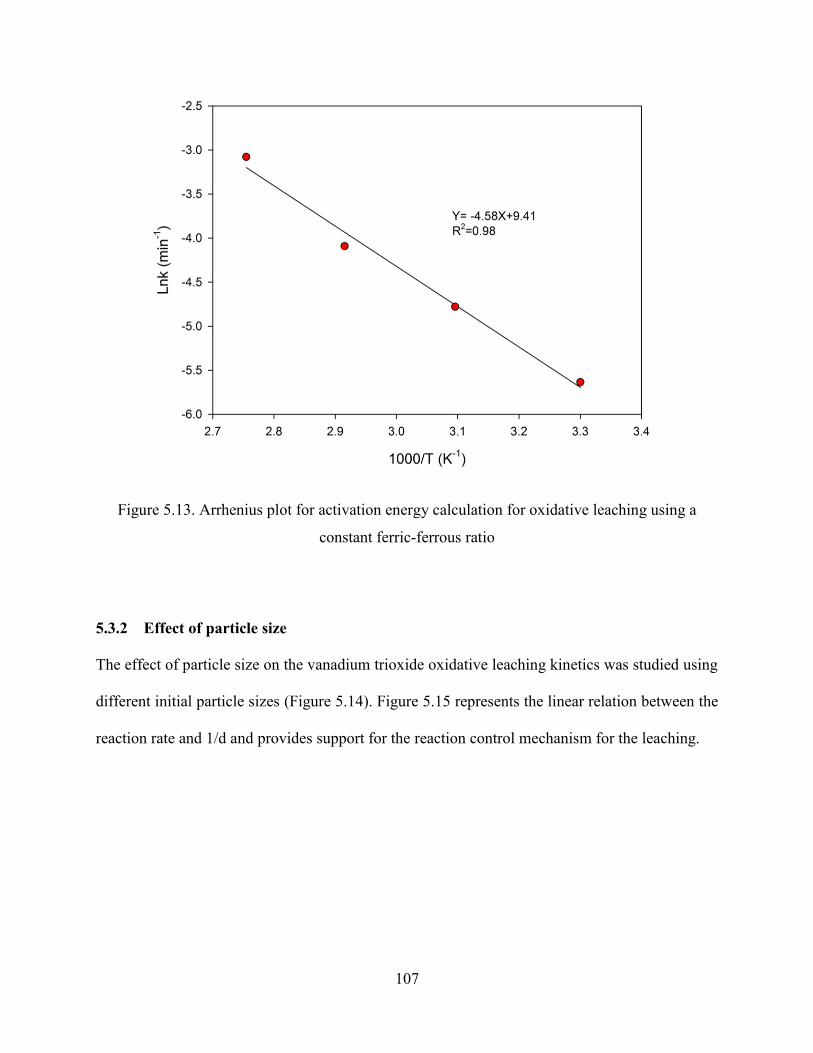
107
Figure 5.13. Arrhenius plot for activation energy calculation for oxidative leaching using a
constant ferric-ferrous ratio
5.3.2 Effect of particle size
The effect of particle size on the vanadium trioxide oxidative leaching kinetics was studied using
different initial particle sizes (Figure 5.14). Figure 5.15 represents the linear relation between the
reaction rate and 1/d and provides support for the reaction control mechanism for the leaching.

108
Figure 5.14. The effect of particle size on the rate of vanadium oxidative leaching
(at 1 g/L V2O3, [Fe+3
]/[Fe+2
]=10, 90 µm, pH 0, and 600 rpm)
5.3.3 Effect of ferric-ferrous ratio
To study the effect of the ferric-ferrous ratio on the kinetics of leaching, 1 g/L of V2O3 in sulfuric
acid at pH 0 and 70°C was leached by ratio of Fe(III)/Fe(II) of 1, 10, 50, 100 and 300. About 0.1
g/L of ferric was added to the leaching tank and the target ferric/ferrous ratio was adjusted by
adding the required ferrous using ferrous sulfate heptahydrate. The potential was recorded at
values of 495, 563, 608, 631 and 669 mV versus Ag/AgCl electrode for ratio of 1, 10, 50, 100
and 300 ferric/ferrous respectively. The potential for each test was then controlled using an ORP
electrode connected to the computer. Figure 5.15 represents the effect of the ferric-ferrous ratio
on vanadium trioxide leaching. It was shown that by increasing the Fe(III)/Fe(II) ratio, the
leaching kinetics increases significantly.

109
Figure 5.15. (a) Plot of
versus time for various particle sizes; (b) The effect of
particle size on the rate of dissolution of vanadium (at at 1 g/L V2O3, [Fe+3
]/[Fe+2
]=10, 90 µm,
pH 0, and 600 rpm)

110
Figure 5.16. The effect of ferric/ferrous ratio on vanadium oxidative leaching
(at 70°C, 1 g/L V2O3, 90 µm, pH 0, and 600 rpm)
The shrinking rate of vanadium trioxide particles versus the ferric-ferrous ratio is depicted in
Figure 5.17. The slope was regression fitted to a value of 0.47. This means that the oxidative
leaching is of Type II, in which the shrinking rate is proportional to the square root of the
Fe(III)/Fe(II) ratio in the solution.
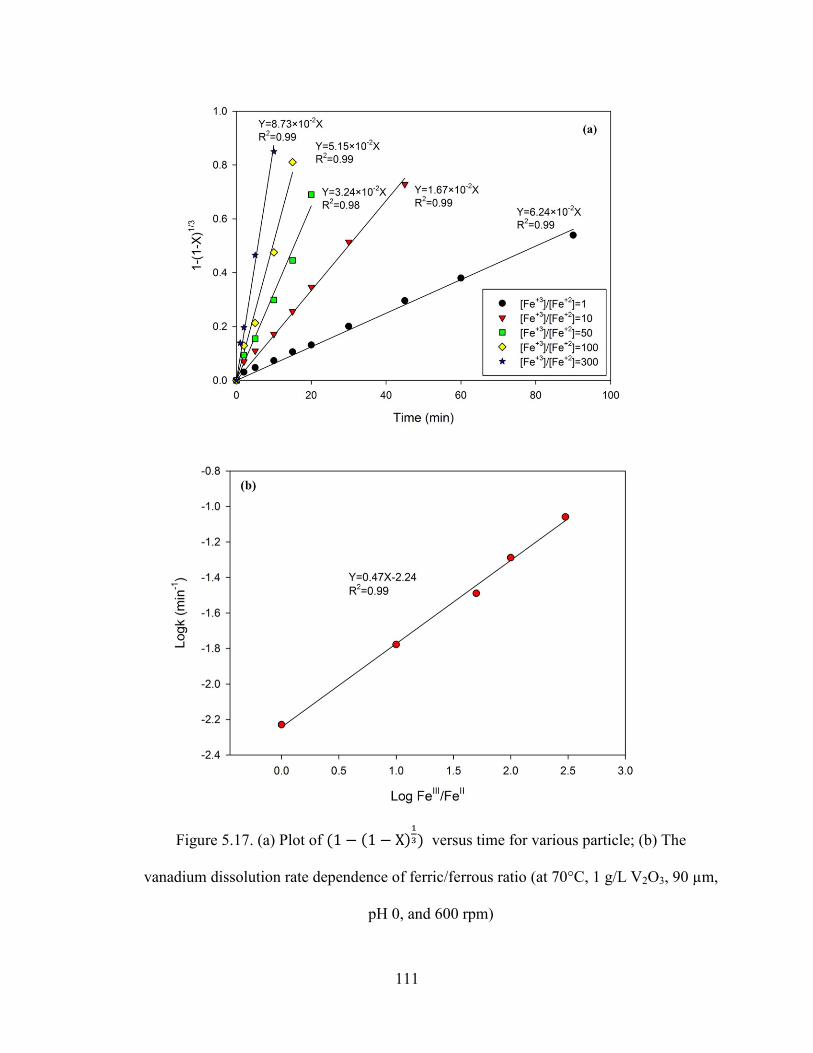
111
Figure 5.17. (a) Plot of
versus time for various particle; (b) The
vanadium dissolution rate dependence of ferric/ferrous ratio (at 70°C, 1 g/L V2O3, 90 µm,
pH 0, and 600 rpm)

112
In addition, as shown in Figure 5.18, the effect of stirring speed on vanadium leaching was
studied using 1 g/L of V2O3 in sulfuric acid at pH 0, 70°C, [Fe+3
]/[Fe+2
]=10 and a stirring speed
of 500 to 700 rpm. Moreover, the effect of pH was investigated in Figure 5.19 by changing the
pH from 0 to 1 at 70°C, [Fe+3
]/[Fe+2
]=10, 600 rpm and the same solid to liquid ratio. The
leaching kinetics was shown to be independent of both stirring speed and the pH of the solution.
This confirms that the oxidative leaching is under the chemical reaction rate control with an
activation energy of about 38 kJ/mol. The oxidation of vanadium trioxide using ferric ions
conforms to a Type II mechanism.
Figure 5.18. The effect of stirring speed on vanadium oxidative leaching (at 70°C, 1 g/L
V2O3, 90 µm, and pH 0)

113
Figure 5.19. Effect of pH on vanadium oxidative leaching (at 70°C, 1 g/L V2O3, 90 µm, and
600 rpm)
Therefore, based on the obtained data, the rate constant for the reaction can be calculated as
below:
47.0
)(
)())(
4571exp(12088
IIFe
IIIFe
C
C
Tt
d
(5.7)
Finally, the following kinetic equation was obtained for oxidative leaching of vanadium trioxide
using the ferric-ferrous couple:
3
47.0
)(
)())(
4571exp(
120881),(1
IIFe
IIIFe
C
C
Td
tdtX
(5.8)

114
6 Solvent extraction

115
6.1 Extraction of vanadium (V) in the presence of iron (III)
6.1.1 Effect of pH value on selectivity
The extraction yield of vanadium (V) and iron (III) from the solution with phosphoric acid
(D2EHPA), phosphonic acid (IONQUEST 801), phosphinic acid (CYANEX 272) and phosphine
oxide extractant (CYANEX 923) (5% extractant (v/v) in SX-ORFOM 12) are shown in
Figure 6.1 to Figure 6.2 respectively. All loading results were obtained after mixing aqueous and
organic solution using a mechanical stirrer for 20 minute.
Figure 6.1. Extraction of V (V) and Fe (III) from sulfate solution as a function of equilibrium pH
with 5% D2EHPA & IONQUEST 801 dissolved in SX-ORFOM12

116
Figure 6.2. Percentage of extraction of V (V) and Fe (III) from sulfate solution as a function of
equilibrium pH with 5% CYANEX 272 & CYANEX 923 dissolved in SX-ORFOM12
It can be seen that acidic phosphorus extractants had poor selectivity for V (V) over Fe (III).
However, as was shown in Figure 6.2, CYANEX 923 may be a suitable extractant candidate for
separation of vanadium from iron because CYANEX 923 cannot extract iron (III) from a sulfate
solution. Since the extraction of Fe (III) by CYANEX 923 was very low based on aqueous
solution analysis as a check, the loaded organic solution was also analyzed for mass balance
confirmation.
6.1.2 Effect of contact time
The kinetics of vanadium extraction with CYANEX 923 was investigated by studying vanadium
extraction versus time (Figure 6.3). The organic phase (40%, v/v) was made using CYANEX
923 and SX-ORFOM 12. The extraction was complete in approximately 10 minutes.

117
Figure 6.3. Effect of mixing time on the extraction yield of vanadium with 40% CYANEX 923
in SX-ORFOM 12 at pH 2
6.1.3 Vanadium (V) extraction mechanism using CYANEX 923
Considering the selectivity of CYANEX 923 compared with acidic phosphorus extractants, the
effect of CYANEX 923 concentration on vanadium (V) extraction using 5%, 10%, 20%, and
40% of CYANEX 923 in SX-ORFOM12 was investigated. By assuming the average molecular
weight of CYANEX 923 is 348 g/mol and the density is 880 kg/m3, the graph of log D versus log
(TRPO1) is depicted in Figure 6.4. The results show a linear slope and indicate the ratio of the
extractant to the metal species at this pH value. At pH 0-2, one molecule of vanadium is
extracted by approximately one molecule of CYANEX 923.
1 [trialkylphosphine oxide (TRPO)] is used to represent the CYANEX 923 concentration. This is a simplification but
is appropriate to test the mechanism of extraction.

118
Figure 6.4. Effect of CYANEX 923 concentration on vanadium extraction
In non-complexing acidic media (less than pH 2), the major species in aqueous solution of
vanadium (V) is VO2+ (Olazabal et al., 1992; Pourbaix, 1949). Moreover, vanadium
(concentration510 molar) can form a complex (VO2SO4
-) in sulfate media in the low pH range
(Ivakin, 1966; Puigdomenech, 2004; Rakib and Durand, 1996). It was shown that vanadium can
form VO2SO4-
and VO2HSO4 thermodynamically (Ivakin, 1966; Puigdomenech, 2004; Rakib
and Durand, 1996). The equilibrium constant (Log β1) for VO2SO4
- has been reported to be 0.97
(Ivakin, 1966) , 1.3 (Rakib and Durand, 1996), and 1.72 (Puigdomenech, 2004) in different
reports and the equilibrium constant (Log β1) of -0.136 was obtained for reaction VO2HSO4
(Ivakin, 1966). This means that the formation of VO2SO4- is much stronger than VO2HSO4 in the
solution. In addition, Rakib and Durand (Rakib and Durand, 1996) claimed that the assumed

119
species VO2HSO4 is totally dissociated behaving as a strong acid. Therefore, in a solution
containing sulfate/bisulfate anions, a mono sulfate complex VO2SO4- is a dominant complex in
the approximate range of 1 pH 3. Moreover, the peak position of this complex in Raman
spectroscopy was specified in the solubility test (Figure 4.8). Therefore, considering the results
in Figure 6.4 and the vanadium species, the extraction equilibrium of vanadium (V) with
CYANEX 923 (TRPO: [trialkylphosphine oxide]) which is used as a candidate for CYANEX
923) is given by the following expressions, which may occur separately or simultaneously:
2422
2
42 22 TRPOSOVOTRPOSOVO (6.1)
Or
TRPOHSOVOTRPOHSOVO 4242 (6.2)
Or
TRPOHSOVOTRPOHSOVO 4242 (6.3)
Or
2
4242242 )(22 SOTRPOSOVOTRPOSOVO (6.4)
The extraction equilibrium constant Kext is expressed respectively as follows:
22
4
2
2
2422
]][[][
])()([
TRPOSOVO
TRPOSOVOK ext
(6.5)
Or

120
]][][[
][
42
42
TRPOHSOVO
TRPOHSOVOK ext
(6.6)
Or
]][][[
][
42
42
TRPOHSOVO
TRPOHSOVOK ext
(6.7)
Or
22
42
442
][][
]][[2
TRPOSOVO
SOTRPOSOVOKext
(6.8)
To investigate the extraction mechanism, the effect of adding sodium sulfate on the extraction of
vanadium with 5% CYANEX 923 was studied. Different solutions contained 1 g/L vanadium
and 0.5, 1, and 2 molar sulfate concentrations at pH 1.5 were prepared. Vanadium extractions of
19.12, 8.35, and 1.78% were obtained respectively for 0.5, 1, and 2 molar sulfate in the solution.
It is obvious that the extraction of vanadium decreases significantly by adding sodium sulfate in
the solution.
It was shown that the extraction efficiency of vanadium using CYANEX 923 increases by
increasing the pH while at the same time the amount of bisulfate in the solution decreases. It can
then be concluded that reaction 6.2 cannot be correct for the system. Furthermore, it was
revealed that by increasing the sulfate concentration, vanadium extraction decreases. Therefore,
reaction 6.3 can also be excluded based on this observation. Hence, considering the suggested
mechanisms, only reactions 6.1 and 6.4 can be considered. However, since the dominant species
at pH 1.5 or 2 is a vanadium mono sulfate complex, as it was explained above, it can be said that
reaction 6.4 is the most likely reaction in the system. Moreover, it can be seen from the reaction

121
6.4 that since sulfate is in the right side of the reaction, adding the sulfate in the system can shift
the reaction to the left, which means the vanadium extraction should be decreased, consistent
with the experimental results.
In order to confirm the extracted species, the ratio of vanadium to sulfur in the organic solution
was analyzed after extraction. However, since CYANEX 923 tends to extract sulfuric acid in the
solution as well (Wiśniewski et al., 1996), a blank test with only sulfuric acid extraction at pH
1.5 by CYANEX 923 was first performed. Vanadium solution was then extracted in a second test
by CYANEX 923 at pH 1.5. Both organic solutions were then stripped with 2M sodium
hydroxide. Vanadium and sulfur concentration in the strip solution was analyzed by ICP and the
ratio of vanadium to sulfur after correction for the blank was calculated at 2.38. Although this
value is a little above the ideal value of 2, this analysis can be taken as evidence to confirm that
vanadium is extracted by reaction 6.4.
6.1.4 Stripping vanadium from CYANEX 923
The degree to which vanadium can be stripped from CYANEX 923 was studied using distilled
water and sodium hydroxide solution. After the loading of vanadium by CYANEX 923 at pH 2,
organic and aqueous solutions (A/O ratio of 1/1) have been shaken with a mechanical shaker for
20 minutes. This was found to be sufficient for equilibrium to be achieved. The aqueous phase
was filtered for ICP analysis and the organic phase was filtered using the 1PS phase separation
filter paper and advanced to the next batch stripping stage. The organic phase was stripped 5
times using fresh deionized water, 0.1 and 1N NaOH solution to make sure that all of the
vanadium has been removed from the organic (Table 6.1). The results confirm that a range of
dilute to concentrated solution of sodium hydroxide can be used effectively for the stripping of
vanadium from CYANEX 923. Iron will form Fe(OH)3 as a solid precipitate under high pH

122
conditions. In addition, VO2+
has low solubility in the mildly acidic pH region. However, mildly
basic or highly basic strip solutions can change the cation to an anion such as decavandate
(V10O28-6
OH-), metavanadate (V3O9
-3), and (VO3OH2
-) at pH 5, 8, and more than 11,
respectively. These anions have high solubility. As the following reactions illustrate, changing
the pentavanadyl cation (VO2+) to anion species in the solution will release protons in the
solution and hence decrease pH (Pourbaix, 1949; Puigdomenech, 2004):
10 VO2++ 8H2O V10O27OH
-+ 15H
+ (6.9)
3 VO2++ 3H2O V3O9
-3+ 6H
+ (6.10)
VO2++ 2H2O VO3OH2
-+ 2H
+ (6.11)
CYANEX 923 can extract sulfuric acid as well and sulfuric acid can also be stripped with
sodium hydroxide solution (Wiśniewski et al., 1996). Therefore, the pH of the solution after
water stripping decreases because of the changing vanadium species and sulfuric acid stripping.
As shown in Table 6.1, water can also be applied to remove vanadium (V) from CYANEX 923
with less efficiency than sodium hydroxide solution. For water stripping, the pH was 2.85, 3.27,
3.68, 3.93, and 4.07, respectively for each stage of stripping at room temperature. It should be
mentioned that for each stage of stripping, fresh water or sodium hydroxide solution was used.

123
Table 6.1. Strip of vanadium (V) from the loaded solventa
Strip solution/Stripping Stage 1 2 3 4 5 Total (%)
Water 59.62 25.08 7.86 4.66 3.14 100.36
NaOH (0.1N) 79.65 10.11 6.52 2.35 2.11 100.74
NaOH (1N) 82.35 12.43 4.23 1.25 0.23 100.49
a The organic solvent was 40% CYANEX 923 in SX-ORFOM 12 at pH 2
6.1.5 Role of sulfate on vanadium (V) solvent extraction
As shown, sulfate has a significant effect on the extraction of vanadium (V) using CYANEX
923. It was shown that increasing sulfate increases the concentration of vanadium mono sulfate
complex in the system which leads to increases in the vanadium species that tend to extract by
CYANEX 923. However, since extraction of vanadium (V) using CYANEX 923 releases sulfate
on the right side of the reaction, the extraction of vanadium (V) by the organic solvent is reduced
by the increasing sulfate concentration due to Le Chatelier’s principle. This means that sulfate
concentration, on one hand, can increase loading because of promoting vanadium mono sulfate
complex in the system; however, on the other hand, it can suppress the loading reaction due to
the presence of sulfate on the right side of the reaction.
In addition, the effect of adding sulfate on vanadium (V) extraction using D2EHPA was studied
as well. Different solutions contained 1 g/L vanadium and 0.5, 1, and 2 molar sulfate
concentrations at pH 1.5 were prepared. Vanadium extraction was reported 79.45, 65.56 and
27.18%, respectively for 0.5, 1, and 2 molar sulfate in the solution. In fact, D2EHPA tends to
extract VO2+ from the solution; however, adding sulfate decreases the free cation concentration
in the solution and increases the VO2SO4- complex that leads to a decrease of the vanadium (V)
extraction in the solution.
124
6.2 Extraction of vanadium (IV) in the presence of iron (III)
6.2.1 Effect of pH on selectivity
The effect of pH on selectivity of V (IV) over Fe (III) is illustrated in Figure 6.5 and Figure 6.6.
As can be seen, none of the chosen extractants are selective for the extraction of V (IV) in the
presence of Fe (III). CYANEX 923 is not able to extract V (IV) from a weakly-acidic sulfate
solution.
6.3 Extraction of vanadium (IV) in the presence of iron (II)
6.3.1 Effect of pH on selectivity
Figure 6.7. Percentage of extraction of V (IV) and Fe (II) from sulfate solution as a function of
equilibrium pH with 5% D2EHPA & IONQUEST 801 dissolved in SX-ORFOM12
and Figure 6.8 illustrate selectivity of V (IV) over Fe (II) using different extractants. It can be
seen that CYANEX 272 and D2EHPA can extract vanadium (IV) over ferrous reliably.
Moreover, it was shown that the distribution ratio (D) for D2EHPA is around 10.59 at pH 1.5
and 89.4% of vanadium was extracted by the solvent, while D was reported around 5.7 at pH 2
for CYANEX 272 where 78.9% of vanadium was extracted.

125
Figure 6.5. Percentage of extraction of V (IV) and Fe (III) from sulfate solution as a function of
equilibrium pH with 5% D2EHPA & IONQUEST 801 dissolved in SX-ORFOM12
Figure 6.6. Percentage of extraction of V (IV) and Fe (III) from sulfate solution as a function of
equilibrium pH with 5% CYANEX 272 & CYANEX 923 dissolved in SX-ORFOM12
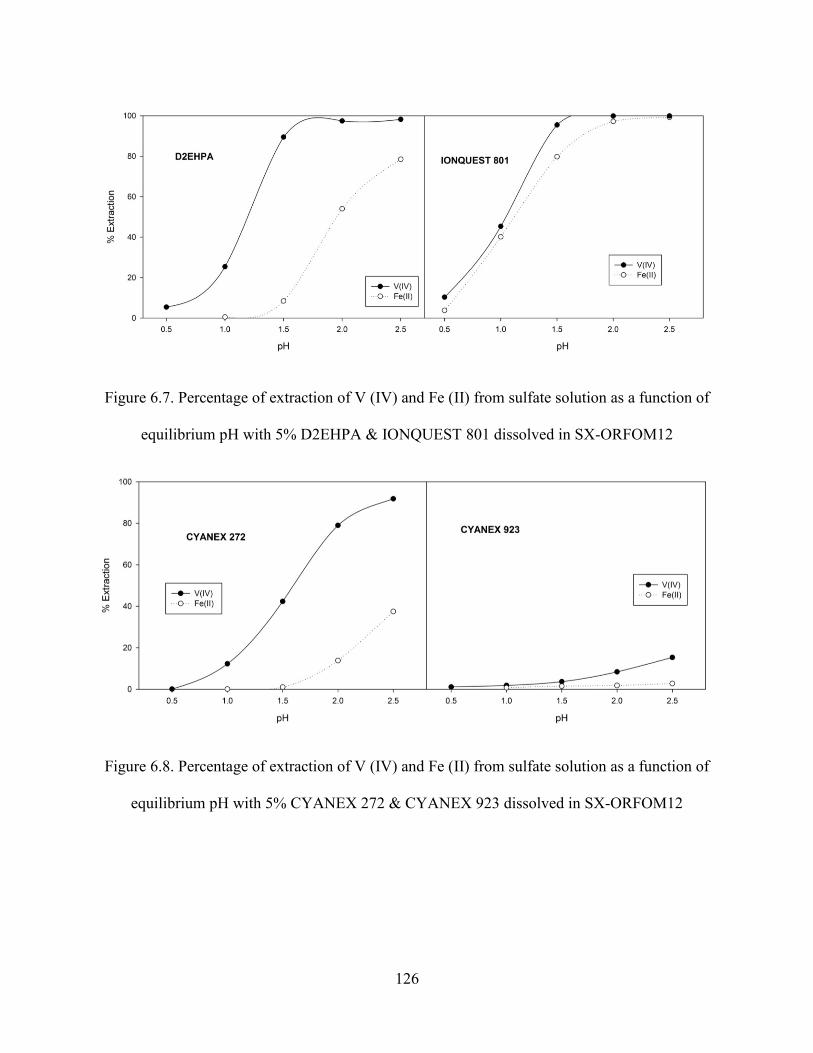
126
Figure 6.7. Percentage of extraction of V (IV) and Fe (II) from sulfate solution as a function of
equilibrium pH with 5% D2EHPA & IONQUEST 801 dissolved in SX-ORFOM12
Figure 6.8. Percentage of extraction of V (IV) and Fe (II) from sulfate solution as a function of
equilibrium pH with 5% CYANEX 272 & CYANEX 923 dissolved in SX-ORFOM12
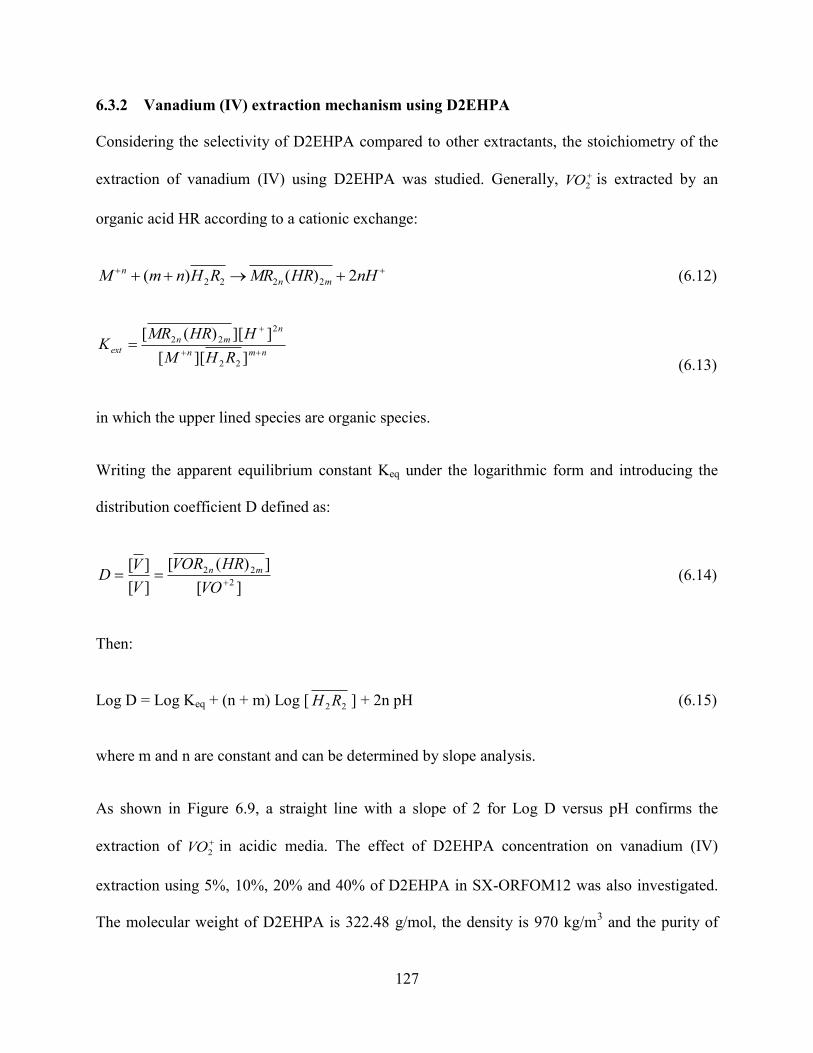
127
6.3.2 Vanadium (IV) extraction mechanism using D2EHPA
Considering the selectivity of D2EHPA compared to other extractants, the stoichiometry of the
extraction of vanadium (IV) using D2EHPA was studied. Generally,
2VO is extracted by an
organic acid HR according to a cationic exchange:
nHHRMRRHnmM mn
n 2)()( 2222 (6.12)
nmn
n
mn
extRHM
HHRMRK
]][[
]][)([
22
2
22
(6.13)
in which the upper lined species are organic species.
Writing the apparent equilibrium constant Keq under the logarithmic form and introducing the
distribution coefficient D defined as:
][
])([
][
][2
22
VO
HRVOR
V
VD mn (6.14)
Then:
Log D = Log Keq + (n + m) Log [ 22 RH ] + 2n pH (6.15)
where m and n are constant and can be determined by slope analysis.
As shown in Figure 6.9, a straight line with a slope of 2 for Log D versus pH confirms the
extraction of
2VO in acidic media. The effect of D2EHPA concentration on vanadium (IV)
extraction using 5%, 10%, 20% and 40% of D2EHPA in SX-ORFOM12 was also investigated.
The molecular weight of D2EHPA is 322.48 g/mol, the density is 970 kg/m3 and the purity of

128
D2EHPA has been reported to be more than 96%. The graph of log D versus Log [D2EHPA] is
demonstrated in Figure 6.10. The slope is 2 in equation 4.54 indicating m+n is 2 (Biswas and
Mondal, 2003; Grosber-Manon, 2011).
Therefore, the equation 6.15 can be written as below:
HHRVORRHVO 2)(2 2222
2 (6.16)
and the extraction equilibrium constant Kext is expressed as:
2
22
22
2
22
][][
]][)([
RHVO
HHRVORKext
(6.17)
Figure 6.9. Effect of pH on distribution coefficient (D2EHPA and vanadium (IV))

129
Figure 6.10. Effect of D2EHPA concentration on vanadium (IV) extraction
Moreover, the stripping of vanadium (IV) from D2EHPA using sulfuric acid was investigated.
The procedure was the same as that used for the stripping from CYANEX 923. A fresh sulfuric
acid strip solution was used for each contact stage. As Table 6.2 shows, sulfuric acid can strip
vanadium (IV) effectively from D2EHPA.
Table 6.2. Strip of Vanadium (IV) from the loaded solventa
Strip Solution/ Stripping Stage
1
2 3 Total
(%)
H2SO4 (0.5M) 72.35 24.99 1.86 99.2
H2SO4 (1M) 92.12 6.53 1.53 100.18
H2SO4 (2M) 95.63 3.34 0.84 99.81
a The organic solvent was 40% D2EHPA in SX-ORFOM 12 at pH 1.5

130
7 Conclusions
and
recommendations for future work

131
7.1 Conclusions
As explained carefully, this research has been done to develop an understanding of vanadium
behavior in leaching and solvent extractions. To cover that interest, this study has been
completed in three different but relevant sections which are vanadium (V) and (III) leaching and
vanadium (V) and (IV) solvent extraction:
1. Vanadium (V) leaching: This study has been done in three steps. First, it was found that
V2O5 can be leached quickly in sulfuric acid. However, the pentavanadyl cation (VO2+) suffers
from low solubility in solution. On the other hand, it was reported that the solubility can be
raised by increasing the sulfate concentration in the solution.
Secondly, it was shown that V2O5 can be leached in water and mild sodium hydroxide solutions
at a constant pH. At 90°C and pH 5, approximately all of V2O5 can be leached in less than 2
hours as a decavanadate. Whereas for pH 8 and maintained at the same temperature, 90°C,
vanadium can be leached completely as a metavanadate after about an hour. It was found that
temperature can significantly affect both the water and mild basic leaching.
Thirdly, it was observed that using reductive agents in an acidic pH range can increase leaching
efficiency significantly. The kinetics of reductive leaching of vanadium pentoxide using sodium
sulfite was then studied using a shrinking sphere model. It was shown that the reductive leaching
is in a chemically-controlled regime with an activation energy of 33 kJ/mol. Finally, the
following rate equation has been offered to predict the rate of vanadium reductive leaching:

132
57.0
25.0
*
5.0
25.0* ][])[(
][
][1
][][52
total
ee
totalOVSO
HK
Hk
H
K
SOHk
dt
dn
2. Vanadium (III) leaching: In this section, the kinetics of atmospheric oxidative leaching of
vanadium trioxide were investigated in three steps. It was reported that leaching of V2O3 using
oxygen is very slow and more than 90% of the vanadium was dissolved at pH 0, 90°C, and 10
hours by pumping 480 mL/min through the leaching process. It was claimed that the kinetics of
vanadium (III) oxidative leaching using oxygen is chemically-controlled by the activation
reaction of 69 kJ/mol. The effect of adding ferric on the leaching in the presence of oxygen was
then studied. It was revealed that ferric can increase the rate of the leaching significantly so
much so that vanadium is almost leached in 20 minutes at pH 0, 90°C, and 1.5 g/L ferric.
Finally, the kinetics of vanadium (III) leaching using constant ferric/ferrous ratio was
investigated. It was observed that both temperature and ferric-ferrous ratio has a considerable
effect on vanadium leaching. The kinetics study using mixed model revealed that the leaching
rate is controlled by the reaction on the surface. An activation energy of 38 kJ/mol was reported
for the reaction. The exponent of the Fe(III)/Fe(II) ratio was reported as 0.47 which is slightly
less than the 0.5 that confirms Type II for the leaching.
3. Vanadium solvent extraction: In this part, it was shown that the phosphorus based
extractants can be used to separate vanadium over iron selectively. The best separation of
vanadium and iron using selected extractants were achieved when vanadium and iron species
were either both reduced (vanadium (IV) and iron (II)) or both oxidized (vanadium (V) and iron
(III)).

133
For vanadium (V), it was shown that acid extractants had poor selectivity for vanadium (V) over
iron (III), however, CYANEX 923 as a solvating extractant showed an acceptable selectivity for
vanadium (V) over iron (III). The molar ratio of CYANEX 923 and vanadium (V) in the
extracted species was found to be approximately 1, which indicates the participation of one
molecule of CYANEX 923 per molecule of vanadium (V) in the extracted species. In addition, it
was shown that the stripping of vanadium (V) from CYANEX 923 can be accomplished by
water, dilute or concentrate sodium hydroxide. Using sodium hydroxide as a stripping solution
not only can increase selectivity of vanadium over iron but can also increase vanadium solubility
in strip liquor.
For vanadium (IV), it was found that among selected organophosphorus reagents, D2EHPA
showed a better selectivity for vanadium (IV) over iron (II). Stripping with sulfuric acid was
effective. It was also found that two moles of D2EHPA were required per mole of the extracted
vanadium (IV) species.
134
7.2 Recommendations for future work
This work formed a fundamental understanding for hydrometallurgy of vanadium. However,
more studies have to be considered as a future research to complete this understanding and make
it adopted into now progressing recovery of vanadium from various resources. To this end, the
following investigations are recommended:
Leaching:
The experiment can be extended to study vanadium leaching from different resources
contained in non-oxide vanadium materials. However, most of the resources can be fairly
divided to vanadium (V) and vanadium (III) materials. Therefore, similar techniques
from this study can be applied to investigate for a leaching study.
This work may be extended to study the kinetics of atmospheric leaching of vanadium
trioxide in basic pHs
Oxidative leaching of vanadium (III) to form vanadium (V) species in the solution in
different pHs can be considered as a potential future work
This report may be completed by a kinetics study of vanadium (IV) oxidation to
vanadium (V) using oxygen in an aqueous phase. This study not only can be used as a
supportive research for direct leaching of vanadium (III) to get vanadium (V) species in
the solution, but also may be applicable for a vanadium purification step when only
vanadium (V) species are needed in the solution. Oxidation using other oxidizers such as
H2O2 can also be investigated for the purification step

135
Solvent Extraction:
Using a mixture of different extractants as a synergic study can be considered for solvent
extraction of vanadium by aiming to obtain higher selectivity of vanadium over some
elements such as iron in acidic pHs
Ion exchange technique can also be investigated as a potential future work for vanadium
(IV) and vanadium (V). The extraction of different vanadium species using this technique
is poorly studied. Therefore, this research may show other possible options for vanadium
purification
This research has been focused on leaching and solvent extraction of vanadium and suggestions
are then proposed around these two steps of the process. However, other parts of the process
such as vanadium pentoxide precipitation or vanadium electrolyte production can be potentially
considered as a future work. Deep understanding about each part of the vanadium process can
help us to bring a more practical and feasible procedure to get the aimed vanadium product for
any resource.

136
References
Aarabi, M., Rashchi, F., Mostoufi, N. and Vahidi, E., 2010. Leaching of vanadium from LD
converter slag using sulfuric acid. Hydrometallurgy, 102(1-4): 14-21.
Abdel-latif, M.A., 2002. Recovery of vanadium and nickel from petroleum flyash. Minerals
Engineering, 15 (11, Supplement 1): 953-961.
Akita, S., Maeda, T. and Takeuchi, H., 1995. Recovery of vanadium and nickel in fly ash from
heavy oil. John Wiley & Sons, 345-350.
Akita, S., Maeda, T. and Takeuchi, H., 1995. Recovery of vanadium and nickel in fly ash from
heavy oil. Journal of Chemical Technology & Biotechnology, 62(4): 345-350.
Al-Ghouti, M.A., Al-Degs, Y.S., Ghrair, A., Khoury, H. and Ziedan, M., 2011. Extraction and
separation of vanadium and nickel from fly ash produced in heavy fuel power plants.
Chemical Engineering Journal, 173(1): 191-197.
Alexander, J., 1929. Vanadium and some of its industrial applications. Harrison and sons.
Amer, A.M., 1994. Hydrometallurgical processing of Egyptian black shale of the Quseir-Safaga
region. Hydrometallurgy, 36(1): 95-107.
Amer, A.M., 2002. Processing of Egyptian boiler-ash for extraction of vanadium and nickel.
Waste Management, 22(5): 515-520.
Bal, Y., Bal, K.E., Cote, G. and Lallam, A., 2004. Characterization of the solid third phases that
precipitate from the organic solutions of Aliquat 336 after extraction of molybdenum(VI)
and vanadium(V). Hydrometallurgy, 75(1-4): 123-134.
Bard, A.J. and Faulkner, L.R., 2000. Electrochemical Methods: Fundamentals and Applications.
Wiley, USA.

137
Barner, H.E. and Scheueman, R.V., 1978. Handbook of thermochemical data for compounds and
aqueous species. John Wiley & Sons, USA.
Bibler, J.P., 1990. Ion exchange in the nuclear industry. Springer science.
Biswas, R.K. and Mondal, M.G.K., 2003. Kinetics of VO2+
extraction by D2EHPA.
Hydrometallurgy, 69(1-3): 117-133.
Biswas, R.K., Wakihara, M. and Taniguchi, M., 1985. Recovery of vanadium and molybdenum
from heavy oil desulphurization waste catalyst. Hydrometallurgy, 14(2): 219-230.
Blizanac, B.B., Ross, P.N. and Markovic, N.M., 2007. Oxygen electroreduction on Ag: The pH
effect. Electrochimica Acta, 52(6): 2264-2271.
Bouffard, S.C., Rivera-Vasquez, B.F. and Dixon, D.G., 2006. Leaching kinetics and
stoichiometry of pyrite oxidation from a pyrite–marcasite concentrate in acid ferric
sulfate media. Hydrometallurgy, 84(3–4): 225-238.
Butler, J.N., 1998. Ionic Equilibrium: Solubility and pH Calculations. A Wiley-Interscience
publication, Canada.
Cenni, R., Frandsen, F., Gerhardt, T., Spliethoff, H. and Hein, K.R.G., 1998. Study on trace
metal partitioning in pulverized combustion of bituminous coal and dry sewage sludge.
Waste Management, 18(6–8): 433-444.
Chagnes, A., Rager, M.-N., Courtaud, B., Thiry, J. and Cote, G., 2010. Speciation of vanadium
(V) extracted from acidic sulfate media by trioctylamine in n-dodecane modified with 1-
tridecanol. Hydrometallurgy, 104(1): 20-24.
Chen, X., Lan, X., Zhang, Q., Ma, H. and Zhou, J., 2010. Leaching vanadium by high
concentration sulfuric acid from stone coal. Transactions of Nonferrous Metals Society of
China, 20(Supplement 1): s123-s126.
138
Chen, Y., Feng, Q., Shao, Y., Zhang, G, Ou, L. and Lu, Y., 2006. Investigations on the extraction
of molybdenum and vanadium from ammonia leaching residue of spent catalyst.
International Journal of Mineral Processing, 79(1): 42-48.
Choi, S.K., Lee, S., Song, Y.K. and Moon, H.S., 2002. Leaching characteristics of selected
Korean fly ashes and its implications for the groundwater composition near the ash
disposal mound. Fuel, 81(8): 1083-1090.
Crouse, D.J., Brown, K.B., 1959. Solvent extraction recovery of vanadium and uranium nfrom
acid liquors with DI(2-Ethylhexyl) phosphoric acid. Report by United States Atomic Energy
Department.
Das, B., Prakash, S., Reddy, P.S.R. and Misra, V.N., 2007. An overview of utilization of slag
and sludge from steel industries. Resources, Conservation and Recycling, 50(1): 40-57.
Deng, Z., Wei, C., Fan, G., Li. M., Li, C. and Li, X., 2010. Extracting vanadium from stone-coal
by oxygen pressure acid leaching and solvent extraction. Transactions of Nonferrous
Metals Society of China, 20(Supplement 1): s118-s122.
El-Enein, S.A., Aassy. I.E., Rezk, A.A., Manaa, E.A. and Kassab, W.A., 2014.
Uranium/vanadium separation from El-Shahu carnotite-bearing kaolin, south western
Sinai Egypt. International Journal of Science Basic and Applied Research, ISSN 2307-
4531.
El-Nadi, Y.A., Awwad, N.S. and Nayl, A.A., 2009. A comparative study of vanadium extraction
by Aliquat-336 from acidic and alkaline media with application to spent catalyst.
International Journal of Mineral Processing, 92(3-4): 115-120.

139
Evans J., H.T. and Garrels, R.M., 1958. Thermodynamic equilibria of vanadium in aqueous
systems as applied to the interpretation of the Colorado Plateau ore deposits. Geochimica
et Cosmochimica Acta, 15(1–2): 131-149.
Fernandez, A., Wendt, J., Wolski, N., Hein, K., Wang, S. and Witten, M., 2003. Inhalation health
effects of fine particles from the co-combustion of coal and refuse derived fuel.
Gemosphere, 51(10): 1129-1137.
Fischer, R., 1942. Vanadium deposits of Colorado and Utah. Report of United States Department
of Strategic Minerals Investigation.
Gavett, S.H., Madison, S., Dreher, K., Winsett, D., McGee, J. and Costa, D., 1997. Metal and
sulfate composition of residual oil fly ash determines airway hyperreactivity and lung
injury in rats. Environmental Research, 72(2): 162-172.
Geyrhofer, W., Voglauer, B. and Joergl, H.P., 2003. Control of a roasting process for the
recovery of vanadium, Control Applications, 2003. Proceedings of 2003 IEEE
Conference, vol1, 614-617, Florida, USA.
Giavarini, C., 1982. Recovery of vanadium from ash-leaching solutions by solvent extraction.
Fuel, 61(6): 549-552.
Gomez-Bueno, C., Spink, D. and Rempel, G., 1981. Extraction of vanadium from athabasca tar
sands fly ash. Metallurgical and Materials Transactions B, 12(2): 341-352.
Grosber-Manon, M., Stambouli, M., Gillet, J., Grossiord, J. and Pareau, D., 2011.
Thermodynamic study of chloroquine extraction by organo-phosphorus and
thiophosphorus acids, 19th International Solvent Extraction Conference, Santiago, Chile.
140
Grzechowiak, J., Grysiewicz, W., Ostrowski, A., Radomyski, B. and Walendziewski, J., 1987.
Recovery of aluminium, cobalt, iron and nickel from used catalysts containing metals of
ferrous group and possibly molybdenum on alumina support. Polish Patent, No. 136713.
Guibal, E., Guzman, J., Navarro, R. and Revilla, J., 2003. Vanadium extraction from fly ash:
preliminary study of leaching, solvent Extraction, and sorption on Chitosan, Separation
Science and Technology, 38, 2881-2899.
Gupta, C. K. and Krishnamurphy, N., 1992. Extractive metallurgy of vanadium (Process
Metallurgy). Elsevier Science, Netherland.
Habashi, F., 1998. Handbook of extractive metallurgy. Wiley-VCH, Germany.
Hammett, L.P. and Chapman, R.P., 1934. The solubilities of some organic oxygen compounds in
sulfuric acid-water mixtures. Journal of the American Chemical Society, 56(6): 1282-
1285.
Holloway, P. and Etsell, T., 2004. Salt roasting of suncor oil sands fly ash. Metallurgical and
Materials Transactions B, 35, 1051-1058.
HSC, www.hsc-chemistry.net., Outokumpu.
Hughes, M.A. and Biswas, R.K., 1991. The kinetics of vanadium (IV) extraction in the acidic
sulphate-D2EHPA-n-hexane system using the rotating diffusion cell technique.
Hydrometallurgy, 26(3): 281-297.
Hukkanen, E. and Walden, H., 1985. The production of vanadium and steel from
titanomagnetites. International Journal of Mineral Processing, 15(1–2): 89-102.
Hurley, B., Qiu, S. and Buchheit, R.G., 2011. Raman spectroscopy characterization of aqueous
vanadate species interaction with aluminum alloy 2024–T3 surfaces. Journal of the
Electrochemical Society, 158, 125-131.

141
Ipinmoroti, K.O. and Hughes, M.A., 1990. The mechanism of vanadium (IV) extraction in a
chemical kinetic controlled regime. Hydrometallurgy, 24(2): 255-262.
Ivakin, A.A., 1966. Complex ions quinquevalent vanadium with chloride and sulfate ions.
Journal of applied chemistry 39(2): 252-258.
Kametani, H. and Aoki, A., 1985. Effect of suspension potential on the oxidation rate of copper
concentrate in a sulfuric acid solution. Metallurgical Transactions B, 16(4): 695-705.
Kanamori, K., Sukurai, M., Kinoshita, T., Uyama, T., Ueki, T. and Michibata, H., 1999. Direct
reduction from vanadium(V) to vanadium(IV) by NADPH in the presence of EDTA. A
consideration of the reduction and accumulation of vanadium in the ascidian blood cells.
Journal of Inorganic Biochemistry, 77(3–4): 157-161.
Kar, B.B., 2005. Carbothermic reduction of hydro-refining spent catalyst to extract molybdenum.
International Journal of Mineral Processing, 75(3–4): 249-253.
Kar, B.B., Murthy, B.V.R. and Misra, V.N., 2005. Extraction of molybdenum from spent catalyst
by salt-roasting. International Journal of Mineral Processing, 76(3): 143-147.
Lan Yao-zhong, L.j., 2005. Review of vanadium processing in China. Engineer sciences, 3(3):
58-62.
Lee, F.M., Knudsen, R.D. and Kidd, D.R., 1992. Reforming catalyst made from the metals
recovered from spent atmospheric resid desulfurization catalyst. American Chemical
Society, 31, 487-490.
Levenspiel, O., 1999. Chemical reaction engineering. John wiley & Sons.
Li, M., Wei, C., Fan, G., Li, C., Deng, Z. and Li. X.2009. Extraction of vanadium from black
shale using pressure acid leaching. Hydrometallurgy, 98(3-4): 308-313.

142
Li, M., Wei, C., Fan, G., Wu, H, Li, C. and Li., X. 2010a. Acid leaching of black shale for the
extraction of vanadium. International Journal of Mineral Processing, 95(1-4): 62-67.
Li, M., Fan, G., Li, C.., Deng, Z. and Li. X.2010c. Pressure acid leaching of black shale for
extraction of vanadium. Transactions of Nonferrous Metals Society of China,
20(Supplement 1): s112-s117.
Li, M.T., Wei, C., Zhou, X., Deng, Z. and Li. X., 2012. Kinetics of vanadium leaching from
black shale in non-oxidative conditions. Mineral Processing and Extractive Metallurgy,
121(1): 40-47.
Li, X., Wei, C., Zhou, X., Deng, Z., Li, C., Li. X. and Fan, G., 2011. Selective solvent extraction
of vanadium over iron from a stone coal/black shale acid leach solution by
D2EHPA/TBP. Hydrometallurgy, 105(3-4): 359-363.
Li, X.. and Xie, B., 2012. Extraction of vanadium from high calcium vanadium slag using direct
roasting and soda leaching. International Journal of Minerals, Metallurgy, and Materials,
19(7): 595-601.
Lozano, L.J. and Godínez, C., 2003. Comparative study of solvent extraction of vanadium from
sulphate solutions by primene 81R and alamine 336. Minerals Engineering, 16(3): 291-
294.
Marafi, M. and Stanislaus, A., 2003. Options and processes for spent catalyst handling and
utilization. Journal of Hazardous Materials, 101(2): 123-132.
Meawad, A.S., Bojinova, D.Y. and Pelovski, Y.G., 2010. An overview of metals recovery from
thermal power plant solid wastes. Waste Management, 30(12): 2548-2559.

143
Mishra, D., Chaudhury, G.R., Kim, D.J. and Ahn, J.G., 2010. Recovery of metal values from
spent petroleum catalyst using leaching-solvent extraction technique. Hydrometallurgy,
101(1-2): 35-40.
Morgan, B. and Lahav, O., 2007. The effect of pH on the kinetics of spontaneous Fe(II)
oxidation by O2 in aqueous solution – basic principles and a simple heuristic description.
Chemosphere, 68(11): 2080-2084.
Moskalyk, R. R. and Alfantazi, A. M., 2003. Processing of vanadium: a review. Minerals
Engineering, 16(9): 793-805.
Navarro, R., Guzman, J., Saucedo, I., Revilla, J. and Guibal, E., 2007. Vanadium recovery from
oil fly ash by leaching, precipitation and solvent extraction processes. Waste
Management, 27(3): 425-438.
Nekovár, P. and Schrötterová, D., 2000. Extraction of V(V), Mo(VI) and W(VI) polynuclear
species by primene JMT. Chemical Engineering Journal, 79(3): 229-233.
Okuwaki, A., Kimura, A., Umetsu, Y., Tozawa, K. and Okabe, T., 1988. Extraction of vanadium
from electrostatic precipitator ashes of oil power plants. American Chemical Society,
27(7), 1218-1222.
Olazabal, M. A., Orive, M. M., Fernández, L.A. and Madariaga, J.M., 1992a. Selective
extraction of vanadium (V) from solutions containing molybdenum (VI) by ammonium
salts dissolved in toluene, Solvent Extraction and Ion Exchange, 10(4), 623-635.
Pourbaix, M., 1949. Thermodynamics of dilute aqueous solutions. E. Arnold, London.
Puigdomenech, I., 2004. Medusa software. KTH Univeristy, Sweden.

144
Qiu, S., Wei, C., Li, M., Zhou, X., Li, C. and Deng Z., 2011. Dissolution kinetics of vanadium
trioxide at high pressure in sodium hydroxide–oxygen systems. Hydrometallurgy, 105(3-
4): 350-354.
Querol, X., Fernandez, J. and Lopez, A., Trace elements in coal and their behavior during
combustion in a large power station. Fuel, 74(3), 331-343.
Querol, X., Moreno, N., Alastuey, A., Juan, R., Andrés, J. M., López-Soler, A., Ayora, C.,
Medinaceli, A. and Valero, A., Synthesis of high ion exchange zeolites from coal fly ash.
Geologica Acta, 5(1): 49-57.
Querol, X., Umana, J., Alastuey, A. 2001. Extraction of soluble major and trace elements from
fly ash in open and closed leaching systems. Fuel, 80(6): 801-813.
Radosevich, A.T., 2007. Application of rhenium and Vanadium-oxo complexes as catalysts in
organic synthesis. Berkeley, USA.
Rakib, M. and Durand, G., 1996. Study of complex formation of vanadium(V) with sulphate ions
using a solvent extraction method. Hydrometallurgy, 43(1–3): 355-366.
Robert J. Pritchard, A., James R. Lehmann, Darrell W. Winsett, Jeffrey S. Tepper, Patricia Park,
M. Ian Gilmour, Kevin L. Dreher ,Daniel L. Costa, 1996. Oxidant generation and lung
injury after particulate air pollutant exposure increase with the concentrations of
associated metals. Inhalation Toxicology, 8(5): 457-477.
Rohrmann, B., 1985. Vanadium in South Africa. Journal of the South African Institute of Mining
and Metallurgy, 85, 141-150.
Romanov, N.P., 2009. A new formula for saturated water steam pressure within the temperature
range −25 to 220°C. Izvestiya, Atmospheric and Oceanic Physics, 45(6): 799-804.

145
Rydberg, J., Cox, M., Musikas, C. and Choppin, G.R., 2004. Solvent extraction principles and
practice, Revised and Expanded, 2 edition. CRC Press, USA.
Shlewit, H. and Alibrahim, M., 2006. Extraction of sulfur and vanadium from petroleum coke by
means of salt-roasting treatment. Fuel, 85(5-6): 878-880.
Sun, D., Li, X., Brungs, M. and Trimm, D., 1998. Encapsulation of heavy metals on spent fluid
catalytic cracking catalyst. Water Science and Technology, 38(4–5): 211-217.
Sun, D.D., Tay, J.H., Cheong, H.K., Leung, D.L.K. and Qian, G., 2001. Recovery of heavy
metals and stabilization of spent hydrotreating catalyst using a glass–ceramic matrix.
Journal of Hazardous Materials, 87(1–3): 213-223.
Tavakoli, M.R., Yoozbashizadeh, H. and Halali, M., 2010. The effect of leaching parameters on
vanadium recovery from oil residue. Canadian institute of mining and metallurgy, 355-
362, Vancouver, Canada.
Tomikawa, K. and Kanno, H., 1998. Raman study of sulfuric acid at low temperatures. The
Journal of Physical Chemistry A, 102(30): 6082-6088.
Tracey, A.S. and Crans, D.C., 1998. Vanadium compounds: chemistry, biochemistry, and
therapeutic applications. American Chemical Society, USA.
Tracey, A.S., Willsky, G.R. and Takeuchi, E.S., 2007. Vanadium: chemistry, biochemistry,
pharmacology and practical applications. CRC Press, USA.
Tromans, D., 1998. Oxygen solubility modeling in inorganic solutions: concentration,
temperature and pressure effects. Hydrometallurgy, 50(3): 279-296.
Tromans, D., 2001. Modelling oxygen solubility in bleaching solutions. The Canadian Journal of
Chemical Engineering, 79(1): 156-160.

146
Tsai, S. and Tsai, M., 1998. A study of the extraction of vanadium and nickel in oil-fired fly ash.
Resources, Conservation and Recycling, 22(3-4): 163-176.
Veranth, J.M. et al., 2000. Coal fly ash and mineral dust for toxicology and particle
characterization studies: equipment and methods for PM2.5 and PM1 enriched samples.
Aerosol Science and Technology, 32(2): 127-141.
Villarreal, M.S., Kharisov, B.I., Torres-Martínez, L.M. and Elizondo, V.N., 1999. Recovery of
vanadium and molybdenum from spent petroleum catalyst of PEMEX. American
Chemical Society, 38(12), 4624-4628.
Vitolo, S., Seggiani, M. and Falaschi, F., 2001. Recovery of vanadium from a previously burned
heavy oil fly ash. Hydrometallurgy, 62(3): 145-150.
Vitolo, S., Seggiani, M., Filippi, S. and Brocchini, C., 2000. Recovery of vanadium from heavy
oil and Orimulsion fly ashes. Hydrometallurgy, 57(2): 141-149.
Wang-xing, L., Zhuo, Z., Zhao-hui, S.U., Xiao-bin, L. and Qing-jie, Z., 2010. Leaching kinetics
of calcium vanadate by Na2CO3 solution. Journal of Process Engineering, 10(3): 548-553.
Wexler, A., 1976. Vapor pressure formulation for water in range 0 to 100°C: a revision. Journal
of Research of NIST, 80A: 775-785.
Wiewiorowski, E.I., Tinnin, L.R. and Crnojevich, R., 1986. Cyclic process for recovering metal
values and alumina from spent catalysts. US Patent. No.4670229.
Wiśniewski, M., Bogacki, M.B. and Szymanowski, J., 1996. Extraction of sulphuric acid from
technological solution of hydroxylamine sulphate. Journal of Radioanalytical and Nuclear
Chemistry, 208(1): 195-206.
www.infomine.com.
www.minerals.usgs.gov.

147
www.wikipedia.org
Xiao, Q., Chen, Y., Gao, Y., Xu, H. and Zhang, Y., 2010. Leaching of silica from vanadium-
bearing steel slag in sodium hydroxide solution. Hydrometallurgy, 104(2): 216-221.
Yang, Z. and Gould, E.S., 2003. Reactions of vanadium(iv) and (v) with s2 metal-ion reducing
centers. Dalton Transactions, 20: 3963-3967.
Yasuhara, H., 1982. Treatment of waste desulphurisation catalyst. Japanese Patent.
Zeng, L. and Cheng, C.Y., 2009. A literature review of the recovery of molybdenum and
vanadium from spent hydrodesulphurisation catalysts: Part I: Metallurgical processes.
Hydrometallurgy, 98(1-2): 1-9.
Zeng, L. and Cheng, C.Y., 2010. Recovery of molybdenum and vanadium from synthetic
sulphuric acid leach solutions of spent hydrodesulphurisation catalysts using solvent
extraction. Hydrometallurgy, 101(3-4): 141-147.
Zeng, L. and Yong Cheng, C., 2009. A literature review of the recovery of molybdenum and
vanadium from spent hydrodesulphurisation catalysts: Part II: Separation and
purification. Hydrometallurgy, 98(1-2): 10-20.
Zhang, P., Inoue, K. and Tsuyama, H., 1995. Recovery of metal values from spent
hydrodesulfurization catalysts by liquid-liquid extraction. Energy & Fuels, 9(2): 231-239.
Zhang, P., Inoue, K., Yoshizuka, K. and Tsuyama, H., 1996. Extraction and selective stripping of
molybdenum (VI) and vanadium (IV) from sulfuric acid solution containing aluminum
(III), cobalt ( II), nickel (II) and iron (III) by LIX 63 in Exxsol D80. Hydrometallurgy,
41(1): 45-53.
Zhang, Y., Hu, Y. and Bao, S., 2012. Vanadium emission during roasting of vanadium-bearing
stone coal in chlorine. Minerals Engineering, 30: 95-98.

148
Zheng, C.Q., Allen, C.C. and Bautista, R.G., 1986. Kinetic study of the oxidation of pyrite in
aqueous ferric sulfate. Industrial & Engineering Chemistry Process Design and
Development, 25(1): 308-317.
Zhou, X., Wei, C., Xia, W., Li, M., Li, C., Deng, Z. and Xu, H. 2012. Dissolution kinetics and
thermodynamic analysis of vanadium trioxide during pressure oxidation. Rare Metals,
31(3): 296-302.
Zhu, Y., Zhang, G., Feng, Q., Lu, Y., Ou. L., Huang, S., 2010. Acid leaching of vanadium from
roasted residue of stone coal. Transactions of Nonferrous Metals Society of China, 20,
Supplement 1(0): s107-s111.