some approaches and issues related to isccp-based land fluxes eric f wood princeton university
TRANSCRIPT

Some Approaches and Issues related to ISCCP-based Land Fluxes
Eric F WoodPrinceton University

1. Overview of two models that we’re using for continental-scale ET retrievals, the “Surface Energy Budget System” (SEBS) based on Su (2002) and a Penman Montheith-based approach.
2. Quick-views of some surface radiation products over the U.S. (MODIS, CERES, ISCCP)
3. Some initial results4. Some critical issues for Land Flux
success.5. Inferred ET (and surface budgets) from
LSM, reanalysis and atmospheric satellite data
Outine

Use the Surface Energy Balance Model (SEBS) to determine instantaneous daily ET predictions (limited
by surface temperature).
SEBS Model Description
Components of the radiation balance are used to determine the net radiation (Rn) – SW , α, ε, Ts, LW
Rn – G = H + LE
Rn = (1- α) SW + ε LW - εσ 4sT
The ground heat flux (G) is parameterized as a function of fractional cover – LAI/NDVI relationships,
which needs to be improved

SEBS Vertical Extent (ASL-PBL)
Viscous sublayerTransition layerInertial sublayer
Atmospheric Surface Layer (ASL)
Planetary (Convective) Boundary Layer (PBL)
Roughness sublayer
~ 10 1~2 m
~ 10 -1~1 m
~ 10 -3 m
~ 10 2-3 m
Free Atmosphere
Wind profile
Blending height
PBL height
Interfacial sublayer
Princeton University

L
z
L
dz
z
dz
k
uu m
mmm
00
0
0* ln
1
00
0
00* ln
L
z
L
dz
z
dzCkuH h
hhh
ap
kgH
uCL vp 3
*
Energy Balance Method - Turbulent Heat Fluxes
Princeton University
Use Similarity Theory for the Atmospheric Surface Layer
Wind, air temperature, humidity(aerodynamic roughness,
thermal dynamic roughness)
H
G0
LERn
?,, 000 hm zdz ?,, quTa

SEBS Model Description
CEOP observations used to assess ET predictionsForcing data from validation tower sites supplemented with MODIS data to produce estimates of surface fluxes.

Previous Tower Investigations – SMACEX 02
Examining the spatial equivalence for corn and soybean5 tower sites 3 tower sites
High resolution/quality data produces good quality estimates – examine model accuracy

Previous Investigations – SMACEX 02
~ 1020 m
Ê = 380.0 W/m2
σ = 35.7 W/m2
Ê = 392.3 W/m2
σ = 105.3 W/m2
~ 90 m
Ê = 367.5 W/m2
σ = 97.2 W/m2
~ 60 m

Penman-Monteith (P-M) Equation
a
s
a
aspan
rr
r
eeCGR
E
1
)().(
Rn – Net Radiation (W/m2)
G – Soil Heat Flux (W/m2)
a – Density of air (Kg/m3)
Cp – Specific Heat of Air (J/Kg/oC)
es – Saturated vapor pressure (Pa)
ea – Vapor pressure of air (Pa)
ea – Vapor pressure of air (Pa)
ra – Aerodynamic Resistance (s/m)
rs – Surface Resistance (s/m)
– Slope of saturated vapor pressure (Pa/oC)
– Psychrometric constant (Pa/oC)

Datasets
Data Type Variable Unit Source Platform Resolution
Surface Meteorological
Data
Air temp.
Pressure
Wind
Vapor Pressure
CKPa
m/s
KPa
AIRS / ISCCP
AIRS / ISCCP NLDAS
AIRS
Aqua / ISCCP
Aqua / ISCCP
NLDAS
Aqua
45 km
45 km
12.5 km
45 km
Radiative Energy Flux
Incident SW Rad.
Incident LW Rad.W/m2
W/m2
CERES
ISCCP
Aqua
ISCCP
0.2 deg
2.5 deg
Surface Temperature
Composite Radiometric Temp. (Soil +
Veg.)
K MODIS
ISCCPAqua 1 – 5 km
2.5 deg
Vegetation Parameters
Emissivity
Albedo
LAI
Veg. Type
-
-
-
-
MODIS / ISCCP
MODIS / ISCCP
MODIS
MODIS
Aqua/Terra
Aqua/Terra
Aqua/Terra
Terra (UMD)
1 - 5 km / 0.2 deg
1 km / 0.2 deg
1 - 5 km
1 Km

Incoming Shortwave Radiation – CERES
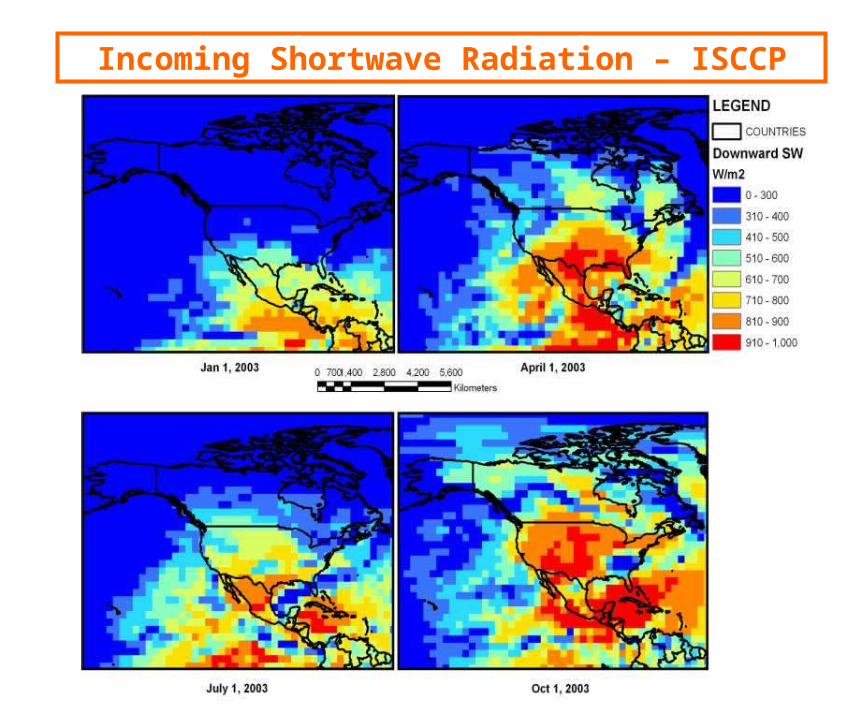
Incoming Shortwave Radiation – ISCCP
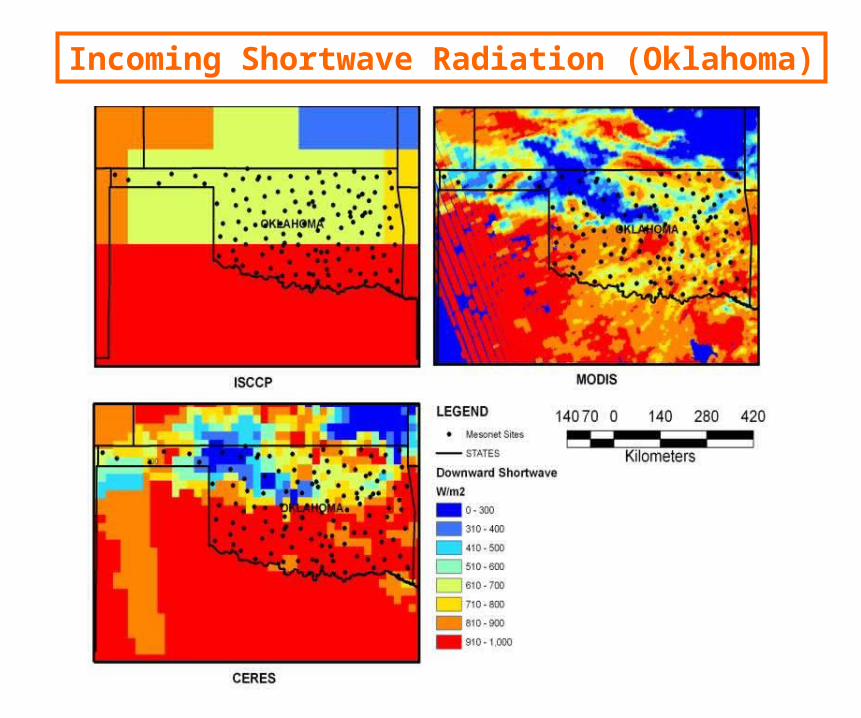
Incoming Shortwave Radiation (Oklahoma)

0 200 400 600 800 10000
200
400
600
800
1000
R = 0.4
CERES [W/m2]
ISC
CP
[W/m
2 ]
0 200 400 600 800 10000
200
400
600
800
1000
R = 0.47
CERES [W/m2]
ISC
CP
[W/m
2 ]
0 200 400 600 800 10000
200
400
600
800
1000
R = 0.83
CERES [W/m2]
ISC
CP
[W/m
2 ]
0 200 400 600 800 10000
200
400
600
800
1000
R = 0.54
CERES [W/m2]
ISC
CP
[W/m
2 ]
0 200 400 600 800 10000
200
400
600
800
1000
R = 0.49
CERES [W/m2]
ISC
CP
[W/m
2 ]
0 200 400 600 800 10000
200
400
600
800
1000
R = 0.92
CERES [W/m2]
ISC
CP
[W/m
2 ]
Incoming Shortwave Radiation (Instantaneous)
ISSCP (2.5deg) vs. CERES (upscaled to 2.5deg)
May 1–Aug. 31, 2003, instantaneous (NASA/Aqua)

ISSCP (2.5deg) vs. CERES (upscaled to 2.5deg)
May 2003 – August 2003,
Aggregated to monthly from NASA/Aqua overpass times
300 400 500 600 700 800 900300
400
500
600
700
800
900
R = 0.94
CERES [W/m2]
ISC
CP
[W/m
2 ]
CERES vs.ISSCPMississippi River Basin
May 2003 Monthly Means
300 400 500 600 700 800 900300
400
500
600
700
800
900
R = 0.95
CERES [W/m2]
ISC
CP
[W/m
2 ]
CERES vs.ISSCPMississippi River Basin
June 2003 Monthly Means
300 400 500 600 700 800 900300
400
500
600
700
800
900
R = 0.92
CERES [W/m2]
ISC
CP
[W/m
2 ]
CERES vs.ISSCPMississippi River Basin
July 2003 Monthly Means
300 400 500 600 700 800 900300
400
500
600
700
800
900
R = 0.87
CERES [W/m2]
ISC
CP
[W/m
2 ]
CERES vs.ISSCPMississippi River Basin
August 2003 Monthly Means
May 2003
July 2003
June 2003
Aug. 2003
Incoming Shortwave Radiation (Monthly)
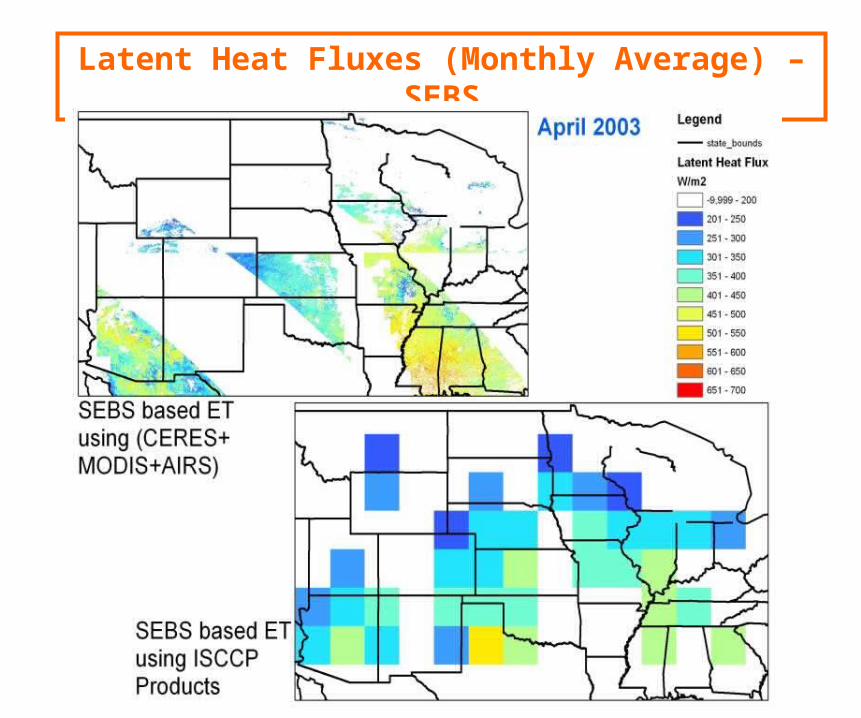
Latent Heat Fluxes (Monthly Average) – SEBS

Latent Heat Fluxes (Monthly Average) – P-M

Latent Heat Fluxes (SEBS w. MODIS and ISCCP)
(Monthly Instantaneous Average)
APRIL 2003
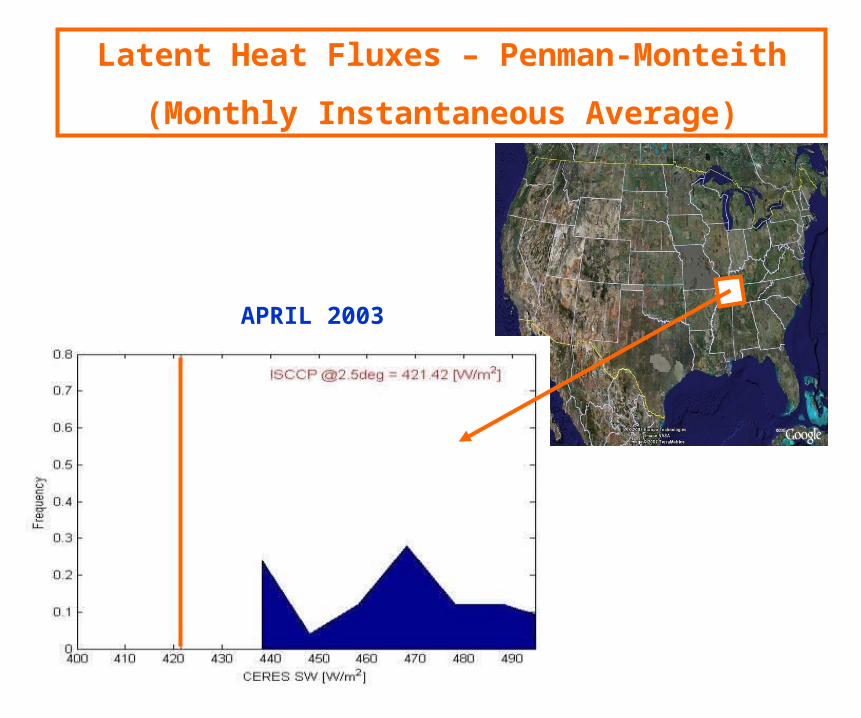
Latent Heat Fluxes – Penman-Monteith
(Monthly Instantaneous Average)
APRIL 2003

APRIL 2003
Latent Heat Fluxes (SEBS w. MODIS and ISCCP)
(Monthly Instantaneous Average)

APRIL 2003
Latent Heat Fluxes – Penman-Monteith
(Monthly Instantaneous Average)

Critical Issues for LandFlux success
1. Scale – impact of coarse scale radiation, surface temperature, meteorology and properties.
2. Validation. Unconvinced that towers will do much for LandFlux.
3. Algorithm development/s, (multi-model merging of different retrievals?) Role of data assimilation?
4. Can we infer ET from other sources/models.

PGF501948-2000, 3hr, daily, 1.0degP, T, Lw, Sw, q, p, w
CRU1901-2000, Monthly, 0.5degP, T, Tmin, Tmax, Cld
GPCP1997-, Daily, 1.0degP
UW1979-2000, Daily, 2.0degP
TRMM2002-, 3hr, 0.25degP
SRB1985-2000, 3hr, 1.0degLw, Sw
NCEP/NCAR Reanalysis1948-, 3hr, 6hr, daily, T62P, T, Lw, Sw, q, p, w
ReanalysisHigh temporal/low spatial resolution
ObservationsGenerally low temporal/high
spatial resolution
Bias-CorrectedHigh temporal/high spatial resolution:
Princeton Global Forcing 50-year data set (PGF50)
Global Forcing Dataset(Sheffield et al. J Climate, 2006)

Global Mean Annual Runoff Ratio
Seasonal (JJA) Surface Soil MoistureVIC
Hydrology Model
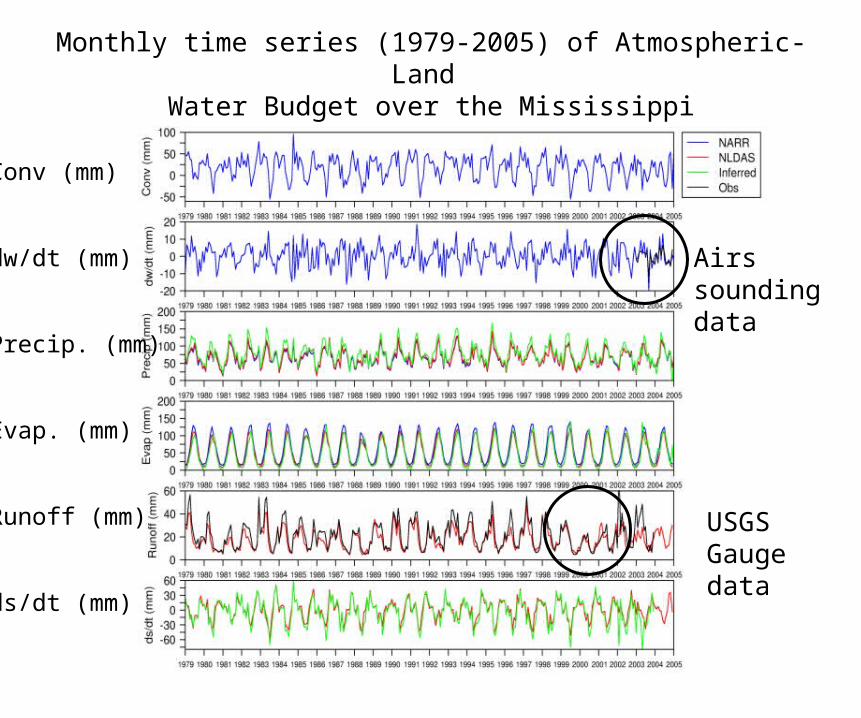
Monthly time series (1979-2005) of Atmospheric-Land Water Budget over the Mississippi
Airs sounding data
USGS Gauge data
Conv (mm)
dw/dt (mm)
Precip. (mm)
Evap. (mm)
Runoff (mm)
ds/dt (mm)

Atmospheric-Land Water Budget over the Mississippi, 1998
Inferred P = ENARR – dw/dtNARR + convNARR
Inferred E = PNARR – dw/dtNARR + convNARR
Inferred ds/dt = convNARR - dw/dtNARR - QOBS
NARR NLDAS Inferred Observed

Mean Seasonal Cycle of P-E

Mean Seasonal Cycle of ET
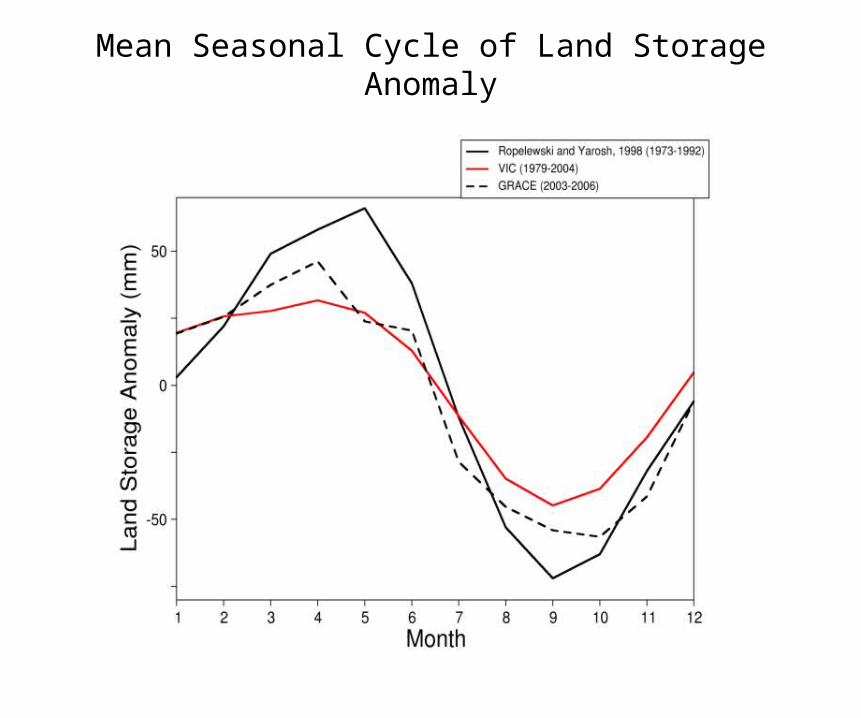
Mean Seasonal Cycle of Land Storage Anomaly
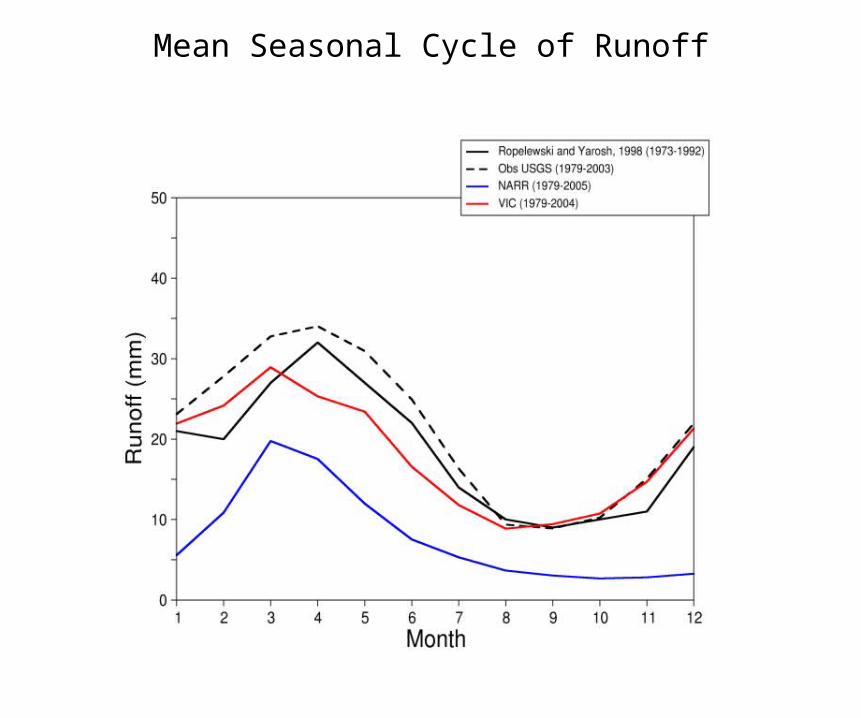
Mean Seasonal Cycle of Runoff

Mean Distribution of Atmospheric-Land Budgets 1979-1999:Evapotranspiration
NARR ModeledVIC (NLDAS)
Inferred from NARR Atmospheric BudgetHigher NARR Modeled ET
Low Inferred ET

Mean Distribution of Atmospheric-Land Budgets 1979-1999:
NARR Convergence NARR dW/dt
NLDAS Precip
Low Inferred E a result of high Conv and high PNARR Precip

Mean Distribution of Atmospheric-Land Budgets 1979-1999:Observed Runoff and dS/dt from NLDAS (VIC) and Inferred from
NARR Atmospheric Budget and Obs. Runoff
Results in high ds/dt
Observed runoff
Inferred ds/dt from NARRAnd observed runoff
NLDAS ds/dt