sound absorption structures: from porous media to...
TRANSCRIPT
MR47CH05-Sheng ARI 7 June 2017 8:25
Sound Absorption Structures:From Porous Media to AcousticMetamaterialsMin Yang and Ping ShengDepartment of Physics, Hong Kong University of Science and Technology, Clear Water Bay,Kowloon, Hong Kong, China; email: [email protected]
Annu. Rev. Mater. Res. 2017. 47:83–114
The Annual Review of Materials Research is online atmatsci.annualreviews.org
https://doi.org/10.1146/annurev-matsci-070616-124032
Copyright c© 2017 by Annual Reviews.All rights reserved
Keywords
porous media, micro-perforated panel, acoustic metamaterials, causality,broadband optimal metamaterial absorber, customized sound absorber,low-frequency sound absorption
Abstract
The recent advent of acoustic metamaterials has initiated a strong revivalof interest on the subject of sound absorption. The present review is basedon the physics perspective as the coherent basis of this diverse field. Forconventional absorbers, viscous dissipation and heat conduction at the fluid-solid interface, when expressed through micro-geometric parameters, yieldan effective medium description of porous media and micro-perforated pan-els as effectual sound absorbers. Local resonances and their geometric andsymmetry constraints serve as the framework for surveying a variety of acous-tic metamaterial absorbers that can realize previously unattainable absorp-tion spectra with subwavelength-scale structures. These structures includedecorated membrane resonators, degenerate resonators, hybrid resonators,and coiled Fabry-Perot and Helmholtz resonators. As the acoustic responseof any structure or material must obey the causality principle, the impliedconstraint—which relates the absorption spectrum of a sample to its requiredminimum thickness—is presented as a means to delineate what is ultimatelypossible for sound-absorbing structures. The review concludes by describinga recently reported strategy for realizing structures that can exhibit custom-designed absorption spectra, as well as its implementation in the form of abroadband absorber with a thickness that is close to the minimum value asdictated by causality.
83
Click here to view this article'sonline features:
• Download figures as PPT slides• Navigate linked references• Download citations• Explore related articles• Search keywords
ANNUAL REVIEWS Further
Ann
u. R
ev. M
ater
. Res
. 201
7.47
:83-
114.
Dow
nloa
ded
from
ww
w.a
nnua
lrev
iew
s.or
g A
cces
s pr
ovid
ed b
y 20
3.18
6.7.
113
on 0
7/11
/17.
For
per
sona
l use
onl
y.

MR47CH05-Sheng ARI 7 June 2017 8:25
1. INTRODUCTION
Owing to the importance of sound absorption in room acoustics and environmental noise reme-diation, its study and practice were extensively pursued during the past century. For sound in theaudible frequency range of 20 to 20,000 Hz, dissipation in the transmitting medium—air—is usu-ally minimal so that the effective absorption of sound depends on micro- and/or macrostructuredmaterials in which the sound energy is dissipated through two mechanisms associated with thesolid-air interface. One is viscous dissipation in the vicinity of the solid surface, where the non–slipboundary condition can cause large relative motion within the viscous boundary layer. The otheris heat conduction through solids, which leads to the breakdown of the adiabatic character ofsound propagation. It follows that materials with a large microstructured air-solid interfacial area,e.g., porous media, generally have the largest dissipation coefficients.
Because sound is associated with very small air displacement velocities, its dissipation as afunction of frequency must obey the linear response theory, in which the generalized flux (e.g.,electrical current density, flow rate, heat flux) is linearly proportional to the generalized force (e.g.,gradients of electrical potential, pressure, temperature). Because dissipative force varies linearlyas function of the rate (e.g., dynamic friction varies linearly as a function of relative velocity) anddissipated power is given by the product of force and flux, it follows that sound dissipation is aquadratic function of frequency, as shown below. Hence, for low-frequency sound, dissipation isinherently much weaker than for high-frequency sound.
The dissipation coefficient is not the only parameter controlling sound absorption. Dissipatedenergy is given by the volume integral of the product between the local energy density and thedissipation coefficient. Hence, even if the dissipation coefficient is large, the total absorption canbe weak if most of the wave energy is reflected at the structure-air interface. This highlights theimportance of impedance matching in sound absorption. Impedance is defined as the productof mass density and sound velocity. Impedance matching with air implies no reflection from thesound-absorbing structure, which guarantees that the maximum amount of sound energy can besubject to absorption inside the structure. To diminish impedance mismatch, porous materialsare shaped into wavelength-scale pyramids so as to minimize reflection, usually denoted as thegradient index strategy, and micro-perforated panels (MPPs) use designed backcavities to betterimpedance match with air over a desired frequency band.
Above are the main elements of physics relevant to sound absorption. They serve as the back-ground for this review, which comprises three parts. The first part is focused on traditional porousmaterials such as plastic foam, fiber glass, and mineral wool (1, 2), whose absorption characteristicscan be accounted for by a unifying effective medium theory. Here MPPs are singled out as a specialtopic because it utilizes the resonance principle for attaining impedance matching over certainfrequency regimes and hence serves as a suitable link to what follows. The second part reviewsacoustic metamaterial absorbers that utilize local resonances to enhance the energy density andthereby the sound dissipation. In this context, during the past decade, structures that resonatelocally with subwavelength scales (3–9), acoustic metamaterials (10, 11), and metasurfaces (12, 13)have shown diverse functionalities in the manipulation of sound such as negative refraction (14–16), subwavelength imaging (17–19), cloaking (20, 21), and one-way transmittance (22, 23). It is notsurprising that some acoustic metamaterial structures can exhibit near-perfect absorption withindeep-subwavelength volumes (24–38), far beyond the limit of conventional sound-absorbing ma-terials. The third part reviews the recent advances in achieving optimal sound-absorbing struc-tures. Here optimality is defined by attaining the limit as dictated by the causality constraint,which must be obeyed by acoustic responses of all sound-absorbing structures and materials. Weshow that broadband optimal metamaterial absorbers (BOMAs) (39, 39a) can be constructed by
84 Yang · Sheng
Ann
u. R
ev. M
ater
. Res
. 201
7.47
:83-
114.
Dow
nloa
ded
from
ww
w.a
nnua
lrev
iew
s.or
g A
cces
s pr
ovid
ed b
y 20
3.18
6.7.
113
on 0
7/11
/17.
For
per
sona
l use
onl
y.
MR47CH05-Sheng ARI 7 June 2017 8:25
ddaa bb cc
Plastic foam Glass fiber Mineral wool d
Porousmedium
Reflectingwall
Reflectingwall
e
Z/Z 0
Re(Z)
– Im(Z)
500 1,000 1,500
–2
0
2
Frequency (Hz)
f
500 1,000 1,500 2,0000
0.2
0.4
0.6
0.8
1.0
Abs
orpt
ion,
A
Frequency (Hz)
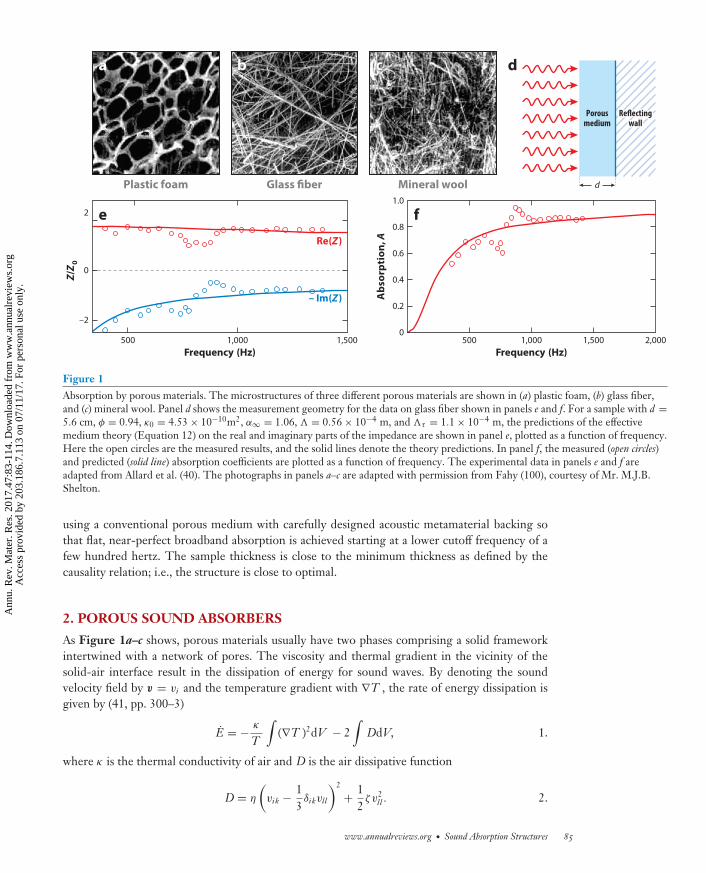
Figure 1Absorption by porous materials. The microstructures of three different porous materials are shown in (a) plastic foam, (b) glass fiber,and (c) mineral wool. Panel d shows the measurement geometry for the data on glass fiber shown in panels e and f. For a sample with d =5.6 cm, φ = 0.94, κ0 = 4.53 × 10⁻¹⁰m2, α∞ = 1.06, � = 0.56 × 10⁻⁴ m, and �τ = 1.1 × 10⁻⁴ m, the predictions of the effectivemedium theory (Equation 12) on the real and imaginary parts of the impedance are shown in panel e, plotted as a function of frequency.Here the open circles are the measured results, and the solid lines denote the theory predictions. In panel f, the measured (open circles)and predicted (solid line) absorption coefficients are plotted as a function of frequency. The experimental data in panels e and f areadapted from Allard et al. (40). The photographs in panels a–c are adapted with permission from Fahy (100), courtesy of Mr. M.J.B.Shelton.
using a conventional porous medium with carefully designed acoustic metamaterial backing sothat flat, near-perfect broadband absorption is achieved starting at a lower cutoff frequency of afew hundred hertz. The sample thickness is close to the minimum thickness as defined by thecausality relation; i.e., the structure is close to optimal.
2. POROUS SOUND ABSORBERS
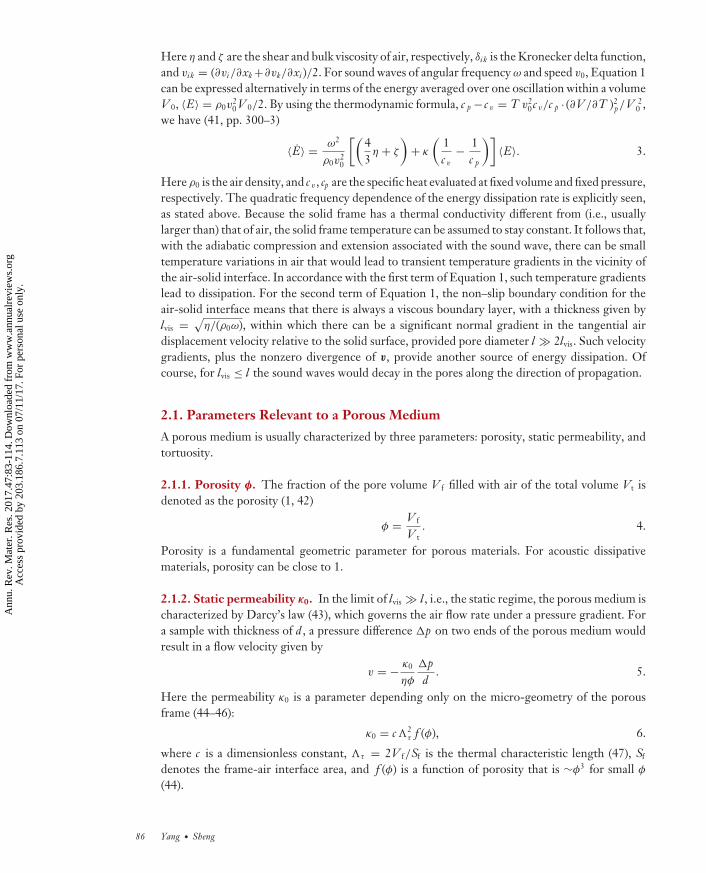
As Figure 1a–c shows, porous materials usually have two phases comprising a solid frameworkintertwined with a network of pores. The viscosity and thermal gradient in the vicinity of thesolid-air interface result in the dissipation of energy for sound waves. By denoting the soundvelocity field by v = vi and the temperature gradient with ∇T , the rate of energy dissipation isgiven by (41, pp. 300–3)
E = − κ
T
∫(∇T )2dV − 2
∫DdV, 1.
where κ is the thermal conductivity of air and D is the air dissipative function
D = η
(vik − 1
3δikvll
)2
+ 12ζv2
ll . 2.
www.annualreviews.org • Sound Absorption Structures 85
Ann
u. R
ev. M
ater
. Res
. 201
7.47
:83-
114.
Dow
nloa
ded
from
ww
w.a
nnua
lrev
iew
s.or
g A
cces
s pr
ovid
ed b
y 20
3.18
6.7.
113
on 0
7/11
/17.
For
per
sona
l use
onl
y.
MR47CH05-Sheng ARI 7 June 2017 8:25
Here η and ζ are the shear and bulk viscosity of air, respectively, δik is the Kronecker delta function,and vik = (∂vi/∂xk +∂vk/∂xi )/2. For sound waves of angular frequency ω and speed v0, Equation 1can be expressed alternatively in terms of the energy averaged over one oscillation within a volumeV 0, 〈E〉 = ρ0v
20 V 0/2. By using the thermodynamic formula, c p − c v = T v2
0 c v/c p · (∂V /∂T )2p/V 2
0 ,we have (41, pp. 300–3)
〈E〉 = ω2
ρ0v20
[(43η + ζ
)+ κ
(1c v
− 1c p
)]〈E〉. 3.
Here ρ0 is the air density, and c v , cp are the specific heat evaluated at fixed volume and fixed pressure,respectively. The quadratic frequency dependence of the energy dissipation rate is explicitly seen,as stated above. Because the solid frame has a thermal conductivity different from (i.e., usuallylarger than) that of air, the solid frame temperature can be assumed to stay constant. It follows that,with the adiabatic compression and extension associated with the sound wave, there can be smalltemperature variations in air that would lead to transient temperature gradients in the vicinity ofthe air-solid interface. In accordance with the first term of Equation 1, such temperature gradientslead to dissipation. For the second term of Equation 1, the non–slip boundary condition for theair-solid interface means that there is always a viscous boundary layer, with a thickness given bylvis = √
η/(ρ0ω), within which there can be a significant normal gradient in the tangential airdisplacement velocity relative to the solid surface, provided pore diameter l � 2lvis. Such velocitygradients, plus the nonzero divergence of v, provide another source of energy dissipation. Ofcourse, for lvis ≤ l the sound waves would decay in the pores along the direction of propagation.
2.1. Parameters Relevant to a Porous Medium
A porous medium is usually characterized by three parameters: porosity, static permeability, andtortuosity.
2.1.1. Porosity φ. The fraction of the pore volume V f filled with air of the total volume Vt isdenoted as the porosity (1, 42)
φ = V f
V t. 4.
Porosity is a fundamental geometric parameter for porous materials. For acoustic dissipativematerials, porosity can be close to 1.
2.1.2. Static permeability κ0. In the limit of lvis � l , i.e., the static regime, the porous medium ischaracterized by Darcy’s law (43), which governs the air flow rate under a pressure gradient. Fora sample with thickness of d , a pressure difference p on two ends of the porous medium wouldresult in a flow velocity given by
v = − κ0
ηφ
pd
. 5.
Here the permeability κ0 is a parameter depending only on the micro-geometry of the porousframe (44–46):
κ0 = c �2τ f (φ), 6.
where c is a dimensionless constant, �τ = 2V f/Sf is the thermal characteristic length (47), Sf
denotes the frame-air interface area, and f (φ) is a function of porosity that is ∼φ3 for small φ
(44).
86 Yang · Sheng
Ann
u. R
ev. M
ater
. Res
. 201
7.47
:83-
114.
Dow
nloa
ded
from
ww
w.a
nnua
lrev
iew
s.or
g A
cces
s pr
ovid
ed b
y 20
3.18
6.7.
113
on 0
7/11
/17.
For
per
sona
l use
onl
y.
MR47CH05-Sheng ARI 7 June 2017 8:25
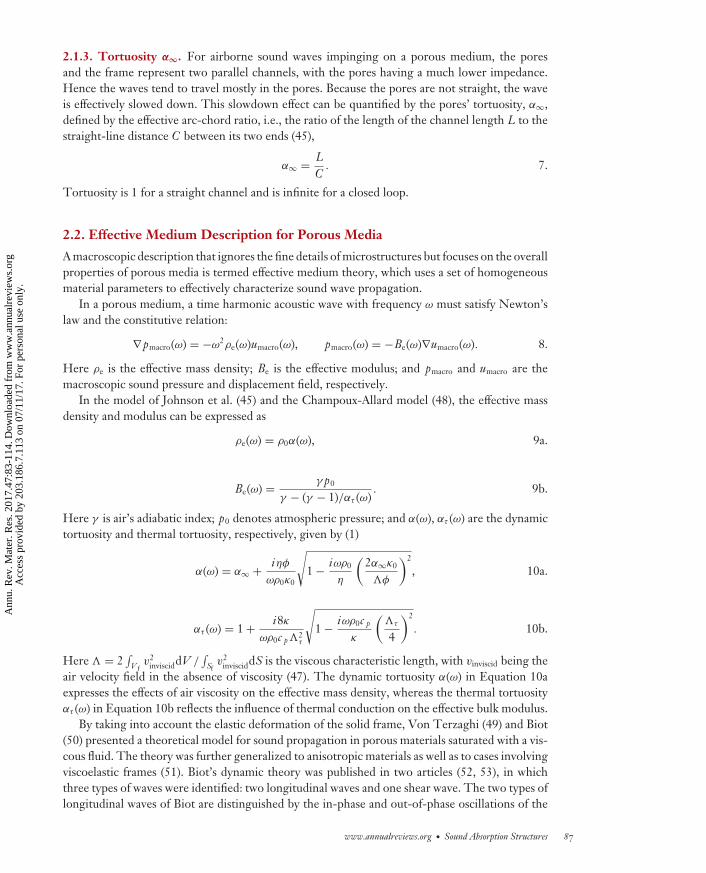
2.1.3. Tortuosity α∞. For airborne sound waves impinging on a porous medium, the poresand the frame represent two parallel channels, with the pores having a much lower impedance.Hence the waves tend to travel mostly in the pores. Because the pores are not straight, the waveis effectively slowed down. This slowdown effect can be quantified by the pores’ tortuosity, α∞,defined by the effective arc-chord ratio, i.e., the ratio of the length of the channel length L to thestraight-line distance C between its two ends (45),
α∞ = LC
. 7.
Tortuosity is 1 for a straight channel and is infinite for a closed loop.
2.2. Effective Medium Description for Porous Media
A macroscopic description that ignores the fine details of microstructures but focuses on the overallproperties of porous media is termed effective medium theory, which uses a set of homogeneousmaterial parameters to effectively characterize sound wave propagation.
In a porous medium, a time harmonic acoustic wave with frequency ω must satisfy Newton’slaw and the constitutive relation:
∇ pmacro(ω) = −ω2ρe(ω)umacro(ω), pmacro(ω) = −Be(ω)∇umacro(ω). 8.
Here ρe is the effective mass density; Be is the effective modulus; and pmacro and umacro are themacroscopic sound pressure and displacement field, respectively.
In the model of Johnson et al. (45) and the Champoux-Allard model (48), the effective massdensity and modulus can be expressed as
ρe(ω) = ρ0α(ω), 9a.
Be(ω) = γ p0
γ − (γ − 1)/ατ (ω). 9b.
Here γ is air’s adiabatic index; p0 denotes atmospheric pressure; and α(ω), ατ (ω) are the dynamictortuosity and thermal tortuosity, respectively, given by (1)
α(ω) = α∞ + iηφ
ωρ0κ0
√1 − iωρ0
η
(2α∞κ0
�φ
)2
, 10a.
ατ (ω) = 1 + i8κ
ωρ0c p�2τ
√1 − iωρ0c p
κ
(�τ
4
)2
. 10b.
Here � = 2∫
V fv2
invisciddV /∫
Sfv2
invisciddS is the viscous characteristic length, with vinviscid being theair velocity field in the absence of viscosity (47). The dynamic tortuosity α(ω) in Equation 10aexpresses the effects of air viscosity on the effective mass density, whereas the thermal tortuosityατ (ω) in Equation 10b reflects the influence of thermal conduction on the effective bulk modulus.
By taking into account the elastic deformation of the solid frame, Von Terzaghi (49) and Biot(50) presented a theoretical model for sound propagation in porous materials saturated with a vis-cous fluid. The theory was further generalized to anisotropic materials as well as to cases involvingviscoelastic frames (51). Biot’s dynamic theory was published in two articles (52, 53), in whichthree types of waves were identified: two longitudinal waves and one shear wave. The two types oflongitudinal waves of Biot are distinguished by the in-phase and out-of-phase oscillations of the
www.annualreviews.org • Sound Absorption Structures 87
Ann
u. R
ev. M
ater
. Res
. 201
7.47
:83-
114.
Dow
nloa
ded
from
ww
w.a
nnua
lrev
iew
s.or
g A
cces
s pr
ovid
ed b
y 20
3.18
6.7.
113
on 0
7/11
/17.
For
per
sona
l use
onl
y.

MR47CH05-Sheng ARI 7 June 2017 8:25
fluid relative to the solid frame. Other models used to predict the behaviors of porous materialsbased on empirical laws include those developed by Delany & Bazley (54) and Allard & Cham-poux (55). Recently, based on the analogy to electromagnetism, Lafarge & Nemati proposed aneffective medium theory allowing spatial dispersion. This theory delineates nonlocal correlationsin composite media for sound waves propagating in porous structures (56, 57).
For airborne sound impinging on a porous medium, the solid frame motion can largely beignored, and the predictions of the effective medium theory are testable by comparison with theexperimental results. For a layer of porous material with thickness d backed by a reflecting wall,the reflection coefficient can be evaluated from the surface impedance Z as
R = Z − Z0
Z + Z0. 11.
Here Z0 denotes the air impedance, given by Z0 = ρ0v0, where v0 = 343 m/s and ρ0 = 1.2kg/m3,and the surface impedance can be expressed in terms of the effective parameters:
Z(ω) = i√
ρe Be cot(ωd√
ρe/Be). 12.
The sound absorption coefficient is calculated as A = 1 − |R|2.The validity of Equation 9 was confirmed by the experiment of Allard et al. (40), as shown
in Figure 1d–f. A layer of 5.6-cm-thick sample made of glass wool was placed on top of a rigidsubstrate. The surface impedance (Equation 12) evaluated from the measured reflection R isshown in Figure 1e. Solid curves are the theory predictions based on Equation 12, in which theeffective mass density and bulk modulus are calculated by using Equation 9 with the parametervalues of glass wool given by φ = 0.94, κ0 = 4.53 × 10⁻¹⁰m2, α∞ = 1.06, � = 0.56 × 10⁻⁴ m,and �τ = 1.1 × 10⁻⁴ m. Good agreement between theory and experiment is seen. The smallripple around 850 Hz is the consequence of resonant motions of the glass framework. BecauseEquation 9 is based on the assumption of a rigid framework, it cannot predict this effect. Theabsorption behavior of this porous material is shown in Figure 1f on the basis of the predictionfrom Equation 12. Absorption displays a relatively flat absorption coefficient of >80%, startingfrom 800 Hz.
2.3. Perforated and Micro-Perforated Panel Absorbers
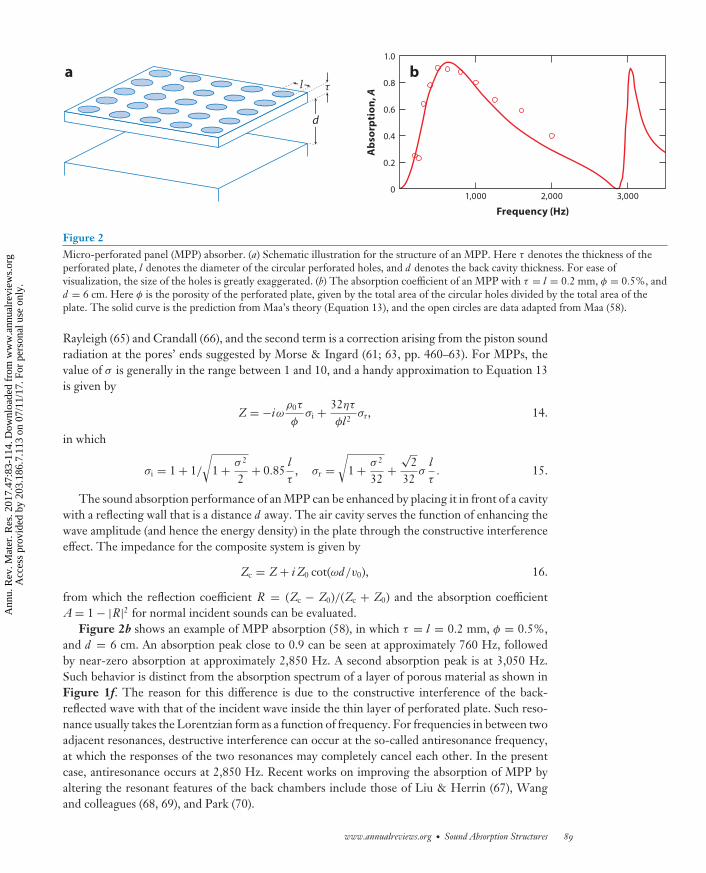
The perforated panel can be treated as a special version of porous material, comprising a thin, rigid(usually metallic) plate with straight holes, as illustrated in Figure 2a. In practice, such structureshave been used as facings for porous materials to improve low-frequency absorption (59–62; 63,pp. 460–63). In the 1960s and 1970s, Maa (58, 64) realized that if the cross-sectional scale of theperforated pores is in the submillimeter range—in contrast to conventional ones, which are in themillimeter range—then such MPPs can exhibit large absorption in the low-frequency regime.
As perforated panels have a relatively simple geometry, an accurate theoretical model is avail-able. For a rigid plate of thickness τ , pore diameter l , and overall porosity φ, the acoustic effectof the perforated plate can be characterized by its impedance, defined as the ratio between thepressure drop across its two surfaces, p , and the surface-averaged air velocity through the holes,v. According to Maa (58), the impedance is given by
Z ≡ pv
= −iωρ0τ
φ
[1 − 2
σ√
iJ1(σ
√i )
J0(σ√
i )
]−1
− i0.85ωρ0lφ
, 13.
with the dimensionless σ = l√
ωρ0/(4η), where J0(1) denotes the Bessel function of zeroth (first)order. Here the first term is from air’s viscous motions in straight pores, first obtained by Lord
88 Yang · Sheng
Ann
u. R
ev. M
ater
. Res
. 201
7.47
:83-
114.
Dow
nloa
ded
from
ww
w.a
nnua
lrev
iew
s.or
g A
cces
s pr
ovid
ed b
y 20
3.18
6.7.
113
on 0
7/11
/17.
For
per
sona
l use
onl
y.
MR47CH05-Sheng ARI 7 June 2017 8:25
a
d
τlb
1,000 2,000 3,0000
0.2
0.4
0.6
0.8
1.0
Abs
orpt
ion,
A
Frequency (Hz)
Figure 2Micro-perforated panel (MPP) absorber. (a) Schematic illustration for the structure of an MPP. Here τ denotes the thickness of theperforated plate, l denotes the diameter of the circular perforated holes, and d denotes the back cavity thickness. For ease ofvisualization, the size of the holes is greatly exaggerated. (b) The absorption coefficient of an MPP with τ = l = 0.2 mm, φ = 0.5%, andd = 6 cm. Here φ is the porosity of the perforated plate, given by the total area of the circular holes divided by the total area of theplate. The solid curve is the prediction from Maa’s theory (Equation 13), and the open circles are data adapted from Maa (58).
Rayleigh (65) and Crandall (66), and the second term is a correction arising from the piston soundradiation at the pores’ ends suggested by Morse & Ingard (61; 63, pp. 460–63). For MPPs, thevalue of σ is generally in the range between 1 and 10, and a handy approximation to Equation 13is given by
Z = −iωρ0τ
φσi + 32ητ
φl2σr, 14.
in which
σi = 1 + 1/
√1 + σ 2
2+ 0.85
lτ
, σr =√
1 + σ 2
32+
√2
32σ
lτ
. 15.
The sound absorption performance of an MPP can be enhanced by placing it in front of a cavitywith a reflecting wall that is a distance d away. The air cavity serves the function of enhancing thewave amplitude (and hence the energy density) in the plate through the constructive interferenceeffect. The impedance for the composite system is given by
Zc = Z + i Z0 cot(ωd/v0), 16.
from which the reflection coefficient R = (Zc − Z0)/(Zc + Z0) and the absorption coefficientA = 1 − |R|2 for normal incident sounds can be evaluated.
Figure 2b shows an example of MPP absorption (58), in which τ = l = 0.2 mm, φ = 0.5%,and d = 6 cm. An absorption peak close to 0.9 can be seen at approximately 760 Hz, followedby near-zero absorption at approximately 2,850 Hz. A second absorption peak is at 3,050 Hz.Such behavior is distinct from the absorption spectrum of a layer of porous material as shown inFigure 1f. The reason for this difference is due to the constructive interference of the back-reflected wave with that of the incident wave inside the thin layer of perforated plate. Such reso-nance usually takes the Lorentzian form as a function of frequency. For frequencies in between twoadjacent resonances, destructive interference can occur at the so-called antiresonance frequency,at which the responses of the two resonances may completely cancel each other. In the presentcase, antiresonance occurs at 2,850 Hz. Recent works on improving the absorption of MPP byaltering the resonant features of the back chambers include those of Liu & Herrin (67), Wangand colleagues (68, 69), and Park (70).
www.annualreviews.org • Sound Absorption Structures 89
Ann
u. R
ev. M
ater
. Res
. 201
7.47
:83-
114.
Dow
nloa
ded
from
ww
w.a
nnua
lrev
iew
s.or
g A
cces
s pr
ovid
ed b
y 20
3.18
6.7.
113
on 0
7/11
/17.
For
per
sona
l use
onl
y.

MR47CH05-Sheng ARI 7 June 2017 8:25
3. METAMATERIAL ABSORBERS
Metamaterials are characterized by local resonators that are subwavelength in scale. Because reso-nances would enhance the energy density, metamaterials are potential absorbers, even though highabsorption would necessarily occur only in the vicinity of resonant frequencies. Hence metamate-rial absorbers are inherently narrow band in nature. In this section, we describe the metamaterialsound absorbers from a perspective of vibrational symmetry and geometric constraint.
3.1. Elastic Membrane as Sound Absorber
A decorated membrane (DM) comprises a pretensioned elastic membrane with a rigid weight(s)adhered on its surface. Due to the small restoring force of DM, resonances can easily be in the audi-ble range. As first reported by Yang et al. (71), a circular DM that is 20 mm in diameter and 0.28 mmin thickness has its lowest resonance at 146 Hz. The relevant airborne sound at this frequency hasa wavelength of 2.35 m; i.e., the size of a DM can be in the extreme subwavelength regime.
Vibration of a DM can be characterized by its normal displacement velocity, v(x), where xdenotes the lateral coordinates. By denoting the surface-averaged displacement velocity by v, thecomponent that is left over, δv(x) = v(x) − v, denoted the delta component, can couple onlyto the evanescent waves. This is because from the dispersion relation of airborne sound we have|k‖|2 + k2
⊥ = (2π/λ)2, where the subscripts ‖ and ⊥ denote the vector components parallel andperpendicular to the membrane surface, respectively. The continuity of normal displacementmeans that the air displacement next to the membrane’s surface is the same as that of themembrane. Owing to the subwavelength lateral scale of the membrane, the magnitude of k‖ inthe Fourier transform of δv(x) must be larger than 2π/λ, hence k2
⊥ < 0; i.e., the wave must beevanescent along the perpendicular direction. In contrast, the k‖ components for v peak at k‖ = 0,and hence v couples to the propagating modes. It follows that in the far field, the piston-likemotion represented by v is sufficient to characterize the scattering characteristics of DM, and aneffective impedance can be defined by Z ≡ p/v, with v being the DM’s displacement velocitywhen a pressure difference, p , is applied across its two surfaces.
The effective impedance is dispersive, as it is related to the resonances of DM (72) such thatZ = i/(ωg), where g is the surface-averaged Green function, defined as the ratio between theaveraged displacement, u, and p :
g = u p
=∑
n
|un|2ρn(�2
n − ω2 − 2iωβn). 17.
Here ρn ≡ ∫ρ|un|2dV is the displacement eigenfunction-weighted mass density for DM’s nth
mode un with a resonance frequency �n, and ρ is the local density. If we denote the viscositycoefficient of the system to be η, then the dissipation coefficient βn in Equation 17 is defined as
βn =∫
η|∇un|2dV /(2ρn). 18.
For a plane wave incident on a DM, the normalized transmission amplitude T and reflectionamplitude R can be evaluated from the impedances as
R = Z2Z0 + Z
, T = 2Z0
2Z0 + Z. 19.
90 Yang · Sheng
Ann
u. R
ev. M
ater
. Res
. 201
7.47
:83-
114.
Dow
nloa
ded
from
ww
w.a
nnua
lrev
iew
s.or
g A
cces
s pr
ovid
ed b
y 20
3.18
6.7.
113
on 0
7/11
/17.
For
per
sona
l use
onl
y.

MR47CH05-Sheng ARI 7 June 2017 8:25
In arriving at the above expressions, we note that the geometric constraint as detailed below isalready incorporated. In terms of the impedances, the sound dissipation coefficient A = 1−|R|2 −|T |2 is given by
A = 4Z0Re(Z)[2Z0 + Re(Z)]2 + Im(Z)2
. 20.
The maximum absorption, Amax = 0.5, occurs when Re(Z) = 2Z0 and Im(Z) = 0, known as thecritical coupling condition (73, 74). When that happens, R = T = 0.5. According to Equation 17,this condition is possible only at DM’s resonance with just the right amount of dissipation.
Mei et al. (25) reported high sound absorption by a thin DM; Yang et al. (24) and Chenet al. (75, 76) investigated its upper bound. As shown in Figure 3a, a rectangular membrane wasstretched and fixed on its four edges. Two semicircular metallic platelets were attached, facing
a b c dΩ1 = 383 Hz Ω 2 = 767 Hz Ω3 = 947 Hz
RealImaginary
400
600
800
1,000
0 0.5 1.0
e
Freq
uenc
y (H
z)
R + T0 0.5
f
Transmission,|T |
Reflection,|R |
Absorption,A
0 0.5
g
0 0.5
h
Absorption Impedance
100 300 500 700
0.4
0.5
2
4
i
j
0 1 2 3 4 5 60.5
0.75
1.0
Am
ax
Amax
Ap
eak Z/Z
0
Relative amplitude ratio, α
Mass (mg)
1.0 1.0
Figure 3Absorption by a decorated membrane (DM) resonator. (a) Schematic illustration of a DM comprising two semicircular platelets ( pink)adhered onto a rectangular membrane ( yellow) and facing each other. The elastic membrane is fixed on the supporting frame (blue).(b–d ) The three resonant eigenmodes of the DM shown in panel a that are responsible for the three absorption peaks. Light indicateslarge normal displacement, and dark indicates small displacement. In panel b, the large displacements are localized on the platelets,which execute a flapping motion, with the diameter of the semicircular platelet acting as the center of rotation, simultaneous with thelarge normal translational motion. In panel c, the membrane between the two platelets displays a large displacement. The two plateletsflap, but without the large translational displacement. In panel d, all the displacement is localized on the central part of the membrane.(e–h) The measured transmission, reflection, and absorption coefficients when waves are incident from one side. An image of the sampleis shown in the inset, where the red square indicates the cross section of the impedance tube. At 383 Hz, maximum absorption of 50%occurs, and R = T = 0.5, as predicted by Equation 19, a result of the continuity of displacement velocity on two sides of the thinmembrane. (i ) The first peak absorption coefficient (red curve) of the DM plotted as a function of the mass of the platelets. Theassociated surface impedance is denoted by the blue curve. Here the open circles are measured data, adapted from Yang et al. (24), andthe solid curve represents the theory. At a maximum absorption of 50%, the associated impedance is exactly twice that of air.( j ) Absorption of the DM when waves are incident from two sides, plotted as a function of the relative amplitude ratio α between thetwo incident waves. Maximum total absorption occurs at α = 1, i.e., when the coherent perfect absorption (CPA) condition is satisfied.Here the open circles are numerical simulations, and the solid line the theory prediction. Adapted from Reference 24.
www.annualreviews.org • Sound Absorption Structures 91
Ann
u. R
ev. M
ater
. Res
. 201
7.47
:83-
114.
Dow
nloa
ded
from
ww
w.a
nnua
lrev
iew
s.or
g A
cces
s pr
ovid
ed b
y 20
3.18
6.7.
113
on 0
7/11
/17.
For
per
sona
l use
onl
y.
MR47CH05-Sheng ARI 7 June 2017 8:25
+
+
–
+
b Dipole
c Monopole
Pressure PressureVelocity Velocity
Pressure PressureVelocity Velocity
aDM unit
z = 0
pi_ exp(ik0z)
po_ exp(–ik0z)
pi+ exp(–ik0z)
po+ exp(ik0z)
Platelet
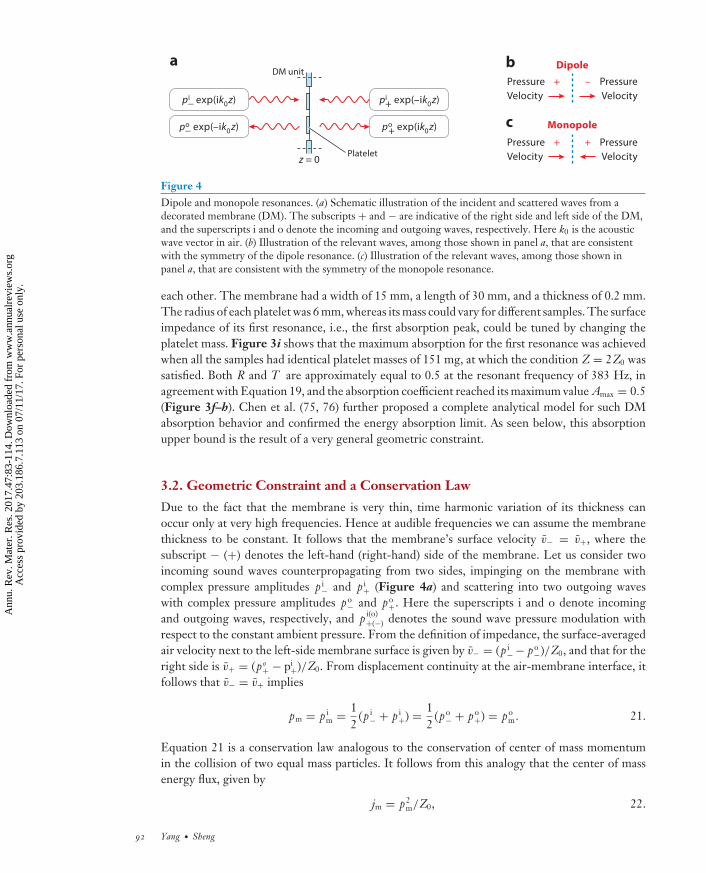
Figure 4Dipole and monopole resonances. (a) Schematic illustration of the incident and scattered waves from adecorated membrane (DM). The subscripts + and − are indicative of the right side and left side of the DM,and the superscripts i and o denote the incoming and outgoing waves, respectively. Here k0 is the acousticwave vector in air. (b) Illustration of the relevant waves, among those shown in panel a, that are consistentwith the symmetry of the dipole resonance. (c) Illustration of the relevant waves, among those shown inpanel a, that are consistent with the symmetry of the monopole resonance.
each other. The membrane had a width of 15 mm, a length of 30 mm, and a thickness of 0.2 mm.The radius of each platelet was 6 mm, whereas its mass could vary for different samples. The surfaceimpedance of its first resonance, i.e., the first absorption peak, could be tuned by changing theplatelet mass. Figure 3i shows that the maximum absorption for the first resonance was achievedwhen all the samples had identical platelet masses of 151 mg, at which the condition Z = 2Z0 wassatisfied. Both R and T are approximately equal to 0.5 at the resonant frequency of 383 Hz, inagreement with Equation 19, and the absorption coefficient reached its maximum value Amax = 0.5(Figure 3f–h). Chen et al. (75, 76) further proposed a complete analytical model for such DMabsorption behavior and confirmed the energy absorption limit. As seen below, this absorptionupper bound is the result of a very general geometric constraint.
3.2. Geometric Constraint and a Conservation Law
Due to the fact that the membrane is very thin, time harmonic variation of its thickness canoccur only at very high frequencies. Hence at audible frequencies we can assume the membranethickness to be constant. It follows that the membrane’s surface velocity v− = v+, where thesubscript − (+) denotes the left-hand (right-hand) side of the membrane. Let us consider twoincoming sound waves counterpropagating from two sides, impinging on the membrane withcomplex pressure amplitudes p i
− and p i+ (Figure 4a) and scattering into two outgoing waves
with complex pressure amplitudes po− and po
+. Here the superscripts i and o denote incomingand outgoing waves, respectively, and p i(o)
+(−) denotes the sound wave pressure modulation withrespect to the constant ambient pressure. From the definition of impedance, the surface-averagedair velocity next to the left-side membrane surface is given by v− = (p i
− − po−)/Z0, and that for the
right side is v+ = (po+ − pi
+)/Z0. From displacement continuity at the air-membrane interface, itfollows that v− = v+ implies
pm = p im = 1
2(p i
− + p i+) = 1
2(po
− + po+) = po
m. 21.
Equation 21 is a conservation law analogous to the conservation of center of mass momentumin the collision of two equal mass particles. It follows from this analogy that the center of massenergy flux, given by
jm = p2m/Z0, 22.
92 Yang · Sheng
Ann
u. R
ev. M
ater
. Res
. 201
7.47
:83-
114.
Dow
nloa
ded
from
ww
w.a
nnua
lrev
iew
s.or
g A
cces
s pr
ovid
ed b
y 20
3.18
6.7.
113
on 0
7/11
/17.
For
per
sona
l use
onl
y.

MR47CH05-Sheng ARI 7 June 2017 8:25
is also conserved and is therefore not available to be dissipated. In this analogy, impedance playsthe role of particle mass.
3.3. Dipole and Monopole Resonances
Resonances can in general be categorized either as dipole in character, in which the rele-vant motions are antisymmetric under the mirror reflection on its central plane (as shown inFigure 4b), or as monopole in character, in which the motions are symmetric under mirror reflec-tion (Figure 4c). Such division is useful because the dipolar motions of a resonator are decoupledfrom the monopole component, and hence their energies can be independently accounted for(24).
A resonance with a particular symmetry can be excited only if the excitation waves have the samesymmetry component. In this respect, pm as defined by Equation 21 is monopole in character,and to complete the picture we define
pd = 12
(p i+ − p i
−) 23.
as the dipolar component of the incident waves. By using the monopole and dipole division, onecan immediately deduce that the energy available for dissipation is given by
12Z0
[(p i
+)2 + (p i−)2 − 2p2
m
] = 14Z0
(p i+ − p i
−)2 = p2d/Z0 = jd. 24.
Hence the absorption coefficient for the DM absorber is given by A = jd/( jm + jd). For wavesincident from one side only, p i
+ = 0 so that jm = jd, and the absorption upper bound is 50%.In contrast to the DM, in which only dipole resonances occur at audible frequencies, resonators
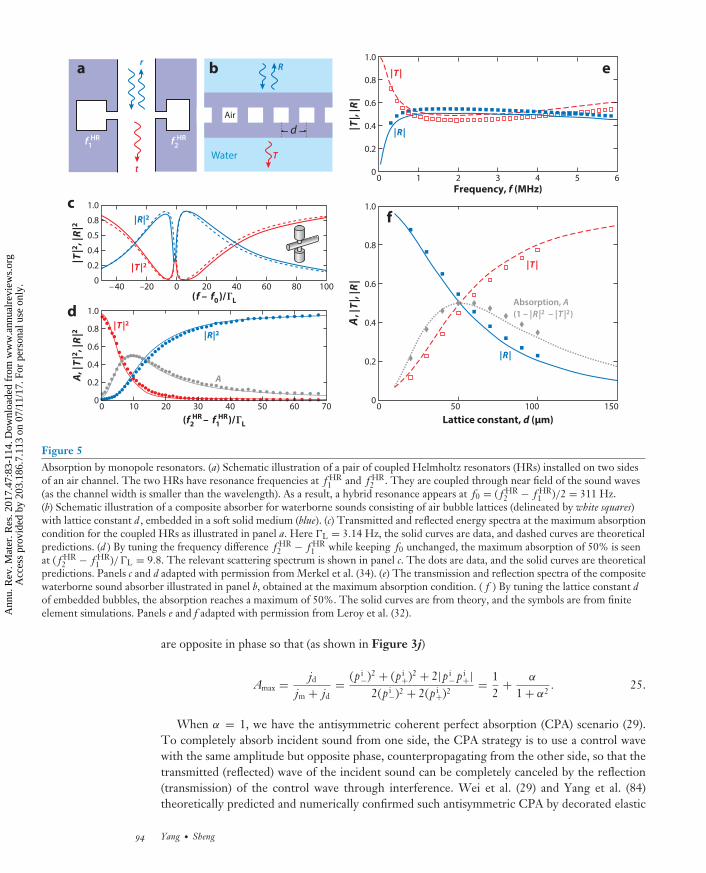
like Helmholtz resonators (HRs) on a sidewall of a ventilated channel (29, 34), a pair of coupledDMs (33), or air bubbles in rubber (32, 77–79) can exhibit monopolar resonances. If dipole reso-nances cannot be excited at the relevant frequency regime, then jd is the conserved component,and the energy available for absorption is the monopolar component jm. A similar 50% absorptionupper bound applies in the one-side incident scenario. Merkel et al. (34) experimentally demon-strated this maximum absorption by two sidewall HRs mounted opposite to each other on two sidesof a ventilated tube (as shown in Figure 5a), in conjunction with an analysis of critical couplingin the complex frequency plane. Coupled through near fields, these two HRs present a hybridresonance at f0 = ( f HR
2 − f HR1 )/2, as shown in Figure 5c, in which f HR
1 and f HR2 are the two
resonance frequencies of the HRs. By tuning the frequency difference f HR2 − f HR
1 while keepingf0 unchanged, the absorption has a maximum of 50%, as shown in Figure 5d. In the investi-gation of the absorption of waterborne sounds by air bubbles in soft solid medium (as shown inFigure 5b), Leroy et al. (32) demonstrated that the monopolar motions of bubbles absorb soundwith an upper limit of 50% (as shown in Figure 5e,f ).
An absorption upper bound also exists in nonlinear acoustic systems, as shown by Achilleoset al. (80) in HRs with very high sound intensities, as well as in electromagnetic wave absorption,e.g., laser absorption in thin film structures (81–83).
3.4. Coherent Perfect Absorption
By eliminating the monopole component in incoming waves, i.e., by introducing counterprop-agating waves on both sides such that p i
− = −p i+ so pm = 0, absorption can exceed 50%. In
general, for a given ratio α = |p i+|/|p i
−|, the maximum absorption always occurs when p i− and p i
+
www.annualreviews.org • Sound Absorption Structures 93
Ann
u. R
ev. M
ater
. Res
. 201
7.47
:83-
114.
Dow
nloa
ded
from
ww
w.a
nnua
lrev
iew
s.or
g A
cces
s pr
ovid
ed b
y 20
3.18
6.7.
113
on 0
7/11
/17.
For
per
sona
l use
onl
y.
MR47CH05-Sheng ARI 7 June 2017 8:25
c
d
r R
Tt
a
Water
Air
f2HRf1
HR
b
0 1 2 3 4 5 60
0.2
0.4
0.6
0.8
1.0
Frequency, f (MHz)
e
f
|T|,
|R|
0 10 20 30 40 50 60 70
–40 –20 0 20 40 60 80 1000
0.2
0.4
0.5
0.8
1.0
(f – f0)/ΓL
A, |
T|,
|R|
0 50 100 1500
0.2
0.4
0.6
0.8
1.0
Lattice constant, d (μm)
Absorption, A(1 – |R |2 – |T |2)
|T |
|T |2
|T |2
|R|2
|R|2
A
|T |
|R|
|R|
d
|T|2 , |
R|2
0
0.2
0.4
0.6
0.8
1.0
A, |T
|2 , |R
|2
(f2HR f1
HR – )/ΓL
Figure 5Absorption by monopole resonators. (a) Schematic illustration of a pair of coupled Helmholtz resonators (HRs) installed on two sidesof an air channel. The two HRs have resonance frequencies at f HR
1 and f HR2 . They are coupled through near field of the sound waves
(as the channel width is smaller than the wavelength). As a result, a hybrid resonance appears at f0 = ( f HR2 − f HR
1 )/2 = 311 Hz.(b) Schematic illustration of a composite absorber for waterborne sounds consisting of air bubble lattices (delineated by white squares)with lattice constant d , embedded in a soft solid medium (blue). (c) Transmitted and reflected energy spectra at the maximum absorptioncondition for the coupled HRs as illustrated in panel a. Here �L = 3.14 Hz, the solid curves are data, and dashed curves are theoreticalpredictions. (d ) By tuning the frequency difference f HR
2 − f HR1 while keeping f0 unchanged, the maximum absorption of 50% is seen
at ( f HR2 − f HR
1 )/�L = 9.8. The relevant scattering spectrum is shown in panel c. The dots are data, and the solid curves are theoreticalpredictions. Panels c and d adapted with permission from Merkel et al. (34). (e) The transmission and reflection spectra of the compositewaterborne sound absorber illustrated in panel b, obtained at the maximum absorption condition. ( f ) By tuning the lattice constant dof embedded bubbles, the absorption reaches a maximum of 50%. The solid curves are from theory, and the symbols are from finiteelement simulations. Panels e and f adapted with permission from Leroy et al. (32).
are opposite in phase so that (as shown in Figure 3j)
Amax = jdjm + jd
= (p i−)2 + (p i
+)2 + 2|p i− p i
+|2(p i−)2 + 2(p i+)2
= 12
+ α
1 + α2. 25.
When α = 1, we have the antisymmetric coherent perfect absorption (CPA) scenario (29).To completely absorb incident sound from one side, the CPA strategy is to use a control wavewith the same amplitude but opposite phase, counterpropagating from the other side, so that thetransmitted (reflected) wave of the incident sound can be completely canceled by the reflection(transmission) of the control wave through interference. Wei et al. (29) and Yang et al. (84)theoretically predicted and numerically confirmed such antisymmetric CPA by decorated elastic
94 Yang · Sheng
Ann
u. R
ev. M
ater
. Res
. 201
7.47
:83-
114.
Dow
nloa
ded
from
ww
w.a
nnua
lrev
iew
s.or
g A
cces
s pr
ovid
ed b
y 20
3.18
6.7.
113
on 0
7/11
/17.
For
per
sona
l use
onl
y.

MR47CH05-Sheng ARI 7 June 2017 8:25
membranes. Such an antisymmetric CPA effect was recently experimentally realized by Menget al. (38).
To perfectly absorb sound incident from one side with a monopole resonator, symmetric CPArequires a control wave incoming from the opposite direction with the same phase. SymmetricCPA by HRs was numerically simulated by Wei et al. (29) and was experimentally realized byMeng et al. (38). Song et al. (30) extended the CPA concept to two dimensions with higher-ordersymmetries such as quadrupole and octupole resonances.
3.5. Sound Absorption by Degenerate Resonators
Instead of introducing control waves, another approach to absorb sound effectively is to create acomposite resonator comprising a pair of dipole and monopole resonators with the same resonantfrequency, i.e., degenerate, and with each satisfying the critical coupling condition.
To characterize the response of such a degenerate pair, we define the dipolar impedanceZd for dipole resonators as Zd = pd/vd = (p+ − p−)/(v+ + v−), which is half of the effectiveimpedance we defined for DM, and the monopolar impedance Zm for monopole resonators asZm = pm/vm = (p+ + p−)/(v+ − v−). The absorption coefficient for one-side incident sound wavesis then given by
A = 2Z0Re(Zm)[Z0 + Re(Zm)]2 + Im(Zm)2
+ 2Z0Re(Zd)[Z0 + Re(Zd)]2 + Im(Zd)2
, 26.
which comprises two terms from the monopolar and dipolar resonances, respectively. Each termreaches a maximum of 50% when the critical coupling condition, Zm = Z0 = Zd, is satisfied.
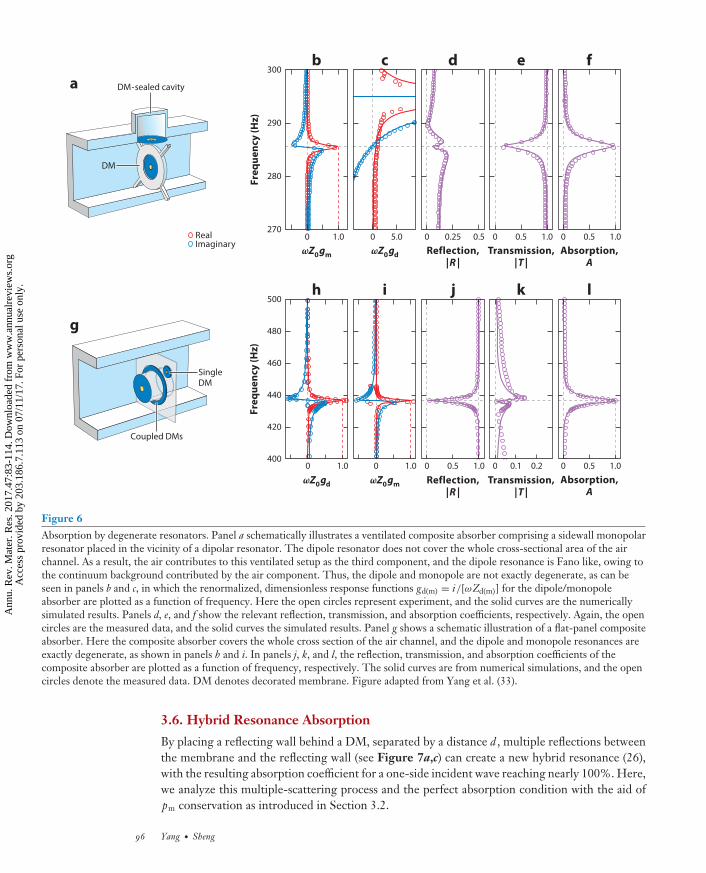
In actual practice, the monopole resonator can be realized in the channel geometry by placinga DM dipole resonator on the channel sidewall backed by a cavity, as shown in Figure 6a. Whenthis DM vibrates in and out from the channel sidewall, it pushes (out) and sucks (in) the air infront of the DM, leading to a monopole-like air movement parallel to the channel wall.
As shown in Figure 6a–f, by using a DM as the dipole and a sidewall cavity sealed by anotherDM as the monopole, a degenerate, perfect absorber was experimentally realized at 285.6 Hzwithin a space that is one order of magnitude smaller than the relevant airborne sound wavelength(33). The relevant physics can be easily described as follows. Total absorption must occur ifboth transmission and reflection are suppressed. Here the reflection is suppressed by impedancematching, and the transmission is suppressed by destructive interference between the two DMs,one on the sidewall acting as the monopole and the other one perpendicular to the sidewall DMacting as the dipole. By synchronizing the pushing of the air in one with the sucking of the airin the other, the air pressure modulation in the far-field transmission direction is suppressed.Thus, total absorption occurs. In this particular case, the dipole DM does not cover the wholecross section of the air channel; i.e., the channel is ventilated. Hence the air constitutes the thirdcomponent of the setup, and the dipole plus air behaves as a Fano resonance. As a result, the dipoleresonance has to be tuned to a frequency slightly higher than that of the monopole so as to maketotal absorption occur. This is seen in Figure 6b,c. In panels d, e, and f of Figure 6, the measuredand simulated R, T , and absorption coefficient are shown, respectively. Another sample, withDM as the dipole resonator and a pair of coupled DMs (sealing a thin cavity in between) as themonopole resonator, has also shown similar absorption behavior in a space that is 20 times smallerthan the airborne wavelength (Figure 6g). In this case, the cross-sectional area of the air channelwas completely covered by the combined setup. Hence the dipole and monopole resonances areexactly degenerate. Panels h–l of Figure 6 show results similar to those of the ventilated case.Piper et al. (85) reported the electromagnetic analog of this degenerate resonator absorber.
www.annualreviews.org • Sound Absorption Structures 95
Ann
u. R
ev. M
ater
. Res
. 201
7.47
:83-
114.
Dow
nloa
ded
from
ww
w.a
nnua
lrev
iew
s.or
g A
cces
s pr
ovid
ed b
y 20
3.18
6.7.
113
on 0
7/11
/17.
For
per
sona
l use
onl
y.
MR47CH05-Sheng ARI 7 June 2017 8:25
0 1.0400
420
440
460
480
500
0 1.0 0 0.5 1.00 0.5 1.0 0 0.1 0.2
ab c d e f
0 1.0270
280
290
300
Freq
uenc
y (H
z)Fr
eque
ncy
(Hz)
ωZ0gm ωZ0gd
0 5.0 0 0.5 1.00 0.25 0.5 0 0.5 1.0
Absorption,A
SingleDM
Coupled DMs
g
DM-sealed cavity
DM
Transmission,|T |
Reflection,|R |
h i j k l
ωZ0gd ωZ0gm Absorption,A
Transmission,|T |
Reflection,|R |
RealImaginary
Figure 6Absorption by degenerate resonators. Panel a schematically illustrates a ventilated composite absorber comprising a sidewall monopolarresonator placed in the vicinity of a dipolar resonator. The dipole resonator does not cover the whole cross-sectional area of the airchannel. As a result, the air contributes to this ventilated setup as the third component, and the dipole resonance is Fano like, owing tothe continuum background contributed by the air component. Thus, the dipole and monopole are not exactly degenerate, as can beseen in panels b and c, in which the renormalized, dimensionless response functions gd(m) = i/[ωZd(m)] for the dipole/monopoleabsorber are plotted as a function of frequency. Here the open circles represent experiment, and the solid curves are the numericallysimulated results. Panels d, e, and f show the relevant reflection, transmission, and absorption coefficients, respectively. Again, the opencircles are the measured data, and the solid curves the simulated results. Panel g shows a schematic illustration of a flat-panel compositeabsorber. Here the composite absorber covers the whole cross section of the air channel, and the dipole and monopole resonances areexactly degenerate, as shown in panels h and i. In panels j, k, and l, the reflection, transmission, and absorption coefficients of thecomposite absorber are plotted as a function of frequency, respectively. The solid curves are from numerical simulations, and the opencircles denote the measured data. DM denotes decorated membrane. Figure adapted from Yang et al. (33).
3.6. Hybrid Resonance Absorption
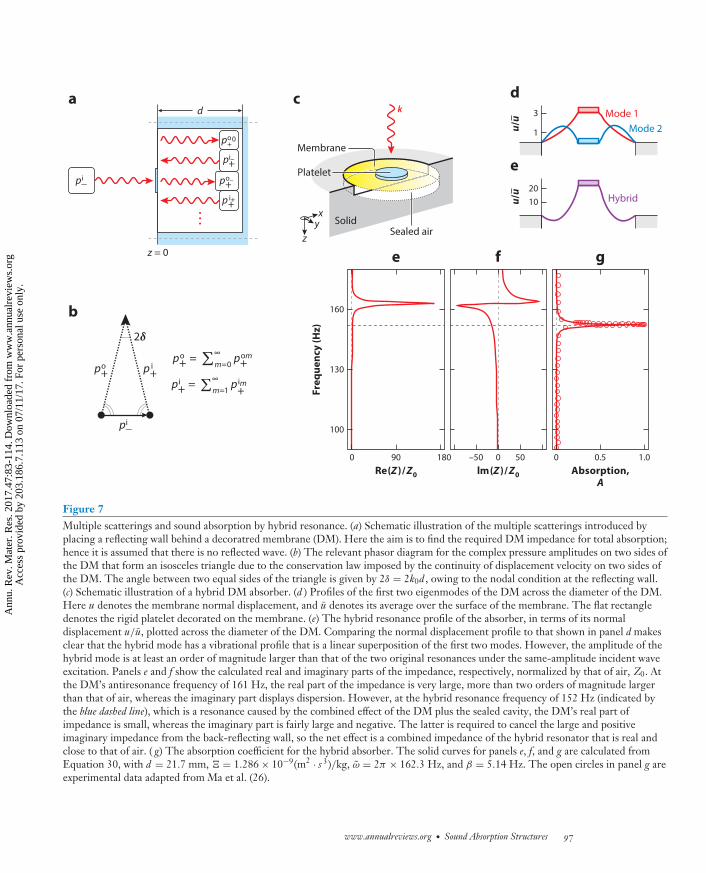
By placing a reflecting wall behind a DM, separated by a distance d , multiple reflections betweenthe membrane and the reflecting wall (see Figure 7a,c) can create a new hybrid resonance (26),with the resulting absorption coefficient for a one-side incident wave reaching nearly 100%. Here,we analyze this multiple-scattering process and the perfect absorption condition with the aid ofpm conservation as introduced in Section 3.2.
96 Yang · Sheng
Ann
u. R
ev. M
ater
. Res
. 201
7.47
:83-
114.
Dow
nloa
ded
from
ww
w.a
nnua
lrev
iew
s.or
g A
cces
s pr
ovid
ed b
y 20
3.18
6.7.
113
on 0
7/11
/17.
For
per
sona
l use
onl
y.
MR47CH05-Sheng ARI 7 June 2017 8:25
c
Membrane
Platelet
SolidSealed air
k
z
xy
Mode 2
Hybrid
d
e
1
3
1020
u/u Mode 1
2δ
pi_
p+ip+
op+
o = Σ∞m=0
p+om
p+i = Σ∞
m=1 p+
im
b
0 90 180
100
130
160
e
Freq
uenc
y (H
z)
–50 0 50
f
0 0.5 1.0
g
Absorption,A
lm(Z )/ Z0Re(Z )/ Z0
ad
z = 0
pi_
po+
0
p+i–
p+i+
p+o–
u/u
Figure 7Multiple scatterings and sound absorption by hybrid resonance. (a) Schematic illustration of the multiple scatterings introduced byplacing a reflecting wall behind a decoratred membrane (DM). Here the aim is to find the required DM impedance for total absorption;hence it is assumed that there is no reflected wave. (b) The relevant phasor diagram for the complex pressure amplitudes on two sides ofthe DM that form an isosceles triangle due to the conservation law imposed by the continuity of displacement velocity on two sides ofthe DM. The angle between two equal sides of the triangle is given by 2δ = 2k0d , owing to the nodal condition at the reflecting wall.(c) Schematic illustration of a hybrid DM absorber. (d ) Profiles of the first two eigenmodes of the DM across the diameter of the DM.Here u denotes the membrane normal displacement, and u denotes its average over the surface of the membrane. The flat rectangledenotes the rigid platelet decorated on the membrane. (e) The hybrid resonance profile of the absorber, in terms of its normaldisplacement u/u, plotted across the diameter of the DM. Comparing the normal displacement profile to that shown in panel d makesclear that the hybrid mode has a vibrational profile that is a linear superposition of the first two modes. However, the amplitude of thehybrid mode is at least an order of magnitude larger than that of the two original resonances under the same-amplitude incident waveexcitation. Panels e and f show the calculated real and imaginary parts of the impedance, respectively, normalized by that of air, Z0. Atthe DM’s antiresonance frequency of 161 Hz, the real part of the impedance is very large, more than two orders of magnitude largerthan that of air, whereas the imaginary part displays dispersion. However, at the hybrid resonance frequency of 152 Hz (indicated bythe blue dashed line), which is a resonance caused by the combined effect of the DM plus the sealed cavity, the DM’s real part ofimpedance is small, whereas the imaginary part is fairly large and negative. The latter is required to cancel the large and positiveimaginary impedance from the back-reflecting wall, so the net effect is a combined impedance of the hybrid resonator that is real andclose to that of air. ( g) The absorption coefficient for the hybrid absorber. The solid curves for panels e, f, and g are calculated fromEquation 30, with d = 21.7 mm, � = 1.286 × 10⁻⁹(m2 · s 3)/kg, ω = 2π × 162.3 Hz, and β = 5.14 Hz. The open circles in panel g areexperimental data adapted from Ma et al. (26).
www.annualreviews.org • Sound Absorption Structures 97
Ann
u. R
ev. M
ater
. Res
. 201
7.47
:83-
114.
Dow
nloa
ded
from
ww
w.a
nnua
lrev
iew
s.or
g A
cces
s pr
ovid
ed b
y 20
3.18
6.7.
113
on 0
7/11
/17.
For
per
sona
l use
onl
y.
MR47CH05-Sheng ARI 7 June 2017 8:25
3.6.1. Multiple scatterings and emergence of a new resonance. As shown in Figure 7a, inthe air layer between the dipole (DM) and the reflecting wall, there can be two sets of multiplyscattered waves: one set going right and the other set going left. These multiply scattered wavescan be superimposed to form two counterpropagating waves: p i
+ and po+. We would like to know
what would be the impedance of the DM if total absorption were to occur. With this knowledge,one can ask whether such impedance condition can be realized in practice.
For total absorption, there should be no reflection on the incident side, so conservation of pm
yields p i− = po
+ − p i+, which may be represented by a phasor diagram (as shown in Figure 7b) that
is an isosceles triangle, with p i+ and po
+ being the two equal sides with an angle 2δ = 2k0d and p i−
being the base. Here the angle 2δ is set by the requirement that there be a node at the reflectingwall, and hence p i
+ and po+ must have a relative phase of 2δ at the backside of the DM. The phasor
diagram makes clear that the net pressure applied to the dipole, p = p i− − (p i
+ + po+), is given
by p = p i−(1 − i cot δ). It follows that the DM impedance for achieving total absorption is
Z = p/v = Z0(1 − i cot δ). 27.
For δ = π/2, we have Z = Z0. Such a condition occurs at the first Fabry-Perot (FP) resonanceof the sealed cell when d = λ/4. This is the drum resonance because the membrane that sealsthe cavity is like the surface cover of a drum. However, for an air layer thinner than a quarter-wavelength, i.e., δ → 0, the required imaginary part of Z approaches −i∞. Such a large imaginarypart of the DM impedance is necessary to cancel the impedance presented by the reflecting backsurface, which is indeed possible for DM at a frequency slightly below the antiresonance frequency,as shown below. Because the impedance of the whole structure is the sum of two serial impedancesof the DM and the sealed cell behind it, the net impedance of the composite structure should beZc = Z0, i.e., impedance matched to that of air so that no reflection would occur. Because wemust have Im(Zc) = 0, the Green function of the composite structure, gc = i/(ωZc), displays animaginary part
Im(gc) = 1ω
Re(Zc)Re(Zc)2 + Im(Zc)2
28.
that exhibits a peak at this total absorption condition. A peak in the imaginary part of the Greenfunction signifies a resonance mode. This is precisely the hybrid resonance, which must occur closeto the antiresonance frequencies because only in the frequency ranges below the antiresonanceswould the imaginary part of the DM impedance approach the required −i∞.
In what follows, we show that to satisfy Equation 27 in subwavelength thin air layers, therequired resonant mode is a new mode of the DM, which resembles the profile at the antiresonancefrequency, but with an enormously large magnitude of the δv(x) component.
3.6.2. Characteristics of the hybrid resonance. To characterize the hybrid resonance, forsimplicity we consider only two relevant eigenmodes, u1 and u2 (see Figure 7d ). By anticipatingthe resonance to be in the vicinity of the antiresonance frequency ω, at which Re(g) = 0, theGreen function in Equation 17 yields g � 2�(iβ − ω), with
� ≡2∑
n=1
|un|2ωρn(ω2
n − ω2)2, and ω ≡ ω − ω. 29.
The relevant impedance is given by
Z = 12ω�
β − i ω
β2 + ω2. 30.
98 Yang · Sheng
Ann
u. R
ev. M
ater
. Res
. 201
7.47
:83-
114.
Dow
nloa
ded
from
ww
w.a
nnua
lrev
iew
s.or
g A
cces
s pr
ovid
ed b
y 20
3.18
6.7.
113
on 0
7/11
/17.
For
per
sona
l use
onl
y.

MR47CH05-Sheng ARI 7 June 2017 8:25
Equation 30 shows that for small ω and β, the imaginary part of the impedance can be large andnegative, up to −1/(4ω�β) at ω = β. Therefore, total absorption for a very thin air layer betweenthe DM and the back-reflecting surface is indeed possible. The hybrid resonance frequency isin between those of u1 and u2. Thus, its eigenfunction profile must necessarily be the linearsuperposition of u1 and u2 because the eigenfunctions of the DM form a complete basis set,and the influence of other eigenfunctions, which are further away in their resonance frequencies,is negligible. In addition, because the hybrid mode is close to the antiresonance frequency, itsprofile must closely resemble that of the antiresonance; i.e., the surface-averaged displacementshould be small, or u1/u2 � 1. This follows from the fact that when the excitation frequency is inbetween the two resonances, both modes are excited, but with the opposite phase, as necessitatedby the nature of the resonance response. In the present case, u1 and u2 do not exactly cancel,because the hybrid resonance frequency is not exactly at antiresonance and because the impedancematching requirement implies u1−u2 = us, the air displacement of the incoming sound. These twoconditions can be satisfied only when u1,2 � us, so that 1 − u2/u1 = us/u1 is a small number; i.e.,compared to its surface-averaged component u, which matches the airborne sound displacement,the hybrid resonance has a much larger delta component δu (see Figure 7d,e).
Experiments reported in Reference 26 corroborated the existence of this hybrid resonance.By placing an aluminum-reflecting wall behind a DM (Figure 7c), an absorption coefficient ofgreater than 0.99 was observed at 152 Hz (Figure 6g). By using d = 21.7 mm [which is inferredfrom the experimental data of 17 mm of SF6 gas, as the effects of the two thin gas layers shouldbe identical if their thicknesses are scaled linearly with their adiabatic index (SF6 has an adiabaticindex of 1.098, compared to 1.4 for air)], � = 1.286 × 10⁻⁹(m2 · s3)/kg, ω = 2π × 162.3 Hz, andβ = 5.14 Hz, the absorption spectrum predicted by Equation 30 was confirmed by experimentaldata, as shown in Figure 7g. In another experiment, reported by Romero-Garcıa et al. (35), aviscoelastic porous plate exhibited high absorption within a broadened frequency range when arigid wall was placed behind it.
A similar mechanism works for the multiple scatterings between a monopole resonator anda reflecting wall. Romero-Garcıa et al. (35) demonstrated the total absorption of HRs on thesidewall of a tube, with the dead end being the reflective wall. They further showed that broadbandabsorption comprising four total absorption peaks can be achieved from four different HRs witha reflective wall placed at the back (36). By using the similar HR structures, Jimenez et al. (86)reported quasi-omnidirectional and total absorption of sound by a composite panel. Merkel et al.(34) showed that two different HRs, aligned in sequence, exhibited total absorption of the soundwaves traveling in a ventilated tube, in which the back HR antiresonance played the role of areflective wall. For waterborne sound, Leroy et al. (32) reported total absorption by monopolarmotions of air bubbles embedded in soft solid, backed by a metallic hard wall. A series of otherworks reported analogous total absorptions for electromagnetic waves in systems consisting ofa thin layer of dielectric medium sandwiched by one metallic reflective surface and a layer ofpatterned metallic film (87–90).
3.7. Sounds Absorption by Coiled-Space Structures and Helmholtz Resonators
As indicated by Equation 27, in addition to being achieved by the hybrid resonance, total absorptioncan be achieved by the FP resonances. Previous works have suggested that, if the FP channel isnarrow enough, high absorption can be achieved through dissipation by air viscosity (1). However,because the FP resonances require one-quarter of a wavelength, at low frequencies that can be asignificant scale for the absorption structure. One efficient way to reduce the scale is to coil theFP channel. Such tortuous structures have been mentioned in the context of porous media with
www.annualreviews.org • Sound Absorption Structures 99
Ann
u. R
ev. M
ater
. Res
. 201
7.47
:83-
114.
Dow
nloa
ded
from
ww
w.a
nnua
lrev
iew
s.or
g A
cces
s pr
ovid
ed b
y 20
3.18
6.7.
113
on 0
7/11
/17.
For
per
sona
l use
onl
y.
MR47CH05-Sheng ARI 7 June 2017 8:25
the tortuosity parameter. Here in the context of metamaterials, the coiled-space concept is usedto slow down waves and to achieve negative refraction (14, 15, 92, 93).
For a particular coiled FP channel with length �, the condition that the air displacement velocityhave a node at its reflecting end means that the internal velocity and pressure fields are given by
v(z) = −i sin[ω(z + �)√
ρ0/B0]/√
ρ0 B0, p(z) = cos[ω(z + �)√
ρ0/B0]. 31.
For a FP channel n with length �n within an array of N FP channels, the surface impedance atthe channel’s opening, z = 0, is given by
Zn = pn(0)At
vn(0)AFP= i
φZ0 cot[ω�n
√ρ0/B0], 32.
where porosity φ = AFP/At, with At being the total area of the array and AFP the total area ofFP channels’ inner cross sections. In the present case, this ratio is exactly the porosity becauseAFP is constant as a function of depth. Here we assume that all the N FP channels have the samecross-sectional area. To account for the small dissipation presented by air viscosity, one can simplyreplace ρ0 with ρ = (1+2iβ/ω)ρ0, in which the coefficient β is an effective parameter characterizingair’s viscosity in FP channels and its value can be obtained by fitting the experimental data (39,39a). By Taylor expansion of the expression for Zn, around the quarter-wavelength resonancefrequency �n = πv0/(2�n) in Equation 32, one obtains
Zn
Z0� iπ
(4�nωφ/N
�2n − ω2 − 2iβω
)−1
. 33.
Because the FP channels are in a planar array, the total impedance of the system is given by Z =1/(∑N
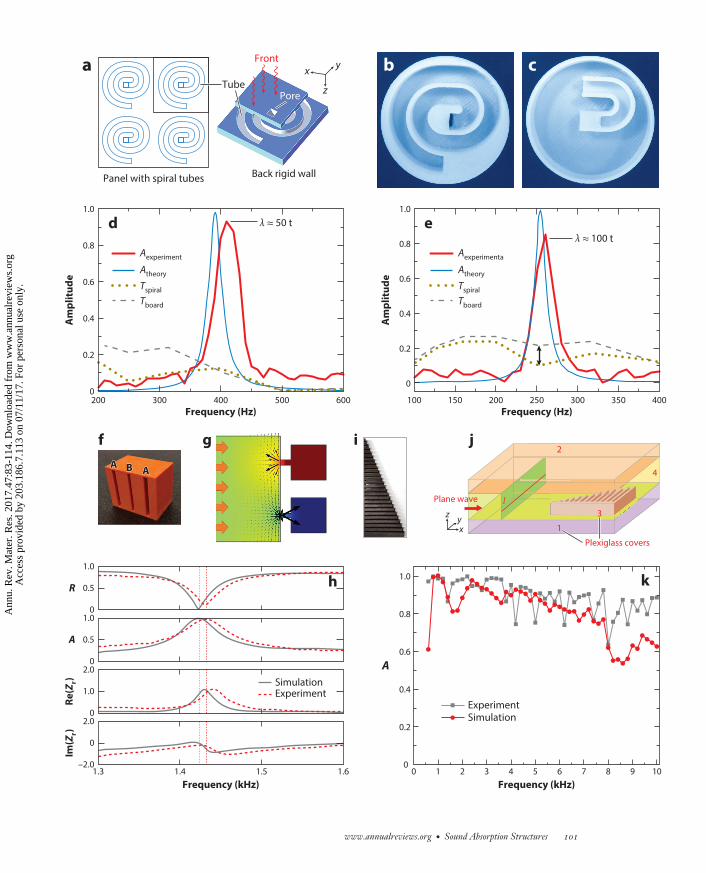
n=1 1/Zn). To have total absorption, this total surface impedance should match that of air; i.e.,Z = Z0. Cai et al. (27) reported such an absorber by coiling a 205-mm FP channel into a space thatis 9.7 mm thick (as shown in Figure 8a,b). Near-total absorption was experimentally observedat approximately 400 Hz (shown in Figure 8d ). Subsequently, Li & Assouar (37) suggested atheoretical model based on perforated panels for similar structures. Jiang et al. (28) proposed abroadband absorber based on FP resonances that is triangular in shape, as shown in Figure 8i, j.
−−−−−−−−−−−−−−−−−−−−−−−−−−−−−−−−−−−−−−−−−−−−−−−−−−−−−−−−−−−−−−−−−−−−−−−−−−−−−−−−−−−−−−−−−−→Figure 8Fabry-Perot (FP) and Helmholtz resonator (HR) absorbers. (a) Schematic drawing for an ultrathin sound absorber based on coiled FPresonant channels. (b) An image of the absorber illustrated in panel a. (c) An image of another similar absorber based on an HR that canexhibit absorption in lower frequencies. Here the horseshoe-shaped neck of the HR has an opening to the backside of the image, facingthe incoming sound wave. (d ) The absorption performance for the sample shown in panel b is plotted as a function of frequency. A highabsorption peak is seen at approximately 400 Hz, at which the wavelength is 50 times the sample thickness. The red curve is themeasured absorption coefficient, and the blue curve is the theory prediction. The dashed and dotted curves are the transmissionamplitudes without and with the coiled-space structure, respectively. (e) The absorption spectrum of the sample illustrated in panel cthat can absorb sound with a wavelength 100 times the sample thickness, at 250 Hz. The red curve is the measured absorptioncoefficient, whereas the blue curve is theory. The dashed and dotted curves are the transmission amplitude without and with the HRstructure, respectively. Panels a–e adapted with permission from Cai et al. (27). ( f ) An image of the coupled HR absorber. ( g) Thesimulated sound field at total absorption frequency. The orange arrows indicate the direction of incoming sounds. (h) The reflectionand absorption coefficients, as well as the relevant real and imaginary parts of the normalized surface impedance Zr = Z/Z0, plotted asfunctions of frequency. The total absorption is seen at the impedance-matched frequency, with Zr = 1. Here the solid curves are fromsimulations, and the red dashed curves are data. Panels f–h adapted with permission from Li et al. (91). (i ) An image of a sample inwhich the FP resonant channels (dark colors) of various lengths are arranged in a triangular pattern. ( j ) A three-dimensional illustrationof the sample and the measurement setup. Here 1, 2, 3, and 4 indicate plexiglass covers on four sides, forming a waveguide with arectangular cross section with width l . (k) With FP channels resonant at different frequencies, high absorption for incoming sound wasrealized in a broadband frequency range. The black symbols are data, and the red symbols denote simulation results. Panels i–k adaptedwith permission from Jiang et al. (28).
100 Yang · Sheng
Ann
u. R
ev. M
ater
. Res
. 201
7.47
:83-
114.
Dow
nloa
ded
from
ww
w.a
nnua
lrev
iew
s.or
g A
cces
s pr
ovid
ed b
y 20
3.18
6.7.
113
on 0
7/11
/17.
For
per
sona
l use
onl
y.
MR47CH05-Sheng ARI 7 June 2017 8:25
Pore
b c
f
d e
R
0
0.5
1.0
A
0
0.5
1.0
Re(Z
r)
0
1.0
2.0
Frequency (kHz)
Im(Z
r)
–2.0
0
2.0
SimulationExperiment
h k
i j
Plexiglass coversPlexiglass covers
Plane wave
a
Panel with spiral tubes
1.0
0.8
0.6
Aexperiment
Atheory
Tspiral
Tboard
Aexperimenta
Atheory
Tspiral
Tboard
Am
plit
ude
Frequency (Hz) Frequency (Hz)
0.4
0.2
0
1.0
0.8
0.6
Am
plit
ude
0.4
0.2
0
200 300 400
λ ≈ 50 tλ ≈ 100 t
500 600 100 150 200 250 300 350 400
AA BB AA
g
1.3 1.4 1.5 1.60
A
0 1 2 3 4 5 6 7 8 9 10Frequency (kHz)
1.0
0.8
0.6
0.4
ExperimentSimulation
0.2
yFrontx
z
Back rigid wall
Tube
4
2
1
l3
x
z y
www.annualreviews.org • Sound Absorption Structures 101
Ann
u. R
ev. M
ater
. Res
. 201
7.47
:83-
114.
Dow
nloa
ded
from
ww
w.a
nnua
lrev
iew
s.or
g A
cces
s pr
ovid
ed b
y 20
3.18
6.7.
113
on 0
7/11
/17.
For
per
sona
l use
onl
y.

MR47CH05-Sheng ARI 7 June 2017 8:25
By employing FP channels with different lengths, high absorption over a broadband frequencyrange was achieved, as shown in Figure 8k.
Another efficient way to reduce resonators’ spatial scale is by utilizing the narrow-neck HR,a resonator that can be understood simply as a cavity covered by an effective mass representingthe neck port and its surrounding panel (1). This effective mass corresponds with that shown inEquation 13 (with me = i Z/ω) for perforated panels. A smaller porosity φ, implying a narrowerneck of the HR, can effect a larger effective mass and therefore requires a smaller cavity for agiven resonance frequency. In the experiment of Cai et al. (27), a 13.3-mm-thick HR showed anear-total absorption peak at 250 Hz (as shown in Figure 8b,e). In the work of Kim et al. (94),based on a theoretical model utilizing mutual radiation impedance for calculating an HR array, ahigh-absorption band comprising multiple peaks of HR absorption was experimentally realized.Li et al. (91) reported that, coupled through local fields, two different HRs can exhibit a hybridresonance that absorbs sound completely (as shown in Figure 8f–h). Wu et al. (95) designed asplit-tube resonator, comprising an HR with a coiled neck, that exhibited total absorption of sound.
4. CAUSALITY CONSTRAINT AND OPTIMALITY
In traditional sound-absorbing materials/structures, the absorption spectrum is usually fixed bythe thickness of the structure and cannot be easily altered. For metamaterial absorbers, how-ever, the absorption spectrum can be tuned through structural design, even though it is usuallynarrow-frequency band in character. A natural question is therefore: What is the best absorptionperformance one can achieve over a designated frequency band, with the minimum structuralthickness? The causal nature of the acoustic response offers a useful perspective with which toanswer this question. Moreover, in conjunction with metamaterial design, the causality constraintcan delineate the optimal sound-absorbing structure for achieving the best possible absorption per-formance within a designated frequency band and with the minimum thickness. A design strategyfor attaining such structures is described below.
4.1. Causal Nature of the Acoustic Response and the Thickness Constraint
Material response functions for electromagnetic and acoustic waves must satisfy the causalityprinciple (96, pp. 265–67). Consider a layer of material backed by a reflecting wall. In responseto an incident sound wave, the reflected sound modulation pressure, pr(t), is a superposition ofthe direct reflection of the incoming sound pressure on the interface at this instant, p i(t), and thereflection in response to the incident wave at an earlier time, p i(t − τ ), with τ > 0. Hence
pr(t) =∫ ∞
0K (τ )p i(t − τ )dτ , 34.
where K (τ ) is the response kernel in the time domain. Through Fourier transform p i/r(ω) =∫∞−∞ p i/r(t)e iωtdt, the reflection coefficient for each frequency may be expressed as
R(ω) ≡ pr(ω)p i(ω)
=∫ ∞
0K (τ )e iωtdτ. 35.
From Equation 35, R(ω) is an analytic function of complex ω in the upper half of the complexω plane. In terms of the wavelength λ = 2πv0/ω, that means R(λ) is without singularities in thelower half-plane of complex λ but may have zeros that represent total absorptions of incomingenergy. Here the imaginary part of λ signifies dissipation.
For electromagnetic waves, the causal nature of the material response function results in aninequality that relates a given absorption performance to the sample thickness (97, 98). Adapted
102 Yang · Sheng
Ann
u. R
ev. M
ater
. Res
. 201
7.47
:83-
114.
Dow
nloa
ded
from
ww
w.a
nnua
lrev
iew
s.or
g A
cces
s pr
ovid
ed b
y 20
3.18
6.7.
113
on 0
7/11
/17.
For
per
sona
l use
onl
y.
MR47CH05-Sheng ARI 7 June 2017 8:25
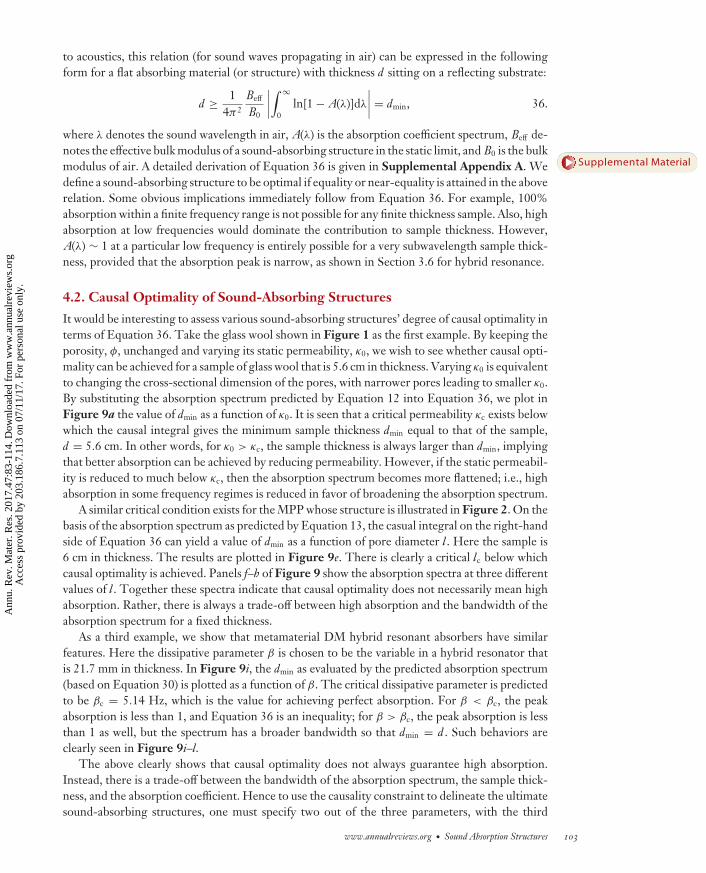
to acoustics, this relation (for sound waves propagating in air) can be expressed in the followingform for a flat absorbing material (or structure) with thickness d sitting on a reflecting substrate:
d ≥ 14π2
Beff
B0
∣∣∣∣∫ ∞
0ln[1 − A(λ)]dλ
∣∣∣∣ = dmin, 36.
where λ denotes the sound wavelength in air, A(λ) is the absorption coefficient spectrum, Beff de-notes the effective bulk modulus of a sound-absorbing structure in the static limit, and B0 is the bulkmodulus of air. A detailed derivation of Equation 36 is given in Supplemental Appendix A. Wedefine a sound-absorbing structure to be optimal if equality or near-equality is attained in the aboverelation. Some obvious implications immediately follow from Equation 36. For example, 100%absorption within a finite frequency range is not possible for any finite thickness sample. Also, highabsorption at low frequencies would dominate the contribution to sample thickness. However,A(λ) ∼ 1 at a particular low frequency is entirely possible for a very subwavelength sample thick-ness, provided that the absorption peak is narrow, as shown in Section 3.6 for hybrid resonance.
4.2. Causal Optimality of Sound-Absorbing Structures
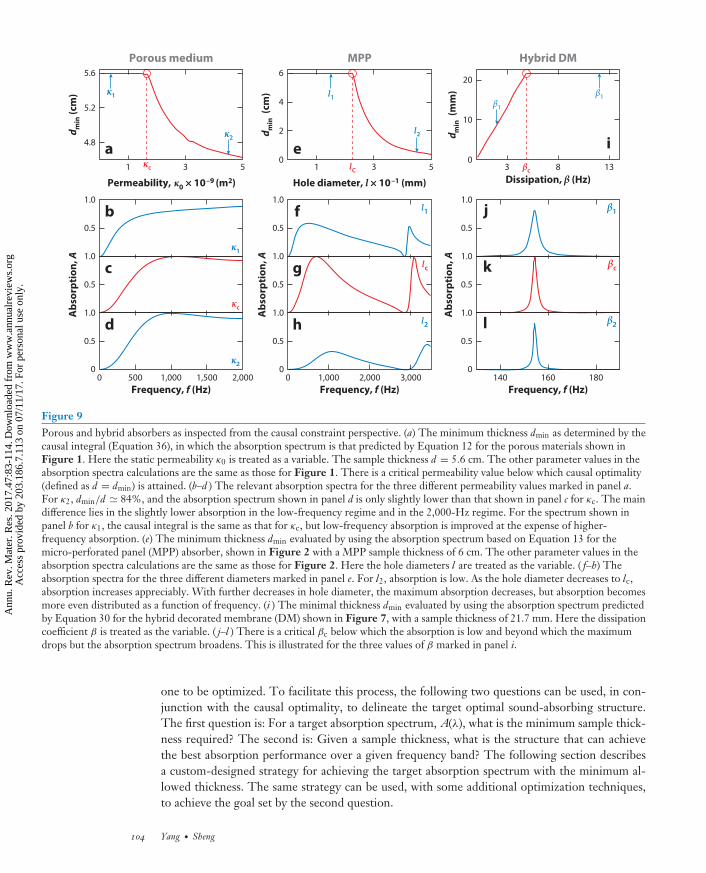
It would be interesting to assess various sound-absorbing structures’ degree of causal optimality interms of Equation 36. Take the glass wool shown in Figure 1 as the first example. By keeping theporosity, φ, unchanged and varying its static permeability, κ0, we wish to see whether causal opti-mality can be achieved for a sample of glass wool that is 5.6 cm in thickness. Varying κ0 is equivalentto changing the cross-sectional dimension of the pores, with narrower pores leading to smaller κ0.By substituting the absorption spectrum predicted by Equation 12 into Equation 36, we plot inFigure 9a the value of dmin as a function of κ0. It is seen that a critical permeability κc exists belowwhich the causal integral gives the minimum sample thickness dmin equal to that of the sample,d = 5.6 cm. In other words, for κ0 > κc, the sample thickness is always larger than dmin, implyingthat better absorption can be achieved by reducing permeability. However, if the static permeabil-ity is reduced to much below κc, then the absorption spectrum becomes more flattened; i.e., highabsorption in some frequency regimes is reduced in favor of broadening the absorption spectrum.
A similar critical condition exists for the MPP whose structure is illustrated in Figure 2. On thebasis of the absorption spectrum as predicted by Equation 13, the casual integral on the right-handside of Equation 36 can yield a value of dmin as a function of pore diameter l . Here the sample is6 cm in thickness. The results are plotted in Figure 9e. There is clearly a critical lc below whichcausal optimality is achieved. Panels f–h of Figure 9 show the absorption spectra at three differentvalues of l . Together these spectra indicate that causal optimality does not necessarily mean highabsorption. Rather, there is always a trade-off between high absorption and the bandwidth of theabsorption spectrum for a fixed thickness.
As a third example, we show that metamaterial DM hybrid resonant absorbers have similarfeatures. Here the dissipative parameter β is chosen to be the variable in a hybrid resonator thatis 21.7 mm in thickness. In Figure 9i, the dmin as evaluated by the predicted absorption spectrum(based on Equation 30) is plotted as a function of β. The critical dissipative parameter is predictedto be βc = 5.14 Hz, which is the value for achieving perfect absorption. For β < βc, the peakabsorption is less than 1, and Equation 36 is an inequality; for β > βc, the peak absorption is lessthan 1 as well, but the spectrum has a broader bandwidth so that dmin = d . Such behaviors areclearly seen in Figure 9i–l.
The above clearly shows that causal optimality does not always guarantee high absorption.Instead, there is a trade-off between the bandwidth of the absorption spectrum, the sample thick-ness, and the absorption coefficient. Hence to use the causality constraint to delineate the ultimatesound-absorbing structures, one must specify two out of the three parameters, with the third
www.annualreviews.org • Sound Absorption Structures 103
Supplemental Material
Ann
u. R
ev. M
ater
. Res
. 201
7.47
:83-
114.
Dow
nloa
ded
from
ww
w.a
nnua
lrev
iew
s.or
g A
cces
s pr
ovid
ed b
y 20
3.18
6.7.
113
on 0
7/11
/17.
For
per
sona
l use
onl
y.
MR47CH05-Sheng ARI 7 June 2017 8:25
4.8
5.2
5.6
1 3 5
d min
(cm
)
a e i
Permeability, κ0 × 10–9 (m2) Hole diameter, l × 10–1 (mm) Dissipation, β (Hz)
d min
(cm
)
d min
(m
m)
Porous medium
b0.5
1.0
c0.5
1.0
Abs
orpt
ion,
A
Abs
orpt
ion,
A
Abs
orpt
ion,
A
d0.5
1.0
0 500 1,000 1,500 2,000Frequency, f (Hz)
0
2
4
6
1 3 5
MPP
f
g
h
0 1,000 2,000 3,000Frequency, f (Hz)
0
10
20
3 8 13
Hybrid DM
j
k
l
140 160 180Frequency, f (Hz)
κ1
κ2l2
κc lC
l1β1
β1
βc
βc
β2
l1
lc
l2
κ1
κc
κ2
β1
0.5
1.0
0.5
1.0
0.5
1.0
0.5
1.0
0.5
1.0
0.5
0 0 0
1.0
Figure 9Porous and hybrid absorbers as inspected from the causal constraint perspective. (a) The minimum thickness dmin as determined by thecausal integral (Equation 36), in which the absorption spectrum is that predicted by Equation 12 for the porous materials shown inFigure 1. Here the static permeability κ0 is treated as a variable. The sample thickness d = 5.6 cm. The other parameter values in theabsorption spectra calculations are the same as those for Figure 1. There is a critical permeability value below which causal optimality(defined as d = dmin) is attained. (b–d ) The relevant absorption spectra for the three different permeability values marked in panel a.For κ2, dmin/d � 84%, and the absorption spectrum shown in panel d is only slightly lower than that shown in panel c for κc. The maindifference lies in the slightly lower absorption in the low-frequency regime and in the 2,000-Hz regime. For the spectrum shown inpanel b for κ1, the causal integral is the same as that for κc, but low-frequency absorption is improved at the expense of higher-frequency absorption. (e) The minimum thickness dmin evaluated by using the absorption spectrum based on Equation 13 for themicro-perforated panel (MPP) absorber, shown in Figure 2 with a MPP sample thickness of 6 cm. The other parameter values in theabsorption spectra calculations are the same as those for Figure 2. Here the hole diameters l are treated as the variable. ( f–h) Theabsorption spectra for the three different diameters marked in panel e. For l2, absorption is low. As the hole diameter decreases to lc,absorption increases appreciably. With further decreases in hole diameter, the maximum absorption decreases, but absorption becomesmore even distributed as a function of frequency. (i ) The minimal thickness dmin evaluated by using the absorption spectrum predictedby Equation 30 for the hybrid decorated membrane (DM) shown in Figure 7, with a sample thickness of 21.7 mm. Here the dissipationcoefficient β is treated as the variable. ( j–l ) There is a critical βc below which the absorption is low and beyond which the maximumdrops but the absorption spectrum broadens. This is illustrated for the three values of β marked in panel i.
one to be optimized. To facilitate this process, the following two questions can be used, in con-junction with the causal optimality, to delineate the target optimal sound-absorbing structure.The first question is: For a target absorption spectrum, A(λ), what is the minimum sample thick-ness required? The second is: Given a sample thickness, what is the structure that can achievethe best absorption performance over a given frequency band? The following section describesa custom-designed strategy for achieving the target absorption spectrum with the minimum al-lowed thickness. The same strategy can be used, with some additional optimization techniques,to achieve the goal set by the second question.
104 Yang · Sheng
Ann
u. R
ev. M
ater
. Res
. 201
7.47
:83-
114.
Dow
nloa
ded
from
ww
w.a
nnua
lrev
iew
s.or
g A
cces
s pr
ovid
ed b
y 20
3.18
6.7.
113
on 0
7/11
/17.
For
per
sona
l use
onl
y.

MR47CH05-Sheng ARI 7 June 2017 8:25
5. DESIGN STRATEGY FOR ATTAINING OPTIMALSOUND-ABSORBING STRUCTURES
Because traditional sound-absorbing materials cannot offer the freedom to tune the absorptionfrequency spectrum, realizing an optimal sound-absorbing structure as defined by the above twoquestions must involve acoustic metamaterials in the design strategy. Below we describe such astrategy (39, 39a) and the example of realizing broadband absorption, with near-perfect absorptionstarting at a low-frequency cutoff, by using a designed acoustic material as backing to a thin layerof a traditional sound-absorbing material, such as an acoustic sponge.
5.1. Theoretical Basis for a Custom-Designed Strategy
Similar to that for DM as shown in Equation 17, the impedance for an acoustic metamaterial withmultiple resonances is given by Z = i/(ωg), or
Z = iρ0dω
(∑n
αn
�2n − ω2 − 2iβω
)−1
. 37.
Here ρ0 is the density of air; ω is the angular frequency; �n denotes the nth resonance frequency;αn is its dimensionless oscillator strength, given by αn = 4dφ�n/(Nπv0) for FP channels so as tobe consistent with Equation 33; and β � ω describes the weak system dissipation for the acousticmetamaterial. For Equation 37 to be accurate, the lateral size of the metamaterial units (if they areassumed to be periodically arranged) must be very subwavelength in scale so that the diffractioneffects can be neglected.
To design an absorber structure for a target absorption spectrum, A(ω), placed against a reflect-ing surface, let us consider an idealized case in which resonances have a continuum distributionwith mode density D(ω) per unit frequency. In that case, Equation 37 can be converted to anintegral,
Z � limβ→0
iρ0dω
(∫ ∞
�1
α(�)D(�)�2 − ω2 − 2iβω
d�
)−1
. 38.
We have set a lower cutoff for the integral, �1, so as to exclude the zero frequency from ourconsideration. The oscillatory nature of the real part of the integrand in Equation 38 implies thatthe integrated result approaches zero very quickly for ω > �1. Hence for the design strategy, onlythe imaginary part is considered. By defining μ(�) = α(�)D(�), then
limβ→0
Im[
μ(�)�2 − ω2 − 2iωβ
]= lim
β→0
2ωβμ(�)4ω2β2 + (ω2 − �2)2
= πμ(�)δ(ω2 − �2), 39.
with δ(ω2 − �2) being the Dirac delta function. Equation 38 can be converted into
Z � ρ0dπω
[∫ ∞
0μ(�)δ(ω2 − �2)d�
]−1
= 2ρ0dπμ(ω)
, 40.
or
μ(ω) = α(ω)D(ω) = 2ρ0dπ Z(ω)
. 41.
Because by definition D(ω) = n/ ω, i.e., the number of modes within a frequency range ω,Equation 41 can be expressed as a differential equation for the mode distribution �(n):
d�
dn= πα(�)Z(�)
2ρ0d, 42.
www.annualreviews.org • Sound Absorption Structures 105
Ann
u. R
ev. M
ater
. Res
. 201
7.47
:83-
114.
Dow
nloa
ded
from
ww
w.a
nnua
lrev
iew
s.or
g A
cces
s pr
ovid
ed b
y 20
3.18
6.7.
113
on 0
7/11
/17.
For
per
sona
l use
onl
y.
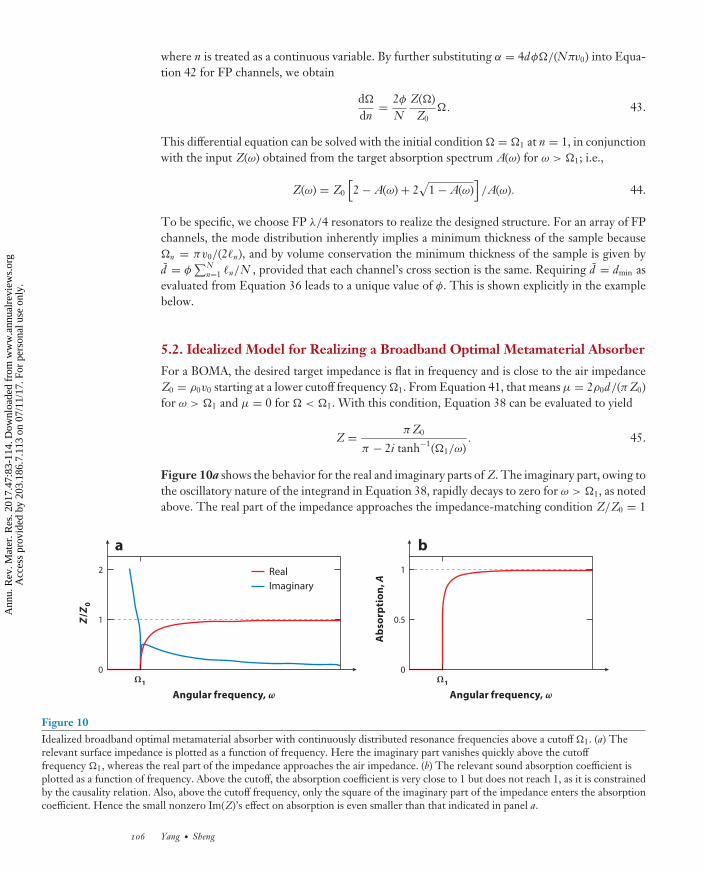
MR47CH05-Sheng ARI 7 June 2017 8:25
where n is treated as a continuous variable. By further substituting α = 4dφ�/(Nπv0) into Equa-tion 42 for FP channels, we obtain
d�
dn= 2φ
NZ(�)
Z0�. 43.
This differential equation can be solved with the initial condition � = �1 at n = 1, in conjunctionwith the input Z(ω) obtained from the target absorption spectrum A(ω) for ω > �1; i.e.,
Z(ω) = Z0
[2 − A(ω) + 2
√1 − A(ω)
]/A(ω). 44.
To be specific, we choose FP λ/4 resonators to realize the designed structure. For an array of FPchannels, the mode distribution inherently implies a minimum thickness of the sample because�n = πv0/(2�n), and by volume conservation the minimum thickness of the sample is given byd = φ
∑Nn=1 �n/N , provided that each channel’s cross section is the same. Requiring d = dmin as
evaluated from Equation 36 leads to a unique value of φ. This is shown explicitly in the examplebelow.
5.2. Idealized Model for Realizing a Broadband Optimal Metamaterial Absorber
For a BOMA, the desired target impedance is flat in frequency and is close to the air impedanceZ0 = ρ0v0 starting at a lower cutoff frequency �1. From Equation 41, that means μ = 2ρ0d/(π Z0)for ω > �1 and μ = 0 for � < �1. With this condition, Equation 38 can be evaluated to yield
Z = π Z0
π − 2i tanh−1(�1/ω). 45.
Figure 10a shows the behavior for the real and imaginary parts of Z. The imaginary part, owing tothe oscillatory nature of the integrand in Equation 38, rapidly decays to zero for ω > �1, as notedabove. The real part of the impedance approaches the impedance-matching condition Z/Z0 = 1
Ω1 Ω1
Z/Z 0
1
2
0
a
Angular frequency, ω Angular frequency, ω
RealImaginary
0.5
1
0
b
Abs
orpt
ion,
A
Figure 10Idealized broadband optimal metamaterial absorber with continuously distributed resonance frequencies above a cutoff �1. (a) Therelevant surface impedance is plotted as a function of frequency. Here the imaginary part vanishes quickly above the cutofffrequency �1, whereas the real part of the impedance approaches the air impedance. (b) The relevant sound absorption coefficient isplotted as a function of frequency. Above the cutoff, the absorption coefficient is very close to 1 but does not reach 1, as it is constrainedby the causality relation. Also, above the cutoff frequency, only the square of the imaginary part of the impedance enters the absorptioncoefficient. Hence the small nonzero Im(Z)’s effect on absorption is even smaller than that indicated in panel a.
106 Yang · Sheng
Ann
u. R
ev. M
ater
. Res
. 201
7.47
:83-
114.
Dow
nloa
ded
from
ww
w.a
nnua
lrev
iew
s.or
g A
cces
s pr
ovid
ed b
y 20
3.18
6.7.
113
on 0
7/11
/17.
For
per
sona
l use
onl
y.
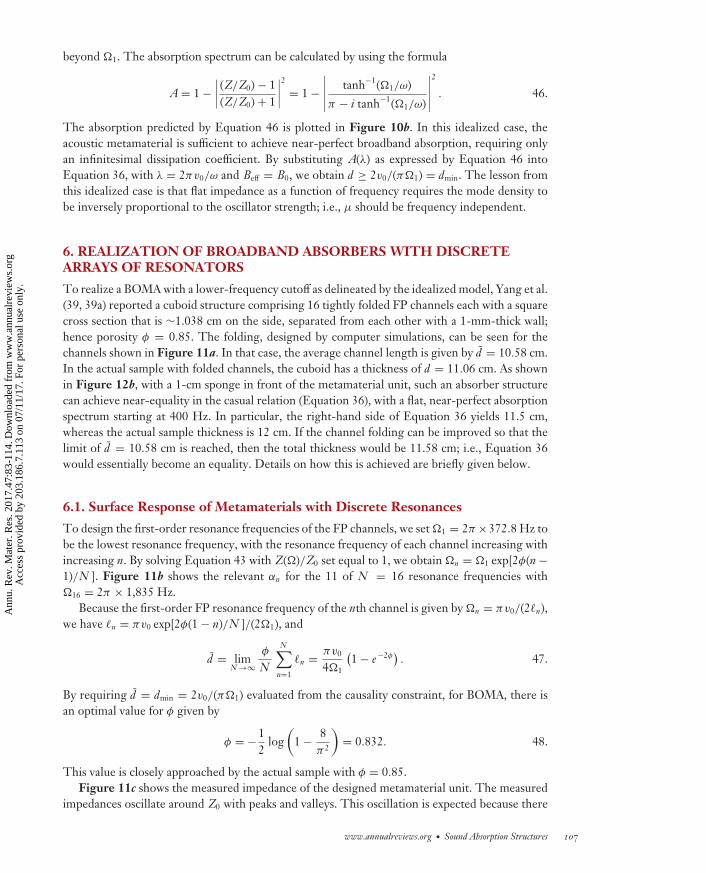
MR47CH05-Sheng ARI 7 June 2017 8:25
beyond �1. The absorption spectrum can be calculated by using the formula
A = 1 −∣∣∣∣ (Z/Z0) − 1(Z/Z0) + 1
∣∣∣∣2
= 1 −∣∣∣∣∣ tanh−1(�1/ω)
π − i tanh−1(�1/ω)
∣∣∣∣∣2
. 46.
The absorption predicted by Equation 46 is plotted in Figure 10b. In this idealized case, theacoustic metamaterial is sufficient to achieve near-perfect broadband absorption, requiring onlyan infinitesimal dissipation coefficient. By substituting A(λ) as expressed by Equation 46 intoEquation 36, with λ = 2πv0/ω and Beff = B0, we obtain d ≥ 2v0/(π�1) = dmin. The lesson fromthis idealized case is that flat impedance as a function of frequency requires the mode density tobe inversely proportional to the oscillator strength; i.e., μ should be frequency independent.
6. REALIZATION OF BROADBAND ABSORBERS WITH DISCRETEARRAYS OF RESONATORS
To realize a BOMA with a lower-frequency cutoff as delineated by the idealized model, Yang et al.(39, 39a) reported a cuboid structure comprising 16 tightly folded FP channels each with a squarecross section that is ∼1.038 cm on the side, separated from each other with a 1-mm-thick wall;hence porosity φ = 0.85. The folding, designed by computer simulations, can be seen for thechannels shown in Figure 11a. In that case, the average channel length is given by d = 10.58 cm.In the actual sample with folded channels, the cuboid has a thickness of d = 11.06 cm. As shownin Figure 12b, with a 1-cm sponge in front of the metamaterial unit, such an absorber structurecan achieve near-equality in the casual relation (Equation 36), with a flat, near-perfect absorptionspectrum starting at 400 Hz. In particular, the right-hand side of Equation 36 yields 11.5 cm,whereas the actual sample thickness is 12 cm. If the channel folding can be improved so that thelimit of d = 10.58 cm is reached, then the total thickness would be 11.58 cm; i.e., Equation 36would essentially become an equality. Details on how this is achieved are briefly given below.
6.1. Surface Response of Metamaterials with Discrete Resonances
To design the first-order resonance frequencies of the FP channels, we set �1 = 2π ×372.8 Hz tobe the lowest resonance frequency, with the resonance frequency of each channel increasing withincreasing n. By solving Equation 43 with Z(�)/Z0 set equal to 1, we obtain �n = �1 exp[2φ(n −1)/N ]. Figure 11b shows the relevant αn for the 11 of N = 16 resonance frequencies with�16 = 2π × 1,835 Hz.
Because the first-order FP resonance frequency of the nth channel is given by �n = πv0/(2�n),we have �n = πv0 exp[2φ(1 − n)/N ]/(2�1), and
d = limN →∞
φ
N
N∑n=1
�n = πv0
4�1
(1 − e−2φ
). 47.
By requiring d = dmin = 2v0/(π�1) evaluated from the causality constraint, for BOMA, there isan optimal value for φ given by
φ = −12
log(
1 − 8π2
)= 0.832. 48.
This value is closely approached by the actual sample with φ = 0.85.Figure 11c shows the measured impedance of the designed metamaterial unit. The measured
impedances oscillate around Z0 with peaks and valleys. This oscillation is expected because there
www.annualreviews.org • Sound Absorption Structures 107
Ann
u. R
ev. M
ater
. Res
. 201
7.47
:83-
114.
Dow
nloa
ded
from
ww
w.a
nnua
lrev
iew
s.or
g A
cces
s pr
ovid
ed b
y 20
3.18
6.7.
113
on 0
7/11
/17.
For
per
sona
l use
onl
y.

MR47CH05-Sheng ARI 7 June 2017 8:25
b
c
0.93Proportion
0
–0.93
L50
L15 16 14 13
6217
5 4 3 8
9101211 d
a
11.06 cm
1 cm
z
y
4.55 cm Oscillator strength,
αn
0.1
0.2
300 600 900 1,200
0
1
2
3
4
5
Frequency, f (Hz)
|Z |/Z0
FP channelsFP channels + sponge
x
Figure 11The structure and features of the broadband optimal metamaterial absorber. (a) Schematic illustration of the metamaterial unitconsisting of 16 Fabry-Perot (FP) channels, arrayed in a 4 × 4 square lattice, with the longer FP channels folded to form a compact,cuboid sample. The channel’s number denotes its order in the sequence of decreasing lengths. Blue channels are coiled by threefoldings, pink channels are coiled by two foldings, and the orange channels are straight. The transparent cyan block represents thesponge to be placed on top of the channels’ surface. An image of the unit is shown in the lower left panel. (b) Eleven of the 16oscillator-strength αn of the FP channels’ λ/4 resonances, plotted as a function of frequency. The frequency positions are designed inaccordance with the solution to Equation 43. (c) The measured (open circles) and calculated (solid lines) surface impedance of themetamaterial unit, Zbare (blue), and that with a 1-cm-thick sponge placed on top (red ). The theory predictions are based onEquation 53, in which the red curve was calculated by replacing ρ0 with ρsponge. (d ) The evanescent wave is illustrated by showingsound pressures at 0.91 mm above the front surface of the metamaterial, obtained by simulation at 610 Hz (the position is indicated bythe red arrow in panel c). This frequency coincides with the antiresonance frequency between the FP resonances of the fifth and sixthchannels (blue and red squares, respectively).
are 16 discrete resonances, and the impedance peaks can be associated with the antiresonancesthat are in between the neighboring resonances. By treating each FP channel to be independentfrom others and in parallel with each other, the impedance of the unit, denoted by Zbare, can bewritten as
Zbare = iω
(1
16
16∑n=1
gn
)−1
, 49.
with gn = tan(ω�√
ρ0/B0)/(ωZ0). Zbare displays oscillations in a similar fashion as the measuredresults. However, if a 1-cm layer of acoustic sponge is placed on top of the unit, then the impedance
108 Yang · Sheng
Ann
u. R
ev. M
ater
. Res
. 201
7.47
:83-
114.
Dow
nloa
ded
from
ww
w.a
nnua
lrev
iew
s.or
g A
cces
s pr
ovid
ed b
y 20
3.18
6.7.
113
on 0
7/11
/17.
For
per
sona
l use
onl
y.
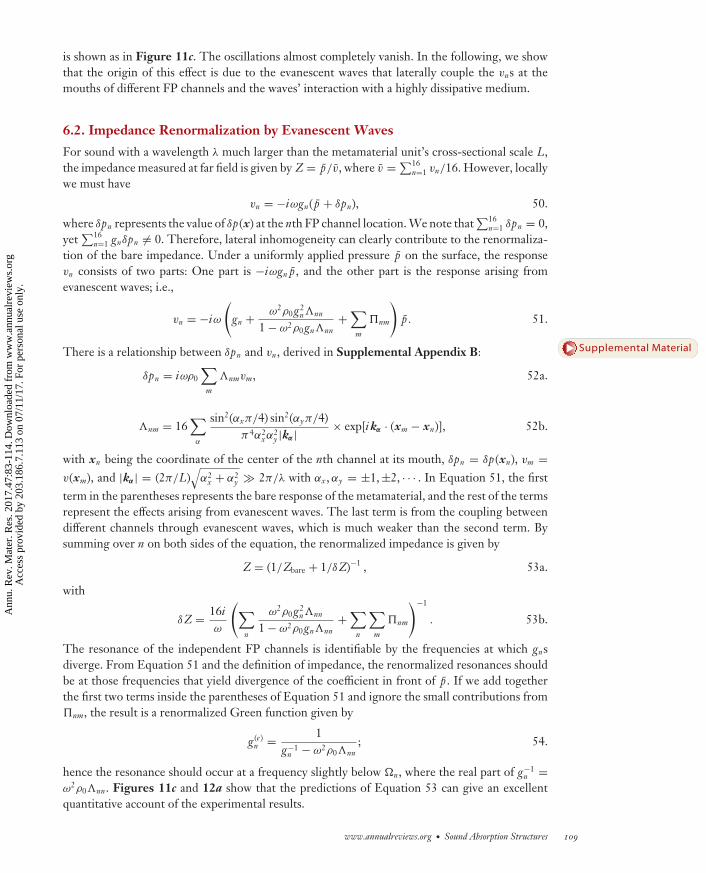
MR47CH05-Sheng ARI 7 June 2017 8:25
is shown as in Figure 11c. The oscillations almost completely vanish. In the following, we showthat the origin of this effect is due to the evanescent waves that laterally couple the vns at themouths of different FP channels and the waves’ interaction with a highly dissipative medium.
6.2. Impedance Renormalization by Evanescent Waves
For sound with a wavelength λ much larger than the metamaterial unit’s cross-sectional scale L,the impedance measured at far field is given by Z = p/v, where v = ∑16
n=1 vn/16. However, locallywe must have
vn = −iωgn( p + δpn), 50.
where δpn represents the value of δp(x) at the nth FP channel location. We note that∑16
n=1 δpn = 0,yet
∑16n=1 gnδpn �= 0. Therefore, lateral inhomogeneity can clearly contribute to the renormaliza-
tion of the bare impedance. Under a uniformly applied pressure p on the surface, the responsevn consists of two parts: One part is −iωgn p , and the other part is the response arising fromevanescent waves; i.e.,
vn = −iω
(gn + ω2ρ0g2
n�nn
1 − ω2ρ0gn�nn+∑
m
�nm
)p . 51.
There is a relationship between δpn and vn, derived in Supplemental Appendix B:
δpn = iωρ0
∑m
�nmvm, 52a.
�nm = 16∑
α
sin2(αxπ/4) sin2(αyπ/4)π4α2
xα2y |kα| × exp[i kα · (xm − xn)], 52b.
with xn being the coordinate of the center of the nth channel at its mouth, δpn = δp(xn), vm =v(xm), and |kα| = (2π/L)
√α2
x + α2y � 2π/λ with αx , αy = ±1, ±2, · · · . In Equation 51, the first
term in the parentheses represents the bare response of the metamaterial, and the rest of the termsrepresent the effects arising from evanescent waves. The last term is from the coupling betweendifferent channels through evanescent waves, which is much weaker than the second term. Bysumming over n on both sides of the equation, the renormalized impedance is given by
Z = (1/Zbare + 1/δZ)−1 , 53a.
with
δZ = 16iω
(∑n
ω2ρ0g2n�nn
1 − ω2ρ0gn�nn+∑
n
∑m
�nm
)−1
. 53b.
The resonance of the independent FP channels is identifiable by the frequencies at which gnsdiverge. From Equation 51 and the definition of impedance, the renormalized resonances shouldbe at those frequencies that yield divergence of the coefficient in front of p . If we add togetherthe first two terms inside the parentheses of Equation 51 and ignore the small contributions from�nm, the result is a renormalized Green function given by
g (e)n = 1
g−1n − ω2ρ0�nn
; 54.
hence the resonance should occur at a frequency slightly below �n, where the real part of g−1n =
ω2ρ0�nn. Figures 11c and 12a show that the predictions of Equation 53 can give an excellentquantitative account of the experimental results.
www.annualreviews.org • Sound Absorption Structures 109
Supplemental Material
Ann
u. R
ev. M
ater
. Res
. 201
7.47
:83-
114.
Dow
nloa
ded
from
ww
w.a
nnua
lrev
iew
s.or
g A
cces
s pr
ovid
ed b
y 20
3.18
6.7.
113
on 0
7/11
/17.
For
per
sona
l use
onl
y.
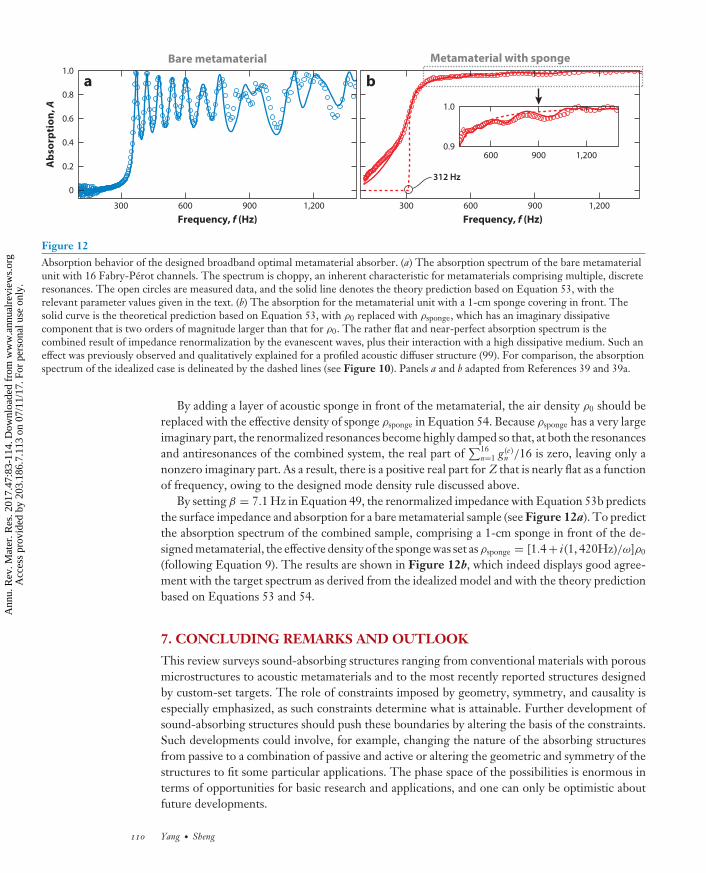
MR47CH05-Sheng ARI 7 June 2017 8:25
a
300 600 900 1,200
0
0.2
0.4
0.6
0.8
1.0
Abs
orpt
ion,
A
Frequency, f (Hz)
b
0.9
1.0
600 900 1,200
312 Hz
300 600 900 1,200
Frequency, f (Hz)
Bare metamaterial Metamaterial with sponge
Figure 12Absorption behavior of the designed broadband optimal metamaterial absorber. (a) The absorption spectrum of the bare metamaterialunit with 16 Fabry-Perot channels. The spectrum is choppy, an inherent characteristic for metamaterials comprising multiple, discreteresonances. The open circles are measured data, and the solid line denotes the theory prediction based on Equation 53, with therelevant parameter values given in the text. (b) The absorption for the metamaterial unit with a 1-cm sponge covering in front. Thesolid curve is the theoretical prediction based on Equation 53, with ρ0 replaced with ρsponge, which has an imaginary dissipativecomponent that is two orders of magnitude larger than that for ρ0. The rather flat and near-perfect absorption spectrum is thecombined result of impedance renormalization by the evanescent waves, plus their interaction with a high dissipative medium. Such aneffect was previously observed and qualitatively explained for a profiled acoustic diffuser structure (99). For comparison, the absorptionspectrum of the idealized case is delineated by the dashed lines (see Figure 10). Panels a and b adapted from References 39 and 39a.
By adding a layer of acoustic sponge in front of the metamaterial, the air density ρ0 should bereplaced with the effective density of sponge ρsponge in Equation 54. Because ρsponge has a very largeimaginary part, the renormalized resonances become highly damped so that, at both the resonancesand antiresonances of the combined system, the real part of
∑16n=1 g (e)
n /16 is zero, leaving only anonzero imaginary part. As a result, there is a positive real part for Z that is nearly flat as a functionof frequency, owing to the designed mode density rule discussed above.
By setting β = 7.1 Hz in Equation 49, the renormalized impedance with Equation 53b predictsthe surface impedance and absorption for a bare metamaterial sample (see Figure 12a). To predictthe absorption spectrum of the combined sample, comprising a 1-cm sponge in front of the de-signed metamaterial, the effective density of the sponge was set as ρsponge = [1.4 + i (1, 420Hz)/ω]ρ0
(following Equation 9). The results are shown in Figure 12b, which indeed displays good agree-ment with the target spectrum as derived from the idealized model and with the theory predictionbased on Equations 53 and 54.
7. CONCLUDING REMARKS AND OUTLOOK
This review surveys sound-absorbing structures ranging from conventional materials with porousmicrostructures to acoustic metamaterials and to the most recently reported structures designedby custom-set targets. The role of constraints imposed by geometry, symmetry, and causality isespecially emphasized, as such constraints determine what is attainable. Further development ofsound-absorbing structures should push these boundaries by altering the basis of the constraints.Such developments could involve, for example, changing the nature of the absorbing structuresfrom passive to a combination of passive and active or altering the geometric and symmetry of thestructures to fit some particular applications. The phase space of the possibilities is enormous interms of opportunities for basic research and applications, and one can only be optimistic aboutfuture developments.
110 Yang · Sheng
Ann
u. R
ev. M
ater
. Res
. 201
7.47
:83-
114.
Dow
nloa
ded
from
ww
w.a
nnua
lrev
iew
s.or
g A
cces
s pr
ovid
ed b
y 20
3.18
6.7.
113
on 0
7/11
/17.
For
per
sona
l use
onl
y.
MR47CH05-Sheng ARI 7 June 2017 8:25
DISCLOSURE STATEMENT
The authors are not aware of any affiliations, memberships, funding, or financial holdings thatmight be perceived as affecting the objectivity of this review.
ACKNOWLEDGMENTS
This study was supported by AoE/P-02/12.
LITERATURE CITED
1. Allard J, Atalla N. 2009. Propagation of Sound in Porous Media: Modelling Sound Absorbing Materials.Chichester, UK: John Wiley & Sons. 2nd ed.
2. Sagartzazu X, Hervella-Nieto L, Pagalday J. 2008. Review in sound absorbing materials. Arch. Comput.Methods Eng. 15:311–42
3. Liu Z, Zhang X, Mao Y, Zhu Y, Yang Z, et al. 2000. Locally resonant sonic materials. Science 289:1734–364. Fang N, Xi D, Xu J, Ambati M, Srituravanich W, et al. 2006. Ultrasonic metamaterials with negative
modulus. Nat. Mater. 5:452–565. Lee SH, Park CM, Seo YM, Wang ZG, Kim CK. 2010. Composite acoustic medium with simultaneously
negative density and modulus. Phys. Rev. Lett. 104:0543016. Lai Y, Wu Y, Sheng P, Zhang ZQ. 2011. Hybrid elastic solids. Nat. Mater. 10:620–247. Wu Y, Lai Y, Zhang ZQ. 2011. Elastic metamaterials with simultaneously negative effective shear
modulus and mass density. Phys. Rev. Lett. 107:1055068. Yang M, Ma G, Yang Z, Sheng P. 2013. Coupled membranes with doubly negative mass density and
bulk modulus. Phys. Rev. Lett. 110:1343019. Brunet T, Merlin A, Mascaro B, Zimny K, Leng J, et al. 2015. Soft 3D acoustic metamaterial with
negative index. Nat. Mater. 14:384–8810. Cummer SA, Christensen J, Alu A. 2016. Controlling sound with acoustic metamaterials. Nat. Rev. Mater.
1:1600111. Ma G, Sheng P. 2016. Acoustic metamaterials: from local resonances to broad horizons. Sci. Adv.
2:e150159512. Xie Y, Wang W, Chen H, Konneker A, Popa BI, Cummer SA. 2014. Wavefront modulation and sub-
wavelength diffractive acoustics with an acoustic metasurface. Nat. Commun. 5:555313. Li Y, Jiang X, Liang B, Cheng J, Zhang L. 2015. Metascreen-based acoustic passive phased array. Phys.
Rev. Appl. 4:02400314. Liang Z, Li J. 2012. Extreme acoustic metamaterial by coiling up space. Phys. Rev. Lett. 108:11430115. Xie Y, Popa BI, Zigoneanu L, Cummer SA. 2013. Measurement of a broadband negative index with
space-coiling acoustic metamaterials. Phys. Rev. Lett. 110:17550116. Kaina N, Lemoult F, Fink M, Lerosey G. 2015. Negative refractive index and acoustic superlens from
multiple scattering in single negative metamaterials. Nature 525:77–8117. Li J, Fok L, Yin X, Bartal G, Zhang X. 2009. Experimental demonstration of an acoustic magnifying
hyperlens. Nat. Mater. 8:931–3418. Zhu J, Christensen J, Jung J, Martin-Moreno L, Yin X, et al. 2011. A holey-structured metamaterial for
acoustic deep-subwavelength imaging. Nat. Phys. 7:52–5519. Christensen J, de Abajo FJG. 2012. Anisotropic metamaterials for full control of acoustic waves. Phys.
Rev. Lett. 108:12430120. Zigoneanu L, Popa BI, Cummer SA. 2014. Three-dimensional broadband omnidirectional acoustic
ground cloak. Nat. Mater. 13:352–5521. Faure C, Richoux O, Felix S, Pagneux V. 2016. Experiments on metasurface carpet cloaking for audible
acoustics. Appl. Phys. Lett. 108:06410322. Liang B, Guo X, Tu J, Zhang D, Cheng J. 2010. An acoustic rectifier. Nat. Mater. 9:989–9223. Fleury R, Sounas DL, Sieck CF, Haberman MR, Alu A. 2014. Sound isolation and giant linear nonre-
ciprocity in a compact acoustic circulator. Science 343:516–19
www.annualreviews.org • Sound Absorption Structures 111
Ann
u. R
ev. M
ater
. Res
. 201
7.47
:83-
114.
Dow
nloa
ded
from
ww
w.a
nnua
lrev
iew
s.or
g A
cces
s pr
ovid
ed b
y 20
3.18
6.7.
113
on 0
7/11
/17.
For
per
sona
l use
onl
y.
MR47CH05-Sheng ARI 7 June 2017 8:25
24. Yang M, Li Y, Meng C, Fu C, Mei J, et al. 2015. Sound absorption by subwavelength membranestructures: a geometric perspective. C. R. Mec. 343:635–44
25. Mei J, Ma G, Yang M, Yang Z, Wen W, Sheng P. 2012. Dark acoustic metamaterials as super absorbersfor low-frequency sound. Nat. Commun. 3:756
26. Ma G, Yang M, Xiao S, Yang Z, Sheng P. 2014. Acoustic metasurface with hybrid resonances. Nat.Mater. 13:873–78
27. Cai X, Guo Q, Hu G, Yang J. 2014. Ultrathin low-frequency sound absorbing panels based on coplanarspiral tubes or coplanar Helmholtz resonators. Appl. Phys. Lett. 105:121901
28. Jiang X, Liang B, Li R-q, Zou X-y, Yin L-l, Cheng J-c. 2014. Ultra-broadband absorption by acousticmetamaterials. Appl. Phys. Lett. 105:243505
29. Wei P, Croenne C, Chu ST, Li J. 2014. Symmetrical and anti-symmetrical coherent perfect absorptionfor acoustic waves. Appl. Phys. Lett. 104:121902
30. Song J, Bai P, Hang Z, Lai Y. 2014. Acoustic coherent perfect absorbers. New J. Phys. 16:03302631. Duan Y, Luo J, Wang G, Hang ZH, Hou B, et al. 2015. Theoretical requirements for broadband perfect
absorption of acoustic waves by ultra-thin elastic meta-films. Sci. Rep. 5:1213932. Leroy V, Strybulevych A, Lanoy M, Lemoult F, Tourin A, Page JH. 2015. Superabsorption of acoustic
waves with bubble metascreens. Phys. Rev. B 91:02030133. Yang M, Meng C, Fu C, Li Y, Yang Z, Sheng P. 2015. Subwavelength total acoustic absorption with
degenerate resonators. Appl. Phys. Lett. 107:10410434. Merkel A, Theocharis G, Richoux O, Romero-Garcıa V, Pagneux V. 2015. Control of acoustic absorption
in one-dimensional scattering by resonant scatterers. Appl. Phys. Lett. 107:24410235. Romero-Garcıa V, Theocharis G, Richoux O, Merkel A, Tournat V, Pagneux V. 2016. Perfect and
broadband acoustic absorption by critically coupled sub-wavelength resonators. Sci. Rep. 6:1951936. Romero-Garcıa V, Theocharis G, Richoux O, Pagneux V. 2016. Use of complex frequency plane to
design broadband and sub-wavelength absorbers. J. Acoust. Soc. Am. 139:3395–40337. Li Y, Assouar BM. 2016. Acoustic metasurface-based perfect absorber with deep subwavelength thickness.
Appl. Phys. Lett. 108:06350238. Meng C, Zhang X, Tang ST, Yang M, Yang Z. 2016. Acoustic coherent perfect absorbers as sensitive
null detectors. arXiv:1610.03749 [physics.class-ph]39. Yang M, Chen S, Fu C, Sheng P. 2016. Optimal sound absorbing structures. arXiv:1609.09561
[physics.class-ph]39a. Yang M, Chen S, Fu C, Sheng P. 2017. Optimal sound absorbing structures. Mater. Horiz.
https://doi.org/10.1039/c7mh00129k40. Allard JF, Depollier C, Guignouard P, Rebillard P. 1991. Effect of a resonance of the frame on the
surface impedance of glass wool of high density and stiffness. J. Acoust. Soc. Am. 89:999–100141. Landau L, Lifshitz E. 2004. Fluid Mechanics, Vol. 6. Oxford, UK: Butterworth-Heinemann. 2nd ed.42. Champoux Y, Stinson MR, Daigle GA. 1991. Air-based system for the measurement of porosity. J. Acoust.
Soc. Am. 89:910–1643. Whitaker S. 1986. Flow in porous media. I. A theoretical derivation of Darcy’s law. Transp. Porous Media
1:3–2544. Carman PC. 1956. Flow of Gases Through Porous Media. London: Butterworth45. Johnson DL, Koplik J, Dashen R. 1987. Theory of dynamic permeability and tortuosity in fluid-saturated
porous media. J. Fluid Mech. 176:379–40246. Kostek S, Schwartz LM, Johnson DL. 1992. Fluid permeability in porous media: comparison of electrical
estimates with hydrodynamical calculations. Phys. Rev. B 45:186–9547. Johnson DL, Koplik J, Schwartz LM. 1986. New pore-size parameter characterizing transport in porous
media. Phys. Rev. Lett. 57:2564–6748. Champoux Y, Allard JF. 1991. Dynamic tortuosity and bulk modulus in air-saturated porous media.
J. Appl. Phys. 70:1975–7949. Von Terzaghi K. 1923. Die Berechnung der Durchlassigkeit des Tones aus dem Verlauf der hydromech-
anischen Spannungserscheinungen. Sitzungsber. Akad. Wiss. Math. Naturwiss. KI Abt. IIa 182:125–3850. Biot MA. 1941. General theory of three-dimensional consolidation. J. Appl. Phys. 12:155–64
112 Yang · Sheng
Ann
u. R
ev. M
ater
. Res
. 201
7.47
:83-
114.
Dow
nloa
ded
from
ww
w.a
nnua
lrev
iew
s.or
g A
cces
s pr
ovid
ed b
y 20
3.18
6.7.
113
on 0
7/11
/17.
For
per
sona
l use
onl
y.
MR47CH05-Sheng ARI 7 June 2017 8:25
51. Biot MA. 1956. Theory of deformation of a porous viscoelastic anisotropic solid. J. Appl. Phys. 27:459–6752. Biot MA. 1956. Theory of propagation of elastic waves in a fluid-saturated porous solid. I. Low-frequency
range. J. Acoust. Soc. Am. 28:168–7853. Biot MA. 1956. Theory of propagation of elastic waves in a fluid-saturated porous solid. II. Higher
frequency range. J. Acoust. Soc. Am. 28:179–9154. Delany M, Bazley E. 1970. Acoustical properties of fibrous absorbent materials. Appl. Acoust. 3:105–1655. Allard JF, Champoux Y. 1992. New empirical equations for sound propagation in rigid frame fibrous
materials. J. Acoust. Soc. Am. 91:3346–5356. Lafarge D, Nemati N. 2013. Nonlocal Maxwellian theory of sound propagation in fluid-saturated rigid-
framed porous media. Wave Motion 50:1016–3557. Nemati N, Lafarge D. 2014. Check on a nonlocal Maxwellian theory of sound propagation in fluid-
saturated rigid-framed porous media. Wave Motion 51:716–2858. Maa DY. 1998. Potential of microperforated panel absorber. J. Acoust. Soc. Am. 104:2861–6659. Bolt RH. 1947. On the design of perforated facings for acoustic materials. J. Acoust. Soc. Am. 19:917–2160. Callaway D, Ramer L. 1952. The use of perforated facings in designing low frequency resonant absorbers.
J. Acoust. Soc. Am. 24:309–1261. Ingard U. 1953. On the theory and design of acoustic resonators. J. Acoust. Soc. Am. 25:1037–6162. Ingard U. 1954. Perforated facing and sound absorption. J. Acoust. Soc. Am. 26:151–5463. Morse PM, Ingard KU. 1968. Theoretical Acoustics. New York: McGraw Hill64. Maa DY. 1975. Theory and design of microperforated panel sound-absorbing constructions. Sci. Sin.
18:55–7165. Raleigh JWD. 1929. Theory of Sound. II. New York: MacMillan. 327 pp.66. Crandall IB. 1926. Theory of Vibration System and Sound. New York: Van Nostrand. 229 pp.67. Liu J, Herrin D. 2010. Enhancing micro-perforated panel attenuation by partitioning the adjoining
cavity. Appl. Acoust. 71:120–2768. Wang C, Huang L. 2011. On the acoustic properties of parallel arrangement of multiple micro-perforated
panel absorbers with different cavity depths. J. Acoust. Soc. Am. 130:208–1869. Wang C, Huang L, Zhang Y. 2014. Oblique incidence sound absorption of parallel arrangement of
multiple micro-perforated panel absorbers in a periodic pattern. J. Sound Vib. 333:6828–4270. Park SH. 2013. Acoustic properties of micro-perforated panel absorbers backed by Helmholtz resonators
for the improvement of low-frequency sound absorption. J. Sound Vib. 332:4895–91171. Yang Z, Mei J, Yang M, Chan N, Sheng P. 2008. Membrane-type acoustic metamaterial with negative
dynamic mass. Phys. Rev. Lett. 101:20430172. Yang M, Ma G, Wu Y, Yang Z, Sheng P. 2014. Homogenization scheme for acoustic metamaterials.
Phys. Rev. B 89:06430973. Bliokh KY, Bliokh YP, Freilikher V, Savelev S, Nori F. 2008. Unusual resonators: plasmonics, metama-
terials, and random media. Rev. Mod. Phys. 80:1201–1374. Xu Y, Li Y, Lee RK, Yariv A. 2000. Scattering-theory analysis of waveguide-resonator coupling. Phys.
Rev. E 62:7389–40475. Chen Y, Huang G, Zhou X, Hu G, Sun CT. 2014. Analytical coupled vibroacoustic modeling of
membrane-type acoustic metamaterials: membrane model. J. Acoust. Soc. Am. 136:969–7976. Chen Y, Huang G, Zhou X, Hu G, Sun CT. 2014. Analytical coupled vibroacoustic modeling of
membrane-type acoustic metamaterials: plate model. J. Acoust. Soc. Am. 136:2926–3477. Ivansson SM. 2012. Anechoic coatings obtained from two-and three-dimensional monopole resonance
diffraction gratings. J. Acoust. Soc. Am. 131:2622–3778. Wen J, Zhao H, Lv L, Yuan B, Wang G, Wen X. 2011. Effects of locally resonant modes on underwater
sound absorption in viscoelastic materials. J. Acoust. Soc. Am. 130:1201–20879. Meng H, Wen J, Zhao H, Lv L, Wen X. 2012. Analysis of absorption performances of anechoic layers
with steel plate backing. J. Acoust. Soc. Am. 132:69–7580. Achilleos V, Richoux O, Theocharis G. 2016. Coherent perfect absorption induced by the nonlinearity
of a Helmholtz resonator. arXiv:1601.03912 [physics.class-ph]81. Godwin R. 1972. Optical mechanism for enhanced absorption of laser energy incident on solid targets.
Phys. Rev. Lett. 28:85–87
www.annualreviews.org • Sound Absorption Structures 113
Ann
u. R
ev. M
ater
. Res
. 201
7.47
:83-
114.
Dow
nloa
ded
from
ww
w.a
nnua
lrev
iew
s.or
g A
cces
s pr
ovid
ed b
y 20
3.18
6.7.
113
on 0
7/11
/17.
For
per
sona
l use
onl
y.

MR47CH05-Sheng ARI 7 June 2017 8:25
82. Freidberg J, Mitchell R, Morse RL, Rudsinski L. 1972. Resonant absorption of laser light by plasmatargets. Phys. Rev. Lett. 28:795–99
83. Kindel J, Lee K, Lindman E. 1975. Surface-wave absorption. Phys. Rev. Lett. 34:134–3884. Yang M, Ma G, Yang Z, Sheng P. 2015. Subwavelength perfect acoustic absorption in membrane-type
metamaterials: a geometric perspective. EPJ Appl. Metamater. 2:1085. Piper JR, Liu V, Fan S. 2014. Total absorption by degenerate critical coupling. Appl. Phys. Lett.
104:25111086. Jimenez N, Huang W, Romero-Garcıa V, Pagneux V, Groby JP. 2016. Ultra-thin metamaterial for
perfect and quasi-omnidirectional sound absorption. Appl. Phys. Lett. 109:12190287. Landy N, Sajuyigbe S, Mock J, Smith D, Padilla W. 2008. Perfect metamaterial absorber. Phys. Rev.
Lett. 100:20740288. Ye D, Wang Z, Xu K, Li H, Huangfu J, et al. 2013. Ultrawideband dispersion control of a metamaterial
surface for perfectly-matched-layer-like absorption. Phys. Rev. Lett. 111:18740289. Radi Y, Simovski C, Tretyakov S. 2015. Thin perfect absorbers for electromagnetic waves: theory, design,
and realizations. Phys. Rev. Appl. 3:03700190. Lee YP, Rhee JY, Yoo YJ, Kim KW. 2016. Broadband and tunable MMPA. In Metamaterials for Perfect
Absorption, ed. Y Pak Lee, JY Rhee, YJ Yoo, KW Kim, pp. 113–41. Singapore: Springer91. Li J, Wang W, Xie Y, Popa BI, Cummer SA. 2016. A sound absorbing metasurface with coupled res-
onators. Appl. Phys. Lett. 109:09190892. Liang Z, Feng T, Lok S, Liu F, Ng KB, et al. 2013. Space-coiling metamaterials with double negativity
and conical dispersion. Sci. Rep. 3:161493. Xie Y, Konneker A, Popa BI, Cummer SA. 2013. Tapered labyrinthine acoustic metamaterials for broad-
band impedance matching. Appl. Phys. Lett. 103:20190694. Kim S, Kim YH, Jang JH. 2006. A theoretical model to predict the low-frequency sound absorption of
a Helmholtz resonator array. J. Acoust. Soc. Am. 119:1933–3695. Wu X, Fu C, Li X, Meng Y, Gao Y, et al. 2016. Low-frequency tunable acoustic absorber based on split
tube resonators. Appl. Phys. Lett. 109:04350196. Landau L, Lifshitz E, Pitaevskii L. 1995. Electrodynamics of Continuous Media, Vol. 8. Oxford, UK:
Butterworth-Heinemann. 2nd ed.97. Fano RM. 1950. Theoretical limitations on the broadband matching of arbitrary impedances. J. Franklin
Inst. 249:57–8398. Rozanov KN. 2000. Ultimate thickness to bandwidth ratio of radar absorbers. IEEE Trans. Antennas
Propag. 48:1230–3499. Wu T, Cox T, Lam Y. 2000. From a profiled diffuser to an optimized absorber. J. Acoust. Soc. Am.
108:643–50100. Fahy F. 2001. Foundations of Engineering Acoustics. London: Academic
114 Yang · Sheng
Ann
u. R
ev. M
ater
. Res
. 201
7.47
:83-
114.
Dow
nloa
ded
from
ww
w.a
nnua
lrev
iew
s.or
g A
cces
s pr
ovid
ed b
y 20
3.18
6.7.
113
on 0
7/11
/17.
For
per
sona
l use
onl
y.

MR47-FrontMatter ARI 9 May 2017 13:51
Annual Review ofMaterials Research
Volume 47, 2017Contents
Novel Functionality Through Metamaterials (Venkatraman Gopalan,Don Lipkin & Simon Phillpot, Editors)
Control of Localized Surface Plasmon Resonances in Metal OxideNanocrystalsAnkit Agrawal, Robert W. Johns, and Delia J. Milliron � � � � � � � � � � � � � � � � � � � � � � � � � � � � � � � � � � � � 1
DNA-Driven Assembly: From Polyhedral Nanoparticles to ProteinsMartin Girard, Jaime A. Millan, and Monica Olvera de la Cruz � � � � � � � � � � � � � � � � � � � � � � � � �33
Harnessing Instabilities to Design Tunable Architected Cellular MaterialsKatia Bertoldi � � � � � � � � � � � � � � � � � � � � � � � � � � � � � � � � � � � � � � � � � � � � � � � � � � � � � � � � � � � � � � � � � � � � � � � � � � � � � � � � � �51
Negative-Poisson’s-Ratio Materials: Auxetic SolidsRoderic S. Lakes � � � � � � � � � � � � � � � � � � � � � � � � � � � � � � � � � � � � � � � � � � � � � � � � � � � � � � � � � � � � � � � � � � � � � � � � � � � � � � �63
Sound Absorption Structures: From Porous Media to AcousticMetamaterialsMin Yang and Ping Sheng � � � � � � � � � � � � � � � � � � � � � � � � � � � � � � � � � � � � � � � � � � � � � � � � � � � � � � � � � � � � � � � � � � � �83
Structured X-Ray Optics for Laboratory-Based Materials AnalysisCarolyn A. MacDonald � � � � � � � � � � � � � � � � � � � � � � � � � � � � � � � � � � � � � � � � � � � � � � � � � � � � � � � � � � � � � � � � � � � � � 115
Synchrotron X-Ray OpticsAlbert T. Macrander and XianRong Huang � � � � � � � � � � � � � � � � � � � � � � � � � � � � � � � � � � � � � � � � � � � � � � 135
Current Interest
Active Crystal Growth Techniques for Quantum MaterialsJulian L. Schmehr and Stephen D. Wilson � � � � � � � � � � � � � � � � � � � � � � � � � � � � � � � � � � � � � � � � � � � � � � � � 153
Atomic-Scale Structure-Property Relationships in Lithium Ion BatteryElectrode MaterialsZhenzhong Yang, Lin Gu, Yong-Sheng Hu, and Hong Li � � � � � � � � � � � � � � � � � � � � � � � � � � � � � � � 175
Atomistic Simulations of Activated Processes in MaterialsG. Henkelman � � � � � � � � � � � � � � � � � � � � � � � � � � � � � � � � � � � � � � � � � � � � � � � � � � � � � � � � � � � � � � � � � � � � � � � � � � � � � � � 199
v
Ann
u. R
ev. M
ater
. Res
. 201
7.47
:83-
114.
Dow
nloa
ded
from
ww
w.a
nnua
lrev
iew
s.or
g A
cces
s pr
ovid
ed b
y 20
3.18
6.7.
113
on 0
7/11
/17.
For
per
sona
l use
onl
y.
MR47-FrontMatter ARI 9 May 2017 13:51
Deformation of Crystals: Connections with Statistical PhysicsJames P. Sethna, Matthew K. Bierbaum, Karin A. Dahmen, Carl P. Goodrich,
Julia R. Greer, Lorien X. Hayden, Jaron P. Kent-Dobias, Edward D. Lee,Danilo B. Liarte, Xiaoyue Ni, Katherine N. Quinn, Archishman Raju,D. Zeb Rocklin, Ashivni Shekhawat, and Stefano Zapperi � � � � � � � � � � � � � � � � � � � � � � � � � � � � 217
Heusler 4.0: Tunable MaterialsLukas Wollmann, Ajaya K. Nayak, Stuart S.P. Parkin, and Claudia Felser � � � � � � � � � � � 247
Physical Dynamics of Ice Crystal GrowthKenneth G. Libbrecht � � � � � � � � � � � � � � � � � � � � � � � � � � � � � � � � � � � � � � � � � � � � � � � � � � � � � � � � � � � � � � � � � � � � � � � � 271
Silicate Deposit Degradation of Engineered Coatings in Gas Turbines:Progress Toward Models and Materials SolutionsDavid L. Poerschke, R. Wesley Jackson, and Carlos G. Levi � � � � � � � � � � � � � � � � � � � � � � � � � � � � � � 297
Structural and Functional FibersHuibin Chang, Jeffrey Luo, Prabhakar V. Gulgunje, and Satish Kumar � � � � � � � � � � � � � � � 331
Synthetic Two-Dimensional PolymersMarco Servalli and A. Dieter Schluter � � � � � � � � � � � � � � � � � � � � � � � � � � � � � � � � � � � � � � � � � � � � � � � � � � � � � 361
Transparent Perovskite Barium Stannate with High Electron Mobilityand Thermal StabilityWoong-Jhae Lee, Hyung Joon Kim, Jeonghun Kang, Dong Hyun Jang,
Tai Hoon Kim, Jeong Hyuk Lee, and Kee Hoon Kim � � � � � � � � � � � � � � � � � � � � � � � � � � � � � � � � � 391
Visualization of Atomic-Scale Motions in Materials via FemtosecondX-Ray Scattering TechniquesAaron M. Lindenberg, Steven L. Johnson, and David A. Reis � � � � � � � � � � � � � � � � � � � � � � � � � � � 425
X-Ray Tomography for Lithium Ion Battery Research: A Practical GuidePatrick Pietsch and Vanessa Wood � � � � � � � � � � � � � � � � � � � � � � � � � � � � � � � � � � � � � � � � � � � � � � � � � � � � � � � � � � 451
Indexes
Cumulative Index of Contributing Authors, Volumes 43–47 � � � � � � � � � � � � � � � � � � � � � � � � � � � 481
Errata
An online log of corrections to Annual Review of Materials Research articles may befound at http://www.annualreviews.org/errata/matsci
vi Contents
Ann
u. R
ev. M
ater
. Res
. 201
7.47
:83-
114.
Dow
nloa
ded
from
ww
w.a
nnua
lrev
iew
s.or
g A
cces
s pr
ovid
ed b
y 20
3.18
6.7.
113
on 0
7/11
/17.
For
per
sona
l use
onl
y.