source apportionment of ambient particle number ... · the only study providing a source appor- ......
TRANSCRIPT

Atmos. Chem. Phys., 16, 4849–4866, 2016
www.atmos-chem-phys.net/16/4849/2016/
doi:10.5194/acp-16-4849-2016
© Author(s) 2016. CC Attribution 3.0 License.
Source apportionment of ambient particle number concentrations in
central Los Angeles using positive matrix factorization (PMF)
Mohammad Hossein Sowlat, Sina Hasheminassab, and Constantinos Sioutas
University of Southern California, Department of Civil and Environmental Engineering, Los Angeles, CA, USA
Correspondence to: Constantinos Sioutas ([email protected])
Received: 25 November 2015 – Published in Atmos. Chem. Phys. Discuss.: 3 February 2016
Revised: 31 March 2016 – Accepted: 1 April 2016 – Published: 20 April 2016
Abstract. In this study, the positive matrix factorization
(PMF) receptor model (version 5.0) was used to identify
and quantify major sources contributing to particulate matter
(PM) number concentrations, using PM number size distribu-
tions in the range of 13 nm to 10 µm combined with several
auxiliary variables, including black carbon (BC), elemen-
tal and organic carbon (EC/OC), PM mass concentrations,
gaseous pollutants, meteorological, and traffic counts data,
collected for about 9 months between August 2014 and 2015
in central Los Angeles, CA. Several parameters, including
particle number and volume size distribution profiles, pro-
files of auxiliary variables, contributions of different factors
in different seasons to the total number concentrations, di-
urnal variations of each of the resolved factors in the cold
and warm phases, weekday/weekend analysis for each of
the resolved factors, and correlation between auxiliary vari-
ables and the relative contribution of each of the resolved
factors, were used to identify PM sources. A six-factor solu-
tion was identified as the optimum for the aforementioned in-
put data. The resolved factors comprised nucleation, traffic 1,
traffic 2 (with a larger mode diameter than traffic 1 factor),
urban background aerosol, secondary aerosol, and soil/road
dust. Traffic sources (1 and 2) were the major contributor to
PM number concentrations, collectively making up to above
60 % (60.8–68.4 %) of the total number concentrations dur-
ing the study period. Their contribution was also significantly
higher in the cold phase compared to the warm phase. Nu-
cleation was another major factor significantly contributing
to the total number concentrations (an overall contribution
of 17 %, ranging from 11.7 to 24 %), with a larger contribu-
tion during the warm phase than in the cold phase. The other
identified factors were urban background aerosol, secondary
aerosol, and soil/road dust, with relative contributions of ap-
proximately 12 % (7.4–17.1), 2.1 % (1.5–2.5 %), and 1.1 %
(0.2–6.3 %), respectively, overall accounting for about 15 %
(15.2–19.8 %) of PM number concentrations. As expected,
PM number concentrations were dominated by factors with
smaller mode diameters, such as traffic and nucleation. On
the other hand, PM volume and mass concentrations in the
study area were mostly affected by sources with larger mode
diameters, including secondary aerosols and soil/road dust.
Results from the present study can be used as input parame-
ters in future epidemiological studies to link PM sources to
adverse health effects as well as by policymakers to set tar-
geted and more protective emission standards for PM.
1 Introduction
Numerous epidemiological studies have provided com-
pelling evidence linking exposure to ambient particulate
matter (PM) with increased risk of respiratory and cardio-
vascular diseases, hospitalization, and premature mortality
(Brunekreef and Forsberg, 2005; Dockery and Stone, 2007;
Miller et al., 2007; Pope et al., 2004, 2002; Gauderman et al.,
2015). According to the most recent global burden of dis-
ease study, over 3 million premature deaths occur annually
all around the globe due to exposure to ambient PM (Lim et
al., 2013). It should, however, be noted that most of these epi-
demiological studies have related the aforementioned health
outcomes with solely the mass concentrations of PM and,
therefore, do not adequately represent submicron particles
(Ogulei et al., 2007), mainly because this PM fraction con-
tributes negligibly to total ambient PM mass (Delfino et al.,
2005; Vu et al., 2015). More recently, studies have associ-
ated human health effects with particles characteristics other
Published by Copernicus Publications on behalf of the European Geosciences Union.

4850 M. H. Sowlat et al.: Sources of PM number concentrations in central LA
than mass concentration, including size, number concentra-
tion, chemical composition, and even surface area (Brook et
al., 2010; Kasumba et al., 2009; Lighty et al., 2000; Chen
et al., 1991; Dreher et al., 1997; Oberdörster et al., 1994; Pe-
ters et al., 1997; Delfino et al., 2010; Davis et al., 2013). Even
though our knowledge of which particle characteristic (mass,
size, surface area, etc.) can be considered as the best pre-
dictor for human health outcomes is limited, there is grow-
ing evidence highlighting the critical role of particle size and
number concentrations from a human health effect perspec-
tive (Vu et al., 2015). For example, studies have indicated
that ultrafine particles (UFPs, i.e., particles with an aerody-
namic diameter of < 100 nm) have higher toxicity per unit
mass (Donaldson et al., 1998; Li et al., 2003; Nel et al., 2006;
Oberdörster et al., 2002), have higher deposition efficiencies
in the lung (Venkataraman, 1999), and penetrate deeper into
the alveolar regions of lungs (Sioutas et al., 2005). Addition-
ally, several studies have also found that PM number con-
centrations (mostly UFPs) can be associated with adverse
effects on human health, particularly for cardiovascular dis-
eases (Delfino et al., 2005; Peters et al., 1997; Wichmann et
al., 2000).
Regulations on PM number concentrations have already
been implemented on motor vehicle emissions in a few coun-
tries. For instance, the Euro 5b and 6 regulations have set a
limit to particle number emission factors, in addition to par-
ticle mass emission limits, for heavy-duty and gasoline vehi-
cles (http://www.dieselnet.com/standards/eu/ld.php, last ac-
cess: 20 October 2015). It is also expected that this approach
will gradually be adopted in other parts of the world (Friend
et al., 2013), based mainly on the critical health implications
of the PM number concentrations, especially in smaller frac-
tions like UFPs. This emphasizes the necessity of identifica-
tion and quantification of PM sources based on number as
well as mass (Friend et al., 2013). This allows for source-
specific assessment of health effects of exposure to PM to
provide us with the knowledge required to develop efficient
control strategies for PM emissions from major sources to
minimize these health effects (Yue et al., 2008).
Positive matrix factorization (PMF) is one of the most
widely used receptor models that have been successfully ap-
plied to identify and quantify sources of atmospheric parti-
cles. The vast majority of previous efforts has been devoted
to the identification of sources that contribute to the mass of
particles using PMF on chemically speciated PM mass data
in different parts of the world (Sowlat et al., 2013, 2012;
Dutton et al., 2010; Lim et al., 2010; Alleman et al., 2010;
Sofowote et al., 2015). Recently, attempts have been made to
characterize sources that contribute to particle number, rather
than mass, using PMF applied to particle number size distri-
bution data. These studies have adopted different approaches
in their source apportionment, including (1) using particle
number size distribution together with gaseous pollutants,
chemical composition, meteorological, or traffic data in the
PMF analysis (Beddows et al., 2015; Harrison et al., 2011;
Kasumba et al., 2009; Ogulei et al., 2007, 2006b; Thimma-
iah et al., 2009; Zhou et al., 2005); (2) using particle number
size distribution and chemical composition data in separate
and/or combined PMF runs (Beddows et al., 2015; Gu et al.,
2011); (3) comparing PMF results with actual events during
the study period (Ogulei et al., 2007); and (4) simply corre-
lating the PMF results with gaseous pollutants data (Friend
et al., 2013, 2012; Kim et al., 2004). It is noteworthy that
the major factors resolved by these studies have been nu-
cleation, traffic, secondary aerosol, urban background, and
wood burning.
Numerous studies have been performed in Los Angeles
evaluating PM number concentrations as well as size dis-
tributions, with a focus on vehicular emissions as a major
source of particle number in urban areas (Singh et al., 2006;
Zhang et al., 2005). Source apportionment of atmospheric
particles has also been extensively studied in Los Angeles,
but almost all of the studies have focused on the contribu-
tion of different sources to PM mass rather than PM number
concentration (Ham and Kleeman, 2011; Hasheminassab et
al., 2013; Hwang and Hopke, 2006; Kim and Hopke, 2007;
Kim et al., 2010; Schauer and Cass, 2000). To the best of our
knowledge, no source apportionment studies have ever been
performed in Los Angeles on particle number size distribu-
tions using PMF. The only study providing a source appor-
tionment of particle number concentrations in Los Angeles is
that of Brines et al. (2015), in which major sources contribut-
ing to particle number concentrations were identified in five
high-insolation cities around the world (Barcelona, Madrid,
Rome, Los Angeles, and Brisbane) using the k means clus-
tering method. It should, however, be noted that, in case of
Los Angeles, the Brines et al. (2015) study used particle
number size distribution data for a rather limited time pe-
riod (i.e., 3 months); moreover, the studied size distributions
ranged from 13 to 400 nm, thus excluding potentially impor-
tant PM sources contributing to the larger size fractions of
PM2.5 and/or PM10.
In the present work, we collected high-resolution (5 min
measurements), wide-spectrum particle number size distri-
bution data (i.e., 13 nm to 10 µm, covering the nucleation,
Aitken, accumulation, and coarse PM modes) over a long pe-
riod of time (i.e., 9 months, covering both warm and cold
seasons) in a location near downtown Los Angeles, Cali-
fornia, to identify and quantify sources contributing to par-
ticle number concentrations using the most recent version
of the PMF model (version 5.0). We also included gaseous
pollutants (i.e., CO, NO, NO2, O3), particle mass (PM10–2.5
and PM2.5), meteorological (temperature, relative humidity
(RH), and wind speed), black carbon (BC), elemental carbon
(EC) as well as primary (POC) and secondary organic carbon
(SOC), and traffic (counts of light-duty vehicles (LDVs) and
heavy-duty vehicles (HDVs)) data as inputs to help identify
the factors resolved by the model. Results from the present
study can be used as a platform for future health effect stud-
ies to estimate the source-specific impact of exposure to PM
Atmos. Chem. Phys., 16, 4849–4866, 2016 www.atmos-chem-phys.net/16/4849/2016/

M. H. Sowlat et al.: Sources of PM number concentrations in central LA 4851
from a number concentration perspective, which is critical
for the development and establishment of abatement strate-
gies and standards in order to minimize the most relevant
health outcomes.
2 Methodology
2.1 Sampling site
Continuous measurements were carried out at the particle in-
strumentation unit (PIU) located on the University of South-
ern California’s (USC) park campus, approximately 3 km
south of downtown Los Angeles, CA. The PIU is located
within approximately 150 m downwind of a routinely con-
gested interstate freeway, i.e., I-110, and is also in close prox-
imity to parking and construction facilities. Previous studies
conducted by this research group have indicated that the PIU
is a mixed urban site that is also heavily impacted by ve-
hicular emissions (Geller et al., 2004; Moore et al., 2007;
Hasheminassab et al., 2014b).
2.2 Sampling time, method, and instrumentation
Continuous measurements were conducted at the PIU from
August 2014 through March 2015 as well as in August 2015.
To obtain number size distribution of atmospheric particles
in the size range of 14–760 nm (mobility diameter), a scan-
ning mobility particle sizer (SMPS™, TSI Model 3081) was
used, which was connected to a condensation particle counter
(CPC, model 3020, TSI Inc., USA). Particles in the size
range of 0.3–10 µm (optical diameter) were measured us-
ing an Optical Particle Sizer (OPS™, Model 3330, TSI Inc.,
USA). The time resolution for these two instruments was
5 min. The OPS instrument was calibrated by the manufac-
turer using polystyrene latex (PSL) particles, which have a
dynamic shape factor of 1 (i.e., spherical particles) and a
refractive index of 1.59. It should also be noted that the
measurements provided by the OPS instrument depend pri-
marily on the refractive index and the dynamic shape factor
(Hasheminassab et al., 2014b). Numerous studies have indi-
cated that for spherical particles, the size selection offered
by optical particle counters, such as the OPS instrument, is
quite similar to the actual physical diameter of the particle
being measured (Chen et al., 2011; Hasheminassab et al.,
2014b; Hering and McMurry, 1991; Reid et al., 1994). That
said, there is compelling evidence in the literature support-
ing the fact that the refractive index and the dynamic shape
factor for ambient aerosols in urban areas (such as Los An-
geles) are quite similar to those of PSL particles (Covert
et al., 1990; Ebert et al., 2004; Hänel, 1968; Kent et al.,
1983; Stolzenburg et al., 1998; Strawa et al., 2006; Watson et
al., 2002). To further evaluate this assumption, we used the
Multi-Instrument Manager (MIM™) software, developed by
TSI Inc., USA, which estimates the refractive index and dy-
namic shape factor of aerosols from parallel SMPS and OPS
scans. The output from this software indicated that the aver-
age real part of the refractive index for the aerosols collected
in this study was 1.59± 0.01 and their dynamic shape fac-
tor was 0.99± 0.02. This finding is also in concert with the
results of Hasheminassab et al. (2014b), which reported an
average shape factor of near unity at the same sampling site,
using the apparent and material density of aerosols. Hence,
further adjustment of OPS sizing was deemed unnecessary
and the OPS size distribution, with the original size selection,
was merged with the SMPS size spectra. Therefore, size bins
covering the range of 13.6–514 nm from SMPS (without sub-
sequent combination into larger size fractions) were merged
with the OPS channels from 0.522 to 9.01 µm as the input
data to the PMF model. More detailed information on the
sensitivity of the OPS sizing to the refractive index and the
dynamic shape factor of aerosols can be found in Hashemi-
nassab et al. (2014b).
Black carbon (BC) concentrations, with a time resolu-
tion of 15 min, were measured using a portable Aethalome-
ter (Magee Scientific, model AE-42). Hourly concentrations
of elemental carbon (EC) and organic carbon (OC) were
measured using a semicontinuous EC/OC carbon aerosol
analyzer (Model 4, Sunset Laboratory Inc., USA), using
the thermal/optical transmittance measurement protocol of
the National Institute of Occupational Safety and Health
(NIOSH 5040). By applying the EC tracer method, Saffari et
al. (2016) estimated the primary organic carbon (POC) and
secondary organic carbon (SOC) concentrations from total
OC at the same location. These two parameters (i.e., POC
and SOC) were also used as input parameters in the PMF
model, as they can provide valuable input regarding the de-
tection of primary and secondary sources of PM. The EC
tracer method has been discussed in detail elsewhere (Day et
al., 2015; Saffari et al., 2016). Briefly, the main assumption
in this method is that EC and POC are released from similar
sources; therefore, this approach is most applicable where
combustion is the main source of ambient POC (Day et al.,
2015). It is noteworthy that, in the present study, the sam-
pling site was located in close proximity to a major freeway,
thereby making the EC tracer suitable for the data collected
in this location, as it has also been used in previous studies
in the same sampling site (Polidori et al., 2007; Saffari et al.,
2016) as well as similar locations in the Los Angeles basin
(Na et al., 2004; Strader et al., 1999). In this method, the fol-
lowing equations can be used after determining the ratio of
POC to EC to estimate the concentration of SOC:
POC= [OC/EC]p ×EC+ b (1)
SOC= OC−POC, (2)
where [OC/EC]p is the POC to EC ratio; b is the inter-
cept of the linear regression between POC and EC, which
is considered to be the portion of POC associated with non-
combustion emissions. Using Eq. (1), the slope and the inter-
cept of the regression line were found to be 1.55 (±0.07) and
www.atmos-chem-phys.net/16/4849/2016/ Atmos. Chem. Phys., 16, 4849–4866, 2016

4852 M. H. Sowlat et al.: Sources of PM number concentrations in central LA
0.45 (±0.24), respectively. More detailed information on the
results obtained using the EC tracer method can be found
elsewhere (Saffari et al., 2016). It is also noteworthy that
we used the high EC edge method to determine observations
with a high probability of dominant POC contribution, which
is believed to be a more accurate method for the identification
of the [OC/EC]p ratio compared to the traditional approach,
as discussed by Day et al. (2015), and has also been success-
fully applied in a number of previous studies (Harrison and
Yin, 2008; Lim and Turpin, 2002; Na et al., 2004).
2.3 Auxiliary variables
To help better identify the factors resolved by the PMF
model, additional parameters, including gaseous pollutants
(i.e., CO, NO, NO2, and O3) and particulate matter mass con-
centrations in two size fractions (i.e., PM10–2.5 and PM2.5),
meteorological parameters (i.e., temperature, relative hu-
midity, and wind speed), and traffic flow data (counts of
LDVs and HDVs), were also included in the model as aux-
iliary variables. Hourly concentrations of particulate mass
and gaseous pollutants together with hourly measurements
of meteorological parameters were acquired from the online
database of the California Air Resources Board (CARB), for
the sampling site located in downtown Los Angeles (North
Main St.), approximately 3 km to the northeast of the PIU.
The hourly traffic flow data were acquired from the nearest
vehicle detection station (VDS) to our sampling site on the
freeway I-110, operated by the freeway performance mea-
surement system (PeMS), under the California Department
of Transportation (CalTrans). Table 1 provides a summary of
statistics of the input parameters to the PMF model in this
study. To achieve the same time resolution across all vari-
ables, we calculated hourly averaged data points for all vari-
ables.
2.4 Meteorology in central Los Angeles
To evaluate the impact of meteorological conditions on factor
contributions as well as to better identify the resolved factors
based on their expected seasonal trends, the study period was
partitioned into two phases, i.e., colder phase (from Novem-
ber to February) and warmer phase (from August to October
as well as March), and the model outputs, except for factor
profiles, are presented for each phase accordingly. Figure 1
illustrates the diurnal variation of important meteorological
parameters, namely, temperature, RH, wind speed, and solar
radiation, in the cold and warm phases. As can be seen from
the figure, on average, the temperature was 5–7◦ C higher in
the warm phase than in the cold phase, although the trends
were similar in both phases. Minimum temperatures were ob-
served in the early morning (coinciding with morning rush
hours), while maximum temperatures were seen at around
noon. Conversely, RH peaked at night and exhibited a min-
imum in the early afternoon. RH was also slightly higher in
Figure 1. Diurnal variations of important meteorological parame-
ters in the cold and warm phases. Error bars correspond to 1 stan-
dard error.
the warm phase than in the cold phase. As expected, wind
speed peaked in the early afternoon during the warm phase
and slightly shifted to the evening in the cold phase, while
the slowest winds blew during nighttime. The wind speeds
were also higher in the warm phase compared to the cold
phase. Solar radiation had a consistent trend in both phases,
peaking at noon, with the levels being higher in the warm
phase than in the cold phase, as one would expect. Similar
trends and levels were also observed by Hasheminassab et
al. (2014b) in central LA, indicating the occurrence of stable
Atmos. Chem. Phys., 16, 4849–4866, 2016 www.atmos-chem-phys.net/16/4849/2016/

M. H. Sowlat et al.: Sources of PM number concentrations in central LA 4853
Table 1. Summary of the input parameters to the PMF model in this study.
Parameter Source of data Time resolution in original data set
EC, OC Sunset monitor 1 h
Size distribution (14–760 nm) SMPS 5 min
Size distribution (0.3–10 µm) OPS 5 min
BC Aethalometer 15 min
PM mass concentration data (PM10–2.5, PM2.5) CARB 1 h
Gaseous pollutants (NO, NO2, CO, O3, SO2) CARB 1 h
Meteorological data (T , RH, wind speed (WS)) CARB 1 h
Traffic data (counts of LDVs and HDVs) PeMS 1 h
atmospheric conditions during nighttime until morning rush
hours, especially in colder months of the year.
2.5 PMF model
PMF, first developed by Paatero and Tapper (1993), is a mul-
tivariate statistical model used for identifying and quanti-
fying the contribution of different sources to a set of sam-
ples using the fingerprints of those sources. This multivariate
factor analysis tool decomposes a matrix of speciated data
into two submatrices, i.e., factor profiles and source contri-
butions, as shown below (Krecl et al., 2008):
X=G ·F+E, (3)
where X is the matrix of samples (here, particle number size
distribution together with auxiliary variables data); G is the
matrix containing source contributions; F is the matrix con-
taining factor profiles; and E is the residual matrix.
The above equation can also be expressed mathematically,
as the following (Norris et al., 2014):
xij =
p∑k=1
gikfkj + eij , (4)
where xij is the PM number concentration (or concentration
of another auxiliary species) for the ith sample and the j th
size bin (or species); p is the number of factors that con-
tribute to the PM number concentrations; gik is the relative
contribution of kth factor to ith sample; fik is the PM num-
ber concentration of j th size bin in the kth factor; and eijis the residual (observed–estimated) value for the ith sample
and j th size bin.
With the constraint that no sample can have a significantly
negative contribution, and using a least-squares method, the
PMF then resolves factor profiles and contributions by at-
tempting to minimize the Q value, as shown below (Paatero,
1997; Paatero and Tapper, 1994):
Q=
n∑i=1
m∑j=1
xij −
p∑k=1
gik · fkj
uij
2
, (5)
where uij is the uncertainty associated with the sample xij .
One of the advantages of the PMF model is weighting ev-
ery single value in the input data matrix using user-provided
uncertainties, enabling the model to allow for measurement
confidence in resolving the factor profiles and contributions
(Paatero et al., 2014). In the present work, since no measure-
ment uncertainties were available for the input parameters,
we applied the method suggested by Ogulei et al. (2006a, b)
and Zhou et al. (2004) to calculate the uncertainties for indi-
vidual data points inserted into the model. For this purpose,
measurement errors were first estimated for each data point
using the following equation:
σij = C1(Nij +Nj ), (6)
where σij is the estimated measurement error for the ith sam-
ple and j th size bin (or concentration of auxiliary variables);
C1 is an empirical constant usually between 0.01 and 0.05;
Nij is the observed number concentration for the ith sample
and j th size bin (or concentration of auxiliary variables); and
N j is the arithmetic mean of the PM number concentrations
for the j th size bin (or concentration of auxiliary variables).
The value of the measurement method obtained from the
above equation is then used to calculate the measurement un-
certainty, according to the following equation:
Sij = σij +C2max(∣∣xij ∣∣ , ∣∣yij ∣∣), (7)
where Sij is the calculated uncertainty associated with the
ith sample and j th size bin; C2 is an empirical constant usu-
ally between 0.1 and 0.5; and Yij is the value calculated by
the model for xij . In the present work, C1 and C2 values of
0.05 and 0.1 were chosen to obtain the most physically inter-
pretable solution using a trial and error approach.
In the present study, the most recent version of the PMF
model, version 5.0, newly released by the United States En-
vironmental Protection Agency (PMF guide), was used. Un-
certainties associated with the resolved factor profiles were
estimated using three error estimation methods, namely, dis-
placement (DISP) analysis, bootstraps (BS) method, and a
combination of DISP and BS methods (BS–DISP). For the
DISP analysis, a solution was considered valid if the ob-
served drop in the Q value was below 0.1 % and there were
www.atmos-chem-phys.net/16/4849/2016/ Atmos. Chem. Phys., 16, 4849–4866, 2016

4854 M. H. Sowlat et al.: Sources of PM number concentrations in central LA
Table 2. Summary statistics for the parameters included in the PMF model.
Species Geometric mean Standard error Min Max S /N ratio
Total number concentration (particle cm−3) 6860.00 94.10 524.00 32 400.00 7.00
PM10–2.5 (µg m−3) 15.90 0.19 2.00 77.00 7.00
PM2.5 (µg m−3) 14.50 0.23 1.00 101.00 6.90
CO (ppm) 0.58 0.01 0.10 2.19 7.10
NO (ppb) 8.46 0.57 1.00 212.00 5.80
NO2 (ppb) 22.50 0.23 1.90 75.00 7.10
O3 (ppb) 17.40 0.33 2.00 105.00 6.80
BC (µg m−3) 1.14 0.02 0.124 9.13 6.90
POC∗ (µg m−3) 2.20 0.08 0.10 19.20 6.80
SOC∗ (µg m−3) 2.13 0.05 0.04 16.30 7.10
EC∗ (µg m−3) 1.01 0.03 0.01 7.34 8.80
RH (%) 50.40 0.40 6.00 99.00 7.10
Temperature (◦C) 18.80 0.13 3.89 38.33 7.30
Wind speed (WS; m s−1) 4.03 0.04 1.00 14.00 6.80
LDVs (no. h−1) 3790 34 691 7620 7.10
HDVs (no. h−1) 153 3 5 920 6.80
∗ Values pertain to the runs including EC/OC data.
no factor swaps for the smallest dQmax (i.e., 4). For the BS
method, 100 runs were selected and a solution was consid-
ered valid if all of the factors had a mapping of above 90 %.
For the BS–DISP analysis, a solution was considered valid if
the observed drop in theQ value was below 0.5 % (Brown et
al., 2015; Paatero et al., 2014).
The PMF model was run in the robust mode, which down-
weights the effect of values with high uncertainties (i.e., val-
ues set as weak in the model) on the final solution resolved
by the model (Brown et al., 2015). Missing values were re-
placed by interpolating the previous and the next data points
in the matrix; however, to decrease the effect of these re-
placed values on the final solution, their uncertainty was set
as 3 times the mean uncertainty for that species (that is prac-
tically what the model does to set a species as weak). Based
on the recommendations presented by Brown et al. (2015),
genuine zero values were included in the input matrix. Par-
ticle number concentration (PNC) was selected as the total
variable, and the PMF model automatically turned it into a
weak species by increasing its uncertainty by a factor of 3.
An extra model uncertainty of 5 % was also set to account
for errors that are not covered in the input uncertainty values
(Reff et al., 2007), since the uncertainty matrix only includes
the effect of random as well as experimental errors.
2.6 Input matrices
The model was run in two different scenarios, one with
EC/OC data, which included 1053 samples of 131 species,
and one without EC/OC data, which included 2976 sam-
ples of 129 species. This was due mainly to the fact that
the EC/OC data were being collected in parallel for a dif-
ferent study that coincided with the current work in a span
of time shorter than the entire study period. Therefore, in or-
der to keep the large number of samples from the main study
(i.e., 2976) as well as to use the critical advantage of having
EC/OC data in the factor identification process, it was de-
cided to run the PMF model in two different scenarios, one
including EC/OC data and one without these data. It should
also be noted that although the latter matrix contained BC
data, this variable was excluded from the former matrix to
avoid double counting, as EC was already included in the
data set. The results of the PMF run including the EC/OC
data are provided in the supplementary information (Fig. S1
in the Supplement).
3 Results and discussion
3.1 Overview of the data
Table 2 presents the statistical characteristics of the species
included in the PMF model. In this table, signal-to-noise
(S /N ) ratio is a parameter that indicates if the variability
in the measurements is real or within the data noise. In the
current version of the model, i.e., PMF 5.0, the method used
for calculating the S /N ratio has been updated compared to
the previous versions, resolving the disadvantages associated
with the previous method of S /N calculation (for a more
detailed discussion on the S /N calculation methods, see the
Supplement). In the current method, if the resulting S /N
ratio is above 1, it can be concluded that the species has a
reliable signal. As reported in Table 2, all the species in the
input matrix had S /N ratios well above 1, indicating very
strong signals for all the variables. Figure S2 also illustrates
the correlation between the measured and PMF-predicted to-
Atmos. Chem. Phys., 16, 4849–4866, 2016 www.atmos-chem-phys.net/16/4849/2016/

M. H. Sowlat et al.: Sources of PM number concentrations in central LA 4855
tal number concentrations for the entire sampling period. As
can be seen in the figure, the high correlation between mea-
sured and predicted values (R2= 0.99) and the slope of the
regression line that is very close to 1 indicate that the PMF
model has been successful in modeling the input data and
apportioning the total PM number concentrations to the re-
solved factors.
Figure 2 depicts the average number and volume size dis-
tributions of all the input data to the PMF model by phase,
which were collected during the entire study period. As
shown in the figure, the vast majority of the particles were
smaller than 100 nm, and the number concentration had a
mode diameter of around 40 nm. Additionally, a significantly
higher number concentration was observed in the cold phase
compared to the warm phase, which is consistent with the
results from the previous studies conducted in Los Angeles
(Hudda et al., 2010; Singh et al., 2006). Regarding volume
concentrations, we observed one minor volume mode in the
size range of 300–500 nm and a major mode at around 4–
6 µm. In this case, the volume concentration was higher in
the cold phase than in the warm phase for the minor mode di-
ameter (at 300–500 nm), while a sharper peak was observed
for the major mode diameter (at around 4–6 µm) in the warm
phase compared to the cold phase. This PM volume size dis-
tribution is typical of urban areas (Vu et al., 2015), and is also
consistent with the findings of a previous study conducted re-
cently by this research group at the same sampling location
(Hasheminassab et al., 2014b).
3.2 Number of factors
In the present work, the PMF model was run several times
using different number of factors, input uncertainty matrices
(as noted in the methods section), and extra modeling un-
certainties to obtain the best and most physically applicable
solution. Additionally, we used several criteria to determine
the best solution resolved by the model, including (1) particle
number size distribution profiles for different factors; (2) vol-
ume size distribution profiles for the resolved factors; (3) pro-
files of auxiliary variables for different factors; (4) contribu-
tion of each factor in different seasons to the total number
concentrations; (5) diurnal variations of each of the resolved
factors in the cold and warm phases; (6) diurnal variations of
each of the resolved factors in weekdays versus weekends;
and (7) correlation between auxiliary variables and the rel-
ative contribution of each of the resolved factors. The six-
factor solution was found to present the most physically ex-
plainable one, and was, therefore, chosen as the final solu-
tion. When the model was run with one fewer factor (i.e.,
five-factor solution), the model could not distinguish the two
traffic factors, and traffic 1 and traffic 2 factors were merged
together. On the other hand, when the model was run with
one more factor (i.e., seven-factor solution), a new factor was
resolved by the model, with a mode diameter between that of
urban background aerosol and secondary aerosol, but without
Fig2
0
2000
4000
6000
8000
10 000
12 000
10 100 1000 10 000
Diameter (nm)
dN
/dL
og
Dp
(P
art
icle c
m
)
Cold Warm
0
5
10
15
20
25
30
10 100 1000 10 000
Diameter (nm)
dV
/dlo
gD
p (
µm
cm
)
Cold Warm
3
3–3
–1
Figure 2. Average number and volume size distributions of all the
input samples to the PMF model in the cold and warm phases (the
graphs represent geometric means±SE).
any distinct diurnal, seasonal, or weekday/weekend trends or
auxiliary variables profile. Therefore, this factor could not
be meaningfully interpreted and identified, prompting us to
choose the six-factor as the optimal solution.
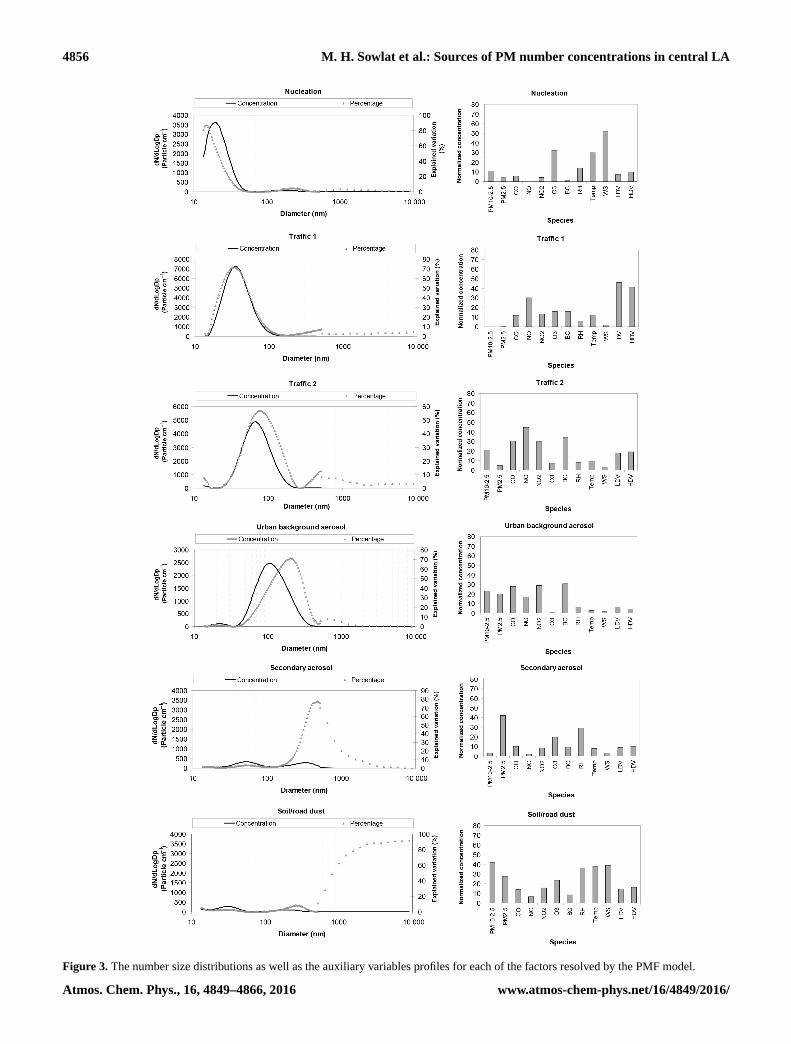
Figure 3 illustrates the number size distributions as well
as the auxiliary variables profiles for each of the factors re-
solved by PMF. Figure 4 indicates the volume size distri-
bution of each factor. In Figs. 3, 4, and S1, the black solid
lines represent absolute concentrations (number or volume)
of each size bin and should be read from the left y axis, while
the grey triangles represent the explained variation of each
size bin and should be read from the right y axis. The relative
contributions (overall, and by cold or warm phases) of each
factor to the total number concentrations are shown in Fig. 5.
Figure 6 illustrates the contribution (particles cm−3) of each
of the PMF-resolved factors to the total number concentra-
tions in the cold and warm phases within a box and whisker
plot. The diurnal variations and the weekday/weekend trends
(geometric means) for each of the factors are illustrated in
Figs. 7 and 8, respectively. The Spearman correlation coeffi-
cient matrix indicating the association between the auxiliary
variables and the factors resolved by the PMF model is also
presented in Table 3.
www.atmos-chem-phys.net/16/4849/2016/ Atmos. Chem. Phys., 16, 4849–4866, 2016
4856 M. H. Sowlat et al.: Sources of PM number concentrations in central LA
Figure 3. The number size distributions as well as the auxiliary variables profiles for each of the factors resolved by the PMF model.
Atmos. Chem. Phys., 16, 4849–4866, 2016 www.atmos-chem-phys.net/16/4849/2016/

M. H. Sowlat et al.: Sources of PM number concentrations in central LA 4857
Table 3. Spearman correlation coefficient matrix, indicating the association between the auxiliary variables and the factors resolved by the
PMF model. R values above 0.5 are in bold.
Species Nucleation Traffic 1 Traffic 2 Urban background aerosol Secondary aerosol Soil/road dust
PM10–2.5 0.17∗ 0.21∗ 0.35∗ 0.27∗ 0.09∗ 0.39∗
PM2.5 −0.24∗ −0.09∗ 0.05∗ 0.33∗ 0.696∗ 0.23∗
CO 0.04 0.41∗ 0.58∗ 0.64∗ 0.17∗ 0.28∗
NO −0.01 0.48∗ 0.59∗ 0.52∗ 0.27∗ 0.24∗
NO2 0.08∗ 0.50∗ 0.60∗ 0.57∗ 0.33∗ 0.14∗
O3 0.57∗ 0.34∗ 0.40∗ −0.35∗ 0.46∗ 0.19∗
BC 0.01 0.53∗ 0.70∗ 0.71∗ 0.13∗ 0.22∗
POC 0.09∗ 0.62∗ 0.28∗ 0.30∗ 0.24∗ 0.29∗
SOC 0.46∗ 0.12∗ 0.43∗ 0.58∗ 0.46∗ 0.20∗
EC 0.17∗ 0.47∗ 0.56∗ 0.60∗ 0.20∗ 0.17∗
RH −0.26∗ −0.32∗ −0.30∗ −0.05∗ 0.43∗ 0.33∗
Temp 0.52∗ −0.23∗ −0.18∗ −0.39∗ 0.34∗ 0.47∗
WS 0.57∗ 0.00 0.07∗ −0.04∗ −0.25∗ 0.62∗
LDVs 0.22∗ 0.70∗ 0.42∗ 0.05∗ 0.01 0.02
HDVs 0.23∗ 0.52 0.43∗ −0.08∗ −0.12∗ −0.01
∗ Indicates R values that are statistically significant (P < 0.05).
Figure 4. Volume size distributions along with the explained variation (%) of each factor profile resolved by the PMF model.
www.atmos-chem-phys.net/16/4849/2016/ Atmos. Chem. Phys., 16, 4849–4866, 2016

4858 M. H. Sowlat et al.: Sources of PM number concentrations in central LA
(a)
Overall
Traffic227.5 %
Nucleation17.3 %
Traffic139.9 %
Secondary Aerosol
2.1 %
Soil/Road Dust1.1 %
Urban Background
12.2 %
(b)
Cold phase
Traffic225.0 %
Nucleation11.7 %
Traffic143.4 %
Secondary Aerosol
2.5 %
Soil/Road Dust0.2 %
Urban Background
17.1 %
(c)
Warm phase
Traffic227.6 %
Nucleation24.0 %
Traffic133.2 %
Urban Background
7.4 %
Soil/Road Dust6.3 %
Secondary Aerosol
1.5 %
8
Figure 5. Relative contribution of each factor to the total number
concentrations: (a) overall phases; (b) cold phase; and (c) warm
phase.
3.3 Factor identification
Factor 1: Factor 1 has a number mode at < 20 nm, a volume
mode at < 20 nm, and contributes 17.3 % (11.7–24 %) to the
total number concentrations (Figs. 3, 4, and 5). This factor
has strong positive (except for RH, with which this factor
has negative correlation) associations with temperature, wind
speed, SOC, and O3 (Table 3), which are also statistically
significant (p< 0.05). These associations are also apparent
from high loadings of temperature, RH, wind speed, and O3
in the auxiliary variables profile (Figs. 3 and S1). The con-
Figure 6. Contribution (particles cm−3) of each of the PMF-
resolved factors to the total number concentrations in the cold and
warm phases.
tribution of this factor to the total number concentration was
also higher in the warm phase than in the cold phase, when
higher temperatures, wind speeds, and solar radiation are ob-
served (Fig. 1); this was the case both in terms of percent
contribution (24 % in the warm phase vs. 11.7 % in the cold
phase) and number concentration (589± 25 particles cm−3
in the cold phase vs. 1153± 28 particles cm−3 in the warm
phase) (Figs. 5 and 6 and Table S1). The diurnal variations
for this factor also revealed a sharp peak in the afternoon
(14:00–18:00 PT; UTC− 8 h) (Fig. 7), which coincides with
very high temperatures, wind speeds, and solar radiation as
well as with minimum RH (Fig. 1). A minor peak was also
observed during morning rush hours (06:00–08:00), which
suggests the partial influence from traffic sources, as also ob-
served by loadings of HDVs and LDVs in this factor (Fig. 3).
However, there was no significant distinction in the diurnal
variation patterns of this factor in weekdays compared to
weekends (Fig. 8).
The above characteristics are all typical of a nucleation
factor, during which new particles are formed via photo-
chemical events under high temperatures, high wind speeds,
and low RH (Beddows et al., 2015; Brines et al., 2015;
Dall’Osto et al., 2012; Vu et al., 2015). The minor peak in
the early morning can also be explained by the cooling, fol-
lowing dilution, of vehicular exhaust emissions, which leads
to the partitioning of semivolatile exhaust gases into the par-
ticle phase; this process is further enhanced by the lower tem-
peratures during that time of day (Harrison et al., 2011; Ntzi-
achristos et al., 2007; Janhäll et al., 2004; Charron and Harri-
son, 2003). Our findings are most specifically consistent with
those of the study of Brines et al. (2015), in which the authors
had reported nucleation as one of the major sources of UFPs
in five high-insolation cities, including Los Angeles, using
the data obtained from the same sampling location. They ob-
served very similar diurnal variation for nucleation, with a
Atmos. Chem. Phys., 16, 4849–4866, 2016 www.atmos-chem-phys.net/16/4849/2016/

M. H. Sowlat et al.: Sources of PM number concentrations in central LA 4859
Figure 7. Diurnal variations (geometric means) of number concentrations (particles cm−3) from each factor resolved by the PMF model in
the cold and warm phases. Error bars correspond to 1 standard error.
minor peak in the early morning and a major peak in the early
afternoon at the same sampling location in Los Angeles.
Factor 2: Factor 2 is mostly represented by particles at
20–40 nm and contributes about 40 % (33.2–43.4 %) to the
total number concentration (Figs. 3 and 5). It also has a vol-
ume concentration peak at around 30–40 nm (Fig. 4). Judg-
ing by the loadings presented in the auxiliary variables profile
(Fig. 3) and correlation coefficients presented in Table 3, this
factor has clear associations with gaseous pollutants (e.g.,
CO, NO, and NO2), BC, EC, and POC (from the scenario
containing EC/OC data (Fig. S1), which themselves are in-
dicators of vehicular emissions (Gu et al., 2011; Ogulei et
al., 2006b). In addition, high species loadings (Fig. 3) and
correlation coefficients (Table 3) of LDV and HDV counts
can also be observed for this factor, indicating the influ-
ence of nearby passing traffic on this factor. The contribu-
tion of this factor to the total number concentration was
also much higher in the cold phase than in the warm phase,
when lower temperatures, wind speeds, and solar radiation
(Fig. 1) lead to increased atmospheric stability and lower
mixing height (Hasheminassab et al., 2014a); this was the
case both in terms of percent contribution (43.4 % in the
cold phase vs. 33.2 % in the warm phase) and number con-
centration (3166± 66 particles cm−3 in the cold phase vs.
1201± 61 particles cm−3 in the warm phase) (Figs. 5 and 6
and Table S1). The diurnal variations also revealed a distinc-
tive pattern peak in the morning rush hours (around 07:00–
08:00) (Fig. 7). The weekday/weekend analysis also indi-
cated that this factor had higher contributions during the
weekdays compared to the weekends (Fig. 8). Therefore, this
factor can be attributed to traffic tailpipe emissions. Previous
source apportionment studies on number size distributions
have also associated such characteristics with fresh vehicu-
lar emissions (Beddows et al., 2015; Dall’Osto et al., 2012;
Vu et al., 2015). This factor is denoted as traffic 1, given that
another factor attributed to traffic emissions was resolved,
www.atmos-chem-phys.net/16/4849/2016/ Atmos. Chem. Phys., 16, 4849–4866, 2016

4860 M. H. Sowlat et al.: Sources of PM number concentrations in central LA
Figure 8. Weekday/weekend analysis of each of the factors resolved by the PMF model (values are geometric means). Error bars correspond
to 1 standard error.
which will be discussed in the following section. The char-
acteristics of this traffic factor are in agreement with what
Brines et al. (2015) reported for five high-insolation cities,
including Los Angeles.
Factor 3: Factor 3 has a major peak in the Aitken mode
(60–100 nm) and contributes 27.5 % (25–27.6 %) to the to-
tal number concentration (Figs. 3 and 5). It also exhibited a
volume concentration peak at around 100 nm (Fig. 4). Judg-
ing by the loadings presented in the auxiliary variables pro-
file (Figs. 3 and S1) and correlation coefficients presented
in Table 3, significant associations can be observed between
this factor and gaseous pollutants (e.g., CO, NO, and NO2),
as well as with BC (and EC from the scenario containing
EC/OC data (Fig. S1)). Although weaker than those of Fac-
tor 2, there are significant positive associations between this
factor and LDV and HDV counts (Fig. 3 and Table 3), sug-
gesting the likely influence of nearby passing traffic. This
factor also had a significantly higher contribution to the
total number concentrations in the cold phase than in the
warm phase (an average of 1755± 56 particles cm−3 in the
cold phase vs. 1059± 43 particles cm−3 in the warm phase
(Fig. 6)), in spite of the fact that its percent contribution to
the total PM number concentrations was comparable in both
phases, and slightly higher in the warm phase (25 % in the
cold phase vs. 27.6 % in the warm phase (Fig. 5)). This is due
mainly to the fact that the contribution of the traffic 1 factor
is so large in the cold phase that it has significantly obscured
the percent contribution of other factors in this phase, even
though their absolute contributions in terms of total number
concentrations were higher in the cold phase.
The diurnal variations for this factor also indicated clear
peaks during the morning rush hours (06:00–08:00) in both
phases, along with another peak at late night during the cold
phase, most likely due to the stagnant atmospheric condi-
tions during this time of the year, which trap the emissions in
lower altitudes (Fig. 7). This diurnal profile suggests a ma-
jor contribution from semivolatile compounds in the atmo-
sphere, particularly in the cold phase, as reflected in the sub-
stantial increase at nighttime. The weekday/weekend anal-
ysis for this factor revealed larger contributions in week-
days than in weekends, especially during daytime hours. The
slightly higher nighttime contribution of this factor at the
Atmos. Chem. Phys., 16, 4849–4866, 2016 www.atmos-chem-phys.net/16/4849/2016/

M. H. Sowlat et al.: Sources of PM number concentrations in central LA 4861
weekends compared to the weekdays can be attributed to the
larger number of within-city journeys being made on holi-
day nights. These levels and trends are, overall, suggestive of
emissions from vehicular sources. However, the larger size
range of this factor compared to factor 2, combined with the
involvement of EC and SOC (as observed from the scenario
containing EC/OC data (Fig. S1)) as well as BC, suggest that
although this factor also originates from traffic, the particles
are older (i.e., more aged) than those observed in factor 2
and are mostly in the Aitken and accumulation modes; there-
fore, it was labeled as traffic 2. This finding is also consistent
with those of the previous studies (e.g., Brines et al., 2015),
in which the authors detected distinct traffic factors (with a
collective relative contribution of approximately 60 % in Los
Angeles at the same sampling site) using a different source
apportionment method, named k means cluster analysis. It
should be noted that it is quite common in source appor-
tionment studies performed on size-segregated PM number
concentrations to detect more than one traffic factor, due pri-
marily to the fact that particle sizes may change, as parti-
cles undergo processes including agglomeration as well as
evaporation or condensation of semivolatile species from or
onto their surface following their release into the atmosphere
(Harrison et al., 2016; Kim et al., 2004; Zhou et al., 2005).
It is also noteworthy that the traffic 2 factor has a slightly
higher HDV loading than traffic 1 factor (Figs. 3 and S1). It
also has a somewhat stronger positive correlation with HDVs
(R = 0.43) than with LDVs (R = 0.41), while the traffic 1
factor has a stronger correlation with LDVs (R = 0.69) than
with HDVs (R = 0.52). Additionally, the stronger correla-
tion of traffic 2 factor with EC and BC compared to traffic
1 leads us to the hypothesis that HDVs might be contribut-
ing more to this factor than LDVs are. Vu et al. (2015) have
also suggested that observing a number concentration mode
at the size range of 60–100 nm can be a result of incomplete
combustion of diesel fuel, consisting of pyrolytic EC and
OC. Other studies have also found two particle modes, or
factors, for traffic-related emissions. Although the emissions
in both of these two modes are believed to come from the
same fleet of vehicles, they have different formation mecha-
nisms and chemistry, with particles associated with the sec-
ond mode (i.e., soot mode) assumed to have an elemental car-
bon core. This is consistent with the findings of the present
study, judging by the mode diameter and high loading of BC,
EC, and OC in the traffic 2 factor (Figs. 3 and S1) and the
strong correlation of this factor with BC, EC, and OC (Ta-
ble 3). Additionally, studies have indicated that a fraction of
diesel PM emissions, which is generally in the range of 50–
200 nm, comprises particles that have an elemental core, with
low-vapor-pressure hydrocarbons and sulfur compounds be-
ing adsorbed on their surface (Burtscher, 2005). Therefore,
it might be likely that this factor represents a higher con-
tribution of HDV emissions; although stronger evidence is
required to confirm this hypothesis.
Factor 4: Factor 4, which contributes 12.2 % (7.4–17.1 %)
to the total number concentration, is represented by a num-
ber mode at around 220 nm and a volume mode at around
250 nm (Figs. 3, 4, and 5). The profile for the auxiliary
variables also indicates high loadings for gaseous pollutants
(e.g., CO, NO, and NO2) and BC (Fig. 3) as well as for EC
and SOC (when the PMF model was run with the EC/OC
data (Fig. S1)). The large correlation coefficients of this fac-
tor with the aforementioned species also confirm its strong
association with these parameters (Table 3). The lower-than-
unity NO /NO2 ratio for this factor also suggests that these
particles are aged compared to the newly formed particles
(Liu et al., 2014). This is also supported by the stronger pos-
itive correlation of this factor with SOC than with POC, sug-
gesting the fact that this factor does not come from direct
emissions and has most likely undergone processes and re-
actions in the atmosphere. As can be inferred from Figs. 5
and 6, the contribution of this factor is significantly higher
in the cold phase than in the warm phase, both in terms
of percent contribution (17.1 % in the cold phase vs. 7.4 %
in the warm phase) and the absolute contribution to the to-
tal number concentration (1200± 41 particles cm−3 in the
cold phase vs. 284± 23 particles cm−3 in the warm phase).
As seen in Fig. 7, the diurnal variations for this factor also
exhibit a clear peak during morning hours, which indicates
higher concentrations when the atmosphere is more stable
and wind speeds are low, especially in the cold phase when
these conditions are even more intense (Fig. 1). The week-
day/weekend analysis also revealed a slightly elevated con-
tribution of this factor to the total number concentrations dur-
ing morning rush hours, especially during the weekdays, sug-
gesting the small influence of traffic emissions on this factor.
Previous studies have indicated that these are characteristics
of the urban background aerosol, as suggested by (Beddows
et al., 2015; Dall’Osto et al., 2012).
Factor 5: Factor 5 has a number and volume mode at
around 500 nm and a minor number mode at 50 nm (look-
ing at the black dots, representing the explained variations)
(Figs. 3 and 4). This factor contributes 2.1 % (1.5–2.5 %) to
the total number concentration (Fig. 5). It is also associated
with high loadings of PM2.5 mass concentration (i.e., ma-
jor contributor to PM2.5 mass), NO, NO2, temperature, RH
(Fig. 3), and SOC (as observed from the scenario containing
EC/OC data (Fig. S1)). This is also supported by the results
of the correlation analysis presented in Table 3, indicating
that this factor has strong positive correlations with PM2.5,
NO, NO2, temperature, RH, and SOC. The overall small con-
tribution of this factor to the total number concentration was
slightly higher in the cold phase than in the warm phase; this
was the case both in terms of percent contribution (2.5 %
in the cold phase vs. 1.5 % in the warm phase) and num-
ber concentration (111± 11 particles cm−3 in the cold phase
vs. 100± 5 particles cm−3 in the warm phase) (Figs. 5 and 6
and Table S1). The diurnal variation for this factor also re-
veals a significant increase during nighttime, especially dur-
www.atmos-chem-phys.net/16/4849/2016/ Atmos. Chem. Phys., 16, 4849–4866, 2016

4862 M. H. Sowlat et al.: Sources of PM number concentrations in central LA
ing the cold phase (Fig. 7). However, the weekday/weekend
analysis did not reveal any distinctive trend pertaining to the
day of the week for this factor (Fig. 8). These pieces of ev-
idence point to secondary aerosols as the most appropriate
title for this factor, which is consistent with the results of
previous PMF studies both on number size distributions and
chemical speciation data (Beddows et al., 2015; Hashemi-
nassab et al., 2014a). Table 3 indicates a much higher cor-
relation of this factor with SOC than POC (R values of 0.5
and 0.2, respectively). The association of this factor with RH
and temperature, along with its higher contribution to parti-
cle number during the cold phase, particularly at night, sup-
ports the hypothesis that this factor likely represents the frac-
tion of aerosols produced by secondary reactions on a re-
gional scale, including ammonium nitrate (whose partition-
ing in the PM phase increases with decreasing temperature
and increased RH), but also secondary organic aerosols from
nighttime and/or aqueous phase reactions, as indicated in ear-
lier studies in this area (Hersey et al., 2011; Venkatachari
et al., 2005). In a previous source apportionment study on
PM2.5 chemical speciation data in downtown Los Angeles,
we also found a similar factor profile, representing a mix-
ture of secondary components (dominated by secondary ni-
trate and SOC) with a higher contribution during the cold
season (Hasheminassab et al., 2014a). Moreover, previous
studies have shown that secondary organic aerosol, formed
at nighttime, together with ammonium nitrate are major con-
tributors to the mass concentrations of PM2.5, which was also
observed in the present work from the high loading of PM2.5
mass concentration in this profile (Fig. 3) (Hasheminassab et
al., 2014a; Arhami et al., 2010; Saffari et al., 2016).
Factor 6: Factor 6 is dominated by particles at around 1 µm
and above (Fig. 3). This factor also had a volume mode at
> 1 µm (Fig. 4). Although this factor contributes only 1.1 %
(0.2–6.3 %) to the total number concentration (Fig. 5), it
is associated with high loadings of coarse PM and PM2.5
(great contributor to mass) (Fig. 3). In addition, high load-
ings of temperature and wind speed were observed for this
factor (Fig. 3). Table 3 also indicates strong correlation of
this factor with coarse PM, PM2.5, temperature, and wind
speed. The contribution of this factor to the total number
concentration was also higher in the warm phase than in
the cold phase, both in terms of percent contribution (0.2 %
in the cold phase vs. 6.3 % in the warm phase) and num-
ber concentration (14± 1 particles cm−3 in the cold phase vs.
243± 3 particles cm−3 in the warm phase) (Figs. 5 and 6 and
Table S1). The diurnal variations for this factor exhibited sig-
nificantly higher contributions during daytime, especially in
the warm phase (Fig. 7), when the atmosphere is unstable,
wind speed is high, and the mixing height is at its maximum
(Fig. 1). However, the weekday/weekend analysis did not re-
veal any distinctive trend pertaining to the day of the week
for this factor (Fig. 8). Based on all of the above-mentioned
characteristics, this factor was named soil/road dust (Gietl et
al., 2010; Harrison et al., 2001, 2012). This is also quite con-
sistent with the findings of the study of Hasheminassab et
al. (2014a), in which the authors apportioned the sources of
ambient fine particulate matter across the state of California.
In that study, the authors observed a lower contribution of the
soil factor to particle mass concentrations in the northern re-
gions of the state of California, mainly because of higher RH
and increased precipitation that inhibit the resuspension of
soil due to strong winds (Harrison et al., 2001). In the present
study, similarly, the contribution of this factor was higher in
the warm phase, when higher temperatures and wind speeds
facilitate the resuspension of soil and dust (Fig. 1).
4 Summary and conclusions
The present study was the first attempt to characterize ma-
jor sources of PM number concentrations and to quantify
their contributions using the PMF receptor model applied
on PM number size distributions in the range of 13 nm to
10 µm combined with several auxiliary variables, including
BC, EC/OC, PM mass, gaseous pollutants, meteorological,
and traffic flow data, in central Los Angeles. The six-factor
solution was found to be the most physically applicable so-
lution for the input data: nucleation, traffic 1, traffic 2, ur-
ban background aerosol, secondary aerosol, and soil. Traffic
sources (1 and 2) were the major contributor to PM number
concentrations, making up to above 60 % of the total num-
ber concentrations combined, with larger contributions in the
cold phase compared to the warm phase, when lower tem-
peratures, wind speeds, and solar radiation lead to increased
atmospheric stability and lower mixing height. The contri-
bution of traffic factors was largest during morning and af-
ternoon rush hours; it was also higher in the weekdays com-
pared to the weekends, as expected. In agreement with the
findings of previous studies in Los Angeles, nucleation was
another major factor contributing to the total number concen-
trations (17 %), with a larger contribution in the warm phase
than in the cold phase. The diurnal variations for this factor
also revealed a sharp peak in the afternoon (14:00–18:00),
which coincides with high temperatures, wind speeds, and
solar radiation as well as with minimum RH, providing ideal
conditions for the occurrence of photochemical nucleation
processes, especially during warmer seasons. Urban back-
ground aerosol, secondary aerosol, and soil, with relative
contributions of approximately 12, 2.1, and 1.1 %, respec-
tively, overall accounted for approximately 15 % of PM num-
ber concentrations. However, these factors dominated the PM
volume and mass concentrations, due mainly to their larger
mode diameters.
The Supplement related to this article is available online
at doi:10.5194/acp-16-4849-2016-supplement.
Atmos. Chem. Phys., 16, 4849–4866, 2016 www.atmos-chem-phys.net/16/4849/2016/

M. H. Sowlat et al.: Sources of PM number concentrations in central LA 4863
Acknowledgements. The authors wish to acknowledge the support
from the USC Viterbi School of Engineering’s PhD fellowship
award.
Edited by: X. Querol
References
Alleman, L. Y., Lamaison, L., Perdrix, E., Robache, A., and Galloo,
J.-C.: PM10 metal concentrations and source identification us-
ing positive matrix factorization and wind sectoring in a French
industrial zone, Atmos. Res., 96, 612–625, 2010.
Arhami, M., Minguillón, M. C., Polidori, A., Schauer, J. J., Delfino,
R. J., and Sioutas, C.: Organic compound characterization and
source apportionment of indoor and outdoor quasi-ultrafine par-
ticulate matter in retirement homes of the Los Angeles Basin,
Indoor Air, 20, 17–30, 2010.
Beddows, D. C. S., Harrison, R. M., Green, D. C., and Fuller, G. W.:
Receptor modelling of both particle composition and size distri-
bution from a background site in London, UK, Atmos. Chem.
Phys., 15, 10107–10125, doi:10.5194/acp-15-10107-2015, 2015.
Brines, M., Dall’Osto, M., Beddows, D. C. S., Harrison, R. M.,
Gómez-Moreno, F., Núñez, L., Artíñano, B., Costabile, F.,
Gobbi, G. P., Salimi, F., Morawska, L., Sioutas, C., and Querol,
X.: Traffic and nucleation events as main sources of ultrafine par-
ticles in high-insolation developed world cities, Atmos. Chem.
Phys., 15, 5929–5945, doi:10.5194/acp-15-5929-2015, 2015.
Brook, R. D., Rajagopalan, S., Pope, C. A., Brook, J. R., Bhatna-
gar, A., Diez-Roux, A. V., Holguin, F., Hong, Y., Luepker, R.
V., and Mittleman, M. A.: Particulate matter air pollution and
cardiovascular disease an update to the scientific statement from
the American Heart Association, Circulation, 121, 2331–2378,
2010.
Brown, S. G., Eberly, S., Paatero, P., and Norris, G. A.: Methods for
estimating uncertainty in PMF solutions: Examples with ambient
air and water quality data and guidance on reporting PMF results,
Sci. Total Environ., 518, 626–635, 2015.
Brunekreef, B. and Forsberg, B.: Epidemiological evidence of ef-
fects of coarse airborne particles on health, Eur. Respir. J., 26,
309–318, 2005.
Burtscher, H.: Physical characterization of particulate emissions
from diesel engines: a review, J. Aerosol Sci., 36, 896–932, 2005.
Charron, A. and Harrison, R. M.: Primary particle formation from
vehicle emissions during exhaust dilution in the roadside atmo-
sphere, Atmos. Environ., 37, 4109–4119, 2003.
Chen, G., Ziemba, L. D., Chu, D. A., Thornhill, K. L., Schuster,
G. L., Winstead, E. L., Diskin, G. S., Ferrare, R. A., Burton, S.
P., Ismail, S., Kooi, S. A., Omar, A. H., Slusher, D. L., Kleb,
M. M., Reid, J. S., Twohy, C. H., Zhang, H., and Anderson, B.
E.: Observations of Saharan dust microphysical and optical prop-
erties from the Eastern Atlantic during NAMMA airborne field
campaign, Atmos. Chem. Phys., 11, 723–740, doi:10.5194/acp-
11-723-2011, 2011.
Chen, L. C., Peoples, S. M., and Amdur, M. O.: Pulmonary effects
of sulfur oxides on the surface of copper oxide aerosol, Am. Ind.
Hyg. Assoc. J., 52, 187–191, 1991.
Covert, D. S., Heintzenberg, J., and Hansson, H.-C.: Electro-optical
detection of external mixtures in aerosols, Aerosol Sci. Tech., 12,
446–456, 1990.
Dall’Osto, M., Beddows, D. C. S., Pey, J., Rodriguez, S., Alastuey,
A., Harrison, R. M., and Querol, X.: Urban aerosol size dis-
tributions over the Mediterranean city of Barcelona, NE Spain,
Atmos. Chem. Phys., 12, 10693–10707, doi:10.5194/acp-12-
10693-2012, 2012.
Davis, D. A., Bortolato, M., Godar, S. C., Sander, T. K., Iwata, N.,
Pakbin, P., Shih, J. C., Berhane, K., McConnell, R., and Sioutas,
C.: Prenatal exposure to urban air nanoparticles in mice causes
altered neuronal differentiation and depression-like responses,
PLoS One, 8, e64128, doi:10.1371/journal.pone.0064128, 2013.
Day, M. C., Zhang, M., and Pandis, S. N.: Evaluation of the ability
of the EC tracer method to estimate secondary organic carbon,
Atmos. Environ., 112, 317–325, 2015.
Delfino, R. J., Sioutas, C., and Malik, S.: Potential role of ultrafine
particles in associations between airborne particle mass and car-
diovascular health, Environ. Health Persp., 113, 934–946, 2005.
Delfino, R. J., Tjoa, T., Gillen, D. L., Staimer, N., Polidori,
A., Arhami, M., Jamner, L., Sioutas, C., and Longhurst, J.:
Traffic-related Air Pollution and Blood Pressure in Elderly Sub-
jects With Coronary Artery Disease, Epidemiology (Cambridge,
Mass.), Vol. 21, doi:10.1097/EDE.0b013e3181d5e19b, 2010.
Dockery, D. W. and Stone, P. H.: Cardiovascular risks from fine
particulate air pollution, N. Engl. J. Med., 356, 511–513, 2007.
Donaldson, K., Li, X. Y., and MacNee, W.: Ultrafine (nanometre)
particle mediated lung injury, J. Aerosol Sci., 29, 553–560, 1998.
Dreher, K. L., Jaskot, R. H., Lehmann, J. R., Richards, J. H., Ghio,
J. K. M. A. J., and Costa, D. L.: Soluble transition metals me-
diate residual oil fly ash induced acute lung injury, J. Toxicol.
Env. Heal. A, 50, 285–305, 1997.
Dutton, S. J., Vedal, S., Piedrahita, R., Milford, J. B., Miller, S. L.,
and Hannigan, M. P.: Source apportionment using positive ma-
trix factorization on daily measurements of inorganic and organic
speciated PM2.5, Atmos. Environ., 44, 2731–2741, 2010.
Ebert, M., Weinbruch, S., Hoffmann, P., and Ortner, H. M.: The
chemical composition and complex refractive index of rural and
urban influenced aerosols determined by individual particle anal-
ysis, Atmos. Environ., 38, 6531–6545, 2004.
Friend, A. J., Ayoko, G. A., Jayaratne, E. R., Jamriska, M., Hopke,
P. K., and Morawska, L.: Source apportionment of ultrafine and
fine particle concentrations in Brisbane, Australia, Environ. Sci.
Pollut. R., 19, 2942–2950, 2012.
Friend, A. J., Ayoko, G. A., Jager, D., Wust, M., Jayaratne, E. R.,
Jamriska, M., and Morawska, L.: Sources of ultrafine particles
and chemical species along a traffic corridor: comparison of the
results from two receptor models, Environ. Chem., 10, 54–63,
2013.
Gauderman, W. J., Urman, R., Avol, E., Berhane, K., McConnell,
R., Rappaport, E., Chang, R., Lurmann, F., and Gilliland, F.: As-
sociation of improved air quality with lung development in chil-
dren, N. Engl. J. Med., 372, 905–913, 2015.
Geller, M. D., Fine, P. M., and Sioutas, C.: The relationship between
real-time and time-integrated coarse (2.5–10 µm), intermodal (1–
2.5 µm), and fine (< 2.5 µm) particulate matter in the Los Ange-
les Basin, J. Air Waste Manage., 54, 1029–1039, 2004.
Gietl, J. K., Lawrence, R., Thorpe, A. J., and Harrison, R. M.: Iden-
tification of brake wear particles and derivation of a quantitative
www.atmos-chem-phys.net/16/4849/2016/ Atmos. Chem. Phys., 16, 4849–4866, 2016

4864 M. H. Sowlat et al.: Sources of PM number concentrations in central LA
tracer for brake dust at a major road, Atmos. Environ., 44, 141–
146, 2010.
Gu, J., Pitz, M., Schnelle-Kreis, J., Diemer, J., Reller, A., Zimmer-
mann, R., Soentgen, J., Stoelzel, M., Wichmann, H. E., and Pe-
ters, A.: Source apportionment of ambient particles: comparison
of positive matrix factorization analysis applied to particle size
distribution and chemical composition data, Atmos. Environ., 45,
1849–1857, 2011.
Ham, W. A. and Kleeman, M. J.: Size-resolved source apportion-
ment of carbonaceous particulate matter in urban and rural sites
in central California, Atmos. Environ., 45, 3988–3995, 2011.
Hänel, G.: The real part of the mean complex refractive index and
the mean density of samples of atmospheric aerosol particles,
Tellus, 20, 371–379, 1968.
Harrison, R. M. and Yin, J.: Sources and processes affecting car-
bonaceous aerosol in central England, Atmos. Environ., 42,
1413–1423, 2008.
Harrison, R. M., Yin, J., Mark, D., Stedman, J., Appleby, R. S.,
Booker, J., and Moorcroft, S.: Studies of the coarse particle (2.5–
10 µm) component in UK urban atmospheres, Atmos. Environ.,
35, 3667–3679, 2001.
Harrison, R. M., Beddows, D. C. S., and Dall’Osto, M.: PMF analy-
sis of wide-range particle size spectra collected on a major high-
way, Environ. Sci. Technol., 45, 5522–5528, 2011.
Harrison, R. M., Jones, A. M., Gietl, J., Yin, J., and Green, D.
C.: Estimation of the contributions of brake dust, tire wear, and
resuspension to nonexhaust traffic particles derived from atmo-
spheric measurements, Environ. Sci. Technol., 46, 6523–6529,
2012.
Harrison, R. M., Jones, A. M., Beddows, D. C. S., Dall’Osto, M.,
and Nikolova, I.: Evaporation of traffic-generated nanoparticles
during advection from source, Atmos. Environ., 125, 1–7, 2016.
Hasheminassab, S., Daher, N., Schauer, J. J., and Sioutas, C.: Source
apportionment and organic compound characterization of ambi-
ent ultrafine particulate matter (PM) in the Los Angeles Basin,
Atmos. Environ., 79, 529–539, 2013.
Hasheminassab, S., Daher, N., Saffari, A., Wang, D., Ostro,
B. D., and Sioutas, C.: Spatial and temporal variability of
sources of ambient fine particulate matter (PM2.5) in Califor-
nia, Atmos. Chem. Phys., 14, 12085–12097, doi:10.5194/acp-14-
12085-2014, 2014a.
Hasheminassab, S., Pakbin, P., Delfino, R. J., Schauer, J. J., and
Sioutas, C.: Diurnal and seasonal trends in the apparent density
of ambient fine and coarse particles in Los Angeles, Environ.
Pollut., 187, 1–9, 2014b.
Hering, S. V. and McMurry, P. H.: Optical counter response to
monodisperse atmospheric aerosols, Atmos. Environ., 25, 463–
468, 1991.
Hersey, S. P., Craven, J. S., Schilling, K. A., Metcalf, A. R.,
Sorooshian, A., Chan, M. N., Flagan, R. C., and Seinfeld, J. H.:
The Pasadena Aerosol Characterization Observatory (PACO):
chemical and physical analysis of the Western Los Angeles basin
aerosol, Atmos. Chem. Phys., 11, 7417–7443, doi:10.5194/acp-
11-7417-2011, 2011.
Hudda, N., Cheung, K., Moore, K. F., and Sioutas, C.: Inter-
community variability in total particle number concentrations
in the eastern Los Angeles air basin, Atmos. Chem. Phys., 10,
11385–11399, doi:10.5194/acp-10-11385-2010, 2010.
Hwang, I. and Hopke, P. K.: Comparison of source apportionments
of fine particulate matter at two San Jose Speciation Trends Net-
work sites, J. Air Waste Manage., 56, 1287–1300, 2006.
Janhäll, S., Jonsson, Å. M., Molnár, P., Svensson, E. A., and Hal-
lquist, M.: Size resolved traffic emission factors of submicrome-
ter particles, Atmos. Environ., 38, 4331–4340, 2004.
Kasumba, J., Hopke, P. K., Chalupa, D. C., and Utell, M. J.: Com-
parison of sources of submicron particle number concentrations
measured at two sites in Rochester, NY, Sci. Total Environ., 407,
5071–5084, 2009.
Kent, G. S., Yue, G. K., Farrukh, U. O., and Deepak, A.: Model-
ing atmospheric aerosol backscatter at CO2 laser wavelengths.
1: Aerosol properties, modeling techniques, and associated prob-
lems, Appl. Optics, 22, 1655–1665, 1983.
Kim, E. and Hopke, P. K.: Source characterization of ambient fine
particles in the Los Angeles basin, J. Environ. Eng. Sci., 6, 343–
353, 2007.
Kim, E., Hopke, P. K., Larson, T. V., and Covert, D. S.: Analysis
of ambient particle size distributions using unmix and positive
matrix factorization, Environ. Sci. Technol., 38, 202–209, 2004.
Kim, E., Turkiewicz, K., Zulawnick, S. A., and Magliano, K. L.:
Sources of fine particles in the South Coast area, California, At-
mos. Environ., 44, 3095–3100, 2010.
Krecl, P., Hedberg Larsson, E., Ström, J., and Johansson, C.: Con-
tribution of residential wood combustion and other sources to
hourly winter aerosol in Northern Sweden determined by pos-
itive matrix factorization, Atmos. Chem. Phys., 8, 3639–3653,
doi:10.5194/acp-8-3639-2008, 2008.
Li, N., Sioutas, C., Cho, A., Schmitz, D., Misra, C., Sempf, J.,
Wang, M., Oberley, T., Froines, J., and Nel, A.: Ultrafine particu-
late pollutants induce oxidative stress and mitochondrial damage,
Environ. Health Persp., 111, 455–460, 2003.
Lighty, J. S., Veranth, J. M., and Sarofim, A. F.: Combustion
aerosols: factors governing their size and composition and impli-
cations to human health, J. Air Waste Manage., 50, 1565–1618,
2000.
Lim, H.-J. and Turpin, B. J.: Origins of primary and secondary or-
ganic aerosol in Atlanta: Results of time-resolved measurements
during the Atlanta supersite experiment, Environ. Sci. Technol.,
36, 4489–4496, 2002.
Lim, J.-M., Lee, J.-H., Moon, J.-H., Chung, Y.-S., and Kim, K.-H.:
Source apportionment of PM10 at a small industrial area using
Positive Matrix Factorization, Atmos. Res., 95, 88–100, 2010.
Lim, S. S., Vos, T., Flaxman, A. D., Danaei, G., Shibuya, K., Adair-
Rohani, H., AlMazroa, M. A., Amann, M., Anderson, H. R., and
Andrews, K. G.: A comparative risk assessment of burden of
disease and injury attributable to 67 risk factors and risk factor
clusters in 21 regions, 1990–2010: a systematic analysis for the
Global Burden of Disease Study 2010, Lancet, 380, 2224–2260,
2013.
Liu, Z. R., Hu, B., Liu, Q., Sun, Y., and Wang, Y. S.: Source ap-
portionment of urban fine particle number concentration during
summertime in Beijing, Atmos. Environ., 96, 359–369, 2014.
Miller, K. A., Siscovick, D. S., Sheppard, L., Shepherd, K., Sul-
livan, J. H., Anderson, G. L., and Kaufman, J. D.: Long-term
exposure to air pollution and incidence of cardiovascular events
in women, N. Engl. J. Med., 356, 447–458, 2007.
Moore, K. F., Ning, Z., Ntziachristos, L., Schauer, J. J., and Sioutas,
C.: Daily variation in the properties of urban ultrafine aerosol –
Atmos. Chem. Phys., 16, 4849–4866, 2016 www.atmos-chem-phys.net/16/4849/2016/

M. H. Sowlat et al.: Sources of PM number concentrations in central LA 4865
Part I: Physical characterization and volatility, Atmos. Environ.,
41, 8633-8646, 2007.
Na, K., Sawant, A. A., Song, C., and Cocker, D. R.: Primary and
secondary carbonaceous species in the atmosphere of Western
Riverside County, California, Atmos. Environ., 38, 1345–1355,
2004.
Nel, A., Xia, T., Mädler, L., and Li, N.: Toxic potential of materials
at the nanolevel, Science, 311, 622–627, 2006.
Norris, G., Duvall, R., Brown, S., and Bai, S.: EPA Positive Ma-
trix Factorization (PMF) 5.0 Fundamentals and User Guide, U.S.
Environmental Protection Agency, Office of Research and De-
velopment, Washington, DC 20460, 2014.
Ntziachristos, L., Ning, Z., Geller, M. D., and Sioutas, C.: Parti-
cle concentration and characteristics near a major freeway with
heavy-duty diesel traffic, Environ. Sci. Technol., 41, 2223–2230,
2007.
Oberdörster, G., Ferin, J., and Lehnert, B. E.: Correlation between
particle size, in vivo particle persistence, and lung injury, Envi-
ron. Health Persp., 102, 173–179, 1994.
Oberdörster, G., Sharp, Z., Atudorei, V., Elder, A., Gelein, R.,
Lunts, A., Kreyling, W., and Cox, C.: Extrapulmonary translo-
cation of ultrafine carbon particles following whole-body inhala-
tion exposure of rats, J. Toxicol. Env. Heal. A, 65, 1531–1543,
2002.
Ogulei, D., Hopke, P. K., and Wallace, L. A.: Analysis of indoor
particle size distributions in an occupied townhouse using posi-
tive matrix factorization, Indoor Air, 16, 204–215, 2006a.
Ogulei, D., Hopke, P. K., Zhou, L., Pancras, J. P., Nair, N., and
Ondov, J. M.: Source apportionment of Baltimore aerosol from
combined size distribution and chemical composition data, At-
mos. Environ., 40, 396–410, 2006b.
Ogulei, D., Hopke, P. K., Chalupa, D. C., and Utell, M. J.: Model-
ing source contributions to submicron particle number concen-
trations measured in Rochester, New York, Aerosol Sci. Tech.,
41, 179–201, 2007.
Paatero, P.: Least squares formulation of robust non-negative factor
analysis, Chemometr. Intell. Lab., 37, 23–35, 1997.
Paatero, P. and Tapper, U.: Analysis of different modes of factor
analysis as least squares fit problems, Chemometr. Intell. Lab.,
18, 183–194, 1993.
Paatero, P. and Tapper, U.: Positive matrix factorization: A non-
negative factor model with optimal utilization of error estimates
of data values, Environmetrics, 5, 111–126, 1994.
Paatero, P., Eberly, S., Brown, S. G., and Norris, G. A.: Methods for
estimating uncertainty in factor analytic solutions, Atmos. Meas.
Tech., 7, 781–797, doi:10.5194/amt-7-781-2014, 2014.
Peters, A., Wichmann, H. E., Tuch, T., Heinrich, J., and Heyder, J.:
Respiratory effects are associated with the number of ultrafine
particles, Am. J. Resp. Crit. Care, 155, 1376–1383, 1997.
Polidori, A., Arhami, M., Sioutas, C., Delfino, R. J., and Allen, R.:
Indoor/outdoor relationships, trends, and carbonaceous content
of fine particulate matter in retirement homes of the Los Angeles
basin, J. Air Waste Manage., 57, 366–379, 2007.
Pope, C. A., III, Burnett, R. T., Thun, M. J., Calle, E. E., Krewski,
D., Ito, K., and Thurston, G. D.: Lung cancer, cardiopulmonary
mortality, and long-term exposure to fine particulate air pollu-
tion, Jama, 287, 1132–1141, 2002.
Pope, C. A., Burnett, R. T., Thurston, G. D., Thun, M. J., Calle,
E. E., Krewski, D., and Godleski, J. J.: Cardiovascular mortality
and long-term exposure to particulate air pollution epidemiolog-
ical evidence of general pathophysiological pathways of disease,
Circulation, 109, 71–77, 2004.
Reff, A., Eberly, S. I., and Bhave, P. V.: Receptor modeling of am-
bient particulate matter data using positive matrix factorization:
review of existing methods, J. Air Waste Manage., 57, 146–154,
2007.
Reid, J. S., Cahill, T. A., Wakabayashi, P. H., and Dunlap, M. R.:
Geometric/aerodynamic equivalent diameter ratios of ash aggre-
gate aerosols collected in burning Kuwaiti well fields, Atmos.
Environ., 28, 2227–2234, 1994.
Saffari, A., Hasheminassab, S., Shafer, M. M., Schauer, J. J.,
Chatila, T. A., and Sioutas, C.: Nighttime aqueous-phase sec-
ondary organic aerosols in Los Angeles and its implication for
fine particulate matter composition and oxidative potential, At-
mos. Environ., 133, 112–122, 2016.
Schauer, J. J. and Cass, G. R.: Source apportionment of wintertime
gas-phase and particle-phase air pollutants using organic com-
pounds as tracers, Environ. Sci. Technol., 34, 1821–1832, 2000.
Singh, M., Phuleria, H. C., Bowers, K., and Sioutas, C.: Seasonal
and spatial trends in particle number concentrations and size dis-
tributions at the children’s health study sites in Southern Califor-
nia, J. Expo. Sci. Env. Epid., 16, 3–18, 2006.
Sioutas, C., Delfino, R. J., and Singh, M.: Exposure assessment
for atmospheric ultrafine particles (UFPs) and implications in
epidemiologic research, Environ. Health Persp., 113, 947–955,
2005.
Sofowote, U. M., Su, Y., Dabek-Zlotorzynska, E., Rastogi, A. K.,
Brook, J., and Hopke, P. K.: Sources and temporal variations
of constrained PMF factors obtained from multiple-year recep-
tor modeling of ambient PM2.5 data from five speciation sites in
Ontario, Canada, Atmos. Environ., 108, 140–150, 2015.
Sowlat, M. H., Naddafi, K., Yunesian, M., Jackson, P. L., and Shah-
savani, A.: Source apportionment of total suspended particulates
in an arid area in southwestern Iran using positive matrix factor-
ization, B. Environ. Contam. Tox., 88, 735–740, 2012.
Sowlat, M. H., Naddafi, K., Yunesian, M., Jackson, P. L., Lotfi, S.,
and Shahsavani, A.: PM10 source apportionment in Ahvaz, Iran,
using positive matrix factorization, CLEAN Soil Air Water, 41,
1143–1151, 2013.
Stolzenburg, M., Kreisberg, N., and Hering, S.: Atmospheric size
distributions measured by differential mobility optical particle
size spectrometry, Aerosol Sci. Tech., 29, 402–418, 1998.
Strader, R., Lurmann, F., and Pandis, S. N.: Evaluation of secondary
organic aerosol formation in winter, Atmos. Environ., 33, 4849–
4863, 1999.
Strawa, A. W., Elleman, R., Hallar, A. G., Covert, D., Ricci, K.,
Provencal, R., Owano, T. W., Jonsson, H. H., Schmid, B., and
Luu, A. P.: Comparison of in situ aerosol extinction and scat-
tering coefficient measurements made during the Aerosol Inten-
sive Operating Period, J. Geophys. Res.-Atmos., 111, D05S03,
doi:10.1029/2005JD006056, 2006.
Thimmaiah, D., Hovorka, J., and Hopke, P. K.: Source apportion-
ment of winter submicron Prague aerosols from combined par-
ticle number size distribution and gaseous composition data,
Aerosol Air Qual. Res., 9, 209–236, 2009.
Venkatachari, P., Hopke, P. K., Grover, B. D., and Eatough, D. J.:
Measurement of particle-bound reactive oxygen species in Ru-
bidoux aerosols, J. Atmos. Chem., 50, 49–58, 2005.
www.atmos-chem-phys.net/16/4849/2016/ Atmos. Chem. Phys., 16, 4849–4866, 2016

4866 M. H. Sowlat et al.: Sources of PM number concentrations in central LA
Venkataraman, C.: Comparison of particle lung doses from the fine
and coarse fractions of urban PM-10 aerosols, Inhal. Toxicol.,
11, 151–169, 1999.
Vu, T. V., Delgado-Saborit, J. M., and Harrison, R. M.: Review:
Particle number size distributions from seven major sources and
implications for source apportionment studies, Atmos. Environ.,
122, 114–132, 2015.
Watson, J. G., Chow, J. C., Lowenthal, D. H., Stolzenburg, M. R.,
Kreisberg, N. M., and Hering, S. V.: Particle size relationships at
the Fresno supersite, J. Air Waste Manage., 52, 822–827, 2002.
Wichmann, H.-E., Spix, C., Tuch, T., Wölke, G., Peters, A., Hein-
rich, J., Kreyling, W. G., and Heyder, J.: Daily mortality and fine
and ultrafine particles in Erfurt, Germany part I: role of particle
number and particle mass, Research report (Health Effects Insti-
tute), 98, 5–86, 2000.
Yue, W., Stölzel, M., Cyrys, J., Pitz, M., Heinrich, J., Kreyling, W.
G., Wichmann, H. E., Peters, A., Wang, S., and Hopke, P. K.:
Source apportionment of ambient fine particle size distribution
using positive matrix factorization in Erfurt, Germany, Sci. Total
Environ., 398, 133–144, 2008.
Zhang, K. M., Wexler, A. S., Niemeier, D. A., Zhu, Y. F., Hinds,
W. C., and Sioutas, C.: Evolution of particle number distribu-
tion near roadways. Part III: Traffic analysis and on-road size re-
solved particulate emission factors, Atmos. Environ., 39, 4155–
4166, 2005.
Zhou, L., Kim, E., Hopke, P. K., Stanier, C. O., and Pandis, S.:
Advanced factor analysis on Pittsburgh particle size-distribution
data special issue of aerosol science and technology on findings
from the Fine Particulate Matter Supersites Program, Aerosol
Sci. Tech., 38, 118–132, 2004.
Zhou, L., Hopke, P. K., Stanier, C. O., Pandis, S. N., Ondov, J.
M., and Pancras, J. P.: Investigation of the relationship between
chemical composition and size distribution of airborne particles
by partial least squares and positive matrix factorization, J. Geo-
phys. Res.-Atmos., 110, D07S18, doi:10.1029/2004JD005050,
2005.
Atmos. Chem. Phys., 16, 4849–4866, 2016 www.atmos-chem-phys.net/16/4849/2016/