sources of air pollution in india - climate studies | a conservative inr 20l per premature life lost...
TRANSCRIPT

Sources of Air Pollution in India
2010

gbd_maps_2016.wifi
6tScYjoG1

Vehicle exhaust Road dust
Power plants Industrial
Diesel gensets Residential
Waste burning
Non-anthropogenic

Vehicle exhaust

National Transport Emissions

Delhi Transport Emissions

In Delhi, 20 min of idling for cars = Rs. 1 crores in fuel losses (~$150,000) per day
Driving time is spent idling for passenger
cars
Ludhiana Delhi Vizag
Goel & Guttikunda, 2014
On-road Idling Pollution
20%


“Pollution Under Check” (PUC) Data Analysis
Petrol
Car
Motorcycle
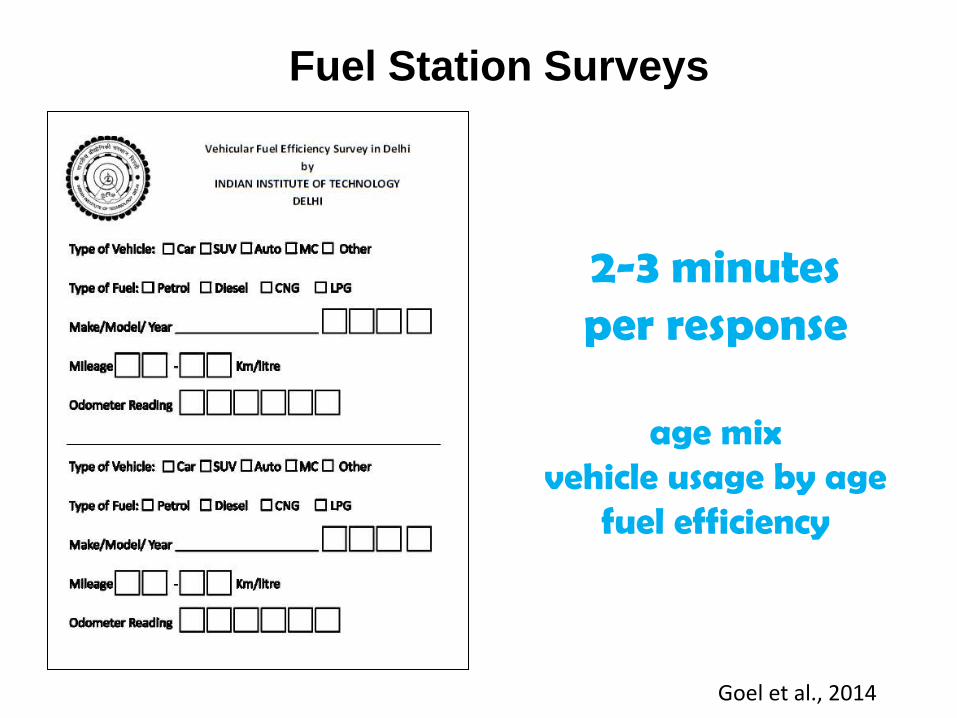
Fuel Station Surveys
2-3 minutes per response
age mix
vehicle usage by age fuel efficiency
Goel et al., 2014

Delhi On-road Emissions
Atmospheric Environment (2015)

National Transport Emissions 2030 2
01
2
20
30
Planning Commissions NDTPC report; Guttikunda and Mohan, 2013 More @http://www.urbanemissions.info

Coal, Ore, Cement, Fertilizers, Salt, Sugar
Road vs. Rail Freight Movement??
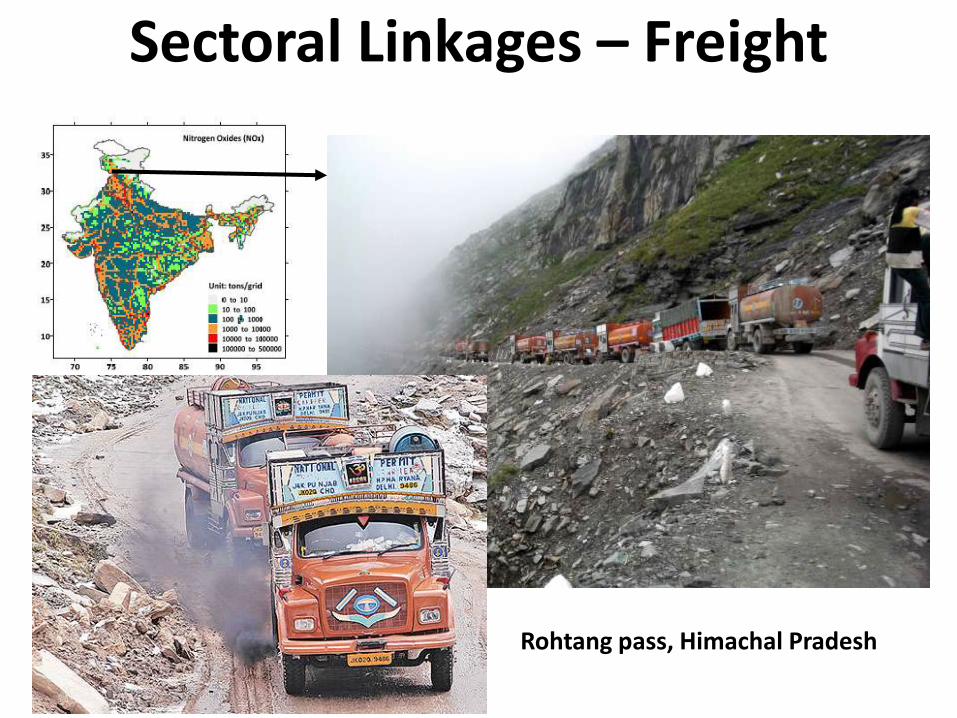
Rohtang pass, Himachal Pradesh
Sectoral Linkages – Freight

Future Scenarios for Transport Emissions

Power plants

2017 2020
2025 2030

Coal-fired thermal power plants
2013 2014

Coal-fired thermal power plants
Draft standards proposed in April, 2015 Amended in December, 2015
Atmospheric Environment (2014)
30 100 100 0.03
old
new
old
new
old
new

HYSPLIT Animations of Forward Trajectories Mumbai Cluster (State: Maharashtra)
April, 2010 July, 2010
October, 2010
The 24 lines are trajectory lines started at
every hour of the day. These are trajectories
for one day of each month and indicative of
the flow of emissions from power plant
clusters and do not represent the strength
of the emissions or dispersed pollution. All
the trajectories are started at 275m above
ground level.
Atmospheric Environment (2014)

Assuming a conservative INR 20L per premature life lost Health impacts using GBD methodology
Coal-fired thermal power plants
Average FGD cost = 0.15 cents per kWh generated India coal based generation average = 1.05 billion MWh Which translates to a required cost = 1.6 billion USD = 9,500 crores
Average solar cost Rs.15 per kWh (over 25 year generation period) 2030 demand is expected to triple; if 1/3rd is replaced with solar Cost = INR 15,75,000 crores (or INR 63,000 crores per year)

Telecom towers
TRAI Green report
40% power from grid
60% from diesel
Estimates 2 billion
litres of annual
diesel consumption
Total number of mobile connections 950 million INR 1 per month cess per connection = INR 1140 crores per year

Brick kilns

Brick Kilns - still an Urban problem
Advected pollution
Moved but not
cleaned
Guttikunda et al. (2013) “Emissions inventory and health impact analysis for Delhi, India” @ Atmospheric Environment

This is still an Urban problem
Moved but not
cleaned
Guttikunda et al. (2015) “Characterizing emissions in Chennai and Visakhapatnam, India” @ Air Quality Atmosphere & Health

What is burning at the kilns?
Workers pushing a
mixture of agri-waste
and powdered coal at
a kiln outside Delhi,
India

What else is burning at the kilns?
Source: Charles W. Schmidt (2013), Environ Health Perspect; DOI:10.1289/ehp.121-A242
A worker soaks dry cow dung in a mixture of kerosene
and gasoline at a kiln near Amritsar, India.

Quarries outside Pune city

Quarries outside Pune city

Quarries outside Pune city
Unofficial sectors??

Residential
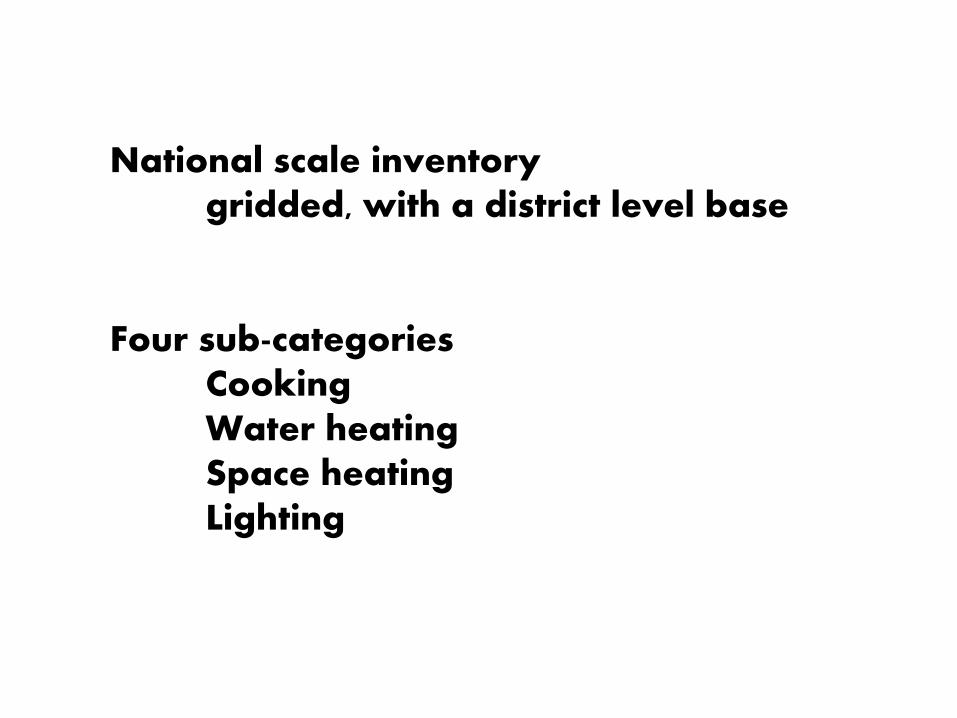
National scale inventory gridded, with a district level base Four sub-categories Cooking Water heating Space heating Lighting

Grid size is 0.25 degrees (~25km)

all the districts (640) are mapped to the census 2011 codes

Each grid is tagged with overlapping district and state code Intersecting grids are tagged multiple times, based on the overlapping district area
Gujarat
Madhya Pradesh
Maharashtra

Each grid is tagged urban or rural, based on the identified built-up area (database downloaded from U.of.Wisconsin SAGE program)
Gujarat
Madhya Pradesh
Maharashtra

Grid level population data is obtained from CEISEN GRUMP and Landscan 2013 and adjusted to the Census 2011 levels at the state level
(district to grid area overlaps was used for intersections)
Gujarat
Madhya Pradesh
Maharashtra

For each district, CENSUS 2011 provides share of HH’s using different fuels – segregated into urban/rural areas and inside/outside cooking
Gujarat
Madhya Pradesh
Maharashtra

an example of the census file http://www.censusindia.gov.in/DigitalLibrary/Tables.aspx
cooking category – HH10
fuel classifications Firewood, crop residue, cow dung, coal or charcoal, kerosene, LPG, biogas,
electricity, and others
cooking classifications cooking inside the house, cooking outside the house, and no cooking
regional classifications rural vs. urban areas within the district

an example of the census file http://www.censusindia.gov.in/DigitalLibrary/Tables.aspx
lighting category – HH7
fuel classifications kerosene, electricity, solar, others
regional classifications rural vs. urban areas within the district

an example of the census file http://www.censusindia.gov.in/DigitalLibrary/Tables.aspx
heating category – HH10
fuel classifications Firewood, crop residue, cow dung, coal or charcoal, kerosene, LPG, biogas,
electricity, and others
regional classifications rural vs. urban areas within the district

an example of the census file http://www.censusindia.gov.in/DigitalLibrary/Tables.aspx
population clause – C-14
regional classifications rural vs. urban areas within the district
age classifications 1yr and 5yr groups within the district

surface temperature – WRF 2012 Day and night time monthly averages (deg C)

Residential PM2.5 Emissions – India 2013
CK = cooking; LG = lighting; WH = water heating; SH = space heating

Residential BC Emissions – India 2013
CK = cooking; LG = lighting; WH = water heating; SH = space heating

gridded water heating emissions
OCT NOV DEC
JAN FEB MAR

gridded water heating emissions
JUL AUG SEP
APR MAY JUN

gridded space heating emissions
JAN FEB MAR
APR MAY JUN

gridded space heating emissions
JUL AUG SEP
OCT NOV DEC

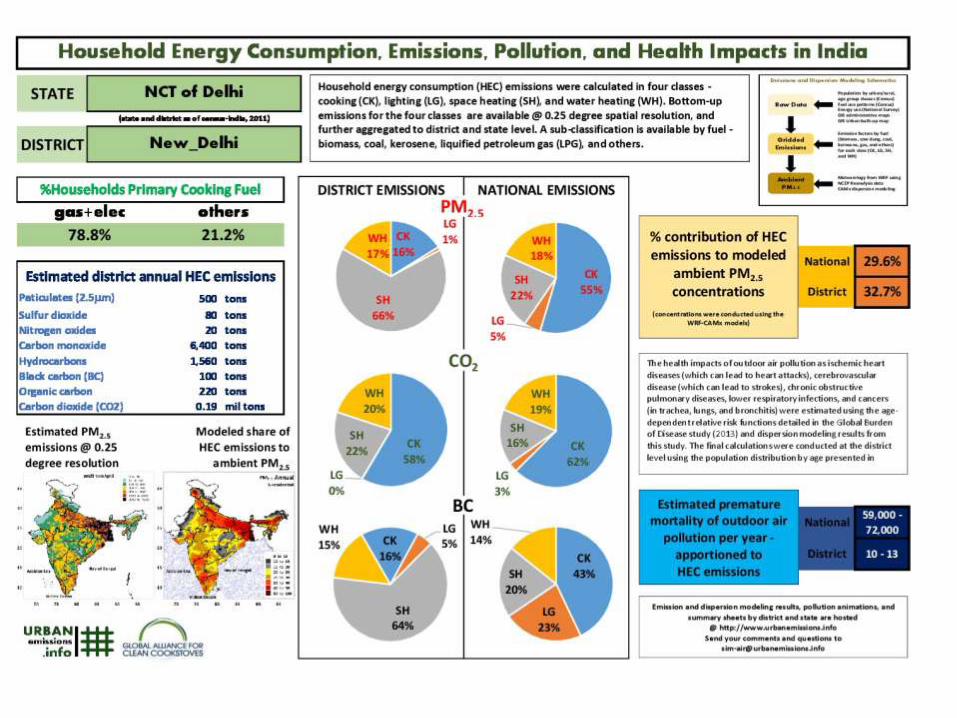
Share of HH fuel consumption to outdoor PM2.5 pollution


Waste burning

UCAR

UEinfo


Non-anthropogenic


regional dispersion modeling
WRF and CAMx setup
simulations in hindcast and forecast mode

