south florida demographics part ii how south florida compares to its metro peers on census 2000...
TRANSCRIPT

South Florida Demographics Part IIHow South Florida Compares To Its Metro Peers On
Census 2000 Socio-Economic Status Indicators

Presented By: Dr. John P. McHenryPresident, Demographic Data For Decision-Making, Inc.
305-591-1224 [email protected]
At the Urban Land Institute’s
2nd Annual State of the Region Economic Symposium, Broward County Convention Center: Thursday, November 7, 2002

MSA Review

History
• In 1940’s, no countrywide statistical standard for “metropolitan” areas
• Variety of definitions used
• Bureau of Budget developed “standard metropolitan area” definition in time for 1950 U.S. Census

General Metro Concept
• “An area containing a recognized population nucleus and adjacent communities that have a high degree of integration with that nucleus.”
• Source: Federal Register / Vol. 65, No. 249/Wednesday, December 27, 2000/ Notes
• Provide nationally consistent definitions for collecting, tabulating, and publishing federal data
• Definitions based on “applying published standards to Census data”
• OK as info in debate on public policies or used for statistical comparisons
Purpose of Metro Definition (According to Office of Management and Budget)

Improper Use of Metro Definition(According to OMB)
• Implement non-statistical programs
• Determine program eligibility

Other Considerations
• General OMB concerns:– Definitions do not necessarily equate to
urban/rural classification• Non-metro areas not all rural;
• Metro areas not all urban
– County-level definitions (Metro area components are counties) mask local variability and are too blunt a definitional instrument

Changes in Metro Terminology
• 1949 = Standard Metropolitan Area (SMA)
• 1959 = Standard Metropolitan Statistical area (SMSA)
• 1983 = Metropolitan Statistical Area (MSA)
• 1990 = Metropolitan Area (MA), including, in order of increasing size by 1999:– MSA (Metropolitan Statistical Area), N=261
– PMSA (Primary Metropolitan Statistical Area), N=76
– CMSA (Consolidated Metropolitan Statistical Area), N=19
• 2003 (proposed)– MSA = Metropolitan Statistical Area (again)
– CSA = Combined Statistical Area

Census 2000: Top 50 MA’sPop
2000 Rank April 1, 2000 April 1, 1990 Number Percent
1 New York--Northern New Jersey--Long Island, NY--NJ--CT--PA CMSA21,199,865 19,549,649 1,650,216 8.4% 5602
2 Los Angeles--Riverside--Orange County, CA CMSA 16,373,645 14,531,529 1,842,116 12.7% 4472
3 Chicago--Gary--Kenosha, IL--IN--WI CMSA 9,157,540 8,239,820 917,720 11.1% 1602
4 Washington--Baltimore, DC--MD--VA--WV CMSA 7,608,070 6,727,050 881,020 13.1% 8872
5 San Francisco--Oakland--San Jose, CA CMSA 7,039,362 6,253,311 786,051 12.6% 7362
6 Philadelphia--Wilmington--Atlantic City, PA--NJ--DE--MD CMSA6,188,463 5,892,937 295,526 5.0% 6162
7 Boston--Worcester--Lawrence, MA--NH--ME--CT CMSA 5,819,100 5,455,403 363,697 6.7% 1122
8 Detroit--Ann Arbor--Flint, MI CMSA 5,456,428 5,187,171 269,257 5.2% 2162
9 Dallas--Fort Worth, TX CMSA 5,221,801 4,037,282 1,184,519 29.3% 1922
10 Houston--Galveston--Brazoria, TX CMSA 4,669,571 3,731,131 938,440 25.2% 3362
11 Atlanta, GA MSA 4,112,198 2,959,950 1,152,248 38.9% 0520
12 Miami--Fort Lauderdale, FL CMSA 3,876,380 3,192,582 683,798 21.4% 4992
13 Seattle--Tacoma--Bremerton, WA CMSA 3,554,760 2,970,328 584,432 19.7% 7602
14 Phoenix--Mesa, AZ MSA 3,251,876 2,238,480 1,013,396 45.3% 6200
15 Minneapolis--St. Paul, MN--WI MSA 2,968,806 2,538,834 429,972 16.9% 5120
16 Cleveland--Akron, OH CMSA 2,945,831 2,859,644 86,187 3.0% 1692
17 San Diego, CA MSA 2,813,833 2,498,016 315,817 12.6% 7320
18 St. Louis, MO--IL MSA 2,603,607 2,492,525 111,082 4.5% 7040
19 Denver--Boulder--Greeley, CO CMSA 2,581,506 1,980,140 601,366 30.4% 2082
20 San Juan--Caguas--Arecibo, PR CMSA 2,450,292 2,270,808 179,484 7.9% 7442
21 Tampa--St. Petersburg--Clearwater, FL MSA 2,395,997 2,067,959 328,038 15.9% 8280
22 Pittsburgh, PA MSA 2,358,695 2,394,811 -36,116 -1.5% 6280
23 Portland--Salem, OR--WA CMSA 2,265,223 1,793,476 471,747 26.3% 6442
24 Cincinnati--Hamilton, OH--KY--IN CMSA 1,979,202 1,817,571 161,631 8.9% 1642
25 Sacramento--Yolo, CA CMSA 1,796,857 1,481,102 315,755 21.3% 6922
26 Kansas City, MO--KS MSA 1,776,062 1,582,875 193,187 12.2% 376027 Milwaukee--Racine, WI CMSA 1,689,572 1,607,183 82,389 5.1% 5082
31 Norfolk--Virginia Beach--Newport News, VA--NC MSA 1,569,541 1,443,244 126,297 8.8% 5720
32 Las Vegas, NV--AZ MSA 1,563,282 852,737 710,545 83.3% 4120
33 Columbus, OH MSA 1,540,157 1,345,450 194,707 14.5% 1840
34 Charlotte--Gastonia--Rock Hill, NC--SC MSA 1,499,293 1,162,093 337,200 29.0% 1520
35 New Orleans, LA MSA 1,337,726 1,285,270 52,456 4.1% 5560
36 Salt Lake City--Ogden, UT MSA 1,333,914 1,072,227 261,687 24.4% 7160
37 Greensboro--Winston-Salem--High Point, NC MSA 1,251,509 1,050,304 201,205 19.2% 3120
38 Austin--San Marcos, TX MSA 1,249,763 846,227 403,536 47.7% 0640
39 Nashville, TN MSA 1,231,311 985,026 246,285 25.0% 5360
40 Providence--Fall River--Warwick, RI--MA MSA 1,188,613 1,134,350 54,263 4.8% 6480
41 Raleigh--Durham--Chapel Hill, NC MSA 1,187,941 855,545 332,396 38.9% 6640
42 Hartford, CT MSA 1,183,110 1,157,585 25,525 2.2% 3280
43 Buffalo--Niagara Falls, NY MSA 1,170,111 1,189,288 -19,177 -1.6% 1280
44 Memphis, TN--AR--MS MSA 1,135,614 1,007,306 128,308 12.7% 4920
45 West Palm Beach--Boca Raton, FL MSA 1,131,184 863,518 267,666 31.0% 8960
46 Jacksonville, FL MSA 1,100,491 906,727 193,764 21.4% 3600
47 Rochester, NY MSA 1,098,201 1,062,470 35,731 3.4% 6840
48 Grand Rapids--Muskegon--Holland, MI MSA 1,088,514 937,891 150,623 16.1% 3000
49 Oklahoma City, OK MSA 1,083,346 958,839 124,507 13.0% 5880
50 Louisville, KY--IN MSA 1,025,598 948,829 76,769 8.1% 4520
Census Population Change, 1990 to 2000MSA/
CMSA Code Area

South Florida MA’s
• The Miami-Fort Lauderdale CMSA has the 12th largest population (3,876,380).– Comprised of Miami-Dade and Broward
Counties
• The West Palm Beach-Boca Raton MSA has the 45th largest population at 1,131,184– Comprised solely of Palm Beach County
And, In Terms of Inter-Censal Population Growth (1990-2000)
• Miami-Fort Lauderdale ranks 11th nationally in absolute population increase (+683,798) and 15th in percentage population increase (21.4%), while
• West Palm Beach ranks 45th nationally in absolute population increase (+267,666) and 7th in percentage increase (31.0%)

Why Not A Combination of Miami-Fort Lauderdale &
West Palm Beach-Boca: South FloridaPop
2000 Rank April 1, 2000 April 1, 1990 Number Percent
1 New York--Northern New Jersey--Long Island, NY--NJ--CT--PA CMSA 21,199,865 19,549,649 1,650,216 8.4% 5602
2 Los Angeles--Riverside--Orange County, CA CMSA 16,373,645 14,531,529 1,842,116 12.7% 4472
3 Chicago--Gary--Kenosha, IL--IN--WI CMSA 9,157,540 8,239,820 917,720 11.1% 1602
4 Washington--Baltimore, DC--MD--VA--WV CMSA 7,608,070 6,727,050 881,020 13.1% 8872
5 San Francisco--Oakland--San Jose, CA CMSA 7,039,362 6,253,311 786,051 12.6% 7362
6 Philadelphia--Wilmington--Atlantic City, PA--NJ--DE--MD CMSA 6,188,463 5,892,937 295,526 5.0% 6162
7 Boston--Worcester--Lawrence, MA--NH--ME--CT CMSA 5,819,100 5,455,403 363,697 6.7% 1122
8 Detroit--Ann Arbor--Flint, MI CMSA 5,456,428 5,187,171 269,257 5.2% 2162
9 Dallas--Fort Worth, TX CMSA 5,221,801 4,037,282 1,184,519 29.3% 1922
10 South Florida Proposed CMSA 5,007,564 4,056,100 951,464 23.5% 4992
11 Houston--Galveston--Brazoria, TX CMSA 4,669,571 3,731,131 938,440 25.2% 3362
12 Atlanta, GA MSA 4,112,198 2,959,950 1,152,248 38.9% 0520
13 Seattle--Tacoma--Bremerton, WA CMSA 3,554,760 2,970,328 584,432 19.7% 7602
14 Phoenix--Mesa, AZ MSA 3,251,876 2,238,480 1,013,396 45.3% 6200
15 Minneapolis--St. Paul, MN--WI MSA 2,968,806 2,538,834 429,972 16.9% 5120
16 Cleveland--Akron, OH CMSA 2,945,831 2,859,644 86,187 3.0% 1692
17 San Diego, CA MSA 2,813,833 2,498,016 315,817 12.6% 7320
18 St. Louis, MO--IL MSA 2,603,607 2,492,525 111,082 4.5% 7040
19 Denver--Boulder--Greeley, CO CMSA 2,581,506 1,980,140 601,366 30.4% 2082
20 San Juan--Caguas--Arecibo, PR CMSA 2,450,292 2,270,808 179,484 7.9% 7442
21 Tampa--St. Petersburg--Clearwater, FL MSA 2,395,997 2,067,959 328,038 15.9% 8280
22 Pittsburgh, PA MSA 2,358,695 2,394,811 -36,116 -1.5% 6280
23 Portland--Salem, OR--WA CMSA 2,265,223 1,793,476 471,747 26.3% 6442
24 Cincinnati--Hamilton, OH--KY--IN CMSA 1,979,202 1,817,571 161,631 8.9% 1642
25 Sacramento--Yolo, CA CMSA 1,796,857 1,481,102 315,755 21.3% 6922
26 Kansas City, MO--KS MSA 1,776,062 1,582,875 193,187 12.2% 3760
27 Milwaukee--Racine, WI CMSA 1,689,572 1,607,183 82,389 5.1% 5082
28 Orlando, FL MSA 1,644,561 1,224,852 419,709 34.3% 5960
29 Indianapolis, IN MSA 1,607,486 1,380,491 226,995 16.4% 3480
30 San Antonio, TX MSA 1,592,383 1,324,749 267,634 20.2% 7240
31 Norfolk--Virginia Beach--Newport News, VA--NC MSA 1,569,541 1,443,244 126,297 8.8% 5720
32 Las Vegas, NV--AZ MSA 1,563,282 852,737 710,545 83.3% 4120
33 Columbus, OH MSA 1,540,157 1,345,450 194,707 14.5% 1840
34 Charlotte--Gastonia--Rock Hill, NC--SC MSA 1,499,293 1,162,093 337,200 29.0% 1520
35 New Orleans, LA MSA 1,337,726 1,285,270 52,456 4.1% 5560
36 Salt Lake City--Ogden, UT MSA 1,333,914 1,072,227 261,687 24.4% 7160
37 Greensboro--Winston-Salem--High Point, NC MSA 1,251,509 1,050,304 201,205 19.2% 3120
38 Austin--San Marcos, TX MSA 1,249,763 846,227 403,536 47.7% 0640
39 Nashville, TN MSA 1,231,311 985,026 246,285 25.0% 5360
40 Providence--Fall River--Warwick, RI--MA MSA 1,188,613 1,134,350 54,263 4.8% 6480
41 Raleigh--Durham--Chapel Hill, NC MSA 1,187,941 855,545 332,396 38.9% 6640
42 Hartford, CT MSA 1,183,110 1,157,585 25,525 2.2% 3280
43 Buffalo--Niagara Falls, NY MSA 1,170,111 1,189,288 -19,177 -1.6% 1280
44 Memphis, TN--AR--MS MSA 1,135,614 1,007,306 128,308 12.7% 4920
45 Jacksonville, FL MSA 1,100,491 906,727 193,764 21.4% 3600
46 Rochester, NY MSA 1,098,201 1,062,470 35,731 3.4% 6840
47 Grand Rapids--Muskegon--Holland, MI MSA 1,088,514 937,891 150,623 16.1% 3000
48 Oklahoma City, OK MSA 1,083,346 958,839 124,507 13.0% 5880
49 Louisville, KY--IN MSA 1,025,598 948,829 76,769 8.1% 4520
Census Population Change, 1990 to 2000MSA/ CMSA Code Area
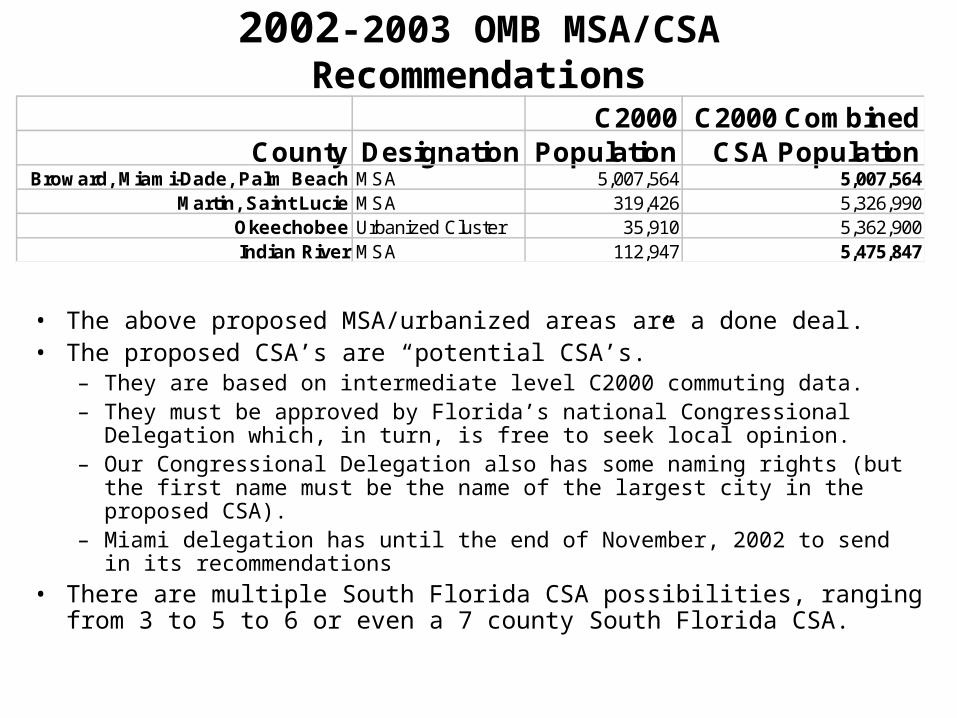
2002-2003 OMB MSA/CSA Recommendations
• The above proposed MSA/urbanized areas are a done deal.• The proposed CSA’s are “potential CSA’s.”
– They are based on intermediate level C2000 commuting data.– They must be approved by Florida’s national Congressional Delegation which, in
turn, is free to seek local opinion.– Our Congressional Delegation also has some naming rights (but the first name must
be the name of the largest city in the proposed CSA).– Miami delegation has until the end of November, 2002 to send in its
recommendations
• There are multiple South Florida CSA possibilities, ranging from 3 to 5 to 6 or even a 7 county South Florida CSA.
C2000 C2000 CombinedCounty Designation Population CSA Population
Broward, Miami-Dade, Palm Beach MSA 5,007,564 5,007,564Martin, Saint Lucie MSA 319,426 5,326,990
Okeechobee Urbanized Cluster 35,910 5,362,900Indian River MSA 112,947 5,475,847

As A Combined MSA, South Florida Would Be ….
• 10th nationally in population size at 5,007,564• 6th nationally in inter-censal, absolute population
growth at 951,464• 14th nationally in inter-censal percentage
population growth at 23.5% for a 2.11 annual, continuous growth rate
• On our (revised) top 10 list of MSA’s by size, only one -- Dallas –Fort Worth-- is growing at a faster rate (29.3%)
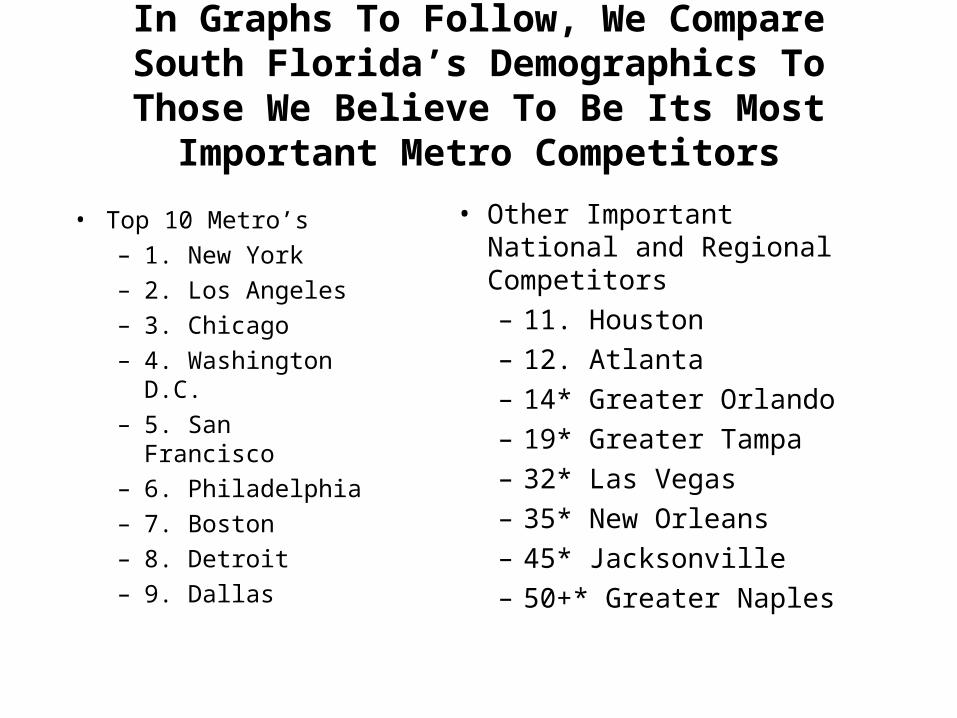
In Graphs To Follow, We Compare South Florida’s Demographics To Those We Believe To
Be Its Most Important Metro Competitors
• Top 10 Metro’s
– 1. New York
– 2. Los Angeles
– 3. Chicago
– 4. Washington D.C.
– 5. San Francisco
– 6. Philadelphia
– 7. Boston
– 8. Detroit
– 9. Dallas
• Other Important National and Regional Competitors
– 11. Houston
– 12. Atlanta
– 14* Greater Orlando
– 19* Greater Tampa
– 32* Las Vegas
– 35* New Orleans
– 45* Jacksonville
– 50+* Greater Naples
We Will Also Compare The Proposed Tri-County South Florida MSA To
• 1990 Tri-County South Florida
• 2000 U.S.A. averages

And Since We Modified South Florida, In Fairness,
We Modified Orlando, Tampa, and Naples

Revised Florida Metro/County Equivalents
• South Florida (new Census/OMB definition)
– Broward– Miami-Dade– Palm Beach
• Jacksonville (no change)– Clay– Duval– Nassau– St. Johns
• Greater Naples– Charlotte*– Collier– Lee*
• Greater Orlando– Brevard*– Flagler*– Lake– Orange– Osceola– Seminole– Volusia*
• Greater Tampa– Hernando– Hillsborough– Manatee*– Pasco– Pinellas– Polk*– Sarasota
* = county added to “official MSA definition by DDD. The full 2003 updated metro list has not yet been officially released.
Transportation Comparisons
Commuting Hours
Average Travel Time
Mode Of Transportation

Percent Early Rising Commuters: 12: A.M. to 5:59 A.M. (V151a)
• Very few South Floridians start their commutes this early – 7% in 2000 and 6% in 1990.
• The Las Vegas metro area is an outlier here with relatively high percentages commuting to work in the mid-night hours.
0.0000.0200.0400.0600.0800.1000.1200.1400.160
South F
lorid
a 19
90
South F
lorid
a 20
00
New Y
ork
Philadel
phia
Atlant
a
Boston
Great
er N
aple
s
Great
er T
ampa
Great
er O
rland
oDal
las
Jack
sonv
ille
San F
ranci
sco
Was
hingt
on D.C
.USA
New O
rlean
s
Detro
it
Housto
n
Chicago
Los A
ngele
s
Las V
egas
Region
Pe
rce
nt
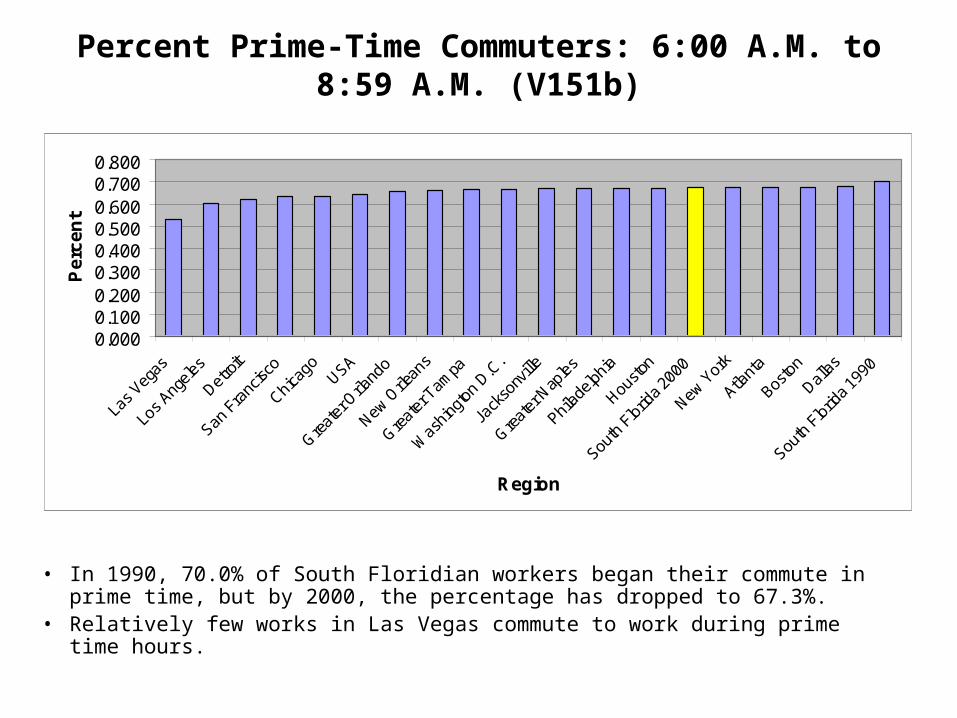
Percent Prime-Time Commuters: 6:00 A.M. to 8:59 A.M. (V151b)
• In 1990, 70.0% of South Floridian workers began their commute in prime time, but by 2000, the percentage has dropped to 67.3%.
• Relatively few works in Las Vegas commute to work during prime time hours.
0.0000.1000.2000.3000.4000.5000.6000.7000.800
Las V
egas
Los A
ngele
s
Detro
it
San F
ranc
isco
Chicag
oUSA
Great
er O
rland
o
New O
rlean
s
Great
er T
ampa
Was
hingto
n D.C
.
Jack
sonv
ille
Great
er N
aples
Philad
elphia
Housto
n
South
Flor
ida 2
000
New Y
ork
Atlant
a
Bosto
n
Dallas
South
Flor
ida 1
990
Region
Pe
rce
nt

Average Travel Time To Work (V141)
• New York is the outlier at 34.1 minutes.• South Florida2000 commuters were ranked 8th at 28.2 minutes.• In 1990, South Florida commuters only averaged 23.0 minutes – so the traffic
situation is clearly getting worse.
0.05.0
10.015.020.025.030.035.040.0
South
Flor
ida 1
990
Las V
egas
Great
er N
aples
Great
er T
ampa USA
Detro
it
Great
er O
rland
o
Jack
sonv
ille
New O
rlean
s
Dallas
Bosto
n
Philad
elphia
South
Flor
ida 2
000
Housto
n
Los A
ngele
s
San F
ranc
isco
Chicag
o
Atlant
a
Was
hingto
n D.C
.
New Y
ork
Region
In M
inu
tes

Percent Take Car, Truck Or Van To Work, Alone (V136)
• Here South Florida has slightly greater than average percentages of “lone commuters” in 2000 at 77.3%, up marginally from the 1990 percentage (76.1%)
• However, South Florida rates are lower/better than all other Florida metros.
0.0000.1000.2000.3000.4000.5000.6000.7000.8000.900
New Y
ork
San F
ranc
isco
Was
hingto
n D.C
.
Chicag
o
Los A
ngele
s
New O
rlean
s
Philad
elphia
Bosto
n
Las V
egas
USA
South
Flor
ida 1
990
Housto
n
Atlant
a
South
Flor
ida 2
000
Great
er N
aples
Dallas
Great
er T
ampa
Jack
sonv
ille
Great
er O
rland
o
Detro
it
Region
Pe
rce
nt

Percent Workers Who Carpool In Car, Truck, Or Van (V137)
• Slightly more South Florida2000 workers carpool (13.1%) than the U.S. average (12.2%)
• But the 2000 percent is down from the South Florida1990 figure of 14.1% so we’re going the “wrong way” here.
0.0000.0200.0400.0600.0800.1000.1200.1400.160
Bosto
n
Detro
it
New Y
ork
Philad
elphia
Chicag
o
Great
er O
rland
oUSA
Great
er T
ampa
Jack
sonv
ille
Was
hingto
n D.C
.
San F
ranc
isco
South
Flor
ida 2
000
Atlant
a
Great
er N
aples
Dallas
South
Flor
ida 1
990
Housto
n
New O
rlean
s
Las V
egas
Los A
ngele
s
Region
Pe
rce
nt

Percent Workers Take Public Transportation To Work (V138)
• Relatively few South Floridians take public transportation to work (3.3% in 2000 down from 3.4% in 1990.
• The New York metro is the obvious outlier here at 25%.
0.000
0.050
0.100
0.150
0.200
0.250
0.300
Region
Perc
en
t

Education
• Public Versus Private
• Educational Levels
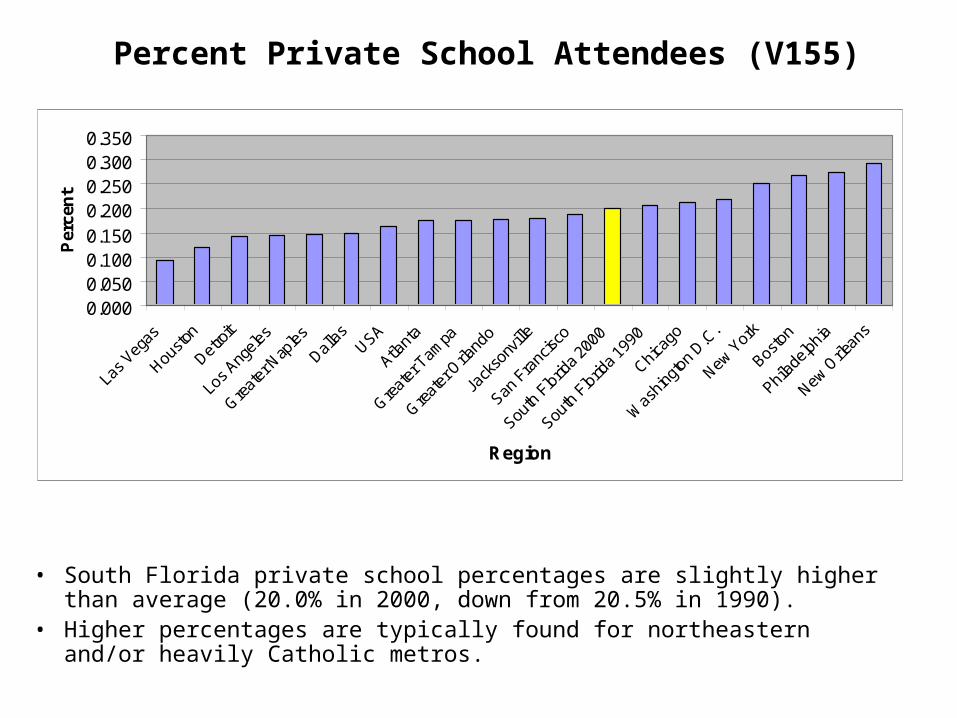
Percent Private School Attendees (V155)
• South Florida private school percentages are slightly higher than average (20.0% in 2000, down from 20.5% in 1990).
• Higher percentages are typically found for northeastern and/or heavily Catholic metros.
0.0000.0500.1000.1500.2000.2500.3000.350
Las V
egas
Housto
n
Detro
it
Los A
ngele
s
Great
er N
aples
Dallas
USA
Atlant
a
Great
er T
ampa
Great
er O
rland
o
Jack
sonv
ille
San F
ranc
isco
South
Flor
ida 2
000
South
Flor
ida 1
990
Chicag
o
Was
hingto
n D.C
.
New Y
ork
Bosto
n
Philad
elphia
New O
rlean
s
Region
Per
cen
t

Percent Age 25+ With Less Than Complete High School Education (V160)
• Unfortunately, South Florida2000 has the 2nd highest percentage (23.8%) of poorly educated (didn’t complete high school) persons.
• We improved, somewhat, from South Florida1990 which had an even worse percentage -- 28.1%
0.000
0.050
0.100
0.150
0.200
0.250
0.300
Bosto
n
Was
hingto
n D.C
.
Atlant
a
San F
ranc
isco
Jack
sonv
ille
Great
er O
rland
o
Detro
it
Great
er N
aples
Philad
elphia
Great
er T
ampa
Chicag
oUSA
Dallas
New Y
ork
Las V
egas
New O
rlean
s
Housto
n
South
Flor
ida 2
000
Los A
ngele
s
South
Flor
ida 1
990
Region
Per
cen
t
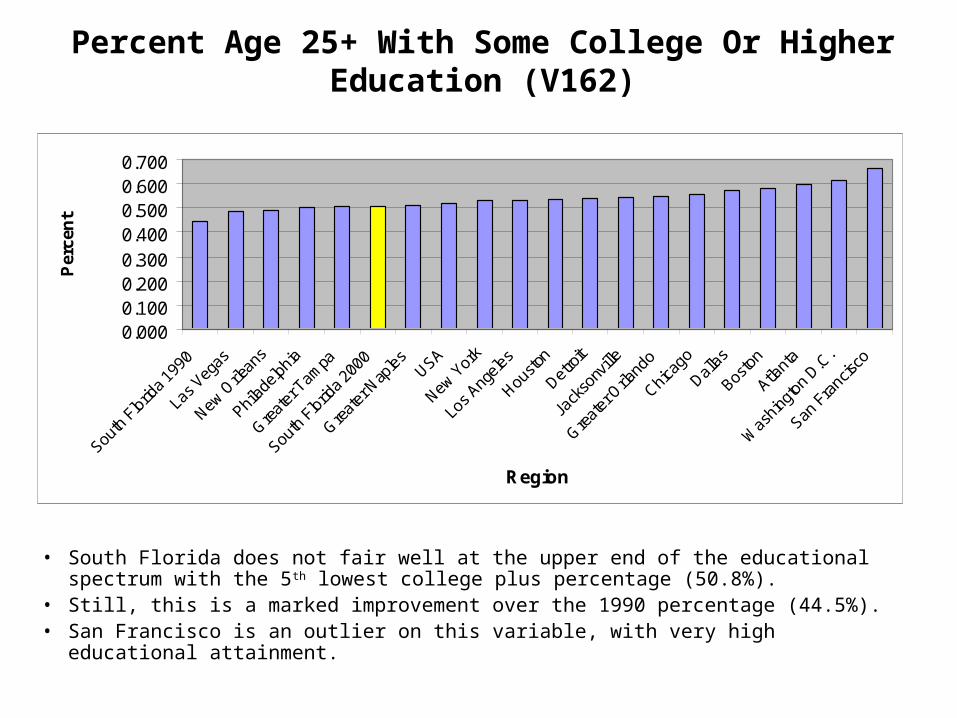
Percent Age 25+ With Some College Or Higher Education (V162)
• South Florida does not fair well at the upper end of the educational spectrum with the 5th lowest college plus percentage (50.8%).
• Still, this is a marked improvement over the 1990 percentage (44.5%).• San Francisco is an outlier on this variable, with very high educational attainment.
0.0000.1000.2000.3000.4000.5000.6000.700
South
Flor
ida 1
990
Las V
egas
New O
rlean
s
Philad
elphia
Great
er T
ampa
South
Flor
ida 2
000
Great
er N
aples USA
New Y
ork
Los A
ngele
s
Housto
n
Detro
it
Jack
sonv
ille
Great
er O
rland
o
Chicag
o
Dallas
Bosto
n
Atlant
a
Was
hingto
n D.C
.
San F
ranc
isco
Region
Per
cen
t

Labor Force
• Civilian Participation Rate
• Unemployment Rate

Civilian Participation Rate (V171)
• Defined as: (pop age 16+ employed – military pop + pop age 16+ unemployed and looking for work)/(pop age 16+ - military pop )
• Because of its aging population, South Florida has the one of the lower civilian participation rates at 58.7% in 2000, down from 62.1% in 1990.
• Naples is a metro outlier with much lower civilian participation rates due, most likely to its large number of retirees.
0.0000.1000.2000.3000.4000.5000.6000.7000.800
Region
Per
cen
t
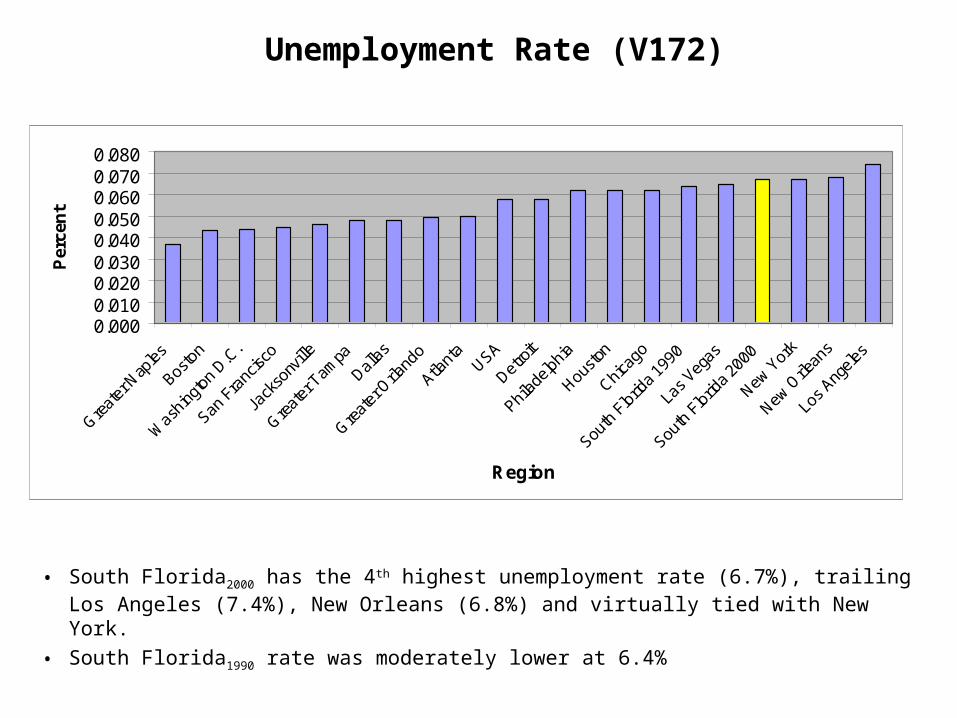
Unemployment Rate (V172)
• South Florida2000 has the 4th highest unemployment rate (6.7%), trailing Los Angeles (7.4%), New Orleans (6.8%) and virtually tied with New York.
• South Florida1990 rate was moderately lower at 6.4%
0.0000.0100.0200.0300.0400.0500.0600.0700.080
Great
er N
aples
Bosto
n
Was
hingto
n D.C
.
San F
ranc
isco
Jack
sonv
ille
Great
er T
ampa
Dallas
Great
er O
rland
o
Atlant
aUSA
Detro
it
Philad
elphia
Housto
n
Chicag
o
South
Flor
ida 1
990
Las V
egas
South
Flor
ida 2
000
New Y
ork
New O
rlean
s
Los A
ngele
s
Region
Per
cen
t
Income/Poverty
• Overall Residential Market
• Average Household Income
• Percent In Poverty

Aggregated Annual Household Income (V1)
• South Florida household market = $110 Billion per year• South Florida ranked 10th – same as population ranking• Rank tends to follow population counts• The New York metro area market is an outlier.
0
100000000
200000000
300000000
400000000
500000000
600000000
Great
er N
aples
Jack
sonv
ille
New O
rlean
s
Las V
egas
Great
er O
rland
o
South
Flor
ida 1
990
Great
er T
ampa
Housto
n
Atlant
a
South
Flor
ida 2
000
Dallas
Detro
it
Philad
elphia
Bosto
n
Was
hingto
n D.C
.
San F
ranc
isco
Chicag
o
Los A
ngele
s
New Y
ork
Region
In (
00
0's
$)

Average Annual Income Per Household (V2)
• South Florida ($57,936) is just above the U.S. average of $56,644.
• Naples is just ahead of South Florida, all other Florida metros lag behind
0100002000030000400005000060000700008000090000
South
Flor
ida 1
990
New O
rlean
s
Great
er T
ampa
Great
er O
rland
o
Jack
sonv
ille
Las V
egas
USA
South
Flor
ida 2
000
Great
er N
aples
Housto
n
Philad
elphia
Detro
it
Los A
ngele
s
Dallas
Chicag
o
Atlant
a
Bosto
n
New Y
ork
Was
hingto
n D.C
.
San F
ranc
isco
Region
$'s
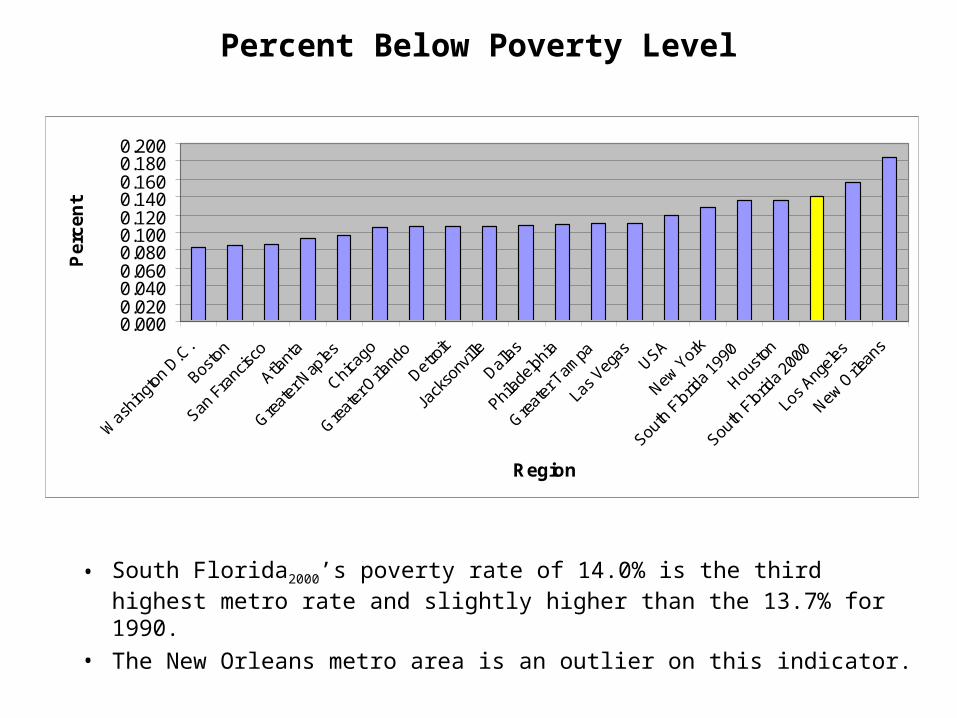
Percent Below Poverty Level
• South Florida2000’s poverty rate of 14.0% is the third highest metro rate and slightly higher than the 13.7% for 1990.
• The New Orleans metro area is an outlier on this indicator.
0.0000.0200.0400.0600.0800.1000.1200.1400.1600.1800.200
Was
hingto
n D.C
.
Bosto
n
San F
ranc
isco
Atlant
a
Great
er N
aples
Chicag
o
Great
er O
rland
o
Detro
it
Jack
sonv
ille
Dallas
Philad
elphia
Great
er T
ampa
Las V
egas
USA
New Y
ork
South
Flor
ida 1
990
Housto
n
South
Flor
ida 2
000
Los A
ngele
s
New O
rlean
s
Region
Pe
rce
nt

Immigrants
• Recent Levels
• Percent Foreign Born
• Percent Citizens
• Language Issues

International Migration: 1995-2000 (V42)
• South Florida2000 leads all metros with its international migration rate of 7.4%, up moderately from the 6.1% registered over the 1985-1990 interval.
• Note – the base for these percentages is the total population (age 5+). An earlier slide used a “total migrant population” as the base.
0.0000.0100.0200.0300.0400.0500.0600.0700.080
New O
rlean
s
Detro
it
Philad
elphia
Jack
sonv
ille
Great
er T
ampa USA
Bosto
n
Great
er N
aples
Chicag
o
Great
er O
rland
o
Was
hingto
n D.C
.
Atlant
a
Las V
egas
Los A
ngele
s
Dallas
Housto
n
New Y
ork
San F
ranc
isco
South
Flor
ida 1
990
South
Flor
ida 2
000
Region
Ra
te

Percent Foreign Born Population (V27)
• South Florida2000 is #1 at 35%, followed by metros in major U.S. ports.
• Our percentage is up considerably over South Florida1990 (29%).
• Note that we have more than 3 times the U.S. average of 11%
0.0000.0500.1000.1500.2000.2500.3000.3500.400
New O
rlean
s
Jack
sonv
ille
Detro
it
Philad
elphia
Great
er T
ampa
Great
er O
rland
o
Atlant
aUSA
Great
er N
aples
Bosto
n
Was
hingto
n D.C
.
Dallas
Chicag
o
Las V
egas
Housto
n
New Y
ork
San F
ranc
isco
South
Flor
ida 1
990
Los A
ngele
s
South
Flor
ida 2
000
Region
Per
cen
t

Percent Of Foreign Born That Have Become Citizens (V28)
• This is a decent proxy for assimilation.
• South Florida2000, at 46%, is ranked 6th -- a very good score. None of the higher ranked metros are major immigrant destinations.
• We have made a major improvement over the South Florida1990 score of 39%.
0.000
0.100
0.200
0.300
0.400
0.500
0.600
Dallas
Atlant
a
Housto
n
Las V
egas
Great
er N
aples
Los A
ngele
s
South
Flor
ida 1
990
Chicag
oUSA
Was
hingto
n D.C
.
Bosto
n
Great
er T
ampa
San F
ranc
isco
New Y
ork
South
Flor
ida 2
000
Great
er O
rland
o
Detro
it
Jack
sonv
ille
Philad
elphia
New O
rlean
s
Region
Per
cen
t

Language Capabilities
• English Speakers Only
• English Language Ability Of Those Whose Primary Language Is Not English

English Speaking Only (V49)
• Only Los Angeles (53%) has lower percentages of “English only” speakers.• And South Florida’s percentage has dropped dramatically from 64% in 1990 to 55%
in 2000.
0.0000.1000.2000.3000.4000.5000.6000.7000.8000.9001.000
Los
Angele
s
South
Flor
ida 2
000
South
Flor
ida 1
990
San F
ranc
isco
New Y
ork
Housto
n
Chicag
o
Dallas
Las
Vegas
Bosto
nUSA
Great
er O
rland
o
Was
hing
ton D
.C.
Great
er N
aples
Great
er T
ampa
Atlant
a
Philad
elphia
Detro
it
New O
rlean
s
Jack
sonv
ille
Region
Per
cen
t

Of Those Who, At Home, Speak A Language Other Than English – What Percent Speaks English “Not Very Well” Or “Not At All” (V51b)
• Unfortunately, 27% of South Floridians who “speak a language other than English at home” respond that they speak English “not very well” or “not at all” so we have the fifth worst score on this measure.
• This percentage is a slight improvement over the higher 29% figure of 1990.• Metros with higher percentages tend to be those with recent immigrant
population waves from Mexico (Dallas, Atlanta, Los Angeles, Houston).
0.0000.0500.1000.1500.2000.2500.3000.350
Jack
sonv
ille
New O
rlean
s
Detro
it
Great
er O
rland
o
Bosto
n
Philad
elphia
Was
hingto
n D.C
.
Great
er T
ampa
San F
ranc
isco
New Y
ork
USA
Chicag
o
Las V
egas
Great
er N
aples
South
Flor
ida 2
000
Housto
n
Los A
ngele
s
South
Flor
ida 1
990
Atlant
a
Dallas
Region
Per
cen
t

Population Mobility/Migration
• Same house (non-mobility)
• Different house/same county
• Different house/different county/same state
• Different house/different state

Percent Of Non-Movers in Population: 1995-2000 (V37)
• Half of South Floridian’s remained in their same homes from 1995 to 2000.• This represents an increase in stability over the South Florida1990 figure of 45%.• The current U.S. average is 54%, so South Floridians are more mobile than the average
U.S. citizens.
0.0000.1000.2000.3000.4000.5000.6000.700
Las V
egas
Atlant
a
Dallas
South
Flor
ida 1
990
Great
er O
rland
o
Great
er N
aples
Housto
n
Jack
sonv
ille
South
Flor
ida 2
000
Great
er T
ampa
Los A
ngele
s
San F
ranc
isco
Was
hingto
n D.C
.USA
Chicag
o
Detro
it
Bosto
n
New O
rlean
s
New Y
ork
Philad
elphia
Region
Per
cen
t

Intra-County Migration: 1995-2000 (V39)
• South Florida2000 has a high rate of intra-county migration (29.5%), almost the same as its 1990 level of 30.1%, with a 4th place ranking – behind three western metros (Los Angeles, Las Vegas, and Houston).
• This reinforces our notions of widespread movement within South Florida from established eastern housing units to newly developed housing units on the west sides of our counties.
0.0000.0500.1000.1500.2000.2500.3000.3500.400
Region
Per
cen
t

Inter-County/Same State Migration: 1995-2000 (V40)
• South Florida ranks very low on “inter-county/same state” migration (6% in 2000 up marginally from 5% in 1990.
• Apparently very few Floridians step-migrate down to South Florida.
• Las Vegas is an outlier with much less inter-county migration than any other region.
• The Atlanta region is an outlier with much more inter-county migration migration than any other region.
0.0000.0200.0400.0600.0800.1000.1200.1400.1600.180
Region
Perc
en
t

Interstate Migration: 1995-2000 (V41)
• South Floridians show “average” rates of interstate migration (8.5%) compared to U.S. average of 8.4% for the 1995-2000 interval.
• The South Florida2000 rate has dropped considerably from the South Florida 1985-1990 rate of 14%, indicating a decline in our attractiveness to potential out-of-state migrants.
• The metros ahead of us include Las Vegas, Atlanta, Washington D.C., Dallas, and all our Florida competitor metros.
• Las Vegas is an outlier here, with much higher interstate migration than any other metro area.
0.000
0.050
0.100
0.150
0.200
0.250
0.300
Los A
ngele
s
Detro
it
New Y
ork
San F
ranc
isco
Chicag
o
Housto
n
New O
rlean
s
Philad
elphia
Bosto
nUSA
South
Flor
ida 2
000
Dallas
Was
hingto
n D.C
.
Jack
sonv
ille
South
Flor
ida 1
990
Great
er T
ampa
Great
er O
rland
o
Atlant
a
Great
er N
aples
Las V
egas
Region
Per
cen
t

Housing
• Type of Housing Unit
• Home Ownership By Race
• Occupancy/Vacancy Info

Percent of Housing Units That Are “Single Family Detached” (V71)
• South Florida2000 trails all metros (except New York) with its 43% “single family detached” percentage.
• This percentage is up, however, from the 39% South Florida1990 percentage.
0.0000.1000.2000.3000.4000.5000.6000.7000.800
South
Flor
ida 1
990
New Y
ork
South
Flor
ida 2
000
Philad
elphia
Was
hing
ton D
.C.
Great
er N
aples
Bosto
n
Chicag
o
Las
Vegas
Los
Angele
s
Great
er T
ampa
San F
ranc
isco
New O
rlean
s
Housto
nUSA
Dallas
Great
er O
rland
o
Jack
sonv
ille
Atlant
a
Detro
it
Region
Per
cen
t
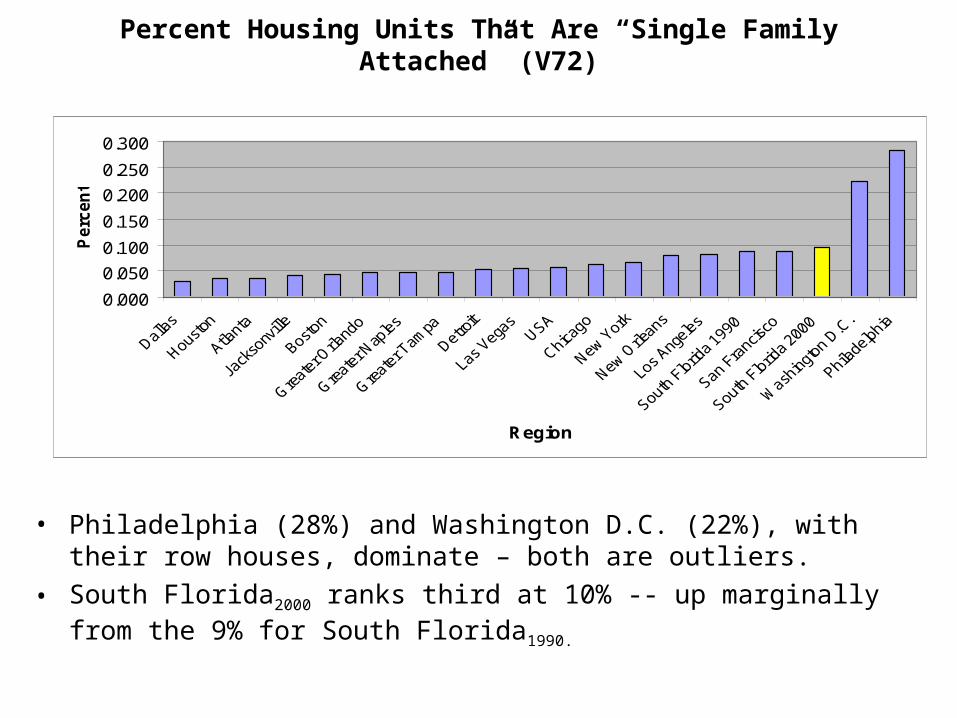
Percent Housing Units That Are “Single Family Attached” (V72)
• Philadelphia (28%) and Washington D.C. (22%), with their row houses, dominate – both are outliers.
• South Florida2000 ranks third at 10% -- up marginally from the 9% for South Florida1990.
0.000
0.050
0.100
0.150
0.200
0.250
0.300
Region
Perc
en
t

Percent Housing Units Are 20+ Units (v75)
• To no one’s surprise, South Florida leads the country in large condo/apartment complexes at 25.1% in 2000, down marginally from 25.7% in 1990 – both numbers are outliers.
• New York is very close (24.2). It also, is a statistical outlier. And then there is a big drop off.
0.000
0.050
0.100
0.150
0.200
0.250
0.300
Detro
it
Atlant
a
Jack
sonv
ille
Great
er O
rland
o
New O
rlean
s
Philad
elphia USA
Great
er T
ampa
Las V
egas
Bosto
n
Was
hingto
n D.C
.
Great
er N
aples
Dallas
San F
ranc
isco
Chicag
o
Los A
ngele
s
Housto
n
New Y
ork
South
Flor
ida 2
000
South
Flor
ida 1
990
Region
Per
cen
t

Percent White Homeownership (V78)
• Homeownership rates for whites (including white Hispanics) are modest at 71% in 2000, up from 67% in 1990.
0.0000.1000.2000.3000.4000.5000.6000.7000.8000.900
Los A
ngele
s
San F
ranc
isco
New Y
ork
Las V
egas
Bosto
n
Dallas
South
Flor
ida 1
990
Housto
n
South
Flor
ida 2
000
New O
rlean
sUSA
Jack
sonv
ille
Was
hingto
n D.C
.
Chicag
o
Great
er O
rland
o
Atlant
a
Great
er T
ampa
Philad
elphia
Detro
it
Great
er N
aples
Region
Per
cen
t

Percent Black Homeownership (V79)
• Black homeownership in South Florida2000 is high (50%), ranking fourth in our metro list.
• The South Florida1990 percentage (44%) is considerably lower, so there has been some progress on this indicator.
0.000
0.100
0.200
0.300
0.400
0.500
0.600
Bosto
n
New Y
ork
Los A
ngele
s
San F
ranc
isco
Las V
egas
Dallas
Chicag
o
South
Flor
ida 1
990
Housto
n
New O
rlean
sUSA
Great
er T
ampa
Was
hingto
n D.C
.
Atlant
a
Great
er N
aples
Jack
sonv
ille
South
Flor
ida 2
000
Great
er O
rland
o
Detro
it
Philad
elphia
Region
Per
cen
t

Percent Hispanic Homeownership (V84)
• South Florida2000 leads all our metro areas on Hispanic homeownership at 57%.
• This is a marked improvement over the 1990 percentage (49%).• All Florida metros do well on this indicator --probably because Florida
attracts most of its Hispanics from Cuba as well as attracting disproportionately from wealthier South American countries.
• The Boston and New York metro areas are (low) outliers on this indicator.
0.000
0.100
0.200
0.300
0.400
0.500
0.600
Bosto
n
New Y
ork
Atlant
a
Los A
ngele
s
Dallas
San F
ranc
isco
Was
hingto
n D.C
.USA
Philad
elphia
Las V
egas
Housto
n
Chicag
o
South
Flor
ida 1
990
New O
rlean
s
Great
er N
aples
Jack
sonv
ille
Detro
it
Great
er T
ampa
Great
er O
rland
o
South
Flor
ida 2
000
Region
Per
cen
t
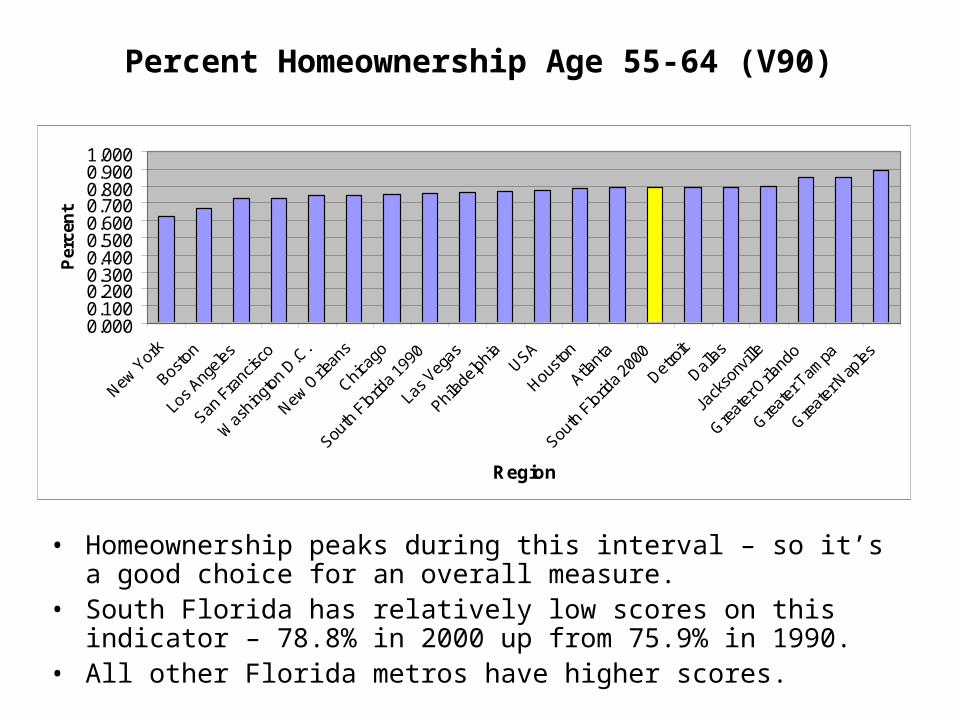
Percent Homeownership Age 55-64 (V90)
• Homeownership peaks during this interval – so it’s a good choice for an overall measure.
• South Florida has relatively low scores on this indicator – 78.8% in 2000 up from 75.9% in 1990.
• All other Florida metros have higher scores.
0.0000.1000.2000.3000.4000.5000.6000.7000.8000.9001.000
New Y
ork
Bosto
n
Los A
ngele
s
San F
ranc
isco
Was
hingto
n D.C
.
New O
rlean
s
Chicag
o
South
Flor
ida 1
990
Las V
egas
Philad
elphia USA
Housto
n
Atlant
a
South
Flor
ida 2
000
Detro
it
Dallas
Jack
sonv
ille
Great
er O
rland
o
Great
er T
ampa
Great
er N
aples
Region
Per
cen
t

Percent Housing Units Occupied (V102)
• To the Census Bureau, a housing unit is not occupied unless it is the respondent’s “usual place of residence.”
• Since many Florida metros contain numerous 2nd homes, it is not surprising that we score low on this indicator – 89% in 2000, up somewhat from 85% in 1990.
0.000
0.200
0.400
0.600
0.800
1.000
1.200
Great
er N
aples
South
Flor
ida 1
990
Great
er T
ampa
South
Flor
ida 2
000
Las V
egas
Great
er O
rland
o
New O
rlean
sUSA
Jack
sonv
ille
Philad
elphia
Housto
n
Dallas
New Y
ork
Los A
ngele
s
Detro
it
Was
hingto
n D.C
.
Chicag
o
Atlant
a
Bosto
n
San F
ranc
isco
Region
Per
cen
t

Percent Owner Occupied Housing Units (V103)
• The denominator here is occupied housing units (census definition of occupied).
• South Florida has average “owner occupied” percentages (66% in 2000 up from 63% in 1990).
0.0000.1000.2000.3000.4000.5000.6000.7000.8000.900
New Y
ork
Los A
ngele
s
San F
ranc
isco
Dallas
Housto
n
Las V
egas
Bosto
n
New O
rlean
s
South
Flor
ida 1
990
Was
hingto
n D.C
.
Chicag
o
South
Flor
ida 2
000
USA
Atlant
a
Jack
sonv
ille
Great
er O
rland
o
Philad
elphia
Great
er T
ampa
Detro
it
Great
er N
aples
Region
Per
cen
t
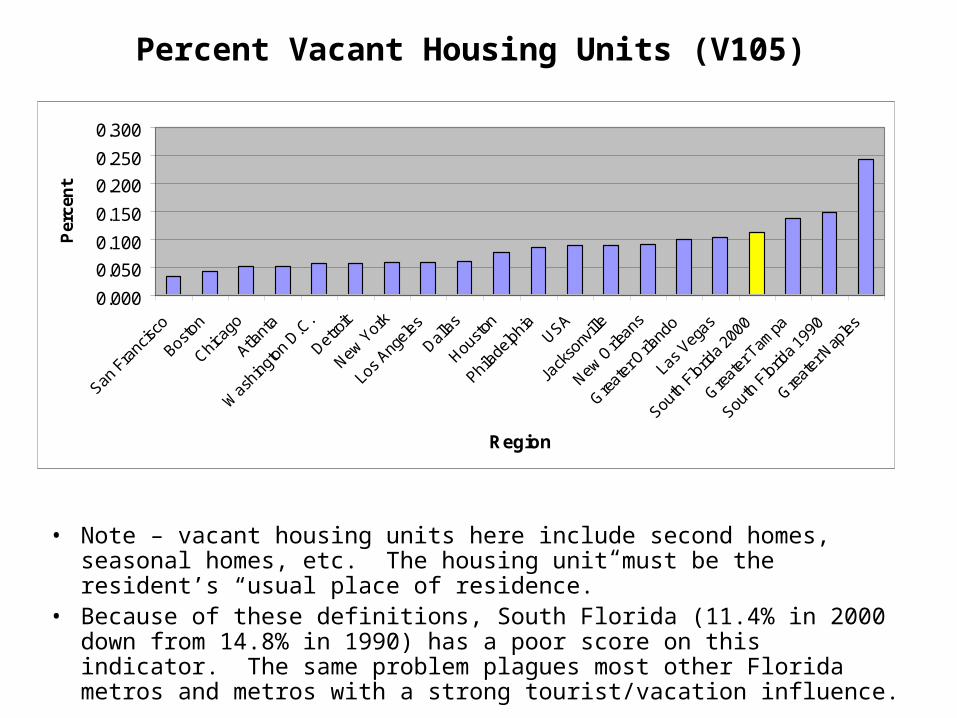
Percent Vacant Housing Units (V105)
• Note – vacant housing units here include second homes, seasonal homes, etc. The housing unit must be the resident’s “usual place of residence.”
• Because of these definitions, South Florida (11.4% in 2000 down from 14.8% in 1990) has a poor score on this indicator. The same problem plagues most other Florida metros and metros with a strong tourist/vacation influence.
0.000
0.050
0.100
0.150
0.200
0.250
0.300
San F
ranc
isco
Bosto
n
Chicag
o
Atlant
a
Was
hingto
n D.C
.
Detro
it
New Y
ork
Los A
ngele
s
Dallas
Housto
n
Philad
elphia USA
Jack
sonv
ille
New O
rlean
s
Great
er O
rland
o
Las V
egas
South
Flor
ida 2
000
Great
er T
ampa
South
Flor
ida 1
990
Great
er N
aples
Region
Per
cen
t
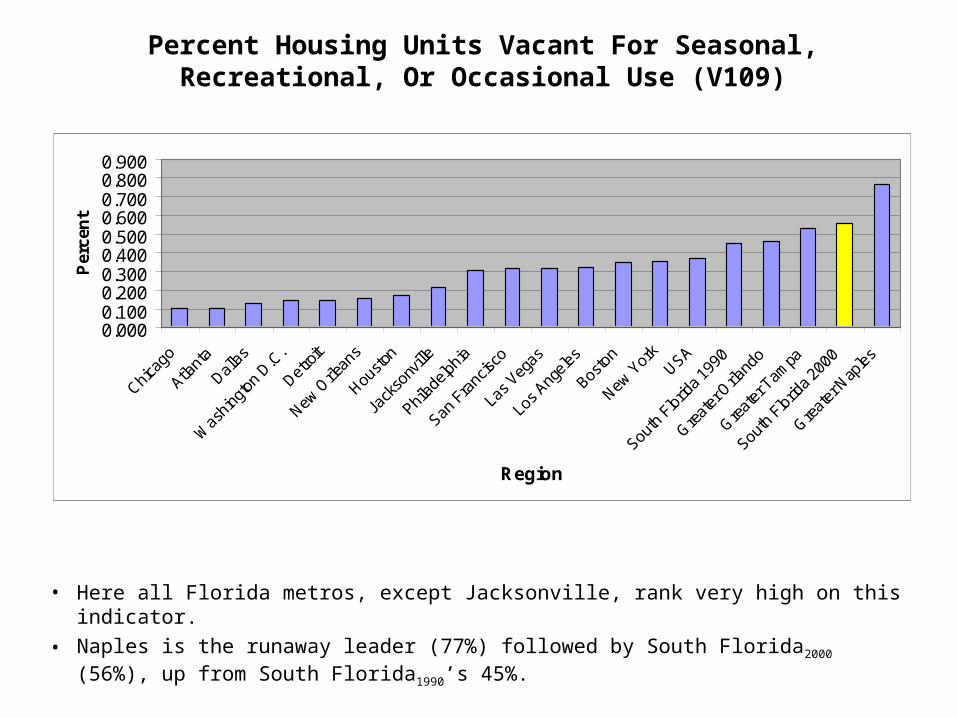
Percent Housing Units Vacant For Seasonal, Recreational, Or Occasional Use (V109)
• Here all Florida metros, except Jacksonville, rank very high on this indicator.
• Naples is the runaway leader (77%) followed by South Florida2000 (56%), up from South Florida1990’s 45%.
0.0000.1000.2000.3000.4000.5000.6000.7000.8000.900
Chicag
o
Atlant
a
Dallas
Was
hingto
n D.C
.
Detro
it
New O
rlean
s
Housto
n
Jack
sonv
ille
Philad
elphia
San F
ranc
isco
Las V
egas
Los A
ngele
s
Bosto
n
New Y
ork
USA
South
Flor
ida 1
990
Great
er O
rland
o
Great
er T
ampa
South
Flor
ida 2
000
Great
er N
aples
Region
Per
cen
t

Homeowner Vacancy Rate (V112b)
• Computed as: # vacant units for sale/(# of vacant units for sale + # of owner occupied housing units).
• South Florida2000 has the fourth highest metro homeowner vacancy rate (at 2.4%) – down somewhat from 1990’s rate of 3.1%.
• Tourist destinations (including several Florida metros) score highest on this indicator.
0.0000.0050.0100.0150.0200.0250.0300.035
Bosto
n
San F
ranc
isco
New Y
ork
Chicag
o
Was
hing
ton D
.C.
Detro
it
Dallas
Philad
elphia
New O
rlean
s
Housto
n
Jack
sonv
ille
Los
Angele
sUSA
Atlant
a
Great
er O
rland
o
South
Flor
ida 2
000
Great
er T
ampa
Great
er N
aples
Las
Vegas
South
Flor
ida 1
990
Region
Per
cen
t

Rental Vacancy Rate (V112a)
• Computed as: # of vacant housing units for rent / (# of vacant housing units for rent + number of occupied housing units)
• South Florida’s rental market in 2000 is a tight 6.6%, much lower than the 10.4% rate of 1990.
• Naples is the clear outlier here with a 13.3% rental vacancy rate.
0.0000.0200.0400.0600.0800.1000.1200.140
San F
ranc
isco
Bosto
n
New Y
ork
Los A
ngele
s
Was
hingto
n D.C
.
Chicag
o
South
Flor
ida 2
000
Atlant
a
Detro
it
Philad
elphia USA
Dallas
New O
rlean
s
Great
er O
rland
o
Housto
n
Las V
egas
Jack
sonv
ille
South
Flor
ida 1
990
Great
er T
ampa
Great
er N
aples
Region
Per
cen
t

Summary Caveats
Census 2000 doesn’t provide us with a complete set of indicators
Census 2000 data is 2.5 years out-of-date, but Florida’s data was just released in mid-September, 1992.
Certainly our three South Florida counties differ substantively from one another on many of these indicators, so our regional MSA average can sometimes be misleading
Nevertheless…

According To Census 2000 Data,
South Florida Is Worse Than Other Competitor Metros On:
• Public transportation > and we’re not improving
• Educational levels > but we’re getting better
• Foreign immigrant inflows > short term negative effects
• Poor English language capabilities > but we are improving slightly

According To Census 2000 Data:
South Florida Is Intermediate Compared To Other Metro Areas On
– Prime time commuting > and we’re getting a little better
– Total commuting time > but we’re getting worse
– Percent commuting alone > we’re about the same
– Percent carpooling > but we’re slightly worse
– Private schooling > and we’re about the same
– Aggregate and average household income > no comparative data
– Overall home ownership > and we’re improving slightly
According To Census 2000 Data,
South Florida Is Better Than Other Competitor Metros On:
• Immigrants who become citizens > and we’re improving
• Minority Black/Hispanic homeownership > and we’re getting better
• International migration > this is helpful in the long run