southern california association of …cssd.ucr.edu/seminars/pdfs/hasan ppt 5-17 ucr ranall lewis...
TRANSCRIPT

Hasan Ikhrata
Executive Director
SOUTHERN CALIFORNIA ASSOCIATION of GOVERNMENTS
Towards a Greener Southern California:
2012-2035 Regional Transportation Plan/ Sustainable Communities Strategy

SCAG Quick Facts
Ventura
Orange
Los Angeles
San Bernardino
Riverside
Imperial
Nation’s largest Metropolitan Planning Organization (MPO) and Council of Governments (COG)
6 counties, 191 cities and over 18
million residents Governed by a Regional Council of
84 local elected officials 17th largest economy in the world
9,000 lane miles of freeway 4 major airports Nation’s global gateway for trade
2

What We’ll Cover
Demographic and Market Trends 2012-2035 Regional Transportation Plan/Sustainable Communities Strategy (RTP/SCS) SCAG’s Future Planning Activities
3

Part 1
Demographic and Market Trends 2012-2035 Regional Transportation Plan/Sustainable Communities Strategy (RTP/SCS)
SCAG’s Future Planning Activities
4

Anticipated Future Growth
5
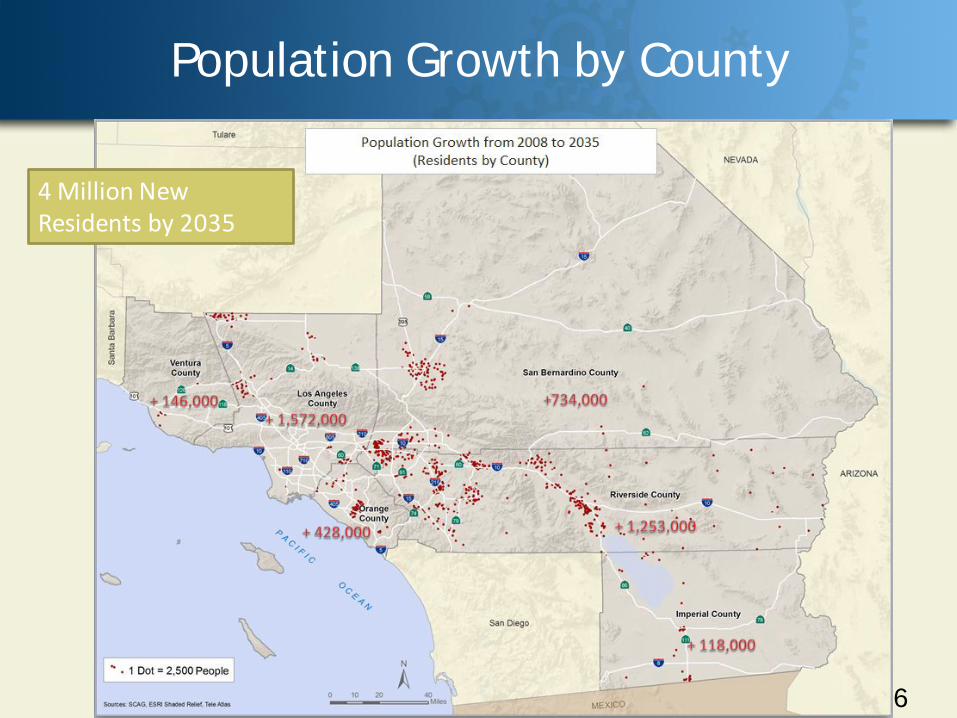
Population Growth by County
6
4 Million New Residents by 2035

7
1,651,392 (97.3%)
45,959 (2.7%)
1,697,351 (100.0 %)
Births (less) Deaths Domestic Foreign Migration Total Increase
Source: State of California, Department of Finance, County Population Estimates and Components of Change by Year
Southern California Sources of Population Growth, 2000-2010
Where is Population Growth Coming From? SCAG Region
7

Shift in Ages of the Population: SCAG Region
5.5
6.4
10.6
11.8
2.0
4.0
0 5 10 15 20 25
Population (millions)
Population By Age Group
0-20
21-64
65+
2010
20
35
30%
29%
59%
53%
11%
18%
Note: Percentages do not add to 100% due to rounding Source: US Census Bureau, SCAG 8

9
y y
0100,000200,000300,000400,000500,000600,000700,000800,000900,000
1,000,0001,100,0001,200,0001,300,0001,400,000
70-75 75-80 80-85 85-90 90-95 95-00 00-05 05-10 10-15 15-20 20-25 25-30 30-35 35-40
SCAG Region California
Source: State of California, Department of Finance, Race/Ethnic Population with Age and Sex Detail, 1970-2040. Sacramento, CA, December 1998.
Age 65+ Population will double
Shift in Ages of the Population: SCAG Region
9

Source: Dr. Arthur C. Nelson, Presidential Professor & Director of Metropolitan Research, University of Utah.
Housing: U.S. Demographic Trends
Household Type 1960 2005 2040
HH with Children 48% 32% 26%
HH without Children 52% 68% 74%
Single-person HH 13% 31% 34%
10

Housing: U.S. Market Trends
National Preference Existing Unit Type Total Share SCAG
Region
Attached 38% 42% Apartments 14% 37% Condos, Coops 9%* 24% Townhouses 15% 39%
Detached 62% 58% Small Lot (<7,000 sf) 37% 60% Large Lot (>7,000 sf) 25% 40% Sources: National housing preference based on a low range of surveys reviewed by Arthur C. Nelson “Leadership in a New Era,” Journal of the American Planning Association, Fall 2006; existing per California Department of Finance, 2009
*Toll Brothers shifting product mix to 15% condominium; WSJ 12/06 11

Implications of Changing Demographics
• Increased demand in close-in suburb, central cities, and communities with shopping, health services, church and transportation
• The region may have surplus of large-lot homes and increase in demand for small lot homes
• Increase in demand for health care and social services
• Pressures on tax revenues • Implications on transportation and community
design
12 12

Part 2
Demographic and Market Trends 2012-2035 Regional Transportation Plan/Sustainable Communities Strategy (RTP/SCS)
SCAG’s Future Planning Activities
13

14
CA Light-Duty Vehicle GHG Standards, 18.2%
Medium/Heavy Duty Vehicles, 0.8%
Vehicle Efficiency Measures, 2.6%
Energy Efficiency, 15.1%
Million Solar Roofs, 1.2%
Industrial Measures (Cap & Trade), 0.2%
Additional Reductions from Capped Sectors,
19.8%
Industrial Measures (Not Covered by Cap &
Trade), 0.6%Sustainable Forests,
2.9%
Recycling & Waste , 0.6%
High Global Warming Potential Gas Measures,
11.6%
Renewables Portfolio Standard, 12.2%
High Speed Rail, 0.6%
Regional Transportation-Related GHG Targets,
2.9%
Goods Movement, 2.1%
Low Carbon Fuel Standards, 8.6%
SB 375
Regional Light-Duty Vehicle Related GHG T argets, 2.9%
Planning Background - AB 32 Reduce GHG by 174 MMT by 2020
14

Planning Background - Purpose of SB 375
• Achieve specified GHG emission reduction targets in 2020 and 2035
– from autos and light duty trucks
– through land use and related policies
– Implement AB 32 (a small portion)
• Integrate RTP with other regional plans and processes
– Sustainable Communities Strategy (SCS)
– Regional Housing Needs Assessment (RHNA)
15

Planning Background - Purpose of SB 375
Part of AB 32 and enacted in SB 375
Southern California’s Long Range Transportation Plan must include a plan to reduce Greenhouse Gas Emissions
Target 8% by 2020 13% by 2035
Measures to Reduce Greenhouse Gas Emissions must be included in a Sustainable Communities Strategy

Planning Background Roles & Responsibilities of MPOs
• Prepare and adopt an Sustainable Communities Strategy (SCS) as part of the Regional Transportation Plan (RTP) • Develop methodologies and technical tools to estimate
GHG emissions • Adopt public participation plan • Conduct informational meetings and public hearings • Develop and adopt a framework to address
intra-regional relationships for sub-regional SCS, if necessary
• Develop overall guidelines & create public participation plans for sub-regional SCS, if necessary
• Develop an Alternative Planning Strategy (APS), if necessary
17

18
Draft RTP/SCS released for review and public comment
Regional Council Adopted 2012-2035 RTP/SCS
December 2011
April 2012
Timeline
Bottoms up development with cities, stake holders and elected officials 2010-2011
Regional Targets Advisory Committee set targets for regions
September 2009
18

19
RTP/SCS Bottom-Up Development Process
Data gathering sessions & planning workshops in 2011
29
Regional Council and Joint Policy Committee Meetings in 2011 6
Cities met with to update and develop land use and SED forecasts
175
Policy Committee and Subcommittee Meetings in 2011, including CEHD, EEC, TC, RTP Subcommittee, High-Speed Rail Subcommittee 30
Technical Committee Meetings in 2011, including Aviation TAC, P&P TAC, Transit TAC, Subregional Coordinators, Transportation Conformity Working Group
40 19

Recently adopted 2012-2035 Regional Transportation Plan/Sustainable Communities Strategy
• Almost $525 billion in investments to improve the SCAG region’s transportation system through 2035
• $263 billion in capital investments
• $217 billion in system operations, preservation, and maintenance
• $45 billion in debt service to advance construction of projects

Highways and Arterials Summary
Image courtesy Metro © 2012 LACMTA

Goods Movement

Transportation Demand Management Active Transportation

Rail Transit Investments 1990
24

Rail Transit Investments Today
25

Rail Transit Investments 2035
26

Rail Transit Investments 2035
27

Future HQTAs (2035)
28
28

Focusing Growth within the HQTAs
51% 53%
0%
10%
20%
30%
40%
50%
60%
70%
80%
90%
100%
New Housing New Employment
3% of total land
area
97%
HQTAsNon-HQTAs
29

Reversing the Past Trend
30
66%
32% 34%
68%
0%
10%
20%
30%
40%
50%
60%
70%
80%
Single Family
Multifamily
2000 - 2010 2010 - 2035

Benefits from the 2012-2035 RTP/SCS
Mobility
Economy
Location Efficiency
Cost Effectiveness
31

Mobility Reduce Per Capita Travel Delay by 1/3
60 minutes
40 minutes
32

generated each year on average with the Plan “Not just construction workers, but jobs in all sectors of the economy”
Economy
33

Location Efficiency: Projected Growth in Households to High Quality Transit Areas
Projected household growth WITHOUT 2012-2035 Proposed Final RTP/SCS Plan.
Over TWICE as many households will live in high quality transit opportunity areas WITH Plan.
34

Cost Effectiveness: $2.90 Return for Every $1.00 Spent
35

Land Consumption DECREASE by over 400 SQUARE MILES
Household Savings annual SAVINGS of $3,400 per household in 2035
Heath Outcome REDUCE health incidences by 95,000 in 2035
Additional Benefits
36

Part 3
Demographic and Market Trends 2012-2035 Regional Transportation Plan/Sustainable Communities Strategy (RTP/SCS)
SCAG’s Future Planning Activities
37

3 Key RTP/SCS Strategies
allocate
ONLY 13% capital investment
to highways
focus over
50% growth within
3% land area
FROM 7:3 single- vs. multi-
family units
TO 3:7
38

Compass Blueprint
39
Technical assistance to local governments for planning consistent with the 2012 RTP/SCS
Planning Services & Tools • Public Involvement • Local Climate Action Plans • Return-on-Investment
Analysis • Economic Development
Strategies • Urban Design Solutions
Demonstrate the local benefits of planning consistent with regional goals Create models to replicate throughout the region Livability, Mobility, Prosperity, Sustainability
• Transit Studies • Code Amendments • Photo & Video Visualizations • Multi-modal Transportation
Modeling • Parking Analysis • Financing Strategies • Scenario Planning

Compass Blueprint Demonstration Projects
133 Projects with a total SCAG contribution of $ 14 million
Laguna Niguel Sustainable South Bay Ventura FWY Cap Downtown Fontana Calexico Gateway WRCOG NEV Plan
• Projects in all six SCAG region counties • 86 different lead agencies • 76 SCAG member jurisdictions • Average project cost valued at $125,000
40

Compass Blueprint Demonstration Projects
41
The Expo Line presents opportunities for increased connectivity and economic development
Compact, walkable transit-oriented development
800 acres Urban infill strategy Opportunity sites and prototypes Video fly-through visualizations Detailed land-use scenarios Regulatory changes
Los Angeles Planning Dept Expo Line Station Visions

Compass Blueprint Demonstration Projects
Proposed near-term and long-term low speed routes for NEV network:
Riverside Corona Norco Moreno Valley
Create NEV charging stations Provide separately marked parking Action plan and program Opportunities and constraints map
WRCOG Neighborhood Electric Vehicle (NEV) Plan
42

40,000 - 60,000 vehicles per day travel along the three-mile Imperial Highway corridor
Developed a Specific Plan covering:
71 acres 433 dwelling Mixed-use land use policies Transit-oriented development Pedestrian and bicycle planning Parking districts Infrastructure plans for water system, wastewater, and storm drain systems
La Mirada Imperial Hwy Corridor Specific Plan
Compass Blueprint Demonstration Projects
43

Compass Blueprint Demonstration Projects
44

New Sustainability Program Implementation Assistance for SCS
45
• Green Region Program
• Expanded Compass Blueprint
• Active Transportation
• General Plan Update Assistance
• Member Benefit

46 46
Thank You!