southern voice 2015
TRANSCRIPT

Southern VoiceOn Post-MDG International Development Goals2015
SS
Southern VoiceP o s t - M D G s 2 0 1 5
Southerrnn VVoiceP o s t -- MM D G s 2 0 1 5
Southern VoiceP o s t - M D G s 2 0 1 5
Southheerrnn VoiceP o s t - M D G s 22 0 1 5
Southern VoiceP o s t - M D G s 2 0 1 5
n VoiceG s 2 0 1 5
SouthP o s t - M
Southerrnn VoiceP o s t - MM DD G s 2 0 1 5
Southern VoiceP o s t - M D G s 2 0 1 5
Southern VoiceP o s t - M D G s 2 0 1 5
Southheerrn VoiceP o s t - M D GG ss 2 0 1 5
Southern VooiiceP o s t - M D G s 22 0 1 5
Southern VoiceP o s t - M D G s 2 0 1 5
Southern VoiceP o s t - M D G s 2 0 1 5
Southern VoiceP o s t - M D G s 2 0 1 5
Souutthern VoiceP o s t - MM D G s 2 0 1 5
n VoiceG s 2 0 1 5
SouthP o s t - M
Southern VoiceP o s t - M D G s 2 0 1 5
Southern VoiceP o s t - M D G s 2 00 11 55
Southern VoicePP oo ss t - M D G s 2 0 1 5
Southern VoiceP o s t - M D G s 2 0 1 5
Southhern VoiceP o s t - MM D G s 2 0 1 5
Southern VoiceeP o s t - M D G s 2 0 11 5
SSoouthern VoiicceeP o s t - M D G s 2 0 1 5
SSouthern VoiceP o ss t - M D G s 2 0 1 5
Southern VVoiceP o s t - M D G s 2 0 1 5
n VoiicceG s 2 0 1 5
SouuthP o s tt - M
Southern VoiceP o s t - M D G s 2 0 1 5
SSouutherrnn VoiceP oo s t - M DD G s 2 00 1 5
Southheerrn VooiceeP o ss tt - M D GG s 2 0 11 5
Southern VoiceP o s t - M D G s 2 0 1 5
Souuthern VoiceP o s t - M D G s 2 0 1 5
Southernn VVoiceeP o s t - M D GG s 2 0 1 55
SSouthern VoiceP o s t - M D G s 2 0 1 5
SSouthherrnn VoiceP oo s t - MM D GG s 2 0 1 5
Southern VoiiceP o s t - M D G s 2 0 1 5
n VooiceG s 2 00 1 5
SouuthP o s tt - M
Southern VoiceP o s t - M D G s 2 0 1 5
SSouthhern VoiceP o s t - MM D G s 2 0 1 5
Southheern VVoiceeP o s t - MM D G ss 2 0 1 5
Southern VoiceP o s t - M D G s 2 0 1 5
Souutthern VoiceP o s t -- M D G s 2 0 1 5
Southern VVoiiceP o s t - M D G s 22 0 11 55
Southheerrnn VVoicePP o s t - M D G s 2 0 1 55
Souuthheern VoiceP oo s t - MM D G s 2 0 1 5
Southern VooiceP o s t - M D G s 22 0 1 5
n VoiceeG s 2 0 1 5
SSouthPP o s t - M
Southern VoiceP o s t - M D G s 2 0 1 5
Soutthhernn VVoiceP o s t - M DD GG s 2 0 11 55
Soutthheern VVoicePP o s t - M DD GG s 2 0 1 5
Southern VoiceP o s t - M D G s 2 0 1 5
Southernn VoiceP o s t - M D G ss 2 0 1 5
Southern VoiceP o s t - M D G s 2 0 1 5
Southern VoiceP o s t - M D G s 2 0 1 5
Southern VoiceP o s t - M D G s 2 0 1 5
Southerrnn VoiceP o s t - M DD G s 2 0 1 5
n VoiceG s 2 0 1 5
SouthP o s t - M
Soouuthern VoiceP o s tt - M D G s 2 0 1 5
Southern VoiceP o s t - M D G s 2 0 1 5
Southern VoiceP o s t - M D G s 2 0 1 5
Southern VooiiceP o s t - M D G s 22 0 1 5
Southern VoiceP o s t - M D G s 2 0 1 5
Southern VoicePP o s t - M D G s 2 0 1 5
Southern VoiceP o s t - M D G s 2 0 1 5
Southern VoiceP o s t - M D G s 2 0 1 55
Southern VoiceP o s t - M D G s 2 0 1 5
n VoiceG s 2 0 1 5
SouthP o s t - M
Southern VoiceP o s t - M D G s 2 0 1 5
Southern VoicePP oo ss t - M D G s 2 0 1 5
Southern VoiceP o s t - M D G s 2 00 11 5
SSouthern VoiceP o s t - M D G s 2 0 1 5
Occasional Paper Series
Is the Current Booming Growthin Africa Worth Celebrating?Some Evidence from Tanzania
Bitrina DiyamettMusambya Mutambala
9

IS THE CURRENT BOOMING GROWTH IN
AFRICA WORTH CELEBRATING?
Some Evidence from Tanzania
Southern Voice Occasional Paper 9
Bitrina Diyamett*
Musambya Mutambala**
Bitrina Diyamett, PhD is the Executive Director in Science, Technology and Innovation Policy Research Organization (STIPRO), Tanzania. She can be reached at: [email protected] Mr Musambya Mutambala is an Assistant Research Fellow at Science, Technology and Innovation Policy Research Organization (STIPRO), Tanzania. He can be reached at: [email protected]

ii
Publisher Southern Voice on Post-MDG International Development Goals Website: southernvoice-postmdg.org E-mail: [email protected] Secretariat: Centre for Policy Dialogue (CPD) House 40C, Road 32, Dhanmondi R/A Dhaka 1209, Bangladesh Telephone: (+88 02) 9141703, 9141734 Fax: (+88 02) 8130951; E‐mail: [email protected] Website: cpd.org.bd First Published May 2014
© Southern Voice on Post-MDG International Development Goals Disclaimer: The views expressed in this paper are those of the authors alone and do not necessarily reflect the views of Southern Voice on the Post-MDG International Development Goals or CPD or any other organisation(s) that the authors are affiliated with.
ISSN 2307-9827 (Online) ISSN 2307-681X (Print) Editor Debapriya Bhattacharya, PhD Chair, Southern Voice on Post-MDG International Development Goals and Distinguished Fellow, CPD E-mail: [email protected] Cover Design Avra Bhattacharjee

iii
Preface
The Southern Voice on Post-MDG International Development Goals was born in the spirit of collaboration,
participation and broad academic inquiry. It is a network of 48 think tanks from Africa, Latin America and
South Asia which has identified a unique space to contribute to the post-2015 dialogue. By providing quality
data, evidence and analyses derived from research in the countries of the global South, these think tanks seek
to inform the discussion on the post-2015 framework, goals and targets, and to help to shape the debate itself.
With these goals in mind, Southern Voice launched a call for papers among its members to inform the global
debate based on the research they have already carried out, to strengthen national or regional policy
discussions. The objective of the call was to maximise the impact of the knowledge that already exists in the
global South, but which may have not reached the international arena.
In response to the call, we received numerous proposals which were reviewed by Southern Voice members. The
research papers were also peer reviewed, and the revised drafts were later validated by the reviewer.
The resulting collection of ten papers highlights some of the most pressing concerns for the countries of the
global South. In doing so, they explore a variety of topics including social, governance, economic and
environmental concerns. Each paper demonstrates the challenges of building an international agenda which
responds to the specificities of each country, while also being internationally relevant. It is by acknowledging
and analysing these challenges that the research from the global South supports the objective of a meaningful
post-2015 agenda.
In connection with the ongoing debates on post-2015 international development goals, Is the Current
Booming Growth in Africa Worth Celebrating? Some Evidence from Tanzania by Dr Bitrina Diyamett
(Executive Director) and Mr Musambya Mutambala (Assistant Research Fellow) at Science, Technology and
Innovation Policy Research Organisation (STIPRO), Tanzania, focuses on the challenges in Africa in the area of
structural transformation, manufacturing sector growth and technological capabilities.
I would like to gratefully acknowledge the contributions of Ms Andrea Ordóñez (Research Coordinator of the
initiative) and Ms Mahenaw Ummul Wara (Research Associate, Centre for Policy Dialogue (CPD) and Focal Point
at the Southern Voice Secretariat) in managing and organising the smooth implementation of the research
programme.
I would also like to thank Dr Donald Mmari (Director, REPOA) for peer reviewing, and Dr Oliver Turner for copy
editing the paper.
I would like to take this opportunity to recognise the support of Think Tank Initiative (TTI) towards Southern
Voice, particularly that of Dr Peter Taylor, Programme Leader, TTI.
I hope the engaged readership will find the paper stimulating.
Dhaka, Bangladesh Debapriya Bhattacharya, PhD May 2014 Chair
Southern Voice on Post-MDG International Development Goals and
Distinguished Fellow, CPD E-mail: [email protected]
iv
Abstract
Economic growth is an important factor in poverty alleviation, and in Africa where most of the world’s poorest
countries are located, there is currently booming growth. This is partly the reason why this growth is widely
celebrated. With a focus on Tanzania, this paper unpacks this growth, especially on its long-term potential in
poverty alleviation and achievement of Millennium Development Goals (MDGs). The paper finds a missing link
in the relationship between growth and long-term poverty reduction, which is perceived to have resulted from
a premature structural transformation from agriculture to the services sectors which are less skill-intensive
and less employment-generating. As a way forward, the paper proposes an alternative policy focus for poverty-
reducing growth. Much of the emphasis has been put on normal structural transformation, towards more
employment and skills enhancing manufacturing sector, and building associated technological capabilities
around it.
v
Contents
Preface.................................................................................................................................................................................................................. iii
Abstract ............................................................................................................................................................................................................... iv
Acronyms ............................................................................................................................................................................................................. vi
1. Introduction .................................................................................................................................................................................................. 1
2. Methodology ................................................................................................................................................................................................. 1
3. Growth and Poverty: A Theoretical Construct .............................................................................................................................. 2
4. Booming Growth in Africa and Poverty: The Case of Tanzania ............................................................................................. 3
5. State of the Manufacturing Sector in Tanzania: Looking Beyond the Slow Growth .................................................... 7
6. Conclusion and Recommendations ................................................................................................................................................. 10
References ........................................................................................................................................................................................................ 12
List of Tables
Table 1: African Fastest Growing Nations according to Technology Readiness and Innovation ............................... 9
Table 2: Technology Readiness: Ranking over 144 Countries ................................................................................................... 9
Table 3: Innovation: Ranking over 144 Countries ........................................................................................................................ 10
List of Figures
Figure 1: Trend in Purchasing Power of Tanzania ........................................................................................................................... 4
Figure 2: National Accounts: Selected Ratios ..................................................................................................................................... 4
Figure 3: Share of Productive Sectors in Tanzanian GDP ............................................................................................................. 5
Figure 4: Premature Structural Transformation............................................................................................................................... 5
Figure 5: Share of MVA in Medium and High-Tech .......................................................................................................................... 7
Figure 6: Structure of Manufactured Exports by Technology Classification........................................................................ 8
Figure 7: Processing Degree of Resource-based Exports .............................................................................................................. 8

vi
Acronyms
FDI Foreign Direct Investment
GDP Gross Domestic Product
MDG Millennium Development Goals
MVA Manufactured Value Addition
STIPRO Science, Technology and Innovation Policy Research Organisation

Is the Current Booming Growth in
Africa Worth Celebrating?
Some Evidence from Tanzania
Bitrina Diyamett
Musambya Mutambala
1. Introduction The aim of any well-meaning government is to ensure a decent standard of living for its citizens. This is also at the heart of the Millennium Development Goals (MDGs). Many of the current MDGs, whether social or economic, finally boil down to ensuring secure life for all the world’s population, and this to a large extent can be achieved by eradicating extreme poverty and hunger (Goal One of the eight MDGs). Unfortunately however, while some countries have made progress towards most of the Goals1, most have failed to significantly reduce their levels of extreme poverty. In addition to the MDGs, for most poor countries their economic policy focus has largely been on poverty alleviation. An important factor here is economic growth, which to a large extent explains why the current high growth rate in some of the African countries is being celebrated. A key question, however, has to be: is this growth worth celebrating? More specifically, is African economic growth positioned to eradicate poverty? Largely focusing on Tanzania, this paper attempts to answer this crucial question by analysing this growth and looking beyond the aggregate figures. To set the context following a short methodological note in Section 2, the paper examines the theoretical construct of the relationship between growth and poverty where issues on structural transformation are introduced (Section 3). In Section 4 we provide details on where the growth for most African countries is coming from, and applying the theoretical construct provided in Section 3 to the case of Tanzania, assess the extent to which Africa’s current growth is reducing poverty. Section 5 of the analysis on the current state of the manufacturing sector in Tanzania and associated technological capabilities further confirms arguments made in Section 4, but also brought in here as a proposal for appropriate move towards more desirable growth that comes from normal structural transformation. The last section provides some concluding remarks and suggested ways forward for Tanzania and other African countries for the post-2015 development agenda. 2. Methodology
The empirical materials used in this paper are largely from secondary sources. A number of items from the literature, as well as the World Economic Outlook, have provided insights into the growth status of economies in Africa. In the case of Tanzania, this information has provided a base to establish a relationship between poverty levels and growth in these countries. Above all, the recently published Tanzania Industrial Competitiveness Report 2012, to which the Science, Technology and
1Tanzania for example, has made progress and is likely to achieve MDG 2 on universal primary education and MDG 6
on combating HIV/AIDS, malaria and other diseases. The country is also on track to achieve the Goals concerning
gender equality (MDG 3), child mortality (MDG 4), environmental sustainability (MDG 7) and global partnerships for
development (MDG 8) (URT 2011c).
Southern Voice Occasional Paper 9
Page | 2
Innovation Policy Research Organisation (STIPRO) contributed, was used to analyse the state of the science, technology and innovation (STI) environment, especially for the Tanzanian manufacturing sector. A number of research reports carried out by STIPRO have also enriched this analysis. 3. Growth and Poverty: A Theoretical Construct
The concept of ‘poverty’ is multidimensional in character. It is commonly defined with reference to income (the economic aspects), such as the less than - 1 USD/day measure, and to non-income measures (the social aspects) such as low educational attainment and poor health (World Bank 2001). It is perhaps income which has the greatest implications for poverty than all other aspects. As noted by Mejer (1999:1) for example, “the poor shall be taken to mean persons, families and groups of persons where resources are so limited as to exclude them from a minimum acceptable way of life in the countries in which they live”. Of course income poverty is also easy to measure and monitor. In fact, the MDGs have placed an emphasis on this form of poverty, and it is also the way poverty is understood in this paper. Methods to reduce poverty are debated both in policy and academic arenas. One very important debate surrounds the growth of the economies. It is now universally accepted that economic growth is a necessary condition for poverty alleviation. Growth in general facilitates poverty alleviation; an observation from the World Development Report 2000-01 tells us that as countries become richer, on average the incidence of income poverty falls. Other indicators of well-being, such as average levels of education and health, also tend to improve (World Bank 2001). This happens because growth encourages increase in incomes, which in turn, pushes people out of poverty (Dollar and Kraay 2002). However, this does not seem to be an automatic process, because others have observed the converse, and argue that growth is a necessary but not a sufficient condition for poverty reduction. Osmani (2003), for example, argues that there is no invariant relationship between the rate of growth and the rate of poverty reduction, i.e. faster growth is not always accompanied by faster poverty reduction, just as slower growth does not always entail slower rates of poverty reduction. According to Osmani, three factors affect the incomes of the poor in growing economies. The first is the growth factor (a necessary condition) which is the rate at which the production potential of the economy expands. The second is the elasticity factor which is the extent to which growth enhances employment potential. Third is the integratability factor, which is the extent to which the poor are able to integrate into economic processes in such a way that when growth occurs and the employment potential expands, they can take advantage of the improving quality and quantity of employment. For this reason, sustainable and poverty-reducing growth, as well as employment generation, will ultimately depend on positive structural transformation in countries. This means the movement of resources from low productivity to high productivity employment, while at the same time generating more employment. It also entails a transition of the economy from a reliance on low value-added sectors to higher value-added sectors. The process starts with a successful structural transformation where agriculture, through higher productivity, provides food, labour, and even savings to the process of urbanisation and industrialisation, and as economies move up the ladder of development, services sectors would gain importance (Timmer 2007). Overall, observations of the process by many scholars and practitioners have revealed the critical importance of the manufacturing sector in growth and development because of its unique multiplier effect. The US institute of manufacturing in its book ‘The Facts About Modern Manufacturing’ for instance has shown that manufacturing has a ‘pull effect’ on other sectors of the economy. Its multiplier effect is stronger than other sectors due to its potential in creating employment (USA, 2009). The development of the manufacturing sector stimulates demand for more and better services including banking, insurance, communication and transport, and leads to job creation.

Current Booming Growth in Africa: Some Evidence from Tanzania
Page | 3
To a large extent the above has been demonstrated by the recent Malaysian development processes. Malaysia underwent a structural shift associated with a transition from an agrarian to industrial society. This can be seen in the changing shares of the agricultural and manufacturing sectors in their respective contributions to gross domestic product (GDP), the total value of exports, and total employment. With an agrarian economy, Malaysia in the late 1980s experienced high export-oriented and manufacturing-led growth, averaging over 8 per cent annually. This helped in transforming Malaysia into a newly industrialising economy. Between 1960 and 2000 the agriculture sector’s share of GDP declined from 40.5 per cent to 12.8 per cent, while the contribution from manufacturing rose from 8.2 per cent to 34.7 per cent (Khoo 2010). As explained in the process of structural transformation, the process has to start with productivity growth in agriculture and Malaysia did not ignore this sector. Stronger links between it and manufacturing were fostered and skill development and worker re-deployment gradually brought about labour shifts from agriculture to industry. Employment in Malay manufacturing increased from 17 per cent in 1990 to 26.3 per cent in 2000, while it decreased in agriculture from 36.7 per cent to 18.2 per cent. In services the proportion of labour slightly increased from 21.2 per cent to 25 per cent in the respective years (World Bank 2004). Alongside the structural transformation was a dramatic reduction of poverty. At the beginning of the Five Year Economic Plan (the Sixth Malaysia Plan of 1991–1995), statistics indicated an official poverty rate of 17.1 per cent (Malaysia, 1991: 32). By 2004, according to the Ninth Malaysia Plan 2006-2010, the incidence of poverty had fallen to 5.7 per cent for all households (Malaysia, 2006: 329). A related example is the salmon growing regions of Chile. Typically, Chile was successful in adding value to its agricultural products, namely fish (salmon), grape fruits, berries and fresh fruits. The development of the salmon industry led to the development of other local manufacturing industries, such as fish farming which gained cages and nets, the construction of floating warehouses, the manufacture of feed, vaccines and antibiotics, transportation and infrastructure maintenance. Consequently, the poverty rates in salmon producing regions dropped from over 40 per cent in 1990 to 24 per cent in 2000 (Montero 2004; cited in URT and UNIDO 2012). 4. Booming Growth in Africa and Poverty: The Case of Tanzania Like many African countries, Tanzania is growing fast. Its GDP increased from 4.9 per cent in 2000 to 6.9 per cent in 2012 (World Bank 2013). This economic growth places Tanzania among the 17 fastest growing economies alongside other African countries such as Ethiopia (7 per cent GDP growth), Mozambique (7.5 per cent), Democratic Republic of Congo (7.1 per cent), Ghana (7 per cent), Zambia (6.9 per cent), Angola (8.4 per cent), Cote d’Ivoire (9.8 per cent), and Nigeria (6.3 per cent) (IMF 2013). Indeed, the World Bank recently released its list of 29 fastest growing economies in the world in its semi-annual “Global Economic Prospect.” Sixteen countries from the list are from Africa, including those cited above. On the back of rapid growth many African countries could have markedly reduced their numbers of poor people. This is not the case for most, however. In Tanzania for instance, and despite high economic growth, household income poverty has remained virtually unchanged; the national poverty headcount fell by just 2.1 per cent, from 35.7 per cent in 2000-2001 to 33.6 per cent in 2007 (World Bank 2009); and according to the UNDP (2013b) there is no prospect of Tanzania decreasing the proportion of its population which earns below $1 per day to 19.5 per cent by 2015 as targeted in the MDG agenda. In addition, household surveys have found that income inequality did not change significantly during 2001-2007, and that it is not likely to change (World Bank 2009). This paradox is even more obvious if one looks at the trends in the purchasing power of Tanzanians, which has drastically declined at a time of consistent GDP growth over the past decade, as indicated in Figure 1. The same is reflected in Figure 2 on National Accounts, where most variables have indicated positive trends except in household consumption. The failure of current economic growth to translate into a corresponding reduction of poverty, and the dramatic decrease in purchasing power witnessed in Tanzania, indicates that such a growth has not been pro-poor. It is not coming from sectors that are employment generating and the poor have not fully been involved in both the production and consumption in the national economy. This is

Southern Voice Occasional Paper 9
Page | 4
indicated in Figure 3 below which shows the structure of the Tanzanian economy. It is also important to note that there has been a premature structural transformation, where there was a sharp decline of agriculture contribution to GDP and an increase of services from 1991, while manufacturing has lagged far behind (Figure 4). Figure 1: Trend in Purchasing Power of Tanzania
Source: URT (2011b).
Figure 2: National Accounts: Selected Ratios
Source: Authors plot, data sources from World Bank (2013) and URT (2012).

Current Booming Growth in Africa: Some Evidence from Tanzania
Page | 5
Figure 3: Share of Productive Sectors in Tanzanian GDP
Source: URT (2011).
Figure 4: Premature Structural Transformation
Source: Data from World Bank (2013b).
There are two possible explanations for the above paradox. First, services grew abruptly because of increased informal activities which arose from labour being displaced from formal employment during the privatisation of the early 1990s. It can also partly be explained by people abandoning

Southern Voice Occasional Paper 9
Page | 6
agriculture due to falling productivity and prices. This fall in prices of traditional export crops is said to be a contributing factor to a reduction in export earnings by the agriculture sector from 50 per cent in the mid-1990s to 23 per cent in 2002 (Amani 2005). It is also important to note that industry (particularly mining and construction) experienced a modest growth around the same time. This could again be attributed to privatisation which was associated with increased foreign investments, particularly in the mining sector. Generally however, and important for this paper, this brought about an increase in capital-intensive investments that were not employment-generating. As indicated in Figures 3 and 4 above, the Tanzanian economy is now service-oriented. We call this a premature transformation because there was no prior productivity increase in either agriculture or manufacturing (as indicated in the theoretical framework section). As already indicated conventional transformation starts with agricultural transformation, leading to growth in the industrial and then service sectors. Every territory in the world has followed this pattern with the exception of those who had no agriculture to begin with (such as Hong Kong and Singapore) (Timmer 2007). In addition, much of the growth in the services sector in Tanzania is from less skill and employment intensive sub-sectors of trade (mostly retail in the informal) and repair. According to URT (2012), the leading sub-sectors of the services sector are: trade and repair (14.7 per cent), real estates and business services (10.2 per cent) and public administration (7.8 per cent), with very little contribution from knowledge-intensive sub-sectors of IT services, research and development, financial, as well as the logistics and communications industries. Tanzania is not alone in this way: we believe it is the case for most of the countries in Africa. According to the World Bank for example, services is the leading contributing sector to the GDPs of Mozambique, Zambia and Ghana, with figures of 47.2 per cent, 43.2 per cent and 48.5 per cent respectively (World Bank 2013b). In countries like Democratic Republic of Congo and Ethiopia, services follow agriculture with contributions of 32.6 per cent and 43.1 per cent of GDP respectively, leaving behind manufacturing sectors that are still at an infant stage. McMillan and Rodrik (2012: 1) have observed the same trend for Africa as well as Latin America: “….for Latin America and Sub-Saharan Africa, globalisation appears not to have fostered the desirable kind of structural change. Labour has moved in the wrong direction—from more productive to less productive activities, including, most notably, informality.” The above low productivity and low employment potential in services sectors must to a significant extent have accounted for much of the poverty in poor countries. If conventional transformation is followed, a services orientation tends to be accompanied by, high income, and high quality of life. Singh (2006), for instance, argues that the transformation process which follows the standard pattern is considered superior because along with raising productivity and standards of living, also comes institutional, organisational and cultural changes which make society as whole more capable, productive, innovative and peaceful. The empirical evidence for structural transformation and growth that enhance employment and reduce poverty is highly mixed between Tanzania and Malaysia. Malaysia primarily selected strategies that could provide opportunities for the poor to be involved in the production and consumption functions, or gain employment in higher-paying jobs which would allow them to become self-supporting. The country implemented a variety of innovative programmes that were aimed at increasing productivity and diversifying sources of income. Since poor households were mostly in the agriculture sector, the focus was on providing them with the support and opportunities to be involved in modern farming and the value-added processing of agricultural products, as well as non-farm or off-farm activities that generated additional employment. This way, Malaysia managed to drastically reduce the incidence of poverty within the context of rapid and continuous economic growth (World Bank 2004). The role of technology, innovation and structural transformation here is critical; the Malaysian case of poverty reduction shows that some of the gains in rural incomes came from productivity increases brought about by modernisation, commercialisation and technological improvement of smallholder agriculture and from more intensive farming. Above all, significant gains came from structural changes in rural employment, resulting in the diversification of income sources with non-agricultural activities accounting for more than half of the income of rural

Current Booming Growth in Africa: Some Evidence from Tanzania
Page | 7
households. In addition, the growth in the demand for non-agricultural labour encouraged large numbers of self-employed and unpaid family workers to enter the wage-labour market, making wage income a more important determinant of rural household income (The Government of Malaysia, 1991: 43). Unlike in Malaysia, the high incidence of poverty in Tanzania corresponds to a failure to implement and support programmes that create productive employment and raise incomes of the poor.
5. State of the Manufacturing Sector in Tanzania: Looking Beyond the Slow Growth Having established that increasing productivity in the manufacturing sector is the way towards more employment-enhancing and poverty-reducing growth, we now closely examine this sector in Tanzania. The main purpose is to further explain the reasons why Tanzanian economic growth is failing to alleviate poverty, and to explore the best way forward not only for Tanzania, but also for many other African countries. We start with the structure of the sector, before discussing its technology readiness and innovation. 5.1 Structure of the Sector As indicated by the structure of the national economy (Figure 3), and in the Tanzania Industrial Competitiveness Report 2012, the performance of Tanzania’s manufacturing sector is not impressive. The technology intensity of the sector is very low, and even in the medium and high-technology sectors, the products are at the lower end of the technology spectrum (URT and UNIDO, 2012). Furthermore, Tanzania appears to be de-industrialising as the share of Manufactured Value Addition (MVA) in medium and high technology is falling rather than increasing. That is, the level of sophistication is lower compared to other countries and as the Figure 5 below shows, Tanzania has in fact become less sophisticated over the period. Figure 5: Share of MVA in Medium and High-Tech
Source: URT and UNIDO: TICR 2012.
The manufacturing sector is dominated by resource based sectors, which constitutes around two-thirds of manufactured exports (Figure 6). Much of the resource based industry is dominated by low value addition (Figure 7), and therefore very limited employment potential. A resources base is not

Southern Voice Occasional Paper 9
Page | 8
necessarily a bad thing to start with if correct policies are implemented to quickly move up the value chain. It should be recognised however that opening up to the world economy, as occurs through globalisation, reduces incentives to diversify towards modern manufactures and reinforces traditional specialisation patterns for countries that have comparative advantage in natural resources (Rodrik and McMillan, 2012). This fact should be taken into account when devising strategies for moving up the value chain. Figure 6: Structure of Manufactured Exports by Technology Classification
Source: URT and UNIDO: TICR 2012. Figure 7: Processing Degree of Resource-based Exports
Source: URT and UNIDO: TICR 2012.

Current Booming Growth in Africa: Some Evidence from Tanzania
Page | 9
The major problem for Tanzanian manufacturing sector is not only the very low value addition to its resource-based industries, but also a very thin, labour-intensive and low technology sector that would have provided ample employment if appropriate policies are put in place. As indicated in Figure 2, there is a negative gap between the Tanzanian imports and exports, with imports rising very sharply. Many of the imported goods are those that can easily be manufactured locally, generating significant employment in the low-tech sectors such as agro-processing, while at the same time contributing to productivity growth in the agriculture sector. A recent study carried out in Tanzania indicates that much of the low performance of the agriculture sector is to a large extent attributed to the underperformance in the manufacturing sector (Diyamett et al. 2013). 5.2 Technology Readiness and Innovation Technological change and innovation are essential to productivity growth, proper structural transformation and employment generation. It is unfortunate that Tanzania and other growing economies in Africa have low capacities to harness the benefits of existing technologies either from home or abroad to enhance the productivity of their industries. Furthermore, they fail to strengthen enabling factors for innovative activities. In the Global Competitiveness Report 2012-13 by the World Economic Forum (WEF), the fastest growing economies in Africa rank very low in technology readiness and innovation (Tables 1 and 2 below). Table 1: African Fastest Growing Nations according to Technology Readiness and Innovation
Country Technology Readiness Innovation Rank/144 Countries
Values Scored
Rank/144 Countries
Values Scored
Ethiopia 140 2.5 114 2.7 Mozambique 121 2.8 122 2.6 Ghana 108 3.1 95 3.0 Zambia 115 3.0 61 3.3 Tanzania 122 2.8 75 3.1 Nigeria 112 3.1 78 3.1 South Africa 62 4.0 42 3.5 China 88 3.5 33 3.3 Mauritius 63 4.0 98 2.9 Malaysia 51 4.3 25 4.4
Source: WEF: Global Competitiveness Report 2012-13.
Table 2: Technology Readiness: Ranking over 144 Countries
Index Ethiopia Mozambique Ghana Zambia Nigeria Tanzania
Availability of latest technologies
132 111 86 92 85 122
Firm-level technology absorption
139 110 115 88 72 129
FDI and technology transfer 128 41 82 69 90 66
Individuals using internet (%) 142 129 109 116 91 113
Broadband internet subscriptions/100 population
131 124 115 126 119 137
International internet bandwidth kb/s per use
98 131 142 138 139 133
Mobile and broadband subscriptions/100 population
120 111 42 117 97 109
Source: WEF: Global Competitiveness Report 2012-13.
Looking ahead, important reforms will be needed to solve the competitiveness challenges, particularly in all the factors that enable industries to harness technologies. While in general these economies seem to provide favourable environments for foreign direct investment (FDI) and
Southern Voice Occasional Paper 9
Page | 10
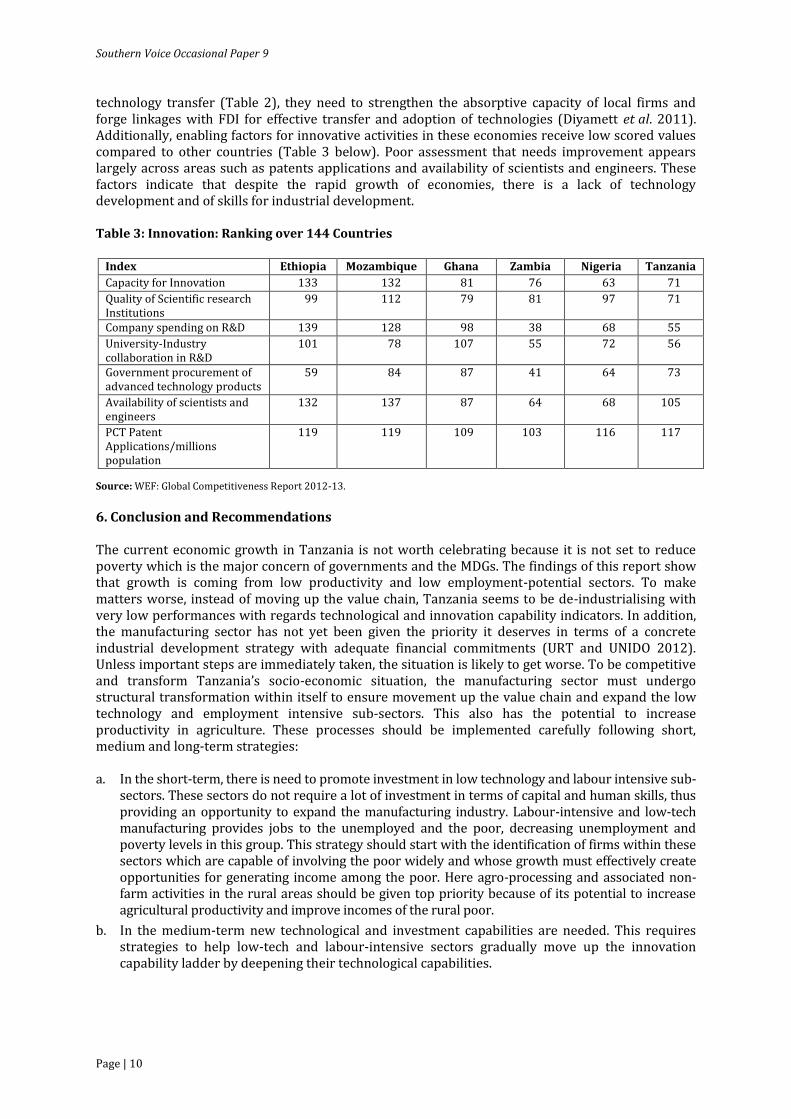
technology transfer (Table 2), they need to strengthen the absorptive capacity of local firms and forge linkages with FDI for effective transfer and adoption of technologies (Diyamett et al. 2011). Additionally, enabling factors for innovative activities in these economies receive low scored values compared to other countries (Table 3 below). Poor assessment that needs improvement appears largely across areas such as patents applications and availability of scientists and engineers. These factors indicate that despite the rapid growth of economies, there is a lack of technology development and of skills for industrial development. Table 3: Innovation: Ranking over 144 Countries
Index Ethiopia Mozambique Ghana Zambia Nigeria Tanzania
Capacity for Innovation 133 132 81 76 63 71
Quality of Scientific research Institutions
99 112 79 81 97 71
Company spending on R&D 139 128 98 38 68 55
University-Industry collaboration in R&D
101 78 107 55 72 56
Government procurement of advanced technology products
59 84 87 41 64 73
Availability of scientists and engineers
132 137 87 64 68 105
PCT Patent Applications/millions population
119 119 109 103 116 117
Source: WEF: Global Competitiveness Report 2012-13.
6. Conclusion and Recommendations The current economic growth in Tanzania is not worth celebrating because it is not set to reduce poverty which is the major concern of governments and the MDGs. The findings of this report show that growth is coming from low productivity and low employment-potential sectors. To make matters worse, instead of moving up the value chain, Tanzania seems to be de-industrialising with very low performances with regards technological and innovation capability indicators. In addition, the manufacturing sector has not yet been given the priority it deserves in terms of a concrete industrial development strategy with adequate financial commitments (URT and UNIDO 2012). Unless important steps are immediately taken, the situation is likely to get worse. To be competitive and transform Tanzania’s socio-economic situation, the manufacturing sector must undergo structural transformation within itself to ensure movement up the value chain and expand the low technology and employment intensive sub-sectors. This also has the potential to increase productivity in agriculture. These processes should be implemented carefully following short, medium and long-term strategies: a. In the short-term, there is need to promote investment in low technology and labour intensive sub-
sectors. These sectors do not require a lot of investment in terms of capital and human skills, thus providing an opportunity to expand the manufacturing industry. Labour-intensive and low-tech manufacturing provides jobs to the unemployed and the poor, decreasing unemployment and poverty levels in this group. This strategy should start with the identification of firms within these sectors which are capable of involving the poor widely and whose growth must effectively create opportunities for generating income among the poor. Here agro-processing and associated non-farm activities in the rural areas should be given top priority because of its potential to increase agricultural productivity and improve incomes of the rural poor.
b. In the medium-term new technological and investment capabilities are needed. This requires strategies to help low-tech and labour-intensive sectors gradually move up the innovation capability ladder by deepening their technological capabilities.

Current Booming Growth in Africa: Some Evidence from Tanzania
Page | 11
In addition to above, there is a need to develop innovative clusters around mining sites. Increased FDI has helped Tanzania make substantial investments, particularly in the gold mining sector, but with no or very little value addition. If the current rapid expansion of the mining sector in Tanzania can be combined with mineral processing activities, the sector will experience a substantial multiplier effect for the benefit of the national economy. The most effective strategy is to provide incentives to attract FDI towards mineral processing activities, and develop innovative clusters that also include local companies around mining sites. Such clusters which could be anchored around existing foreign mining companies, have the potential to enable local enterprises to overcome many binding constraints in the areas of capital, skills, technology and markets as they learn from foreign investors. It is important to note however the necessity of developing physical and knowledge infrastructure around mineral exploitation and processing. The same applies to the recently emerging gas and oil sectors in Tanzania
c. In the long-term, the target should be to move towards a more diversified and sophisticated and internationally competitive national manufacturing sector. It is important to recognise Tanzania’s comparative advantage in this, and to achieve a competitive advantage around it by building a secure physical and knowledge infrastructure.
In addition, efforts should be made to increase productivity in Tanzania’s agriculture sector because it is this one which currently employs the majority of the Tanzania’s poor, and therefore, has the potential to play a key role in poverty alleviation. This can only happen however if forward and backward linkages with the manufacturing sector are enhanced. As a final word, we believe that focusing on proper structural transformation in Tanzania can help significantly in the effort to achieving many of the current MDGs, rather than in more specific, isolated goals.

Southern Voice Occasional Paper 9
Page | 12
References Amani, H.R. (2005). Making Agriculture Impact on Poverty in Tanzania: The Case on Non-Traditional Export Crops. ESRF, Tanzania. Diyamett, B.D., E. Mneney, A. Komba, and J. Liberio. (2013). Science, Technology and Innovation for Poverty Reduction in Tanzania: An Analysis of the Sectoral Systems of Innovation. A Research Report for Manufacturing and Agriculture – Part II. REPOA, Tanzania. Diyamett, B., P. Ngowi and M. Mutambala. (2011). The Role of Foreign Direct Investment (FDI) in Local Technological Capability Building: The Case of Tanzania. STIPRO Research Reports Series. Dollar, D. and A. Kraay. (2002). Growth is Good for the Poor. Journal of Economic Growth. 7: 195-225. IMF. (2013). World Economic Outlook Database. King, K. and R. Palmer. (2006). Skills Development and Poverty Reduction: The State of Art. Centre of African Studies, University of Edinburgh. http://www.san.ed.ac.uk/__data/assets/pdf_file/0004/ 28318/King_Palmer_Skills_and_Poverty_PBET_WP9.pdf, Retrieved on 3 September 2013. Khoo, B. (2010). Policy regimes and the political economy of poverty reduction in Malaysia. United Nation Research Institute For Social Development. www.palgrave.com/PDFs/9781137267009.pdf, Retrieved on 26 August 2013. McMillan, M. and Rodrik, D. (2012). Globalization, Structural Change, and Productivity Growth. IFPRI Discussion Paper 01160. Malaysia, Government of. (2006). The Ninth Malaysia Plan, 2006-2010. Economic Planning Unit Prime Minister’s Department, Putrajaya. Malaysia, Government of. (1991). The Sixth Malaysia Plan, 1991-95. Economic Planning Unit, Prime Minister’s Department, Kuala Lumpur. Malaysia, Government of. (1991). The Second Outline Perspective Plan, 1991-2000. Kuala Lumpur: National Printing Department. Mejer, L. (1999). Statistics on Social Exclusion: The EU Methodological Approach. EUROSTAT, Luxembourg 1999. Osmani, S. (2003). Exploring the Employment Nexus: Topics in Employment and Poverty. A Report prepared for the Task Force on the Joint ILO-UNDP Programme on Employment and Poverty. ILO-UNDP: Geneva and New York. Thin, N. (2004). Post-basic Education and Training, Enabling Environments, and Pathways to Poverty Reduction. Background paper for the University of Edinburgh/DFID research project ‘Beyond the Basics: Education and Poverty’. Unpublished, University of Edinburgh: Edinburgh. Singh, L. (2006). Innovation and Economic Growth in a Fast Changing Global Economy: Comparative Experience of South East Asian Countries. Korea University, Seoul, South, Korea. Timmer, P. (2007). The Structural Transformation and the Changing Role of Agriculture in Economic Development. Wendt Lecture, American Enterprise Institute. UNDP. (2013a). Human Development Report, 2013. United Republic of Tanzania.

Current Booming Growth in Africa: Some Evidence from Tanzania
Page | 13
UNDP. (2013b). Mainland Tanzania: Progress in MDGs at Glance. http://www.tz.undp.org/docs/ MDGs_at_%20a_Glance.pdf URT and UNIDO. (2012). Tanzania Industrial Competitiveness Report 2012. MIT and POPC. URT. (2012). National Accounts of Tanzania Mainland 2001 – 2011. National Bureau of Statistics. URT. (2011a). The Tanzania Five Year Development Plan 2011/12 – 2015/16: Unleashing Tanzania’s Latent Growth Potentials. President’s Office, Planning Commission. URT. (2011b). Tanzania Agriculture and Food Security Investment Plan (TAFSIP) 2011-12 to 2020-21. Working Paper No. 2. URT. (2011c). Tanzania: Country Report on the Millennium Development Goals 2010. Dar es Salaam. URT. (2010). National Strategy for Growth and Reduction of Poverty (NSGRP II). Ministry of Finance and Economic Affairs, Dar es Salaam. URT. (2007). The Integrated Labour Force Survey 2006. National Bureau of Statistics. URT. (2001). The Integrated Labour Force Survey 2000. National Bureau of Statistics. USA. (2009). The Facts About Modern Manufacturing. 8th Ed. The Manufacturing Institute, USA. www.nist.gov/mep/upload/FINAL_NAM_REPORT_PAGES.pdf, Retrieved on 28 August 2013. WEF. (2012). The Global Competitiveness Report 2012–2013. World Bank. (2013). World Development Indicators database. World Bank. (2013b). At-a-Glance Table. http://data.worldbank.org/data-catalog/at-a-glance-table, Retrieved on 10 September 2013. World Bank. (2009). Lost in Transition: Income Poverty Reduction Since 2001. Unpublished paper prepared for the Research and Analysis Working Group. February 2009. World Bank. (2004). Malaysia: 30 years of Poverty Reduction, Growth and Racial Harmony. World Bank. (2001). World Development Report 2000/01: Attacking Poverty. Oxford University Press. http://wdronline.worldbank.org//worldbank/bookpdfdownload/24, Retrieved on 3 September 2013.

Southern VoiceOn Post-MDG International Development Goals2015
S
2015S
Centre for Policy Dialogue (CPD)House 40C, Road 32, Dhanmondi R/A, Dhaka 1209, BangladeshGPO Box 2129, Dhaka 1000, BangladeshTelephone: (+88 02) 9141703, 9141734Fax: (+88 02) 8130951; E-mail: [email protected]: cpd.org.bd
Website: southernvoice-postmdg.orgE-mail: [email protected]
Southern Voice on Post-MDG International Development Goals (Southern Voice) is a network of 48 think tanks from Africa, Latin America and South Asia, that has identified a unique space and scope for itself to contribute to the post-MDG dialogue. By providing quality data, evidence and analyses that derive from research in the countries of the South, these institutions seek to inform the discussion on the post-2015 framework, goals and targets, and to help give shape to the debate itself. In the process, Southern Voice aims to enhance the quality of international development policy analysis, strengthen the global outreach capacity of Southern think tanks, and facilitate professional linkages between these institutions and their respective governments. Southern Voice operates as an open platform where concerned institutions and individuals from both South and North interact with the network members. Southern Voice Occasional Papers are based on research undertaken by the members of the network as well as inputs received at various platforms of the initiative. Centre for Policy Dialogue (CPD), Dhaka works as the Secretariat of the Southern Voice.