southwest florida water management district regional water
TRANSCRIPT

Southwest Florida Water Management District
Regional WaterSupply Plan
Executive SummaryAugust 2001

Southwest Florida WaterManagement District
Regional Water Supply PlanExecutive Summary
Web Site: http://www.swfwmd.state.fl.us/
August 2001
Resource Conservation and Development DepartmentGregg W. Jones, P.G., Director
Planning DepartmentRichard S. Owen, AICP, Director
Comments or questions regarding the Regional Water Supply Planmay be provided to District staff via E-mail at

The Southwest Florida Water Management District (District) does not discriminate upon thebasis of any individual’s disability status. This non-discrimination policy involves every aspectof the District’s functions, including one’s access to, participation, employment, or treatment inits programs or activities. Anyone requiring reasonable accommodation as provided for in theAmericans with Disabilities Act should contact (352)796-7211 or 1-800-423-1476, extension4215; TDD ONLY 1-800-231-6103; FAX (352)754-6749.

Regional Water Supply Plan - Executive Summary August 2001
SWFWMD ES-1
CHAPTER I. INTRODUCTION
This Regional Water Supply Plan (RWSP) is an assessment of projected water demands and potentialsources of water to meet these demands for the period from 1995 (the established base year) to 2020.The RWSP is developed for a ten-county area that extends from Pasco County in the north to CharlotteCounty in the south. The purpose for preparing the RWSP is to provide the framework for future watermanagement decisions in areas of the Southwest Florida Water Management District (SWFWMD orDistrict) where the hydrologic system is stressed due to ground-water withdrawals. The RWSP showsthat sufficient, reasonably obtainable water sources (including demand management) exist in theplanning region to meet future demands and replace some of the current withdrawals causing hydrologicstress. Because sources within the planning region are sufficient from a technical and economicperspective to meet these demands, sources outside the planning region have not been investigated. TheRWSP also identifies potential options and associated costs for developing these sources. Optionsidentified in this report are not intended to represent the District’s most “preferable” options for watersupply development. They are, however, provided as reasonable concepts that water users in the regioncan pursue in their water supply planning. Water users can select a water supply option as presented inthe plan or combine elements of different options that better suit their water supply needs. Additionally,the plan provides information to assist water users in developing funding strategies to construct watersupply development projects.
Requirement for Regional Water Supply Planning
The requirement for regional water supply planning originated from legislation passed in 1997 thatsignificantly amended Chapter 373, Florida Statutes (F.S.). New regional water supply planningrequirements were codified in s. 373.0361, F.S., and this RWSP has been prepared pursuant to theseprovisions. Key components of this legislation included designation of one or more water supplyplanning regions within the District, preparation of a Districtwide Water Supply Assessment (WSA),and preparation of a RWSP for areas where existing and reasonably anticipated sources of water weredetermined to be inadequate to meet future demand, based upon the results of the WSA.
The District’s WSA was completed and accepted by the Governing Board in June 1998. Four watersupply planning regions (northern, west-central, east-central and southern) were identified for purposesof preparing the WSA. Three of the four planning regions generally correspond to the jurisdictionalareas of regional water supply authorities (RWSA), (Withlacoochee RWSA for the Northern region,Tampa Bay Water (formerly West Coast RWSA) for the west-central region and Peace River/ManasotaRWSA (PR/MRWSA) for the southern region). The fourth planning region includes portions of Polk,Highlands and Hardee counties. For each water supply planning region, existing and reasonablyanticipated sources of water were evaluated to determine the adequacy of these sources to meet projecteddemands. In the WSA, the District concluded that regional water supply planning should be initiatedfor the west-central, east-central and southern planning regions because “sources of water are notadequate for the planning period to supply water for all reasonable-beneficial uses and to sustain thewater resources and related natural systems” (373.0361(1), F.S.). Subsequent to completing the WSA,the District concluded that it would be beneficial to redefine these three regions into one water supplyplanning region.

Regional Water Supply Plan - Executive Summary August 2001
SWFWMD ES-2
CHAPTER II. METHODS
The RWSP was developed in an open public process, in coordination with local governments andutilities, the agricultural community, business and industry representatives, environmental organizationsand other affected parties. The District’s objective has been to actively involve all stakeholders in theRWSP planning process. The District has accomplished this by involving the Southern Water UseCaution Area (SWUCA) Working Group and by establishing the Northern Tampa Bay (NTB) InputGroup for the remainder of the planning region outside the SWUCA. These groups have a diversemembership that represents local governments, water supply utilities, agriculture, the electric powerindustry, phosphate mining, the construction industry and environmentalists. The District has alsoinvolved its standing advisory committees (public supply, agricultural, industrial, green industry andenvironmental) in the process. Affected parties have also been involved in the development of theRWSP by working with District staff to develop methods for projecting water demand, and assistingwith the identification of potential options for water resource and water supply development. Finally,staff have regularly provided status reports to the District Basin Boards and Governing Board duringtheir scheduled public meetings.
The District has coordinated closely with the St. Johns River and the South Florida Water ManagementDistricts in the preparation of the RWSP. Both of these water management districts have concurrentlyprepared RWSPs for areas adjacent to the District’s planning region. In addition, the District coordinatedclosely with the Florida Department of Environmental Protection (FDEP) to ensure the State’sexpectations for the RWSP are met. Consistent with this effort, the RWSP reflects: 1) an emphasis onconservation, 2) an emphasis on reclaimed water, 3) the role of constraints and minimum flows andlevels, 4) minimizing the need for mitigation of new withdrawal impacts, 5) realistic demand projections,and 6) adherence to the existing state policy on “Local Sources First.”
CHAPTER III. ESTABLISHMENT OF MINIMUM FLOWS AND LEVELS
An important consideration in both the calculation of water demand and determination of sources tomeet demand is the establishment of minimum flows and levels (MFLs). In regard to demand, the MFLsset in the Northern Tampa Bay (NTB) area resulted in a recovery strategy that mandated cutbacks toground-water withdrawals of 68 mgd by 2007. These reductions represent demands for water that arecurrently planned for replacement or are being developed by Tampa Bay Water and are in addition tothe projected demands contained in this RWSP. Additional water demand may result from potentialreductions in ground- and/or surface-water withdrawals necessary to achieve further water resource andecological recovery as MFLs continue to be adopted in the planning region. In regard to sources, theestablishment of MFLs on water resources in the planning region will determine the amount of waterthat can be obtained from ground- and surface-water supplies. The quantities of water identified in thisRWSP that can be obtained from various sources are consistent with established MFLs based on bestavailable data and are intended to be as or more restrictive than MFLs that will be established in thefuture.
Since the early 1970s, the District has been engaged in an effort to develop MFLs for water bodies.Beginning with the 1996 legislative changes to the MFL statute, the District has enhanced its program

Regional Water Supply Plan - Executive Summary August 2001
SWFWMD ES-3
for development of MFLs. A MFL is that level or flow below which additional withdrawals would causesignificant harm. The District implements established MFLs primarily through its Water SupplyPlanning, Water Use Permitting and Environmental Resource Permitting programs, and funding of waterresource and water supply development projects that are part of a recovery or prevention strategy.
In accordance with the requirements of Section 373.042, F.S., the District has established a list ofpriority ground and surface waters for which MFLs will be set. This priority list is based upon theimportance of waters to the state or region and the existence of, or potential for, significant harm to thewater resources or ecology of the region. As required by Chapter 373.042(2), F.S., the District mustupdate the Priority List and Schedule annually, and submit the schedule for approval to the FDEP.
The District’s MFLs approach is designed to be applied to lakes, rivers, isolated wetland systems, andaquifers. The approach assumes that alternative hydrologic regimes exist that, although different fromhistoric conditions, will protect the structure and functions of aquatic and wetland resources fromsignificant harm. The purpose of MFLs is to define this threshold hydrologic regime and allow for waterwithdrawals while protecting the water resources and ecology from significant harm.
CHAPTER IV. WATER SUPPLY DEVELOPMENT COMPONENT
The Water Supply Development Component of the RWSP is composed of four Sub Chapters. SubChapter A details the anticipated future water supply demand through 2020 in each county within theplanning region as well as the methods and assumptions used in projecting future demand. Sub ChapterB is a discussion of the sources of water anticipated to be available to meet current and future demands.Sub Chapter C contains a discussion of water supply projects currently under development that theDistrict is co-funding. Finally, Sub Chapter D contains a list of water supply options that couldpotentially be developed by RWSAs, public utilities, local governments, public/private water users, etc.
Chapter IV. Sub Chapter A. Quantification of Water Supply Needs
Water demand projections were developed consistent with various parameters and methodologies agreedto by the FDEP and the five water management districts. Among the agreed-upon parameters was thebase year of 1995 from which demand would be projected. The year 1995 was selected as the base yearbecause it was considered to be a “normal” year. A “normal” year refers to a year in which typicalclimatic conditions occur resulting in “normal” water usage. Another agreed-upon parameter involvesthe 1-in-10 year drought, versus the 5-in-10 (average annual) rainfall year. A 1-in-10 drought is definedas “an event that results in an increase in water demand of a magnitude that would have a 10 percentprobability of occurring during any given year.” Demand projections represent the estimated totalquantity of water needed; no attempt was made in the projections to account for alternative sources thatcould potentially be developed to meet future demand, or water conservation that could potentially beachieved to reduce future demand. Alternative sources and conservation are addressed in the sourceschapter of this plan. For planning purposes, water use within the District has been separated into fourbasic categories: agriculture, public supply, commercial/industrial & mining/dewatering, andrecreation/aesthetic. The separation of uses into these categories provides for the projection of demandfor similar water uses under similar assumptions, methods and reporting conditions. An additional

Regional Water Supply Plan - Executive Summary August 2001
SWFWMD ES-4
water-use category, environmental restoration, comprises the quantities of water that may need to bedeveloped to offset potential reductions in withdrawals from ground- and/or surface-water sources. Thereductions may be necessary to achieve MFLs that will be established in the future. It is not possibleto project demand for this category because MFLs and potential accompanying recovery strategies havenot yet been determined for all water resources within the planning region.
Input from various use sectors and stakeholders on the demand projections developed for the RWSP washighly varied. Some suggested that demand was too high for certain categories, others agreed with theprojections, and still others suggested it was too low for certain categories. In developing theprojections, staff decided to take a conservative approach and use higher demand projections. Districtstaff is currently working to develop improved methodologies for projecting demands for the nextversion of the RWSP. Table ES-1 summarizes demand projections for the SWUCA and NTB areaportions of the planning region and the planning region as a whole from 1995 to 2020.
From the table it is apparent that the total 2020 5-in-10 (average annual) demand for all use sectors inthe SWUCA, NTB area, and the planning region as a whole is 257.0 mgd, 107.1 mgd, and 364.1 mgdrespectively. In the SWUCA portion of the planning region, the agricultural use sector will continue tobe the largest water user by the year 2020 at 633.5 mgd with a 20 percent increase in use from 1995 to2020. The public supply use sector will continue to be the second largest water user by the year 2020at 309.1 mgd, with a 55 percent increase from 1995 to 2020. Public supply accounts for the greatestincrease in demand from 1995 to 2020; 110.3 mgd versus a 103.4 mgd for agriculture. The agriculturaland public supply use sectors account for 83 percent of the total increase in demand through 2020.
In the NTB area portion of the planning region, the public supply use sector will continue to be thelargest water user by the year 2020 at 331.1 mgd with a 27 percent increase in use from 1995 to 2020.The agricultural use sector will continue to be the second largest water user by the year 2020 at 77.2mgd, with a 34 percent increase in use from 1995 to 2020. Public supply accounts for the greatestincrease in demand from 1995 to 2020; 70.5 mgd versus 19.5 mgd for agriculture. The agricultural andpublic supply use sectors account for 84 percent of the total increase in demand through 2020.
In the planning region as a whole, the agricultural use sector will continue to be the largest water userby the year 2020 at 710.7 mgd with a 21 percent increase in use from 1995 to 2020. The public supplyuse sector will continue to be the second largest water user by the year 2020 at 640.2 mgd, with a 39percent increase in use from 1995 to 2020. Public supply accounts for the greatest increase in demandfrom 1995 to 2020; 180.8 mgd versus 122.9 mgd for agriculture. The agricultural and public supplyuse sectors account for 83 percent of the total increase in demand through 2020.
Again, it is stressed that additional water demand may result from potential reductions in ground- and/orsurface-water withdrawals necessary to achieve further water resource and ecological recovery as MFLscontinue to be adopted in the planning region.

Regional Water Supply Plan - Executive Summary August 2001
SWFWMD ES-5
Table ES-1. Demand Projection Summary for the SWUCA and NTB Area Portions of the Planning Region and the Planning Region as aWhole (1995 - 2020 (mgd)). 1
Category1995 2000 2005 2010 2015 2020 Additional %
change
Avg. 1-in-10 Avg. 1-in-10 Avg. 1-in-10 Avg. 1-in-10 Avg. 1-in-10 Avg. 1-in-10 Avg.
SOUTHERN WATER USE CAUTION AREA (SWUCA)
Agriculture 530.1 546.7 791.5 569.6 823.6 592.5 855.7 613.1 884.7 633.5 913.8 103.4 373.7 20
Public Supply 198.8 223.9 237.3 243.9 245.0 266.1 282.1 287.3 304.5 309.1 327.7 110.3 128.8 55
Commercial/Mining/Power
95.1 98.0 98.0 100.9 100.9 104.0 104.0 107.1 107.1 110.3 110.3 15.2 15.2 16
Recreation 35.0 39.9 51.5 45.7 59.0 51.6 66.5 57.2 73.8 63.1 81.5 28.1 46.5 80
TOTAL 859.0 908.5 1,178.3 960.1 1,228.5 1,014.2 1,308.3 1,064.7 1,370.1 1,116.0 1,433.3 257.0 574.2 30
NORTHERN TAMPA BAY (NTB) AREA
Agriculture 57.7 62.9 86.5 66.5 90.8 69.8 95.2 73.5 99.9 77.2 104.5 19.5 46.8 34
Public Supply 260.6 278.5 295.2 292.1 323.2 306.6 325.0 320.3 339.5 331.1 350.9 70.5 90.4 27
Commercial/Mining/Power
28.4 29.3 29.3 30.3 30.3 31.1 31.1 32.0 32.0 33.0 33.0 4.6 4.6 16
Recreation 24.6 27.4 35.2 29.8 38.4 32.2 41.6 34.7 44.7 37.1 47.8 12.5 23.3 51
TOTAL 371.3 398.1 446.2 418.7 482.7 439.7 492.9 460.5 516.1 478.4 536.2 107.1 165.1 29
PLANNING REGION (SWUCA and NTB Quantities Totaled)
Agriculture 587.8 609.6 878.0 636.1 914.4 662.3 950.9 686.6 984.6 710.7 1018.3 122.9 430.5 21
Public Supply 459.4 502.4 532.5 536.0 568.2 572.8 607.1 607.5 644.0 640.2 678.6 180.8 219.2 39
Commercial/Mining/Power
123.5 127.3 127.3 131.2 131.2 135.1 135.1 139.1 139.1 143.3 143.3 19.8 19.8 16
Recreation 59.6 67.3 86.7 75.5 97.4 83.8 108.1 91.9 118.6 100.2 129.3 40.6 69.7 68
TOTAL 1230.3 1306.6 1624.5 1378.8 1711.2 1454.0 1801.2 1525.2 1886.3 1594.4 1969.5 364.12 739.2 301The Northern Tampa Bay area encompasses all areas of the planning region that are not in the SWUCA, including the very northern portion of Polk County.2Does not include the 68 mgd of cutbacks in Northern Tampa Bay ground-water withdrawals which would adjust the total 2020 demand to 432 mgd.

Regional Water Supply Plan - Executive Summary August 2001
SWFWMD ES-6
Chapter IV. Sub Chapter B. Determination of Water Supply Deficits and Traditional andAlternative Supply Sources
In accordance with the RWSP objectives, the District identified potential sources of water capable ofmeeting projected demand, and options for developing those sources. Sources include (1) surface waterand storm water, (2) reclaimed water, (3) agricultural water conservation, (4) non-agricultural waterconservation, (5) brackish ground water and (6) seawater desalination. Fresh ground water was notincluded as a potential source for new supplies due to known resource impacts throughout much of theplanning region caused by existing ground-water withdrawals. In fact, it was this lack of additional freshground water in significant quantities within the planning region, coupled with growing water demands,that led to the preparation of this RWSP. For puposes of this RWSP, the District’s goal was thereforeto identify sufficient quantities of water other than fresh ground water to meet projected water demands.
Based on evaluation of potential sources of water supply that can be developed, it was determined thatup to 678.1 mgd is potentially available. As stated previously, the projected increase in demand by theyear 2020 will be 364.1 mgd. Including 68 mgd that must be developed to replace wellfield cutbacks inthe NTB area, total additional water demand in the planning region through 2020 will be approximately432 mgd. It is therefore concluded that sufficient sources of water are available within the planningregion to meet projected demand through 2020. Table ES-2 summarizes the potential quantity of wateravailable from each source in the SWUCA and NTB area portions of the planning region as well as theplanning region as a whole.
Sources
The following is a discussion of the existing and potentially available sources of water listed in TableES-2. Surface Water/Storm Water
Prior to determining the availability of water from rivers for water supply, general criteria weredeveloped to ensure, at a planning level, that existing uses and the water supply needs of natural systemswould be protected. Since many of the rivers in the region do not yet have established minimum flows,it was necessary to assume a minimum flow criteria before estimating water availability. For the RWSP,the minimum flow was assumed to be the flow that is equaled or exceeded 85 percent of the time (P85).Diversions for water supply were zero when flows were below the assumed minimum flow. Therefore,15 percent of the time there were no calculated withdrawals from the rivers. This ensured that duringperiods of low flow, sufficient water would be available to sustain natural systems. The second criteriafor determining surface water availability was to limit withdrawals to 10 percent of the total daily flowof the river when the flow exceeded the P85. Once the available amount of water was determined, 53surface-water and 12 storm-water options were identified and are included in Chapter IV, Sub ChapterD, as the long list of surface-water/storm-water options. Using a variety of screening criteria, this listwas reduced to a short list of 16 options which were representative samples of the options on the longlist. The short list is also included in Chapter IV, Sub Chapter D. For the surface-water options, waterdiversions would occur during periods of high flow with the majority of the diversions occurring for
Regional Water Supply Plan - Executive Summary August 2001
SWFWMD ES-7
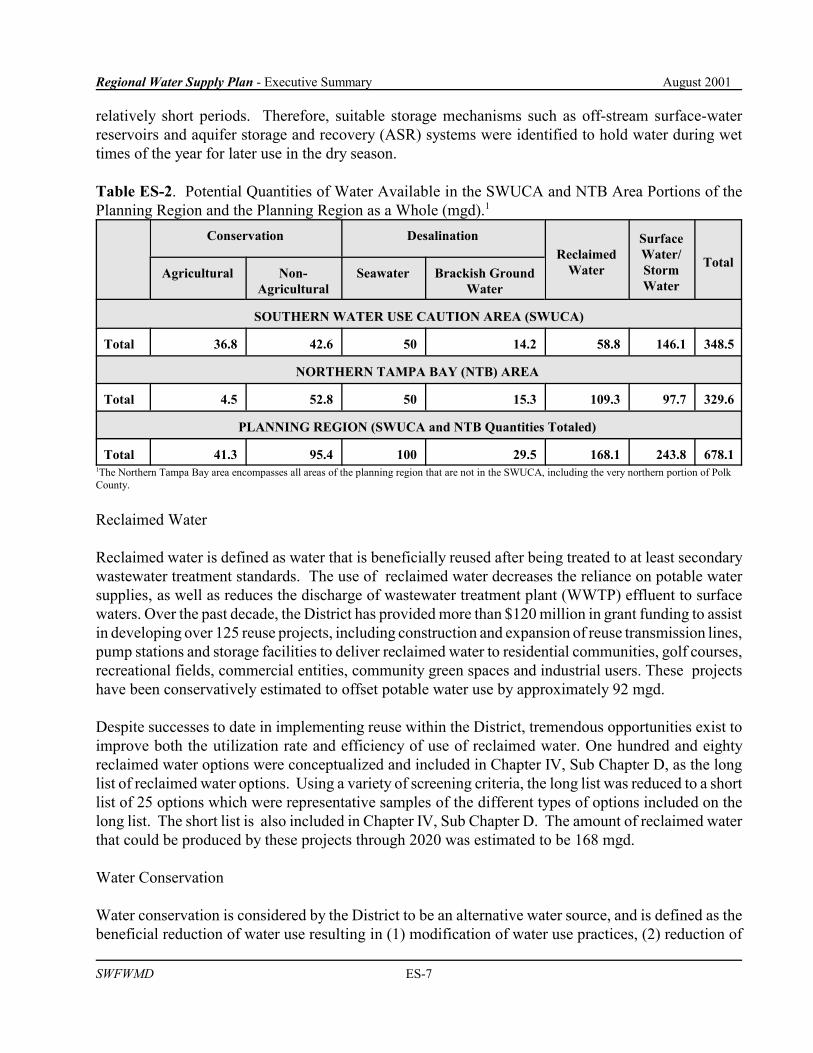
relatively short periods. Therefore, suitable storage mechanisms such as off-stream surface-waterreservoirs and aquifer storage and recovery (ASR) systems were identified to hold water during wettimes of the year for later use in the dry season.
Table ES-2. Potential Quantities of Water Available in the SWUCA and NTB Area Portions of thePlanning Region and the Planning Region as a Whole (mgd).1
Conservation DesalinationReclaimed
Water
SurfaceWater/StormWater
TotalAgricultural Non-
AgriculturalSeawater Brackish Ground
Water
SOUTHERN WATER USE CAUTION AREA (SWUCA)
Total 36.8 42.6 50 14.2 58.8 146.1 348.5
NORTHERN TAMPA BAY (NTB) AREA
Total 4.5 52.8 50 15.3 109.3 97.7 329.6
PLANNING REGION (SWUCA and NTB Quantities Totaled)
Total 41.3 95.4 100 29.5 168.1 243.8 678.11The Northern Tampa Bay area encompasses all areas of the planning region that are not in the SWUCA, including the very northern portion of PolkCounty.
Reclaimed Water
Reclaimed water is defined as water that is beneficially reused after being treated to at least secondarywastewater treatment standards. The use of reclaimed water decreases the reliance on potable watersupplies, as well as reduces the discharge of wastewater treatment plant (WWTP) effluent to surfacewaters. Over the past decade, the District has provided more than $120 million in grant funding to assistin developing over 125 reuse projects, including construction and expansion of reuse transmission lines,pump stations and storage facilities to deliver reclaimed water to residential communities, golf courses,recreational fields, commercial entities, community green spaces and industrial users. These projectshave been conservatively estimated to offset potable water use by approximately 92 mgd.
Despite successes to date in implementing reuse within the District, tremendous opportunities exist toimprove both the utilization rate and efficiency of use of reclaimed water. One hundred and eightyreclaimed water options were conceptualized and included in Chapter IV, Sub Chapter D, as the longlist of reclaimed water options. Using a variety of screening criteria, the long list was reduced to a shortlist of 25 options which were representative samples of the different types of options included on thelong list. The short list is also included in Chapter IV, Sub Chapter D. The amount of reclaimed waterthat could be produced by these projects through 2020 was estimated to be 168 mgd.
Water Conservation
Water conservation is considered by the District to be an alternative water source, and is defined as thebeneficial reduction of water use resulting in (1) modification of water use practices, (2) reduction of

Regional Water Supply Plan - Executive Summary August 2001
SWFWMD ES-8
unaccounted-for losses, or (3) installation and maintenance of low volume water use systems, processes,fixtures or devices. Conservation options have been evaluated within two categories, including non-agricultural and agricultural. Each is described below.
Non-agricultural Conservation - Conservation options appropriate for implementation by public supply,domestic self-supply, recreation/aesthetic and commercial/industrial (C/I) and mining/dewatering (M/D)users were determined. The list included only those projects which cost less than $2.00/1000 gallonsof water saved and those that can be implemented similarly across the region. Some measures that areknown to be effective, such as water efficient rate structures, ordinances, and education, were notincluded in the list of options because they must be evaluated and quantified on a case-by-case basis.Conservation measures identified as having the best potential for water savings include: 1) plumbingretrofit kit give-aways, 2) ultra low volume (ULV) toilet rebates, 3) residential water use surveys, 4)water-efficient landscape and irrigation system rebates, 5) industrial, commercial and institutional (ICI)water use surveys, 6) large landscape water use surveys, 7) rain sensor shut-off device rebates, and 8)water budgeting. Through the implementation of all options it is anticipated that between 75 and 95 mgdof water could be saved each day, at a cost of less than $2.00 per thousand gallons saved. This rangerepresents the volume of water that could be saved by implementing voluntary measures (75 mgd),versus the implementation of both voluntary and mandatory measures (95 mgd).
Agricultural Conservation - Agricultural conservation options include: 1) conversion to more water-conserving irrigation systems, 2) on-farm decision support systems (irrigation scheduling programs), 3)tensiometers, 4) shallow water table observation control wells, 5) automatic pump controls, 6) variablerate pumping, 7) water flow meters, 8) laser leveling, 9) seepage interception/horizontal wells, and 10)tailwater recovery/rainwater harvesting.
To estimate the costs that might be incurred by a ‘typical’ agricultural operation to implement one ormore conservation options, 20 ‘model’ farms that are typical of a variety of different agriculturaloperations in the planning region were developed. The estimated water savings derived from the modelfarm case study analyses under average annual (5-in-10) conditions were determined. If no irrigationsystem conversions occurred but all applicable Best Management Practices (BMPs) were implemented,an estimated 34 mgd could be saved. If all possible conversions to the most water-conserving irrigationsystem technologies were accomplished and all applicable BMPs were implemented, an estimated 41mgd could be saved.
Potential for Water Conservation and Reuse to Meet Future Demands
Water conservation has tremendous potential to help meet future water demands. In Table ES-1, 364.1mgd of projected increase in demand from 1995 through 2020 is identified. Adding in the currentlyidentified demand for environmental restoration of 68 mgd (the reduction in ground-water withdrawalsrequired as part of the recovery plan associated with the adoption of minimum flows and levels in thenorthern Tampa Bay area) results in a total demand of 432.1 mgd. The discussion that begins on pageES-15, Overview of Funding Mechanisms, explains that 215.5 mgd of the 432.1 mgd demand has beenaccounted for by projects that are either completed, under development, or planned with secured orpledged funding. This leaves 216.6 mgd that is not yet under development or planned.
Regional Water Supply Plan - Executive Summary August 2001
SWFWMD ES-9
304
217
432
0
5010
015
020
025
030
035
040
045
050
02020 Total Demand
2020 Portion of Demand NotMet by Projects Planned /Under Development2020 Conservation andReuse Potential
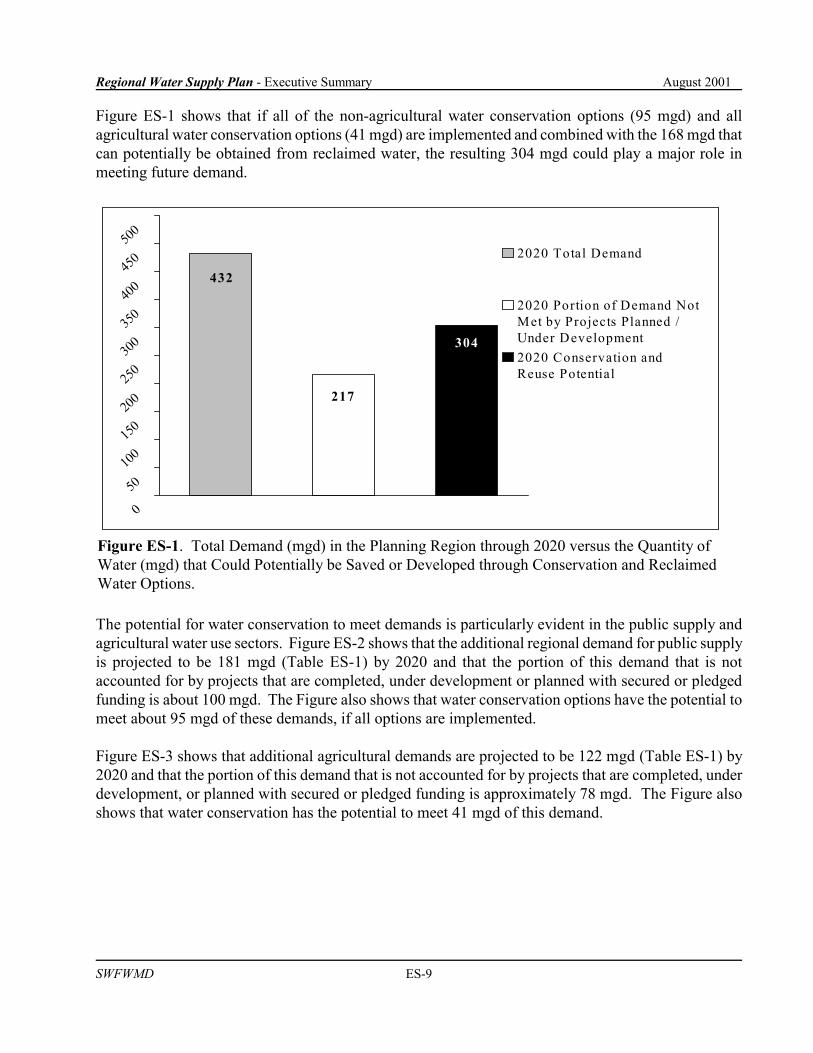
Figure ES-1. Total Demand (mgd) in the Planning Region through 2020 versus the Quantity ofWater (mgd) that Could Potentially be Saved or Developed through Conservation and ReclaimedWater Options.
Figure ES-1 shows that if all of the non-agricultural water conservation options (95 mgd) and allagricultural water conservation options (41 mgd) are implemented and combined with the 168 mgd thatcan potentially be obtained from reclaimed water, the resulting 304 mgd could play a major role inmeeting future demand.
The potential for water conservation to meet demands is particularly evident in the public supply andagricultural water use sectors. Figure ES-2 shows that the additional regional demand for public supplyis projected to be 181 mgd (Table ES-1) by 2020 and that the portion of this demand that is notaccounted for by projects that are completed, under development or planned with secured or pledgedfunding is about 100 mgd. The Figure also shows that water conservation options have the potential tomeet about 95 mgd of these demands, if all options are implemented.
Figure ES-3 shows that additional agricultural demands are projected to be 122 mgd (Table ES-1) by2020 and that the portion of this demand that is not accounted for by projects that are completed, underdevelopment, or planned with secured or pledged funding is approximately 78 mgd. The Figure alsoshows that water conservation has the potential to meet 41 mgd of this demand.

Regional Water Supply Plan - Executive Summary August 2001
SWFWMD ES-10
122
78
4 1
0
50
100
150
2020 Total Agricultural Demand
2020 Portion of Agric ulturalDem ands Not Met by Projec tsP lanned / Under Developm ent2020 Agric ultural ConservationPotential
Figure ES-3. Agricultural Demand (mgd) in the Planning Region through 2020 versus theQuantity of Water (mgd) that Could Potentially be Saved through Agricultural WaterConservation Options (does not include the 168 mgd reuse potential).
181
10095
0
50
100
150
200 2020 Total Public Supply
Demand
2020 Portion of PublicSupply Demands Not Met byProjects Planned / UnderDevelopment2020 Public SupplyConservation Potential
Figure ES-2. Public Supply Demand (mgd) in the Planning Region through 2020 versus theQuantity of Water (mgd) that Could Potentially be Saved through Public Supply WaterConservation Options (does not include the 168 mgd reuse potential).

Regional Water Supply Plan - Executive Summary August 2001
SWFWMD ES-11
Although the potential for water conservation and reclaimed water options alone to meet the 216.6 mgd2020 demand does exist, there are a number of reasons why such a scenario may not be feasible. First,the District does not have the authority to prescribe the sources of water to users that they will developto meet their demands. Second, the development of a variety of sources provides greater assurance thatregional demands can be met. Developing only water conservation and reclaimed water options willlikely render the region less able to address issues related to system variables such as demand peakingand seasonal stress.
Third, the success of water conservation projects in particular, and reclaimed water projects to a lesserdegree, is dependent upon the decisions of the end-user. The development of a variety of sourcesreduces the uncertainty associated with this dependency. Finally, in some areas of the District, greatsuccess has been achieved with the use of reclaimed water and water conservation, while success in otherareas has been limited. The distribution and magnitude of conservation and reuse efforts must beheightened before these sources can begin to be considered sufficient to meet demands throughout theplanning region.
While it may not be feasible for reclaimed water and water conservation projects to reliably meet all ofthe demands of the region over the next 20 years, it is the goal of the District to enhance these effortsto the greatest extent practicable. Ongoing efforts to include conservation and reuse in water supplyplanning will be continued. The significant role that conservation and reuse can play in water supplydevelopment in the region is emphasized in many of the District’s existing programs. Planningdocuments such as the RWSP, the District Water Management Plan, Basin Plans and ComprehensiveWatershed Management Plans identify water conservation and reclaimed water as key factors inaddressing water supply issues. Regulatory efforts, such as permitting rules that require conservationplans in the water use caution areas and water restrictions, address demand management. In addition,substantial incentive programs such as the Cooperative Funding Program offer financial assistancetoward the development of water conservation and reclaimed water projects.
The District has enhanced its outreach efforts to attempt to mobilize the community. Through effortslike the Water Conservation Task Force, formed in 2000, the benefits of and the awareness of the needfor water conservation and the efficient use of reclaimed water are emphasized. Such efforts are plannedto continue and even increase throughout the planning horizon.
Brackish Ground Water
Brackish ground water has impurity concentrations greater than drinking water standards (TDSconcentration greater than 500 mg/l) but less than seawater (TDS equal to or greater than 35,000 mg/l).Brackish ground water is found principally in the coastal portions of the Floridan and intermediateaquifers. Though brackish ground water is a viable source of water, it is important that futurewithdrawals of brackish ground water are planned and operated so as not to exacerbate regionalmovement of the saltwater interface. Historically, brackish ground-water desalination has been a moreexpensive source of water than traditional fresh ground-water or surface-water sources. However,improvements in technology involving low pressure reverse osmosis (RO) and ultra-filtrationmembranes have substantially reduced operating costs for newer systems. The RO process results in
Regional Water Supply Plan - Executive Summary August 2001
SWFWMD ES-12
fresh product water and a highly mineralized waste concentrate. The waste concentrate must be disposedof through methods that include surface-water discharge, deep well injection, or dilution at a WWTP.
Within the District there are currently 12 active brackish ground-water desalination facilities that arepermitted for a total of approximately 38 mgd. These plants are principally located in the coastal areasof Charlotte, Pinellas, and Sarasota counties. The projected amount of additional water supply frombrackish ground water includes approximately 14.5 mgd from within the existing water supplyinfrastructure and about 15 mgd from facilities that are in the planning phase as well as a potential watersupply option described in the RWSP, for a total amount of 29.5 mgd.
Seawater Desalination
Although there are currently no seawater desalination plants in the planning region, Tampa Bay Wateris developing a facility that will be co-located with Tampa Electric Company’s Big Bend Power Planton Tampa Bay near Apollo Beach. The District is providing $85 million toward the capital cost of theplant. The facility will have a capacity of 25 mgd, expandable to 35 mgd and it is expected that the pricefor delivery of this water to the consumer will average $2.08 per 1,000 gallons over a 30-year period.This price sets a new standard for seawater desalination which historically has experienced costs rangingfrom approximately $4.00 to $8.00 per thousand gallons. Two major obstacles associated withdesalination have discouraged its development in the past. The first problem, excessive cost, has beenminimized by recent technological improvements in the RO process. The second problem is the disposalof the waste concentrate. Tampa Bay Water’s planned desalination facility will use an innovative designto dilute the waste concentrate in the same discharge pipe and discharge canal that returns the coolingwater from the power plant to the Bay. The end result will be a discharge water that is diluted to withinapproximately 1.5 percent of the ambient Bay water quality.
Much of the near-shore area in the planning region has been designated as either Outstanding FloridaWaters (OFW) or aquatic preserves. For this reason, it was important and preferable to find potentialsites that did not have either of these designations. Other criteria for identifying potential locations wereaccess to existing public supply infrastructure and the existence of nearby water demand. Four potentialsites for large scale (at least 20 mgd) seawater desalination plants in the planning region have beenidentified as part of the RWSP process. It is estimated that a total of 75 mgd of water supply can beprovided by facilities located at these sites. When the 25 mgd planned for the Big Bend site is included,a total of 100 mgd of water supply could be produced in the planning region from seawater desalination
Chapter IV. Sub Chapter C. Water Supply Projects Under Development
The District contributes substantial funds toward the development of sustainable water supplies on anannual basis. These funds come primarily from four sources, including:
� The Cooperative Funding Program of the Basin Boards;� The New Water Sources Initiative (NWSI) funded by the Governing Board and Basin Boards;� The Water Supply and Resource Development Funds funded by the Governing Board and Basin
Boards; and� The Partnership Agreement (funded through the NWSI).

Regional Water Supply Plan - Executive Summary August 2001
SWFWMD ES-13
Determining whether these funds and associated projects should be categorized as “water resourcedevelopment” or “water supply development,” pursuant to the statutory definitions is very problematic.To give a comprehensive understanding of the substantial assistance provided by the District for overallwater development, a general description of these programs and the water resource and supplydevelopment projects funded by them is provided below. Combined, District funding for water resourceand water supply development in Fiscal Year 2000 totals $55,379,773, representing 28 percent of theDistrict’s total budget.
This “Sub Chapter” provides an overview of the District’s ongoing programs and activities related tothe implementation of water resource and water supply development projects. Included are overviewsof the District’s Cooperative Funding and New Water Sources Initiatives programs, as well as the watersupply projects funded through the Partnership Agreement with Tampa Bay Water.
Chapter IV. Sub Chapter D. Water Supply Options
A list of water supply options for the individual sources was developed based on input from theDistrict’s NTB Input Group, SWUCA Working Group, Advisory Committees, and other members ofthe community. A “long list” of projects was identified for each source and reduced to a manageable“short list” of projects. The short list contains options that are representative samples of the differenttypes of options included on the long list. Options on the short list were submitted to more detailedplanning-level technical and financial feasibility analysis to more fully develop the concepts and refinethe estimates of costs. The short list does not represent a prioritization or list of the District’s preferredoptions, but provides reasonable concepts that water users in the region may pursue in their water supplyplanning. It is anticipated that users will choose an option or combine elements of different options thatbest fit their needs. Following a decision to pursue an option identified in the RWSP, it will benecessary for the interested party(ies) to conduct more detailed engineering, hydrologic and biologicassessments to demonstrate that the conditions for issuance of all applicable permits can be met.
Additional Source Considerations
In the future, water demands will likely be met with the sources listed above. However, managementtechniques and technologies such as improved water treatment methods, aquifer storage and recovery,and aquifer recharge and conveyance systems will be required to meet the projected demands.
Aquifer Storage and Recovery (ASR)
ASR is the process of storing water in an aquifer when water supplies exceed demand and subsequentlywithdrawing the water when supplies are low and/or demands are high. ASR offers several significantadvantages over conventional water storage methods including the ability to store large volumes of waterat relatively low cost with little environmental impact and no evaporative losses. To date, the majorityof ASR projects have been limited to storage and recovery of potable water. However, several projectsare in progress to determine the feasibility of utilizing non-potable water such as reclaimed water orstorm water. Another type of non-potable ASR involves withdrawing, treating and storing excess flowsfrom a river. The river water would be treated to an appropriate level then pumped into an aquifer

Regional Water Supply Plan - Executive Summary August 2001
SWFWMD ES-14
through wells for storage. When the water is needed, the same wells would be used to withdraw thewater from the aquifer.
Aquifer Recharge and Conveyance
A major component of some of the proposed surface-water and reclaimed water options includes aquiferrecharge and conveyance. This involves capturing excess water from rivers during periods of high flowsand recharging it at various points in the Floridan aquifer. This would increase the amount of availableground water and minimize the cost of conveyance since the aquifer would be the instrument used toconvey water to users who could then capture it through traditional ground-water wells.
CHAPTER V. WATER RESOURCE DEVELOPMENT COMPONENT
This chapter of the RWSP addresses the legislatively required water resource development projectsidentified through the planning process. It is very difficult to categorize the numerous projects receivingDistrict funding assistance as water supply development or water resource development projects. Forthe RWSP, the majority of projects funded through the Basin Boards’ Cooperative Funding Program,the New Water Sources Initiative, and the Partnership Agreement have been categorized as water supplydevelopment projects. The intent for water resource development projects is to enhance the amount ofwater available for water supply development and the District is primarily responsible for water resourcedevelopment projects. Water resource development is defined as “the formulation and implementationof regional water resource management strategies, including the collection and evaluation of surfacewater and ground-water data; structural and nonstructural programs to protect and manage waterresources; the development of regional water resource implementation programs; the construction,operation, and maintenance of major public works facilities to provide for flood control, surface andunderground water storage, and ground-water recharge augmentation; and related technical assistanceto local governments and to government-owned and privately owned water utilities” (s. 373.019(19),F.S.).
Projects the District believes constitute water resource development and for which the District will takethe lead in implementing include: 1) hydrologic data collection, 2) Regional Observation MonitoringProgram (ROMP) (well construction and testing), 3) Quality of Water Improvement Program (QWIP)(plugging of abandoned artesian wells), 4) flood control and associated storage projects, 5)hydrogeologic investigations, and 6) establishment of MFLs. Over the next five years, the District willallocate approximately $68.5 million for these types of water resource development projects that willsupport water supply development by local governments, utilities, RWSAs, and others.
CHAPTER VI. OVERVIEW OF FUNDING MECHANISMS
An analysis was undertaken to compare potentially available funding sources to the total estimated costneeded to develop the water supply or demand management components of the RWSP. As previouslymentioned, water demands in the planning region are anticipated to increase by 364.1 mgd between 1995and 2020. An additional 68 mgd will also be necessary in conjunction with reductions in ground-waterwithdrawals from Tampa Bay Water’s regional wellfield system as a part of the recovery strategy for the

Regional Water Supply Plan - Executive Summary August 2001
SWFWMD ES-15
NTB area. Combined, a total of 432.1 mgd in new water supplies will be needed through this timeframe. In addition, there is potential for additional water supply and demand management initiativesto achieve further water resource and ecological recovery as MFLs continue to be adopted in theplanning region. However, some of this new water supply has already been completed (1995 to date),is under development, or is planned with secured or pledged funding. It is estimated that of the total432.1 mgd, approximately 215.5 mgd is in this category, leaving approximately 216.6 mgd remainingto be funded and developed.
The historical funding sources and amounts have been determined for the development of the 215.5 mgd.The total amount of these sources is $1.025 billion and is detailed in Table ES-3. Based on the District’sexperience and knowledge of the costs associated with developing the 215.5 mgd, as well as making aseries of assumptions about future costs and funding participation by various user groups, a cost of $6million per mgd in new water supply infrastructure was used to project future costs. This resulted in atotal funding need of approximately $1.3 billion (216.6 mgd x $6 million per mgd).
Table ES-3. Secured or Pledged Sources of Funding for Completed, Ongoing, or Planned Projects thathave or will Produce 215 mgd of the 432 mgd Demand Needed between 1995 and 2020.
Funding Sources
District NWSI funding @ $20 million per year from fiscal year 1994 through2007, minus $26 million of these funds that were not pledged at the completionof the fiscal year 2001 budget development.
$244 million
Matching funds from NWSI Partners of funds described above. These fundswere provided primarily by local governments and regional water supplyauthorities.
$244 million
Reimbursed or pledged Basin Board Cooperative Funding Program funds forwater supply projects for fiscal years 1994 through 2007 as of completion offiscal year 2001 budget development.
$129 million
Matching funds from Cooperative Funding Program Partners of fundsdescribed above, primarily local governments, for water supply projects. $129 million
Reimbursed or pledged funds from the District’s Water Supply and ResourceDevelopment Fund. The only funds pledged from this fund to date were fromfiscal year 2000, the year the fund was originally established.
$2 million
Matching funds from the District’s Water Supply and Resource DevelopmentFund partners as described above. $2 million
Preservation 2000 funds used to acquire land for water supply development. $13 million
Unmatched funds provided by Tampa Bay Water to develop their water supplyprojects.
$217 million
Federal grant funds that have been obtained for major water supply andreclaimed water projects in the planning region as of completion of fiscal year2001 budget development.
$45 million
Total $1.025 billion

Regional Water Supply Plan - Executive Summary August 2001
SWFWMD ES-16
Potential funding sources have also been identified to help meet these future water supply developmentcosts. If the Governing Board and Basin Boards maintain their current NWSI funding commitment of$20 million per year through 2020, $286 million could be produced (excludes current NWSI fundingpledges of $94 million through 2007). Secondly, if the District’s Basin Boards maintain their recentcommitments to water supply development and demand management under the Cooperative FundingProgram, which is also about $20 million per year collectively, this could yield $361 million (excludes$19 million in existing Cooperative Funding Program pledges through 2003). Together, these twofunding sources could yield $647 million of the required $1.3 billion or roughly 50 percent, before anymatching funds are contributed. Historically, both the NWSI and Cooperative Funding Programs have required cost share on an equalbasis (50/50 cost share for eligible costs). Therefore, if a similar match was required in the future,adequate funding could be available. However, many of the future projects may require a higherpercentage funding from the District. For example, if it is determined that a seawater intrusion barrierneeds to be established in the SWUCA, it may be funded entirely by the District. In recognition of this,this analysis has assumed that 50 percent of the future NWSI and Cooperative Funding Program budgetswould be set aside for projects to be funded completely by the District. The remaining 50 percent wouldbe matched on an equal cost basis, which would yield an additional $324 million.
Another potential source of funding is the continuation of the District’s recently implemented WaterSupply and Resource Development Fund. If the Governing Board were to set aside $3 million for thisfund annually, and the Basin Boards were to collectively match this amount, $114 million could be setaside from 2002 through 2020. As with NWSI and the Cooperative Funding Program, if half of thesefunds were matched on an equal cost share basis, an additional $57 million could be leveraged. Anotherpotential source of funding is the state’s Florida Forever Program. The Governing Board could requestan estimated $117 million from this fund for implementation of the RWSP over the next ten years. Thelast potential funding source is federal grants for water supply and resource development projects.Although it is always difficult to gauge the likelihood of receiving future federal grants, the District willcontinue to be an active partner in obtaining such funds.
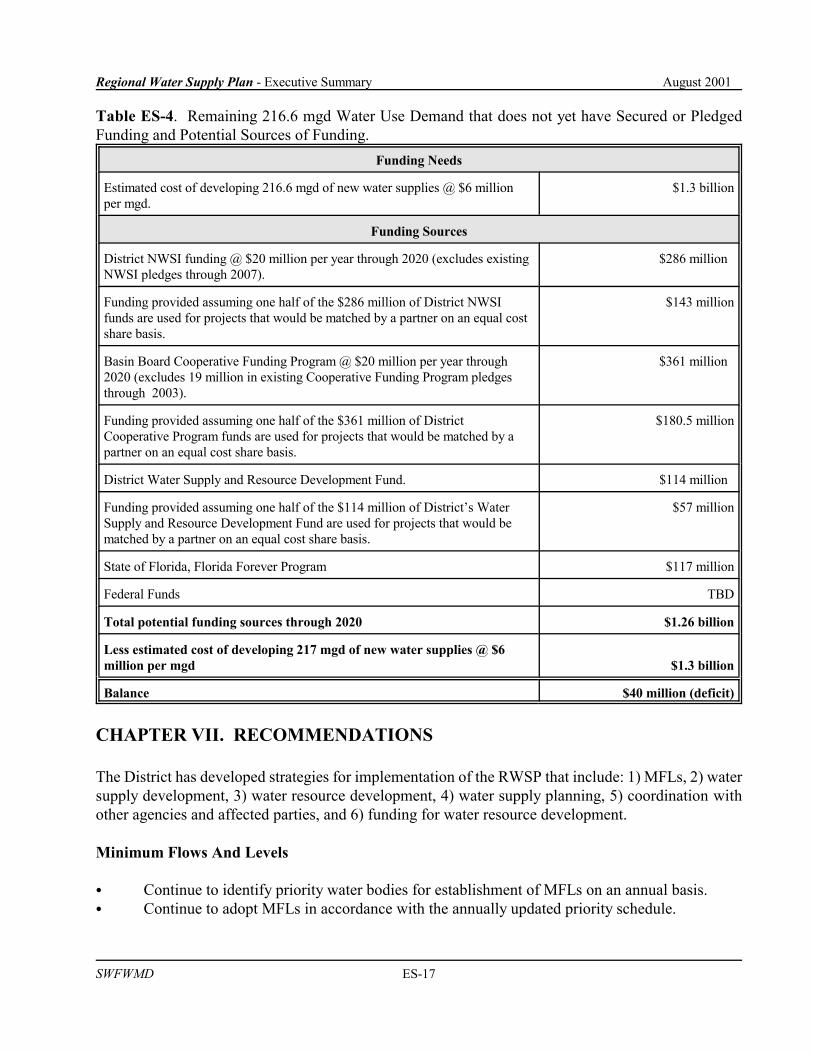
Table ES-4 compares the dollars needed to implement the water supply development and demandmanagement components of the RWSP that have yet to secure funding, to the various potential fundingsources described above. As illustrated in this Table, the potential funding sources described above havethe potential to yield the magnitude of funds that will be required. However, if additional water supplydevelopment and demand management is needed to address water resource or ecological restorationdue to future establishment of MFLs, the deficit of fiscal resources may be greater than thatidentified based on the potential funding sources and associated assumptions described above.
Regional Water Supply Plan - Executive Summary August 2001
SWFWMD ES-17
Table ES-4. Remaining 216.6 mgd Water Use Demand that does not yet have Secured or PledgedFunding and Potential Sources of Funding.
Funding Needs
Estimated cost of developing 216.6 mgd of new water supplies @ $6 millionper mgd.
$1.3 billion
Funding Sources
District NWSI funding @ $20 million per year through 2020 (excludes existingNWSI pledges through 2007).
$286 million
Funding provided assuming one half of the $286 million of District NWSIfunds are used for projects that would be matched by a partner on an equal costshare basis.
$143 million
Basin Board Cooperative Funding Program @ $20 million per year through2020 (excludes 19 million in existing Cooperative Funding Program pledgesthrough 2003).
$361 million
Funding provided assuming one half of the $361 million of DistrictCooperative Program funds are used for projects that would be matched by apartner on an equal cost share basis.
$180.5 million
District Water Supply and Resource Development Fund. $114 million
Funding provided assuming one half of the $114 million of District’s WaterSupply and Resource Development Fund are used for projects that would bematched by a partner on an equal cost share basis.
$57 million
State of Florida, Florida Forever Program $117 million
Federal Funds TBD
Total potential funding sources through 2020 $1.26 billion
Less estimated cost of developing 217 mgd of new water supplies @ $6million per mgd $1.3 billion
Balance $40 million (deficit)
CHAPTER VII. RECOMMENDATIONS
The District has developed strategies for implementation of the RWSP that include: 1) MFLs, 2) watersupply development, 3) water resource development, 4) water supply planning, 5) coordination withother agencies and affected parties, and 6) funding for water resource development.
Minimum Flows And Levels
� Continue to identify priority water bodies for establishment of MFLs on an annual basis. � Continue to adopt MFLs in accordance with the annually updated priority schedule.

Regional Water Supply Plan - Executive Summary August 2001
SWFWMD ES-18
� Continue monitoring to determine the effectiveness of adopted MFLs and recovery andprevention strategies.
� Continue to evaluate, update, and expand methodologies used in the establishment of MFLs. � Continue to evaluate recovery tools such as modifications to surface water control structures,
reductions in ground-water withdrawals, and augmentation of water bodies.
Water Supply Development
� Aggressively pursue the expansion of demand management measures whenever possible.� Increase the use of reclaimed water through the District’s water use permitting program. � Require increased efficiencies and utilization of reclaimed water for District funded projects.� Work with FDEP to require more efficient and beneficial use of reclaimed water. � Continue to fund research on advanced water supply technologies.� Develop strategies with water suppliers and other affected parties that promote the development
and coordination of regional water supplies. � Investigate options to optimize development of surface-water sources while protecting existing
legal uses and environmental systems. This may include assigning responsibility for thedevelopment of individual surface-water sources to a single entity, such as the District or watersupply authority.
� Ensure that self-supplied users have reasonable access to future water supplies.� Work with local governments to ensure that the availability of water supplies is a key component
in the process of approving new development.
Water Resource Development
� Continue to collect hydrologic and biologic data to support investigations of water resourceavailability.
� Continue to conduct hydrologic and biologic investigations and develop models to determinewater resource availability and developing methodologies for establishment of MFLs.
� Conjunctively develop flood protection and water supply projects to achieve multiple benefits.� Continue to collect aerial photography for water resource and flood investigations. � Continue to develop analytical tools for assessing advanced water supply technologies.� Investigate development of large scale aquifer recharge projects to manage saltwater intrusion
and lake level declines and enhance water supply opportunities in the region. � Implement a program to locate and study offshore springs to provide definitive data on the issue
of the existence of offshore springs, their magnitude of discharge and water quality, and potentialfor water supply development.
Water Supply Planning
� In the NTB region, provide an interim evaluation of the adopted Recovery Plan by 2005 toproject the need for additional recovery and water supplies beyond the 2010 time frame.
� Conduct a reassessment of water supply demands by 2003. � Update the RWSP in 2005 and expand it to address the water supply planning needs of the
northern portion of the District.

Regional Water Supply Plan - Executive Summary August 2001
SWFWMD ES-19
� Continue to work with user groups in the region to monitor changes in demand and to refinemethodologies for projecting future demand.
Coordination
� Continue to coordinate with adjacent WMDs to ensure consistency in determining water supplyconstraints and evaluation of impacts of withdrawals.
� Work with adjacent WMDs to ensure that a coordinated approach to the development of watersupplies in boundary regions occurs.
� Coordinate the review of WUPs in the boundary regions of adjacent WMDs with the WMDs toaddress and resolve concerns about interdistrict impacts.
� Provide incentives to encourage local governments and water suppliers to coordinate watersupply projects to facilitate a regional approach to water supply development.
� Enhance outreach programs to educate citizens on water supply issues. � Continue to seek input from affected parties in the development and implementation of RWSPs.
Funding for Water Supply and Water Resource Development
� Continue the District’s incentive-based funding programs such as the Cooperative Funding andNWSI programs and the Water Supply and Resource Development Reserve.
� Continue to seek federal funding for water supply and resource development projects.� Continue to provide adequate funding to maintain expertise for conducting hydrologic and
biologic assessments and developing methodologies for establishing MFLs. � Continue to provide adequate funding for data collection programs in support of water resource
assessments and establishment of MFLs. � Continue to provide adequate funding for advanced technological support for water resource
assessments and establishment of MFLs. � Continue to provide adequate funding for implementation of the water use permitting program
as one of the essential District tools in managing water supply issues.� Integrate the RWSP process into the Comprehensive Watershed Management (CWM) decision
support system.