soybean market situation and outlook
DESCRIPTION
Soybean Market Situation And Outlook. 2008 Southern Ag. Outlook Conference. Atlanta, Georgia. September 24, 2008. Kurt M. Guidry. Professor. Department of Agricultural Economics. Current Issues. Despite Increased Production, Stocks Expected To Remain Tight. - PowerPoint PPT PresentationTRANSCRIPT
Soybean Market Situation And Outlook
September 24, 2008
Kurt M. Guidry
Professor
Department of Agricultural Economics
2008 Southern Ag. Outlook ConferenceAtlanta, Georgia

Current Issues
Despite Increased Production, Stocks Expected To Remain Tight
Speculative (Non-Commercial ) Activity Continue To Help Shape Market
While Lower, World Stocks Still At Comfortable Levels
Weaker US Dollar Has Supported Export Demand Despite Higher Prices
Longer Term Prices Likely Shaped By Crop Acreage
Historically High Prices Persist (Basis Levels Remain Weak)
Prices Remain Volatile, Downward to Sideways Trend To Harvest

Fundamental Supply and DemandConditions

Source: USDA, World Agricultural Supply and Demand Estimates, September 2008
U.S. Soybean Supply and Demand
5 Year 2007/08 2008/09 ---------- Percent Change ----------
Average Sept. 2008 Sept. 2008 5 Year Avg. Last Year Last Month
Planted 72.0 63.6 74.8 3.95% 17.61% 0.00%
Harvested 71.0 62.8 73.3 3.21% 16.72% 0.00%
Yield 40.6 41.2 40.0 -1.48% -2.91% -1.23%
Begin Stocks 314 574 140 -55.40% -75.61% 3.70%
Production 2,883 2,585 2,934 1.78% 13.50% -1.31%
Total Supply 3,203 3,169 3,084 -3.73% -2.68% -1.03%
Crush 1,717 1,815 1,785 3.95% -1.65% -1.65%
Exports 1,041 1,155 1,000 -3.91% -13.42% 0.00%
Demand 2,897 3,029 2,949 1.78% -2.64% -1.04%
End Stocks 306 140 135 -55.92% -3.57% 0.00%
S-T-U 10.39% 4.62% 4.58% -55.93% -0.96% 1.05%
Price $7.06 $10.15 $12.35 74.83% 21.67% 0.82%
Stock Situation Remains PositiveAnd
Points To Continued Strong Prices

Soybean Prices and Stocks-To-Use (1980 - 2008)
y = -13.32x + 7.9372
R2 = 0.1998
$0.00
$2.00
$4.00
$6.00
$8.00
$10.00
$12.00
$14.00
0.00% 5.00% 10.00% 15.00% 20.00% 25.00% 30.00%
Series1 Linear (Series1)
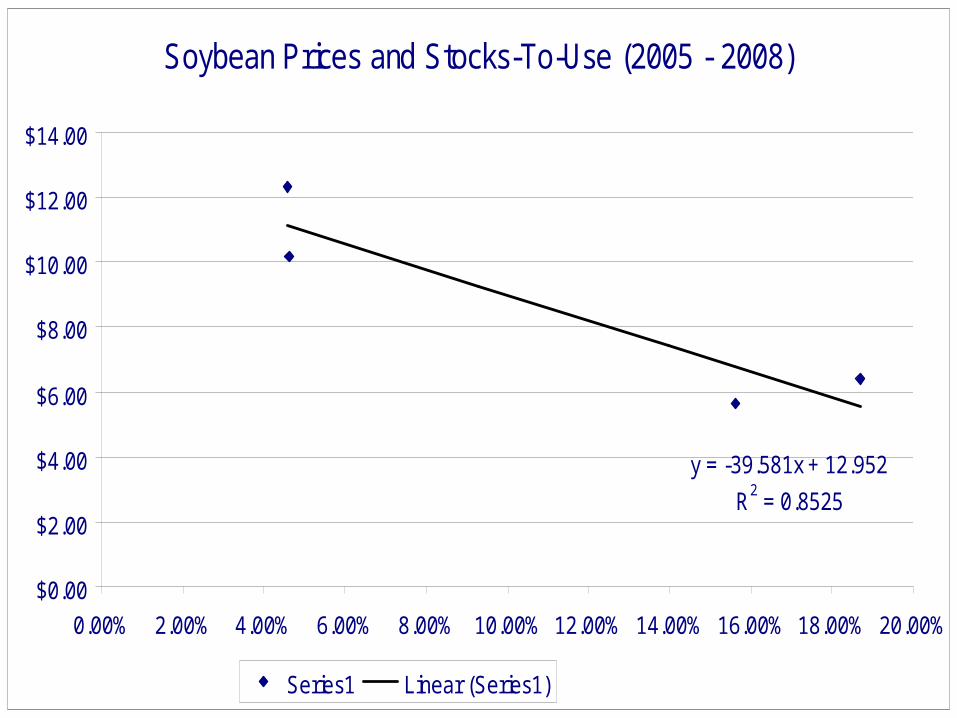
Soybean Prices and Stocks-To-Use (2005 - 2008)
y = -39.581x + 12.952
R2 = 0.8525
$0.00
$2.00
$4.00
$6.00
$8.00
$10.00
$12.00
$14.00
0.00% 2.00% 4.00% 6.00% 8.00% 10.00% 12.00% 14.00% 16.00% 18.00% 20.00%
Series1 Linear (Series1)
Despite Increased Production in 2008, Solid Export Demand Due To Weaker
Dollar and Strong Domestic Crush Expected to Keep Stocks Tight

U.S. Currency Exchange Rate – Selected Countries
Brazil
China
Japan
Mexico
Source: St. Louis Federal Reserve
Have We Seen the End to Falling Dollar ?

U.S. Soybean Exports
0
200,000,000
400,000,000
600,000,000
800,000,000
1,000,000,000
1,200,000,000
Week
Bush
els
5 Year Average 2007/08 2008/0908/09 Exports Down 32% From 07/08
Source: USDA, Foreign Agricultural Service

Source: National Biodiesel Board: http://www.biodiesel.org
Sharp Increases in Biodiesel Production Providing Support For Soybean Oil

Source: USDA, Economic Research Service
US Soybean Crush
90,000
100,000
110,000
120,000
130,000
140,000
150,000
160,000
170,000
Month
1,00
0 Bu
shel
s

World Supply and Demand
Increases in US and South America Production Expected to Bring Increases In World Stocks
While Stocks Are Down From High Two Years Ago, Still Above Long Term Average
While Prices Remain Strong, Fundamentally, World Supply and Demand Situation Still Comfortable

Source: USDA, Foreign Agricultural Service
0
10,000
20,000
30,000
40,000
50,000
60,000
70,000
0
50,000
100,000
150,000
200,000
250,000
2000/01 2001/02 2002/03 2003/04 2004/05 2005/06 2006/07 2007/08 2008/09
1,00
0 M
etric
To
ns
1,00
0 M
etric
To
ns
Marketing Year
World Soybean Supply and Demand
Total Production Total Consumption Ending Stocks
Source: USDA, Foreign Agricultural Service
0
10,000
20,000
30,000
40,000
50,000
60,000
70,000
80,000
90,000
1,00
0 M
etri
c To
ns
2000/01 2001/02 2002/03 2003/04 2004/05 2005/06 2006/07 2007/08 2008/09
Marketing Year
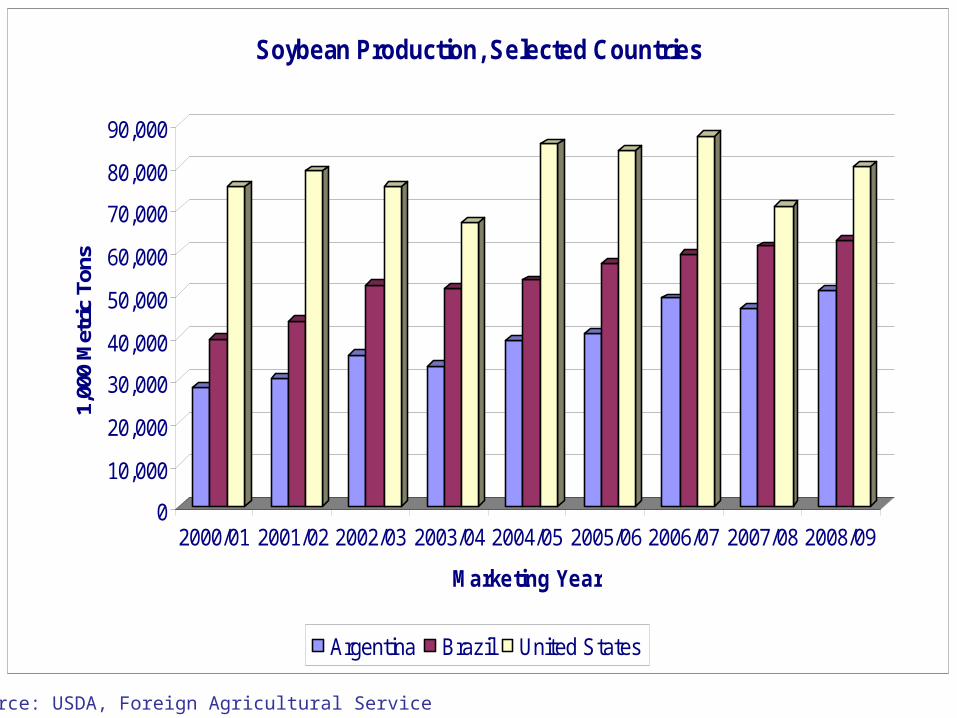
Soybean Production, Selected Countries
Argentina Brazil United States

Source: USDA, Foreign Agricultural Service
0
5,000
10,000
15,000
20,000
25,000
30,000
35,000
1,00
0 M
etri
c To
ns
2000/01 2001/02 2002/03 2003/04 2004/05 2005/06 2006/07 2007/08 2008/09
Marketing Year
Soybean Exports, Selected Countries
Argentina Brazil United States

China’s Activity In Soybean MarketIs Large Factor In US Export Performance

Source: USDA, Foreign Agricultural Service
China Soybean Purchases
0
5,000
10,000
15,000
20,000
25,000
30,000
35,000
40,000
2000/01 2001/02 2002/03 2003/04 2004/05 2005/06 2006/07 2007/08 2008/09
Marketing Year
1,00
0 M
etri
c To
ns
China Imports China Imports From US

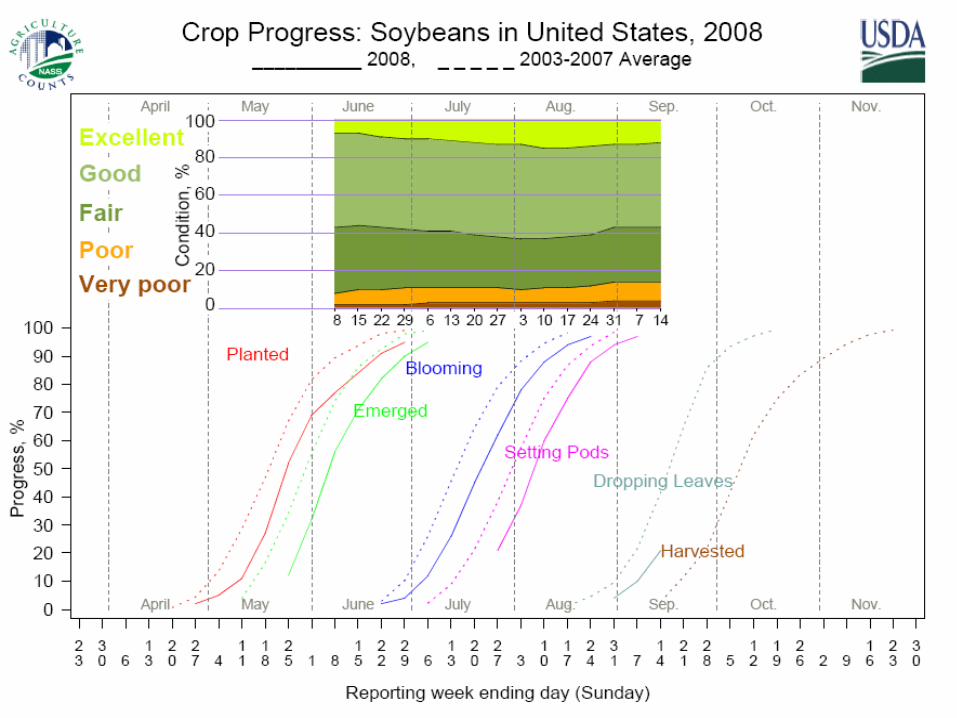
Short Term Price MovementLikely Determined By Progression of
Crop to Harvest
(And Speculative Activity)

Source: DTN AgDayta
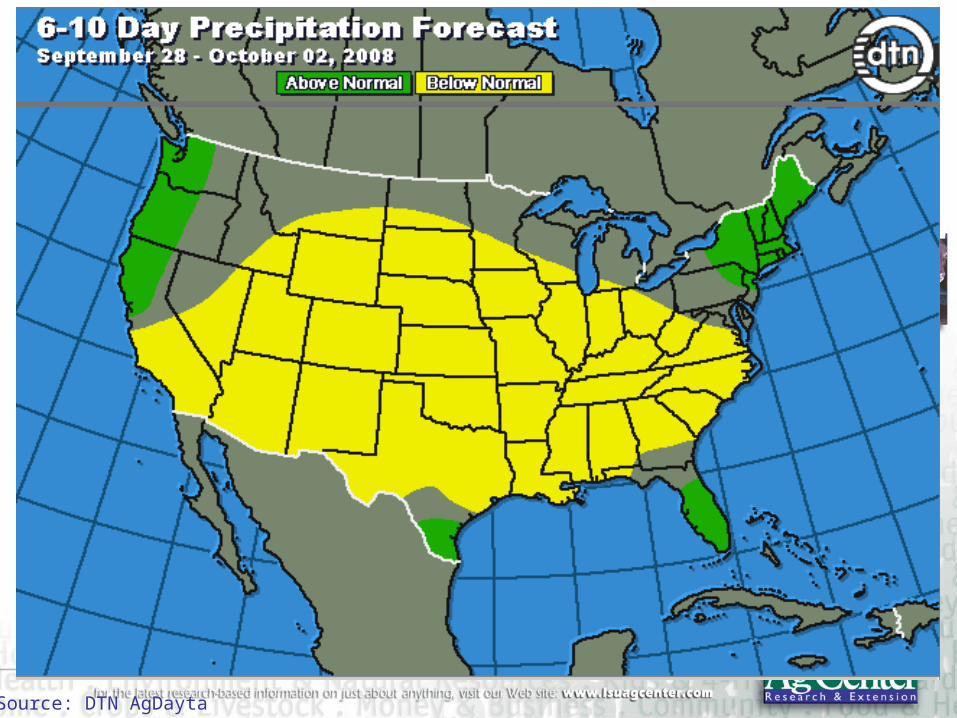
Source: DTN AgDayta
Without Weather Concerns, ExpectSideways To Downward Trending
Market To Harvest
Speculative Activity And Spillover Influences From Outside Markets
Could Alter Trend

Source: USDA, National Agricultural Statistics Service
U.S. Soybean Prices
0
2
4
6
8
10
12
141
/14
/20
02
5/1
4/2
00
2
9/1
4/2
00
2
1/1
4/2
00
3
5/1
4/2
00
3
9/1
4/2
00
3
1/1
4/2
00
4
5/1
4/2
00
4
9/1
4/2
00
4
1/1
4/2
00
5
5/1
4/2
00
5
9/1
4/2
00
5
1/1
4/2
00
6
5/1
4/2
00
6
9/1
4/2
00
6
1/1
4/2
00
7
5/1
4/2
00
7
9/1
4/2
00
7
1/1
4/2
00
8
5/1
4/2
00
8
Month
Do
llars
Pe
r B
ush
el
2002-07 Avg

U.S. Soybean Meal Price, Central Illinois
0
50
100
150
200
250
300
350
400
450
Month
Dol
lars
Per
Ton
Source: USDA, Agricultural Marketing Service

U.S. Soybean Oil Price, Central Illinois
$0.00
$10.00
$20.00
$30.00
$40.00
$50.00
$60.00
$70.00
Month
Dol
lars
Per
Hun
dred
wei
ght
Source: USDA, Agricultural Marketing Service

Soybean Futures Contract Prices – September 22, 2008
Source: DTN AgDayta

Soybean Futures Prices – Long Term Trend
Source: DTN AgDayta
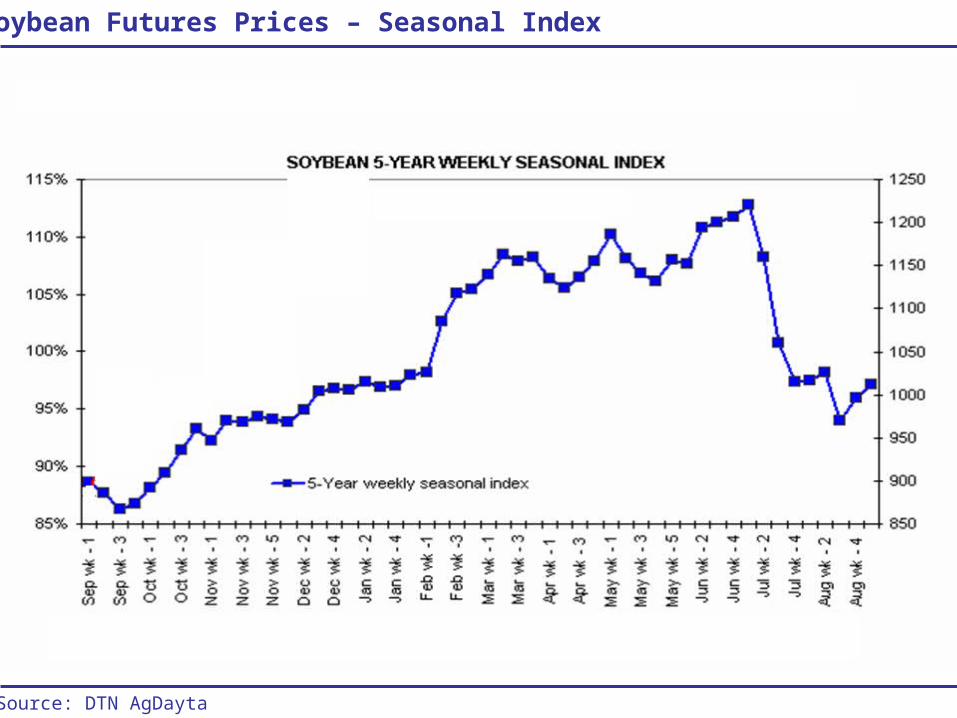
Soybean Futures Prices – Seasonal Index
Source: DTN AgDayta

Soybean Futures Contracts – Commitment of Traders
Source: DTN AgDayta
Reduction in SpeculativePosition Has Helped Soften Market – Is A Reversal In ThisTrend Going To Happen As A ResultOf Outside Market Influence?

Basis Levels Remain Historically Weak:
Departure of Futures From FundamentalsAnd
Increased Transportation Costs

Source: USDA, Agricultural Marketing Service

Longer Price Trend:
Will We See Another Battle For 2009 Acres?
Tight Stock Situation For Both CornAnd Soybeans Suggest Both Markets
Will Look To Attract AdditionalAcres in 2009

Soybean Price Needed For Equal Returns Above Variable Costs With $4.00 Corn
----------------------------- Soybean Variable Cost Per Acre -----------------------------
Corn Variable $/Ac $140 $150 $160 $170 $180 $190 $200
$ 350 $9.57 $9.81 $10.05 $10.29 $10.52 $10.76 $11.00
$ 400 $8.38 $8.62 $8.86 $9.10 $9.33 $9.57 $9.81
$ 450 $7.19 $7.43 $7.67 $7.90 $8.14 $8.38 $8.62
$ 500 $6.00 $6.24 $6.48 $6.71 $6.95 $7.19 $7.43
Soybean Price Needed For Equal Returns Above Variable Costs With $5.00 Corn
----------------------------- Soybean Variable Cost Per Acre -----------------------------
Corn Variable $/Ac $140 $150 $160 $170 $180 $190 $200
$ 350 $13.21 $13.45 $13.69 $13.93 $14.17 $14.40 $14.64
$ 400 $12.02 $12.26 $12.50 $12.74 $12.98 $13.21 $13.45
$ 450 $10.83 $11.07 $11.31 $11.55 $11.79 $12.02 $12.26
$ 500 $9.64 $9.88 $10.12 $10.36 $10.60 $10.83 $11.07
Soybean Price Needed For Equal Returns Above Variable Costs With $6.00 Corn
----------------------------- Soybean Variable Cost Per Acre -----------------------------
Corn Variable $/Ac $140 $150 $160 $170 $180 $190 $200
$ 350 $16.86 $17.10 $17.33 $17.57 $17.81 $18.05 $18.29
$ 400 $15.67 $15.90 $16.14 $16.38 $16.62 $16.86 $17.10
$ 450 $14.48 $14.71 $14.95 $15.19 $15.43 $15.67 $15.90
$ 500 $13.29 $13.52 $13.76 $14.00 $14.24 $14.48 $14.71Current Futures : Dec 09 Corn @ $5.96, Nov 09 Soybean @ $11.95

At Current Prices For 2009,Would Seem To Favor Corn At
Average Yields
Will Soybean Prices Have To IncreaseRelative To Corn Prices To
Maintain Acres ?
Summary
Historically Strong Prices
Fundamentally, Would Expect Prices To Trend Slightly Down or Sideways Into Harvest and Then Improve As Battle For 2009 Acres Begin
Fundamentally, World Stocks Still Comfortable – Will That Limit Upside Potential ?
Tight Stocks Will Keep Market Volatile
Increased Volatility = Increased Marketing Costs and Perhaps Limited Marketing Alternatives