space-borne radar and flood hydrology: flood of data · space-borne radar and flood hydrology:...
TRANSCRIPT
Space-borne radar and flood hydrology: flood of data
Guy Schumann Hydrology Group, School of Geographical Sciences, University of Bristol
+44(0)117 928 8478

Why space-borne radar?• Aerial photographs: fly-over requires extensive
planning and is expensive
• Optical space-borne sensors: on very rare
occasions only when there is prolonged flooding,
most of the time flooding has receded before weather
conditions improve
• Field data: point measurements, difficult to collect
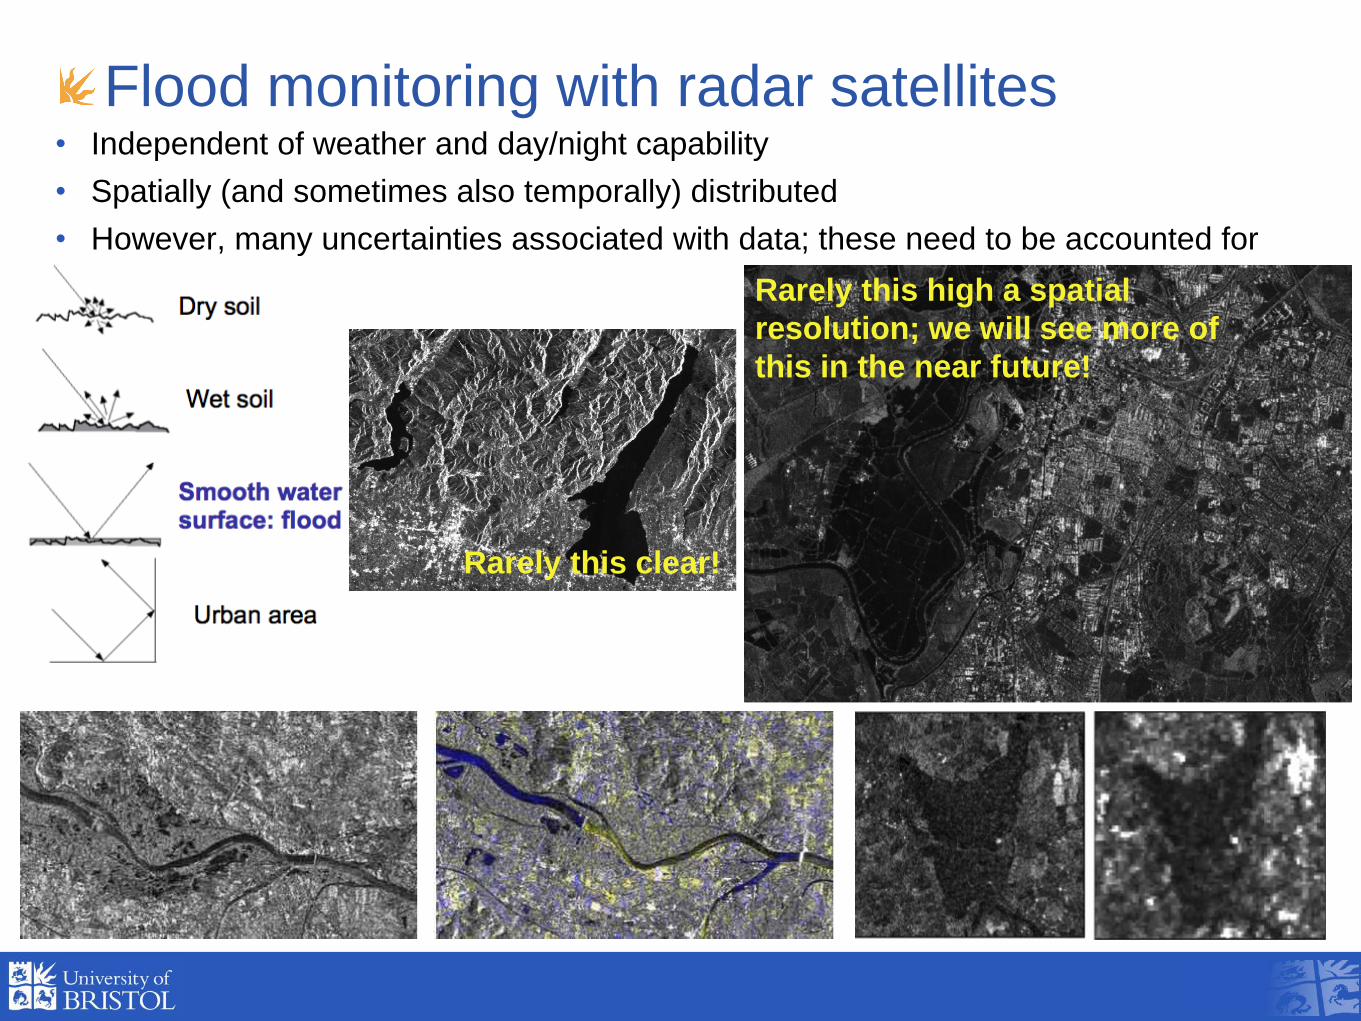
Flood monitoring with radar satellites• Independent of weather and day/night capability
• Spatially (and sometimes also temporally) distributed
• However, many uncertainties associated with data; these need to be accounted for
Rarely this high a spatial
resolution; we will see more of
this in the near future!
Rarely this clear!
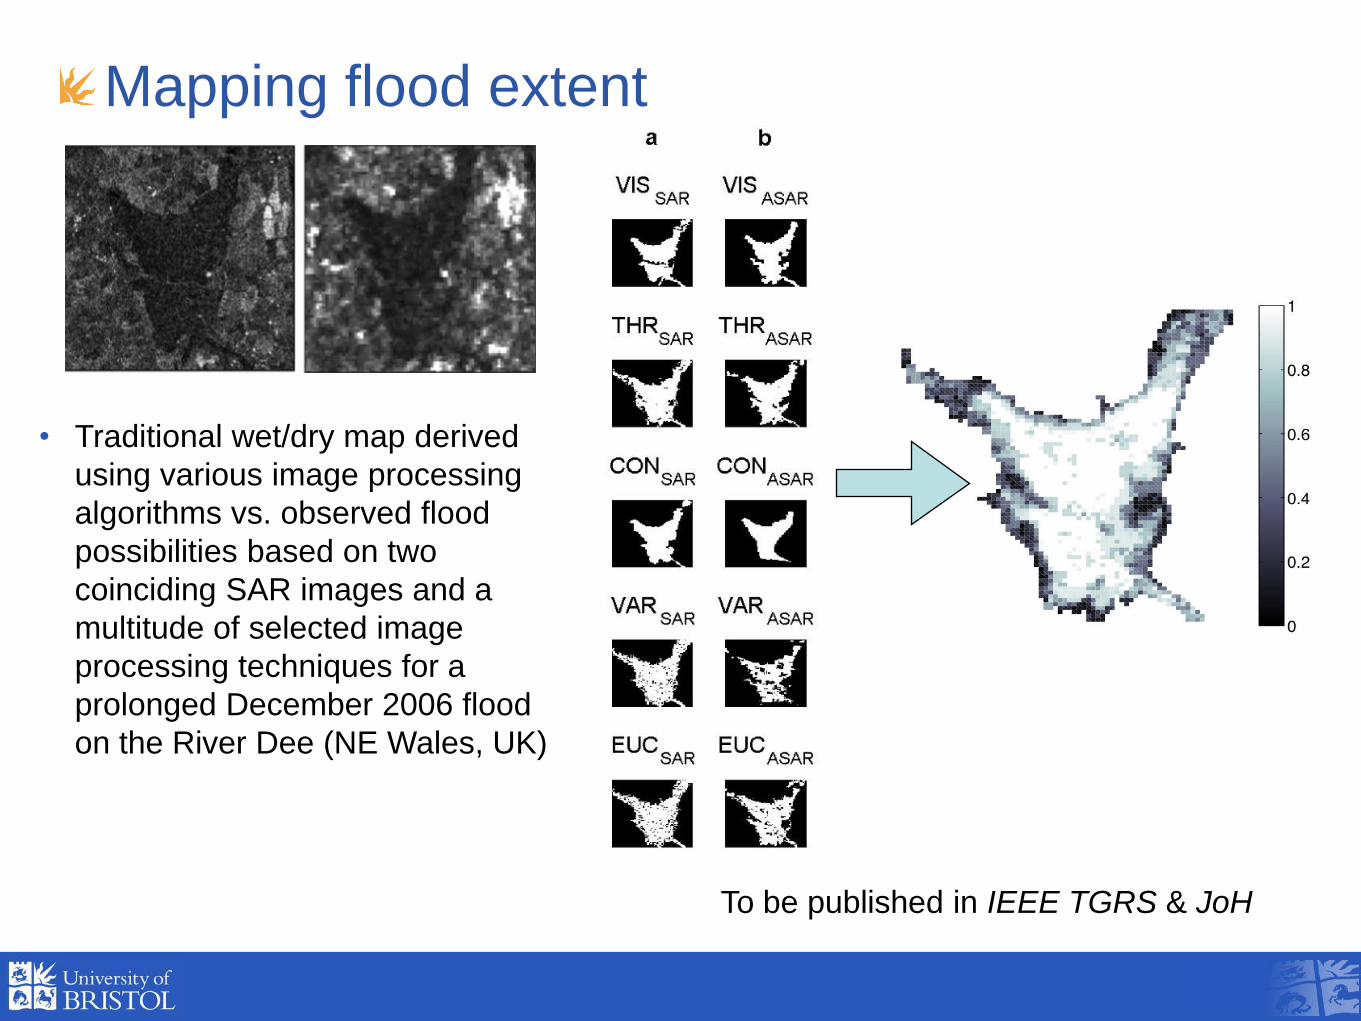
Mapping flood extent
• Traditional wet/dry map derived
using various image processing
algorithms vs. observed flood
possibilities based on two
coinciding SAR images and a
multitude of selected image
processing techniques for a
prolonged December 2006 flood
on the River Dee (NE Wales, UK)
To be published in IEEE TGRS & JoH

Improving flood extent mapping with LiDAR
LiDAR
Flood edge based on SAR data only (a) and on SAR data while conditioned on LiDAR (b)
Mason et al. (2007)

Indirect measurements of water levels
• Fusion of flood extent with topographic data allows water levels to be derived at the
flood edges
• Including flood mapping uncertainties leads to variation in water levels at a given
locationFlood depth and extent map conditioned on multiple
cross-sectional water stages derived from a SAR
flood extent of an event that occurred on the Alzette
River (G.D. of Luxembourg) in early January 2003

Indirect measurements of water levels:
application

Approximation of a flood wave from space• Polynomial approximation to account for topographic & extent mapping uncertainties
reproduces a reliable water surface profile in near real-time
• River Po (Italy) flood 2008 example

Approximation of a flood wave from space:
benchmarking models
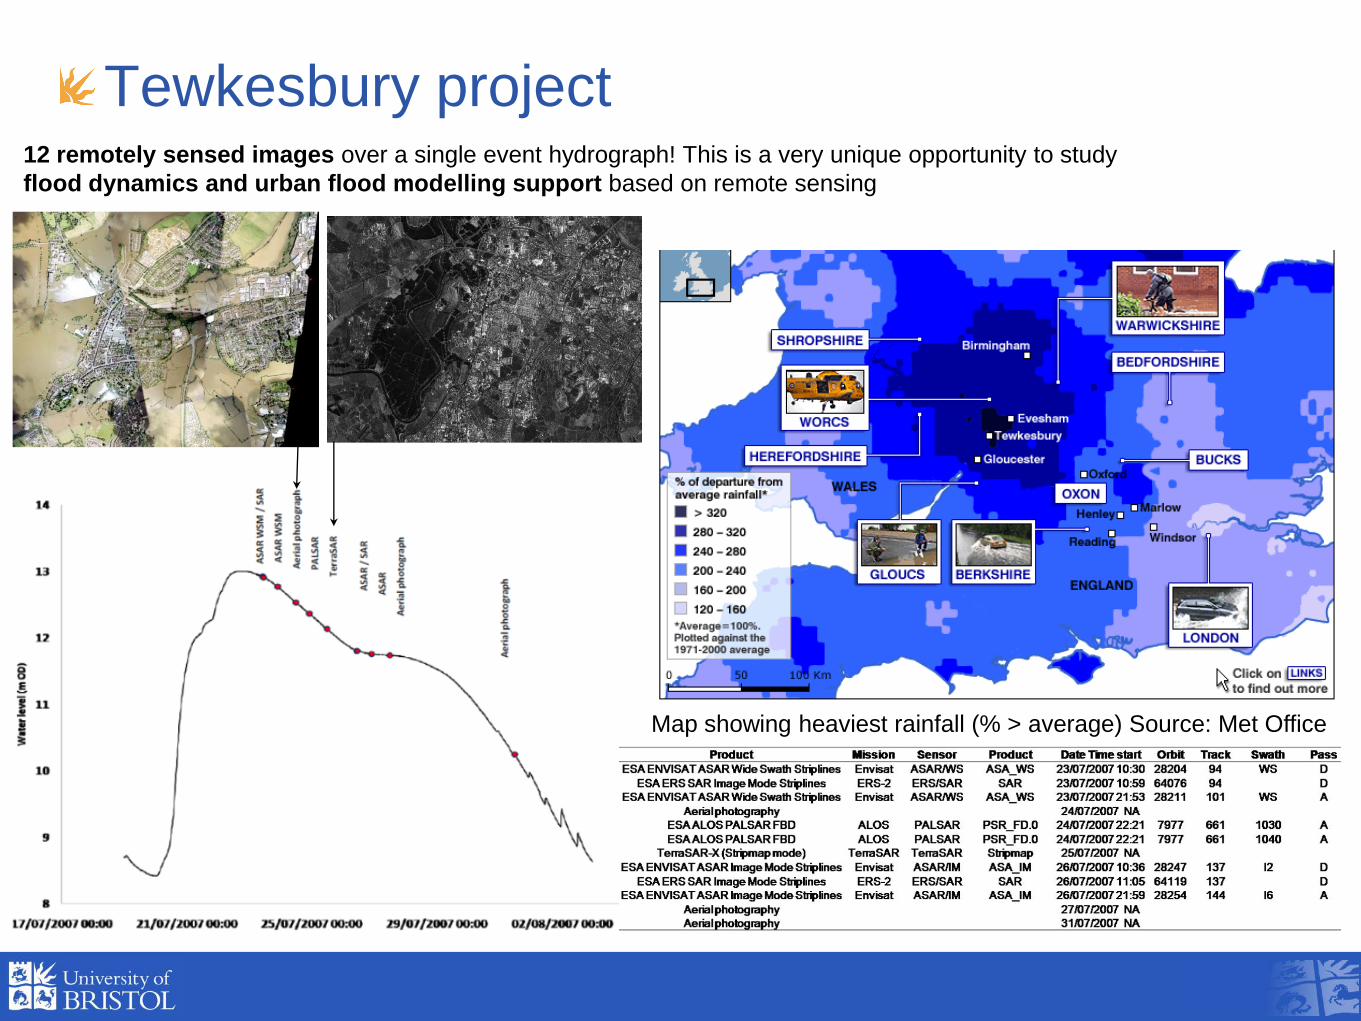
Tewkesbury project
Map showing heaviest rainfall (% > average) Source: Met Office
12 remotely sensed images over a single event hydrograph! This is a very unique opportunity to study
flood dynamics and urban flood modelling support based on remote sensing
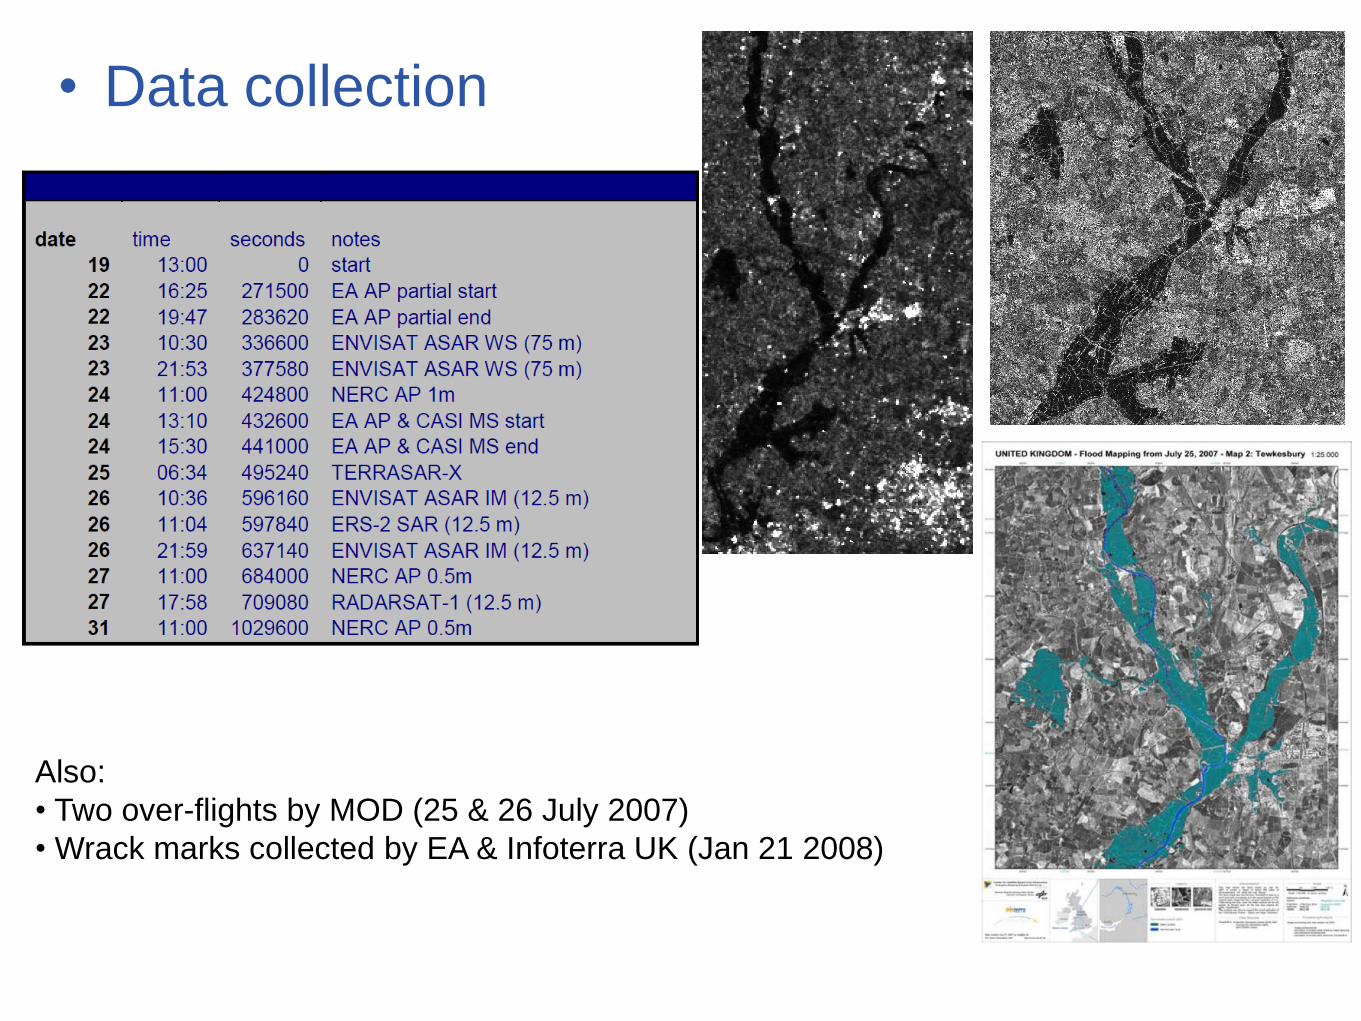
• Data collection
Also:
• Two over-flights by MOD (25 & 26 July 2007)
• Wrack marks collected by EA & Infoterra UK (Jan 21 2008)

Urban flood mapping with TerraSAR-X
• Theoretically possible for the first time!
• David Mason has demonstrated that it really works and developed an
algorithm for urban flood mapping (Tewkesbury, July 2007 flood)
• Use this for urban flood model assessment and improvement of flood risk
estimates
Mason et al., 2007, DLR Proceedings

• Mapping flood dynamics
• Including flood edge positioning uncertainty allows distribution of likely
water levels and statistics to be derived
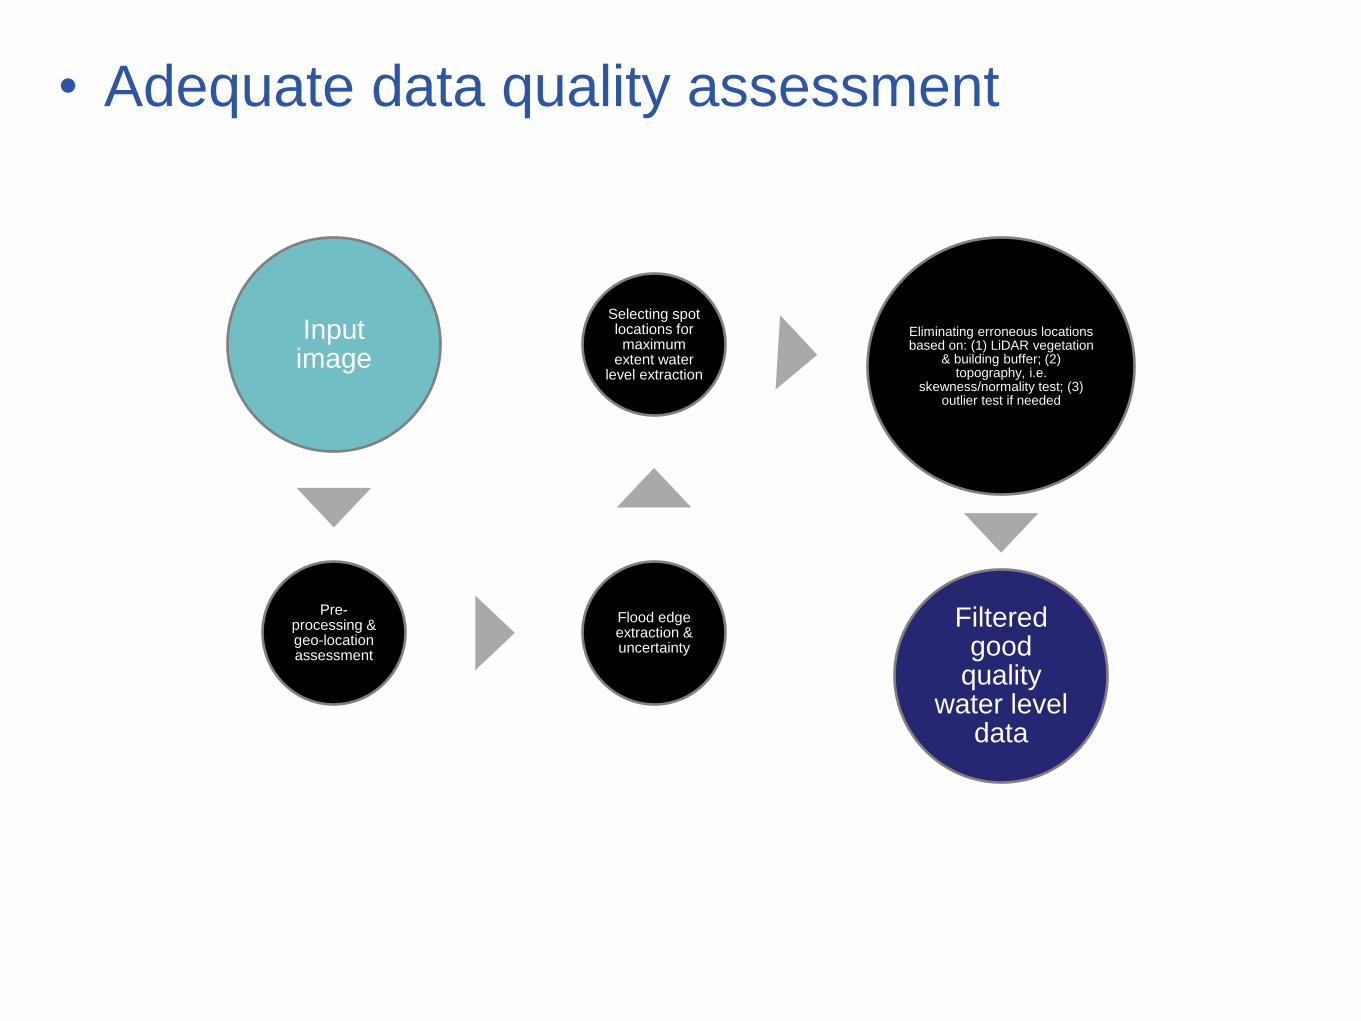
• Adequate data quality assessment
Input image
Pre-processing & geo-location assessment
Flood edge extraction & uncertainty
Selecting spot locations for maximum
extent water level extraction
Eliminating erroneous locations based on: (1) LiDAR vegetation
& building buffer; (2) topography, i.e.
skewness/normality test; (3) outlier test if needed
Filtered good
quality water level
data

Amanda’s PhD
http://bprc.osu.edu/water/index.php
In support of the upcoming SWOT mission