space, race, and poverty: spatial inequalities in … et al: space, race, and poverty: spatial...
TRANSCRIPT
Demographic Research a free, expedited, online journal of peer-reviewed research and commentary in the population sciences published by the Max Planck Institute for Demographic Research Konrad-Zuse Str. 1, D-18057 Rostock · GERMANY www.demographic-research.org
DEMOGRAPHIC RESEARCH VOLUME 26, ARTICLE 17, PAGES 409-448 PUBLISHED 15 MAY 2012 http://www.demographic-research.org/Volumes/Vol26/17/ DOI: 10.4054/DemRes.2012.26.17 Research Article
Space, race, and poverty: Spatial inequalities in walkable neighborhood amenities?
Dustin T. Duncan Kellee White
Jared Aldstadt Marcia C. Castro
John Whalen David R. Williams This publication is part of the Special Collection on “Spatial Demography”, organized by Guest Editor Stephen A. Matthews. © 2012 Dustin T. Duncan et al. This open-access work is published under the terms of the Creative Commons Attribution NonCommercial License 2.0 Germany, which permits use, reproduction & distribution in any medium for non-commercial purposes, provided the original author(s) and source are given credit. See http:// creativecommons.org/licenses/by-nc/2.0/de/

Table of Contents
1 Introduction 410 1.1 Benefits of neighborhood walkability 410 1.2 Spatial inequalities in neighborhood walkability: Evidence and
limitations 412
1.3 Spatial modeling techniques in demographic research 414 1.4 Research purpose 414 2 Methods 415 2.1 Study area 415 2.2 Walkable neighborhood amenities 417 2.3 Neighborhood-level demographic and socioeconomic characteristics
used to evaluate potential spatial inequalities 418
2.4 Spatial statistical analysis 418 2.4.1 Exploratory spatial data analysis 419 2.4.2 Non-spatial and spatial regression analysis 420 3 Results 421 3.1 Descriptive statistics 421 3.2 Spatial distribution and spatial autocorrelation in neighborhood-level
socio-demographic characteristics and walkable neighborhood amenities
422
3.3 Spatial relationship between neighborhood-level socio-demographic characteristics and walkable neighborhood amenities
422
4 Conclusion and discussion 431 5 Acknowledgements 435 References 437

Demographic Research: Volume 26, Article 17 Research Article
http://www.demographic-research.org 409
Space, race, and poverty: Spatial inequalities in walkable neighborhood amenities?
Dustin T. Duncan, ScD1
Jared Aldstadt, PhD2
John Whalen, MA3
Kellee White, PhD, MPH4
Marcia C. Castro, PhD5
David R. Williams, PhD, MPH6
Abstract
BACKGROUND Multiple and varied benefits have been suggested for increased neighborhood walkability. However, spatial inequalities in neighborhood walkability likely exist and may be attributable, in part, to residential segregation.
OBJECTIVE Utilizing a spatial demographic perspective, we evaluated potential spatial inequalities in walkable neighborhood amenities across census tracts in Boston, MA (US).
1 Corresponding Author. Department of Society, Human Development, and Health, Harvard School of Public Health, 677 Huntington Avenue, Kresge Building 7th Floor, Boston, MA 02115 USA. E-mail: [email protected]. Tel: +1-617-384-8732. Fax: +1-617-384-8730. 2 Department of Geography, University at Buffalo, State University of New York, Buffalo, NY USA. E-mail: [email protected]. 3 Department of Geography, University at Buffalo, State University of New York, Buffalo, NY USA. E-mail: [email protected]. 4 Department of Epidemiology and Biostatistics, Arnold School of Public Health, University of South Carolina, Columbia, SC USA. E-mail: [email protected]. 5 Department of Global Health and Population, Harvard School of Public Health, Boston, MA, USA. E-mail: [email protected]. 6 Department of Society, Human Development, and Health, Harvard School of Public Health, Boston, MA, USA and Departments of African and African American Studies, and Sociology, Harvard University, Cambridge, MA, USA. E-mail: [email protected].

Duncan et al: Space, race, and poverty: Spatial inequalities in walkable neighborhood amenities?
http://www.demographic-research.org 410
METHODS The independent variables included minority racial/ethnic population percentages and percent of families in poverty. Walkable neighborhood amenities were assessed with a composite measure. Spatial autocorrelation in key study variables were first calculated with the Global Moran’s I statistic. Then, Spearman correlations between neighborhood socio-demographic characteristics and walkable neighborhood amenities were calculated as well as Spearman correlations accounting for spatial autocorrelation. We fit ordinary least squares (OLS) regression and spatial autoregressive models, when appropriate, as a final step.
RESULTS Significant positive spatial autocorrelation was found in neighborhood socio-demographic characteristics (e.g. census tract percent Black), but not walkable neighborhood amenities or in the OLS regression residuals. Spearman correlations between neighborhood socio-demographic characteristics and walkable neighborhood amenities were not statistically significant, nor were neighborhood socio-demographic characteristics significantly associated with walkable neighborhood amenities in OLS regression models.
CONCLUSIONS Our results suggest that there is residential segregation in Boston and that spatial inequalities do not necessarily show up using a composite measure.
COMMENTS Future research in other geographic areas (including international contexts) and using different definitions of neighborhoods (including small-area definitions) should evaluate if spatial inequalities are found using composite measures but also should use measures of specific neighborhood amenities.
1. Introduction
1.1 Benefits of neighborhood walkability
Definitions of neighborhood walkability may include walking proximity to amenities (such as movie theaters, clothing stores, parks, and libraries) or may refer to community-built environment design features of neighborhoods (such as street connectivity and sidewalk access) (Lo 2009).
Demographic Research: Volume 26, Article 17
http://www.demographic-research.org 411
There are multiple benefits related to increased neighborhood walkability. First, several reviews suggest that neighborhood walkability is associated with better population health, including improved physical activity (Saelens and Handy 2008; Saelens and Papadopoulos 2008; Giles-Corti et al. 2009; Ding et al. 2011) and less obesity (Dunton et al. 2009; Feng et al. 2010), which continues to be one of today’s most pressing public health problems (Flegal et al. 2012; Ogden et al. 2012). In addition, some research evidence suggests that neighborhood walkability improves mental health (Truong and Ma 2006; Kim 2008). Second, there are environmental benefits associated with increased neighborhood walkability including decreases in neighborhood greenhouse gas emissions and vehicle-related air pollution (e.g. nitric oxide) (Bechlet, Millet and Marshall 2011; Setton et al. 2011; Marshall, Brauer, and Frank 2009). Indeed, vehicle emissions may be reduced if more people choose to walk as opposed to drive in and around their neighborhoods. Third, there are economic benefits for having walkable neighborhoods. A recent study evaluated the influence of neighborhood walkability (measured using the Walk Score website which rates walkable neighborhood amenities on a 100-point scale) on commercial real estate investments and found that an increase in Walk Score was associated with increased commercial property values (Pivo and Fisher 2011). Another study found that each Walk Score point was worth up to $3,000 in home values after controlling for various factors that influence housing value (Cortright 2009). Walkability has also been linked to increased economic activity in neighborhoods (Drennen 2003; Litman 2003; Local Government Commission 2012) with the potential pathways being increased access to amenities, better walking conditions, and shifting consumer expenditures away from automobiles and related expenses (e.g. fuel). Of course, a reduction in automobile-related expenditures is an economic benefit for individuals (Litman 2003). Furthermore, improved neighborhood walkability may influence more social interactions and foster increased social capital among residents. Pedestrian-oriented neighborhoods with various accessible destinations might influence socialization (either intentional or accidental) which in turn can foster a better sense of community. A recent study that surveyed residents in three New Hampshire (US) communities shows that neighborhoods that are more walkable had higher levels of social capital, such as trust among neighbors, and participation in community events (Rogers et al. 2011). This is consistent with the results from past studies (Leyden 2003; de Toit et al. 2007; Cohen, Inagami, and Finch 2008).
Given the myriad and varied benefits of neighborhood walkability, it is important to evaluate whether all population groups experience these advantages of neighborhood walkability.
Duncan et al: Space, race, and poverty: Spatial inequalities in walkable neighborhood amenities?
http://www.demographic-research.org 412
1.2 Spatial inequalities in neighborhood walkability: Evidence and limitations
Demographers and sociologists have long been interested in social inequality, including as it relates to space (Lobao, Hooks, and Tickamyer 2007). In the 1960s, spatial inequality was discussed in terms of the spatial mismatch in educational and employment opportunities disproportionately experienced by certain population groups (e.g. racial/ethnic minorities and low-income individuals) which is in part attributable to residential segregation (Kain 1968). Residential segregation (i.e. physical separation of certain population subgroups in space) is a fundamental organizing feature of life in the United States as well as in New Zealand, Brazil, and several countries in the European Union. In the US, racial and socio-economic (class) residential segregation are commonplace and were previously supported by the federal government, economic, and social institutions (Massey and Denton 1993). Although discrimination in housing and mortgage lending was made illegal in the US by the Civil Rights Act of 1968, explicit and implicit discrimination continued to sustain high levels of segregation, especially among US Blacks (Fix and Struyk 1993). Importantly, residential segregation often results in disparate economic, physical, and social neighborhood environments which translate into lower educational attainment, employment opportunities, and accessibility to resources (Massey and Denton 1993). The current patterns of de facto residential segregation also have serious implications for population health (Acevedo-Garcia et al. 2003; Kramer and Hogue 2009; White and Borrell 2011) and are considered a fundamental cause of racial/ethnic health disparities (Williams and Collins 2001). Segregation is hypothesized to influence health by perpetuating disparities in educational and employment opportunities, concentrating poverty, shaping the social and physical neighborhood context, and the availability of health-promoting resources and amenities (Williams and Collins 2001; Acevedo-Garcia and Lochner 2003; Acevedo-Garcia et al. 2003). While some studies have examined the association between residential segregation or percent minority racial/ethnic composition (which is commonly used as a proxy measure of racial residential segregation) and walkable neighborhood amenities, it is possible that highly-segregated neighborhoods may be associated with an inequitable distribution of walkable neighborhood amenities. The historical disinvestment in segregated neighborhoods may shape accessibility and availability of walkable neighborhood amenities.
A recent review provides evidence demonstrating that disadvantaged groups live in neighborhoods with deleterious neighborhood walkability features, including fewer walkable neighborhood amenities such as full-service supermarkets and exercise facilities (Lovasi et al. 2009). The studies that examine social inequalities in walkable neighborhood amenities, which often estimate relationships with specific neighborhood amenities (e.g. supermarkets), are informative. However, most do not consider the spatial demography of walkable neighborhood amenities or employ spatial analytical
Demographic Research: Volume 26, Article 17
http://www.demographic-research.org 413
techniques that account for the dependence between nearby observations (Chi and Zhu 2008; Castro 2007; Voss 2007; Weeks 2004). Indeed, these studies assume that neighborhoods are spatially independent but might be plagued with spatial autocorrelation, which may have affected the results. However, we note that the theoretical processes for potential spatial inequality are unknown. Therefore, there may be substantive or “nuisance” spatial autocorrelation—both have some theoretical justification (Smiley et al. 2010). Substantive spatial autocorrelation is due to a substantive spatial process. However, nuisance spatial autocorrelation is not caused by a substantive spatial process but rather spatial autocorrelation that arises from spillovers or spatial mismatch. Essentially, in this case, the spatial scope of the phenomenon of interest does not match the scope of the spatial units used in the analysis. For example, a "neighborhood" may span portions of several census units. If substantive spatial autocorrelation is ignored, the point estimates and standard errors can be incorrect (LaSage and Pace 2009; Ward and Gleditsch 2008; Waller and Gotway 2004; Bailey and Gatrell 1995; Anselin and Bera 1998). On the other hand, ignoring nuisance spatial autocorrelation can produce standard errors that are too small and thus the results could be more significant than they should be (LaSage and Pace 2009; Ward and Gleditsch 2008; Waller and Gotway 2004; Bailey and Gatrell 1995; Anselin and Bera 1998). Some of the studies examining spatial inequalities in walkable neighborhood amenities rely on traditional multi-level modeling methods, although research has shown that there can be spatial autocorrelation that is unaccounted for by multilevel models (Chaix, Merlo, and Chauvin 2005; Chaix et al. 2005). Spatial regression approaches account for the effect of neighbors on one another (spatial autocorrelation) by giving explicit attention to the location and arrangement of neighborhood units (LaSage and Pace 2009; Ward and Gleditsch 2008; Waller and Gotway 2004; Bailey and Gatrell 1995; Anselin and Bera 1998). While the use of spatial modeling techniques in research is increasing, it is not surprising that most studies evaluating potential spatial inequalities in neighborhood walkability features do not utilize spatial modeling techniques when analyzing spatial data. Dissemination of spatial techniques is only slowly permeating demography and related social science fields (such as sociology and public health). Only a few studies that we are aware of have examined spatial clustering in neighborhood walkability features and these studies found significant positive spatial autocorrelation (Duncan et al. in press, 2011; Sharkey et al. 2009; Auchincloss et al. 2007, Talen and Anselin 1998; Talen 1997). This indicates that spatial regression methods may be needed when examining spatial inequalities in walkable neighborhood amenities.
Duncan et al: Space, race, and poverty: Spatial inequalities in walkable neighborhood amenities?
http://www.demographic-research.org 414
1.3 Spatial modeling techniques in demographic research
Demographic research using spatial modeling techniques is motivated by the oft-cited First Law of Geography which provides a clear articulation of spatial dependence, noting that “everything is related to everything else, but near things are more related than distant things” (Tobler 1970). Spatial dependence, also termed spatial autocorrelation, of variables under study can lead to misstatements regarding the uncertainty of results and incorrect inferences. One assumption of traditional correlation analysis is that observations are independent. When positive spatial autocorrelation exists for both variables in a bivariate correlation analysis, the probability of Type I error exceeds the specified level (Clifford and Richardson 1985; Haining 1991). When there is positive spatial autocorrelation in one variable and negative spatial autocorrelation in another, the specified level of significance is too conservative in the traditional bivariate correlation analysis, increasing the likelihood of the Type II error. Furthermore, the application of non-spatial regression methods (such as ordinary least squares regression) are predicated on the assumption that regression residuals are independent (Waller and Gotway 2004; Bailey and Gatrell 1995). As stated previously, neglecting to account for spatial autocorrelation, if it exists, can result in biased parameter estimates and incorrect standard errors (LaSage and Pace 2009; Ward and Gleditsch 2008; Waller and Gotway 2004; Bailey and Gatrell 1995; Anselin and Bera 1998). Specifically, when there is substantive spatial autocorrelation, the point estimates and standard errors can be incorrect. In this circumstance, researchers compute the spatial lag model (LaSage and Pace 2009; Ward and Gleditsch 2008; Waller and Gotway 2004; Bailey and Gatrell 1995; Anselin and Bera 1998). In the case of “nuisance” spatial autocorrelation, standard errors may be incorrect (too small) (LaSage and Pace 2009; Ward and Gleditsch 2008; Waller and Gotway 2004; Bailey and Gatrell 1995; Anselin and Bera 1998). The spatial error model is computed in this circumstance to ensure that statistical inferences are valid (LaSage and Pace 2009; Ward and Gleditsch 2008; Waller and Gotway 2004; Bailey and Gatrell 1995; Anselin and Bera 1998).
1.4 Research purpose
We sought to evaluate potential spatial inequalities in walkable neighborhood amenities using the Walk Score® composite measure. The purpose of this study, specifically, was to evaluate if minority neighborhood racial/ethnic composition and neighborhood socioeconomic disadvantage are related to walkable neighborhood amenities. In order to evaluate potential spatial inequalities in walkable neighborhood amenities, we used population data from the 2010 US Census and the 2006-2010 American Community

Demographic Research: Volume 26, Article 17
http://www.demographic-research.org 415
Survey for census tracts across Boston, Massachusetts (US). The cutting-edge algorithm from the Walk Score® website for computing an up-to-date indicator of walkable neighborhood amenities was the dependent variable. The data were analyzed with spatially explicit methods for quantifying spatial autocorrelation and for assessing relationships between variables.
2. Methods
2.1 Study area
The study area is the city of Boston, Massachusetts (US) which over the past three decades has consistently ranked as one of the top metropolitan areas exhibiting a high degree of residential segregation (Logan and Stults 2011; Iceland, Weinberg, and Steinmetz 2002) and which is an understudied city in neighborhood research. Boston is one of the oldest cities in the US, the largest city in Massachusetts, and the largest city in the New England area. According to the 2010 US Census, Boston has a population of 617,594, although many more people live in the Greater Boston area. Among metropolitan areas, the Greater Boston area is ranked tenth, with an estimated population of over 4.5 million people. The city of Boston has a total area of 89.63 square miles (232.14 km2), which includes 48.43 square miles (125.43 km2) (54.03%) of land. Like selected other cities, Boston is sometimes referred to as the “city of neighborhoods” (City of Boston 2012). Our definition of a neighborhood was the US census tract (Subramanian et al. 2006, 2005; Krieger et al. 2003, 2002). Census tracts in the US are “designed to be relatively homogeneous units with respect to population characteristics, economic status, and living conditions” – with an average of approximately 4,000 people (US Census Bureau 2012). We used 2010 census tract boundaries for this study. Figure 1 shows a map of census tracts in the study area clipped to Boston’s natural boundaries.

Duncan et al: Space, race, and poverty: Spatial inequalities in walkable neighborhood amenities?
Figure 1: Map of study area, Boston, Massachusetts (2010 US Census Tracts)
Note: Massachusetts’ town layers come from the Commonwealth of Massachusetts' Office of Geographic Information (MassGIS),
Information Technology Division (available at: http://www.mass.gov/mgis/).
http://www.demographic-research.org 416

Demographic Research: Volume 26, Article 17
http://www.demographic-research.org 417
2.2 Walkable neighborhood amenities
We used the Walk Score® web-based algorithm to assess neighborhood walkability, which was defined for this study as walkable neighborhood amenities, i.e. the degree to which an area is within walking distance to amenities (www.walkscore.com). Walk Score® was developed by Front Seat Management (www.frontseat.org), a software development company based in Seattle, WA, which focuses on software with civic applications. Walk Score® uses publicly available data including from Google, Education.com, Open Street Map and Localeze to measure the number of typical consumer facilities within walking distance of a location. Facilities are first divided into five categories: educational (e.g. schools), retail (e.g. grocery, drug, convenience, and bookstores), food (e.g. restaurants), recreational (e.g. parks and gyms) and entertainment (e.g. movie theaters). The Walk Score® algorithm calculates the distance to the closest of each of the five facilities, using straight-line distances. It calculates a linear combination of these distances weighted both by facility type priority and a distance decay function. If one of each of the five facilities is within a quarter-mile radius from the input location, that location receives a 100 score (the maximum number of points). The number of points assigned in each category declines as the distance approaches 1-mile and no points are awarded for destinations more than 1-mile away. Scores are then normalized into an integral score ranging from 0 (least walkable/car dependent) to 100 (most walkable) (Front Seat 2011a). An emerging body of research suggests that Walk Score® is a valid measure of neighborhood walkability (Carr, Dunsiger, and Marcus 2010, 2011; Duncan et al. 2011, in press). Importantly, one recent Walk Score® validation study was conducted in Boston and found that Walk Score® validly measured several walkable neighborhood amenities, including retail destinations, service destinations, cultural/education destinations, and recreational open space (Duncan et al. in press). The location to be entered into Walk Score® can be entered as geographic coordinates or as an address which is then geolocated using Google Geolocation (Google 2011). Front Seat provides an application programming interface (API), which can be used to query the Walk Score® database through URL calls; this eliminates the need to use the website interface (Front Seat 2011b). A program was created for this study within the R programming language (R Foundation for Statistical Computing, Vienna, Austria), which queries the Walk Score® database for the geographic coordinates or a given address. The script then scans the API response and extracts the corresponding Walk Score®. Using the Walk Score® API in early December of 2011, we obtained Walk Scores for the centroid of census blocks in Boston. In this study, we used the population-weighted average of the block-level Walk Scores contained within a census tract to aggregate to that level.

Duncan et al: Space, race, and poverty: Spatial inequalities in walkable neighborhood amenities?
http://www.demographic-research.org 418
2.3 Neighborhood-level demographic and socioeconomic characteristics used to evaluate potential spatial inequalities
Neighborhood-level socio-demographic characteristics for minority neighborhood racial/ethnic composition included the percentage of non-Hispanic Black residents and percentage of Hispanic residents. Neighborhood-level socioeconomic disadvantage was operationalized as percentage of families below poverty level. We used 2010 US Census data for information on neighborhood-level percent non-Hispanic Black and percent Hispanic. Because data on neighborhood-level socioeconomic conditions were not obtained in the 2010 US Census, we used data from the American Community Survey (ACS). For this study, we used 2006-2010 ACS data (5-year estimates) for percent of families in poverty.
2.4 Spatial statistical analysis
In this study, we designed a comprehensive spatial modeling approach to examine spatial relationships between neighborhood socio-demographic characteristics (i.e. minority neighborhood racial/ethnic composition and neighborhood socioeconomic disadvantage) and walkable neighborhood amenities (i.e. Walk Scores®). For the analysis, the shapefile included only contiguous 2010 census tracts in Boston (n=179) because contiguity matters in spatial analysis of areal data. Therefore, we excluded the Harbor Islands which is consistent with past neighborhood research in Boston (Cradock et al. 2005; Chen et al. 2006) (n=1 census tract; census tract # 980101), and we excluded a census tract that includes only water, i.e. Massachusetts Bay (census tract # 990101). Notably, the Harbor Islands includes a small population of 535 individuals who are not typical of the rest of the city (e.g. there is a detoxification center there with permanent residents) and water of course does not include any people. The analysis was further restricted to those census tracts with >500 people (n=167), consistent with previous spatial inequalities research (Block, Scribner, and DeSalvo 2004), which ensures that census tracts with extremely small populations (such as 22 people) would not bias the results. This restriction also removes missing/withheld ACS data due to small populations. For all spatial data analyses we used the R statistical program version 2.14 with Bivand’s spdep package which includes a number of spatial analyses, including calculation of spatial autocorrelation and spatial regression models (Bivand 2011; Bivand, Pebesma, and Gómez-Rubio 2008). Statistical significance for all analyses was assessed at p<0.05.
Demographic Research: Volume 26, Article 17
http://www.demographic-research.org 419
2.4.1 Exploratory spatial data analysis
Prior to any spatial analysis, we conducted descriptive statistics for neighborhood socio-demographic characteristics and walkable neighborhood amenities. After this, we conducted exploratory spatial data analysis, i.e. geovisualization and tests of global spatial autocorrelation. Specifically, to facilitate the initial inspection of potential spatial patterns, we conducted geovisualization in ArcGIS version 10 by mapping the neighborhood socio-demographic characteristics and walkable neighborhood amenities. We created choropleth maps showing the spatial patterns in the neighborhood socio-demographic characteristics and walkable neighborhood amenities across Boston census tracts using ArcGIS (map colors were based on Color Brewer 2.0) (Brewer and Harrower 2012).
We evaluated the presence of overall spatial autocorrelation in the neighborhood socio-demographic characteristics and walkable neighborhood amenities using the most commonly used test statistic for spatial autocorrelation in the literature, i.e. the Global Moran’s I statistic (Bailey and Gatrell 1995; Waller and Gotway 2004). For the Global Moran’s I calculations, we specified a first-order Queen’s contiguity spatial weights matrix, which defines neighbors as census tracts that share a common boundary or a corner and mathematically represents the spatial relationships. A value is one when the neighboring spatial units are ‘neighbors’ and zero if ‘non-neighbors’. Statistical significance of the Global Moran’s I was obtained through a Monte Carlo simulation (n=999). This yielded a pseudo p-value. Moran’s I values range approximately between -1 to 1, whereby a Moran’s I value near zero indicates no spatial autocorrelation or the null hypothesis of complete spatial randomness. As measured by Moran’s I, a positive spatial autocorrelation coefficient reflects neighboring areas with similarly large or small values (i.e. similarity), and a negative spatial autocorrelation coefficient reflects neighboring areas with large inverse values–higher values and lower values are neighbors (i.e. dissimilarity). Thus, when the coefficient is positive, it suggests that there is a positive spill-over effect among neighbors while the case of negative spatial autocorrelation, on the other hand, is perhaps not as common of a phenomenon.
In addition to the primary variables used in this study (i.e. percent of non-Hispanic Black residents, percent of Hispanic residents, percent of families in poverty), we also conducted geovisualization and global spatial autocorrelation tests for the percent of non-Hispanic White residents (from the 2010 US Census) for comparison purposes to fully understand potential patterns of racial/ethnic residential segregation. To understand spatial patterns in the population distribution we also conducted exploratory spatial data analysis for population density (i.e. total population per square kilometer) (from the 2010 US Census).

Duncan et al: Space, race, and poverty: Spatial inequalities in walkable neighborhood amenities?
http://www.demographic-research.org 420
2.4.2 Non-spatial and spatial regression analysis
Prior to regression analysis, we calculated non-parametric Spearman product correlations between the neighborhood socio-demographic characteristics (i.e. minority neighborhood racial/ethnic composition and neighborhood socioeconomic disadvantage) and the values for walkable neighborhood amenities since the neighborhood socio-demographic characteristics had a non-normal distribution. Because the presence of spatial autocorrelation violates the assumption of independent observations, it can result in incorrect degrees of freedom in the conventional correlation tests of the significance—this can lead to misestimation of significance of effects (Clifford and Richardson 1985; Student 1914; Haining 1991). The Clifford and Richardson effective sample size adjustment method was used to account for spatial autocorrelation (Clifford and Richardson 1985; Haining 1991). This methodology employs spatial correlation matrices for each variable to jointly measure the dependence between observations. The estimated correlation matrices were derived from six spatial lags based on the Queen’s contiguity spatial weights matrix (Haining 1991). The corresponding t-statistics and p-values will change based on the adjusted sample size. Both Spearman correlation coefficients (rS) and significance values have been reported.
Then, we fit ordinary least squares (OLS) regression models to test our research question. If the OLS regression residuals had significant spatial autocorrelation, we applied a well-known spatial econometric approach for spatial regression modeling by fitting spatial simultaneous autoregressive models (LaSage and Pace 2009; Ward and Gleditsch 2008; Waller and Gotway 2004; Bailey and Gatrell 1995; Anselin and Bera 1998). We specifically planned to estimate the spatial error model and the spatial lag model as appropriate. The motivation for implementing both of these approaches to account for spatial autocorrelation, if necessary, is that the theoretical processes for potential spatial inequality is unknown and both spatial models have some theoretical justification. Previous spatial inequalities research has implemented both spatial models for similar reasons (Smiley et al. 2010). Maximum likelihood will be used for parameter estimation. However, we recognize that different techniques when estimating spatial linear regression models can be implemented (Bivand, Pebesma, and Gómez-Rubio 2008), so, if necessary, in a sensitivity analysis, we estimated the spatial models via other estimation methods such as the generalized method of moments technique for the spatial error model (Bivand, Pebesma, and Gómez-Rubio 2008; Kelejian and Prucha 1999). Using the first-order Queen’s spatial weights matrix, the Global Moran’s I statistic and the Lagrange Multiplier test for both spatial regression models were used to evaluate the fitted OLS regression residuals for evidence of spatial autocorrelation (LaSage and Pace 2009; Anselin et al. 1996; Anselin and Bera 1998; Anselin 1988), which also suggests which spatial model is most appropriate. The Global Moran's I

Demographic Research: Volume 26, Article 17
http://www.demographic-research.org 421
statistic was applied to the error terms of the OLS model to assess spatial autocorrelation. When the Moran's I is statistically significant, the Lagrange Multiplier test for spatial lag and spatial error dependence is used. The one with the highest value (and lowest p-value) will indicate the proper specification for the data. If spatial models were necessary, the OLS and spatial model were compared using the Akaike Information Criterion (AIC) (Akaike 1974). The AIC examines overall model fit and model complexity, whereby a lower AIC value indicates a better goodness-of-fit. Finally, if spatial error models were fit, we conducted a spatial Hausman test comparing the magnitude of the OLS and spatial error model parameter estimates based on the null hypothesis of correct specification (i.e. the coefficients between the two models are of a similar magnitude and direction) (LeSage and Pace 2009, Pace and LeSage 2008). Multivariate regression models of minority neighborhood racial/ethnic composition and neighborhood socioeconomic disadvantage (i.e. percent of non-Hispanic Black residents, percent of Hispanic residents, and percent of families in poverty) predicting walkable neighborhood amenities are controlled for census tract population density because it might influence the placement of walkable neighborhood amenities.
3. Results
3.1 Descriptive statistics
Descriptive statistics for walkable neighborhood amenities (Walk Scores) and neighborhood-level socio-demographic characteristics are shown in Table 1. The mean Walk Score was 67.67, with a standard deviation (SD) of 4.33. Among the neighborhood socio-demographic characteristics examined, there was a particularly large range for census tract percent White (range: 0.92-98.33) and census tract percent Black (range 0.16-83.99).
Duncan et al: Space, race, and poverty: Spatial inequalities in walkable neighborhood amenities?
http://www.demographic-research.org 422
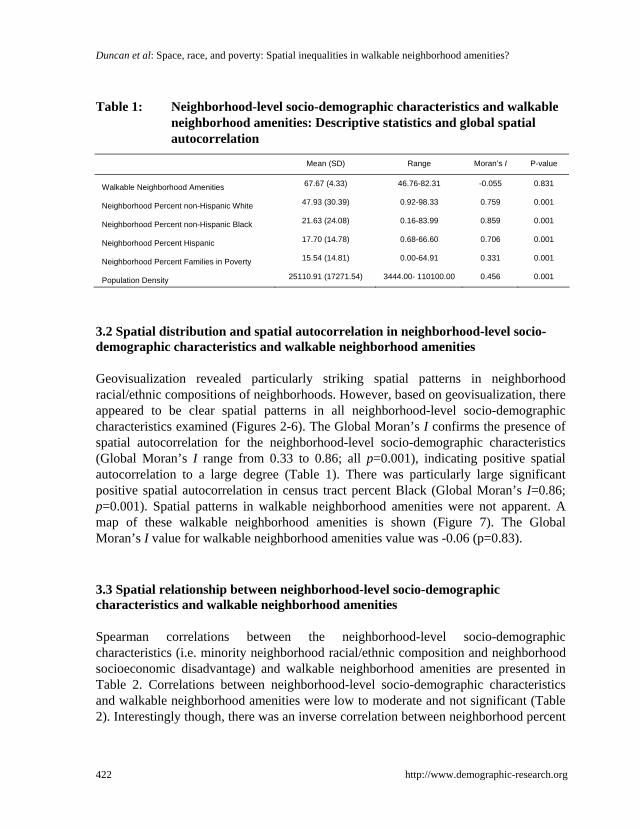
Table 1: Neighborhood-level socio-demographic characteristics and walkable neighborhood amenities: Descriptive statistics and global spatial autocorrelation
Mean (SD) Range Moran’s I P-value
Walkable Neighborhood Amenities 67.67 (4.33) 46.76-82.31 -0.055 0.831
Neighborhood Percent non-Hispanic White 47.93 (30.39) 0.92-98.33 0.759 0.001
Neighborhood Percent non-Hispanic Black 21.63 (24.08) 0.16-83.99 0.859 0.001
Neighborhood Percent Hispanic 17.70 (14.78) 0.68-66.60 0.706 0.001
Neighborhood Percent Families in Poverty 15.54 (14.81) 0.00-64.91 0.331 0.001
Population Density 25110.91 (17271.54) 3444.00- 110100.00 0.456 0.001
3.2 Spatial distribution and spatial autocorrelation in neighborhood-level socio-demographic characteristics and walkable neighborhood amenities
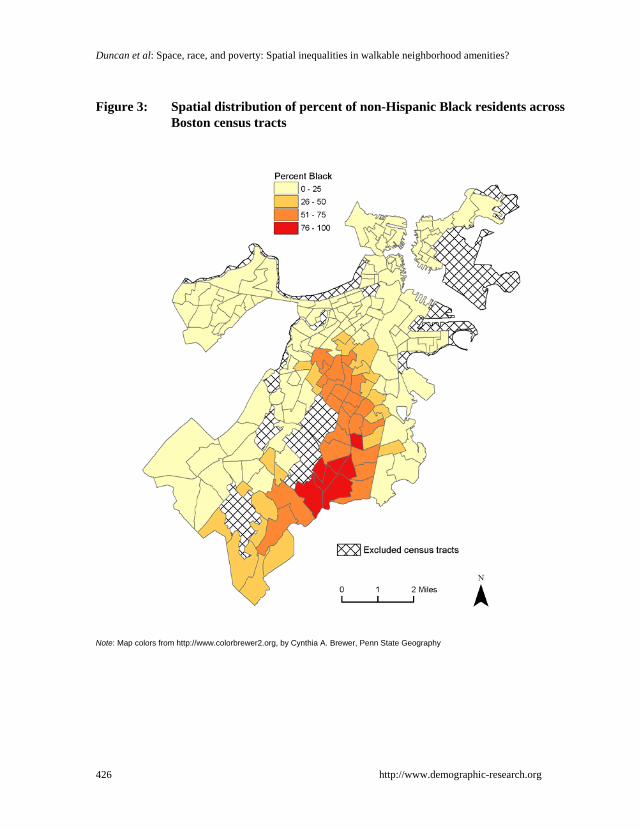
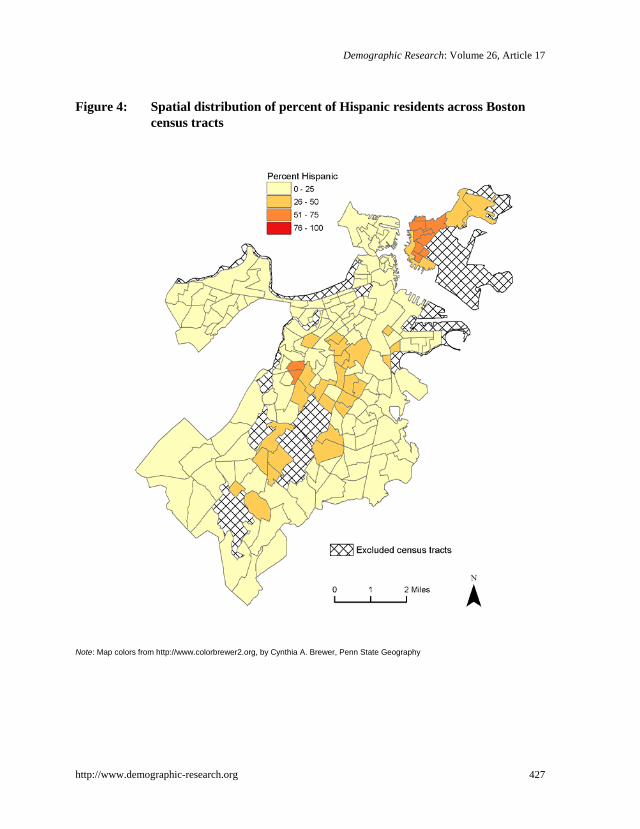
Geovisualization revealed particularly striking spatial patterns in neighborhood racial/ethnic compositions of neighborhoods. However, based on geovisualization, there appeared to be clear spatial patterns in all neighborhood-level socio-demographic characteristics examined (Figures 2-6). The Global Moran’s I confirms the presence of spatial autocorrelation for the neighborhood-level socio-demographic characteristics (Global Moran’s I range from 0.33 to 0.86; all p=0.001), indicating positive spatial autocorrelation to a large degree (Table 1). There was particularly large significant positive spatial autocorrelation in census tract percent Black (Global Moran’s I=0.86; p=0.001). Spatial patterns in walkable neighborhood amenities were not apparent. A map of these walkable neighborhood amenities is shown (Figure 7). The Global Moran’s I value for walkable neighborhood amenities value was -0.06 (p=0.83).
3.3 Spatial relationship between neighborhood-level socio-demographic characteristics and walkable neighborhood amenities
Spearman correlations between the neighborhood-level socio-demographic characteristics (i.e. minority neighborhood racial/ethnic composition and neighborhood socioeconomic disadvantage) and walkable neighborhood amenities are presented in Table 2. Correlations between neighborhood-level socio-demographic characteristics and walkable neighborhood amenities were low to moderate and not significant (Table 2). Interestingly though, there was an inverse correlation between neighborhood percent
Demographic Research: Volume 26, Article 17
http://www.demographic-research.org 423
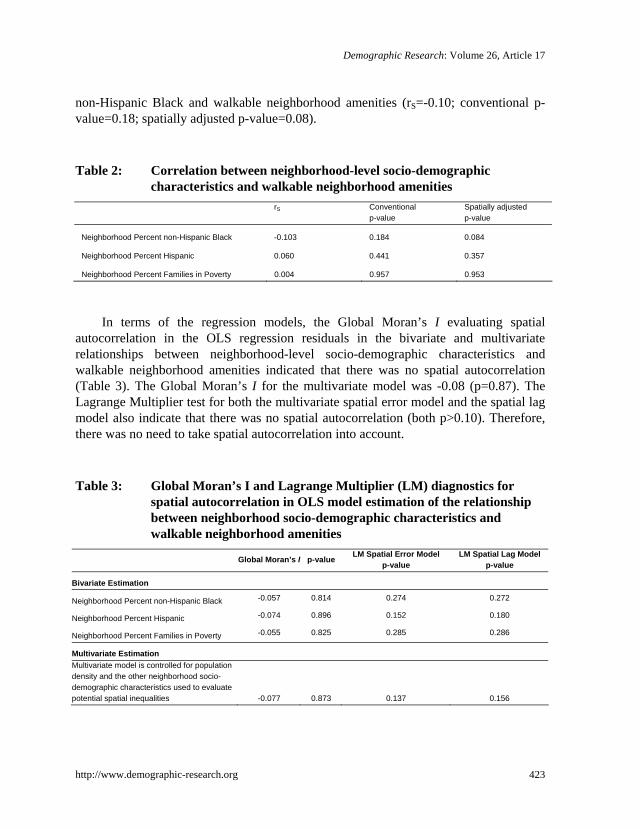
non-Hispanic Black and walkable neighborhood amenities (rS=-0.10; conventional p-value=0.18; spatially adjusted p-value=0.08).
Table 2: Correlation between neighborhood-level socio-demographic characteristics and walkable neighborhood amenities
rS Conventional
p-value Spatially adjusted p-value
Neighborhood Percent non-Hispanic Black -0.103 0.184 0.084
Neighborhood Percent Hispanic 0.060 0.441 0.357
Neighborhood Percent Families in Poverty 0.004 0.957 0.953
In terms of the regression models, the Global Moran’s I evaluating spatial
autocorrelation in the OLS regression residuals in the bivariate and multivariate relationships between neighborhood-level socio-demographic characteristics and walkable neighborhood amenities indicated that there was no spatial autocorrelation (Table 3). The Global Moran’s I for the multivariate model was -0.08 (p=0.87). The Lagrange Multiplier test for both the multivariate spatial error model and the spatial lag model also indicate that there was no spatial autocorrelation (both p>0.10). Therefore, there was no need to take spatial autocorrelation into account.
Table 3: Global Moran’s I and Lagrange Multiplier (LM) diagnostics for spatial autocorrelation in OLS model estimation of the relationship between neighborhood socio-demographic characteristics and walkable neighborhood amenities
Global Moran’s I p-value LM Spatial Error Model p-value
LM Spatial Lag Model p-value
Bivariate Estimation
Neighborhood Percent non-Hispanic Black -0.057 0.814 0.274 0.272
Neighborhood Percent Hispanic -0.074 0.896 0.152 0.180
Neighborhood Percent Families in Poverty -0.055 0.825 0.285 0.286
Multivariate Estimation Multivariate model is controlled for population density and the other neighborhood socio-demographic characteristics used to evaluate potential spatial inequalities -0.077 0.873 0.137 0.156
Duncan et al: Space, race, and poverty: Spatial inequalities in walkable neighborhood amenities?
http://www.demographic-research.org 424
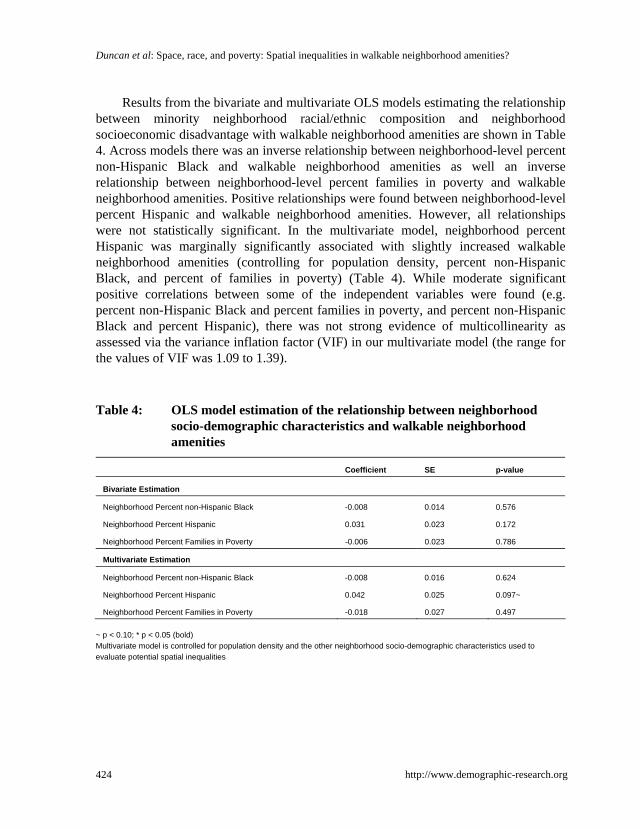
Results from the bivariate and multivariate OLS models estimating the relationship between minority neighborhood racial/ethnic composition and neighborhood socioeconomic disadvantage with walkable neighborhood amenities are shown in Table 4. Across models there was an inverse relationship between neighborhood-level percent non-Hispanic Black and walkable neighborhood amenities as well an inverse relationship between neighborhood-level percent families in poverty and walkable neighborhood amenities. Positive relationships were found between neighborhood-level percent Hispanic and walkable neighborhood amenities. However, all relationships were not statistically significant. In the multivariate model, neighborhood percent Hispanic was marginally significantly associated with slightly increased walkable neighborhood amenities (controlling for population density, percent non-Hispanic Black, and percent of families in poverty) (Table 4). While moderate significant positive correlations between some of the independent variables were found (e.g. percent non-Hispanic Black and percent families in poverty, and percent non-Hispanic Black and percent Hispanic), there was not strong evidence of multicollinearity as assessed via the variance inflation factor (VIF) in our multivariate model (the range for the values of VIF was 1.09 to 1.39).
Table 4: OLS model estimation of the relationship between neighborhood socio-demographic characteristics and walkable neighborhood amenities
Coefficient SE p-value
Bivariate Estimation
Neighborhood Percent non-Hispanic Black -0.008 0.014 0.576
Neighborhood Percent Hispanic 0.031 0.023 0.172
Neighborhood Percent Families in Poverty -0.006 0.023 0.786
Multivariate Estimation
Neighborhood Percent non-Hispanic Black -0.008 0.016 0.624
Neighborhood Percent Hispanic 0.042 0.025 0.097~
Neighborhood Percent Families in Poverty -0.018 0.027 0.497 ~ p < 0.10; * p < 0.05 (bold) Multivariate model is controlled for population density and the other neighborhood socio-demographic characteristics used to evaluate potential spatial inequalities

Demographic Research: Volume 26, Article 17
Figure 2: Spatial distribution of percent of non-Hispanic White residents across Boston census tracts
Note: Map colors from http://www.colorbrewer2.org, by Cynthia A. Brewer, Penn State Geography
http://www.demographic-research.org 425
Duncan et al: Space, race, and poverty: Spatial inequalities in walkable neighborhood amenities?
Figure 3: Spatial distribution of percent of non-Hispanic Black residents across Boston census tracts
Note: Map colors from http://www.colorbrewer2.org, by Cynthia A. Brewer, Penn State Geography
http://www.demographic-research.org 426
Demographic Research: Volume 26, Article 17
Figure 4: Spatial distribution of percent of Hispanic residents across Boston census tracts
Note: Map colors from http://www.colorbrewer2.org, by Cynthia A. Brewer, Penn State Geography
http://www.demographic-research.org 427

Duncan et al: Space, race, and poverty: Spatial inequalities in walkable neighborhood amenities?
Figure 5: Spatial distribution of percent of families below poverty level across Boston census tracts
Note: Map colors from http://www.colorbrewer2.org, by Cynthia A. Brewer, Penn State Geography
http://www.demographic-research.org 428

Demographic Research: Volume 26, Article 17
Figure 6: Spatial distribution of population density across Boston census tracts
Notes: Population density was categorized in ArcGIS using Jenks natural breaks classification methodology (n=4).
Map colors from http://www.colorbrewer2.org, by Cynthia A. Brewer, Penn State Geography
http://www.demographic-research.org 429

Duncan et al: Space, race, and poverty: Spatial inequalities in walkable neighborhood amenities?
Figure 7: Spatial distribution of walkable neighborhood amenities (Walk Scores) across Boston census tracts
Notes: Scoring indices based on developers’ categorizations.
Map colors from http://www.colorbrewer2.org, by Cynthia A. Brewer, Penn State Geography
http://www.demographic-research.org 430

Demographic Research: Volume 26, Article 17
http://www.demographic-research.org 431
4. Conclusion and discussion
The purpose of the present investigation was to evaluate spatial relationships between neighborhood socio-demographic characteristics (i.e. minority racial/ethnic composition and socioeconomic disadvantage) and walkable neighborhood amenities utilizing a spatial demographic perspective and novel geospatial data from Walk Score. Notably, we rigorously and explicitly tackled spatial aspects in model specification, estimation, and diagnostic testing. To our knowledge, this is one of few studies to evaluate spatial inequalities in walkable neighborhood amenities to consider issues of spatial autocorrelation. Results show significant positive spatial autocorrelation in neighborhood socio-demographic characteristics (e.g. census tract percent Black) but not walkable neighborhood amenities or in the OLS regression residuals, which suggests no need for spatial models. Spearman correlations between neighborhood socio-demographic characteristics and walkable neighborhood amenities were not statistically significant nor were neighborhood socio-demographic characteristics significantly associated with walkable neighborhood amenities in OLS regression models.
Our finding of significant global spatial autocorrelation in the neighborhood-level socio-demographic characteristics confirms that there is residential segregation in Boston (Reardon 2006; Acevedo-Garcia et al. 2003; Frank 2003) with especially stark segregation among Blacks. This is consistent with past research showing the persistence and distinctiveness of racial residential segregation, especially for Black individuals (Massey and Denton 1993; Glaeser and Vigdor 2001). Competing explanations for the cause and the persistence of racial residential segregation have centered on spatial assimilation and place stratification theories which have been empirically tested (Charles 2003; Dawkins 2004; Iceland and Wilkes 2006). Although Black individuals have a greater preference for residing in integrated areas than any other racial group (Charles 2003), our results suggest that they still encounter more restrictions in mobility in comparison to other racial/ethnic groups. This bolsters the evidence suggesting that racial residential segregation is a byproduct of institutional discrimination and not simply that residential segregation (among Black individuals) reflects their preferences for residence in segregated areas. Indeed, as previously argued, currently existing neoclassical real estate market dynamics drive residential segregation and spatial sorting of population subgroups which is important since racial residential segregation can constrain the physical context and availability of resources in a neighborhood. Prior research shows that residential segregation among Blacks creates a distinctive social and economic milieu that facilitates, promotes, and sustains disadvantage (Massey and Denton 1993; Glaeser and Vigdor 2001; Williams and Collins 2001).

Duncan et al: Space, race, and poverty: Spatial inequalities in walkable neighborhood amenities?
http://www.demographic-research.org 432
Our study extends previous research that has evaluated spatial inequalities in neighborhood conditions. First, we are not aware of research examining spatial inequalities in walkable neighborhood amenities with the Walk Score algorithm—which has up-to-date data on such amenities and has other pros including it being free and easy to use, and being at an international scale. Second, as previously noted, we evaluated spatial autocorrelation in OLS regression residuals, which few studies have done. This is an advancement of the literature because parameter estimates and p-values can be incorrect if spatial autocorrelation exists (LaSage and Pace 2009; Ward and Gleditsch 2008; Waller and Gotway 2004; Bailey and Gatrell 1995; Anselin and Bera 1998). Among the few studies evaluating spatial inequalities (e.g. neighborhood-level racial composition and income) in walkable neighborhood amenities that examined spatial autocorrelation (Kwate et al. in press; Dahmann et al. 2010; Smiley et al. 2010; Zenk et al. 2005), some found spatial autocorrelation in the standard regression residuals (Kwate et al. in press; Smiley et al. 2010; Zenk et al. 2005), but other studies did not (Dahmann et al. 2010). In the present study, we did not find spatial autocorrelation in OLS regression residuals. We also found no significant relationship between neighborhood socio-demographic characteristics and walkable neighborhood amenities in the OLS regression models. This was surprising because we expected to find a spatial relationship between neighborhood socio-demographic characteristics (neighborhood-level percent Black particularly) and walkable neighborhood amenities. Several prior studies documented that neighborhood socio-demographic composition (including neighborhoods with a high concentration of Blacks and poor individuals) are related to fewer health-promoting resources (Lovasi et al. 2009) such as fewer healthy food establishments (e.g. supermarkets) (Smiley et al. 2010; Sharkey et al. 2009; Franco et al. 2008; Morland and Filomena 2007; Powell et al. 2007; Moore and Diez Roux 2006; Zenk et al. 2005; Morland et al. 2002) and fewer physical activity-related facilities (e.g. recreational facilities) (Dahmann et al. 2010; Smiley et al. 2010; Moore et al. 2008; Gordon-Larsen et al. 2006; Powell et al. 2006, Estabrooks et al. 2003). Studies have also found spatial inequalities in other important neighborhood amenities. Indeed, research that examined spatial inequalities in other amenities (which examined the multiple amenities separately) found that the percent of Blacks in the neighborhood was significantly associated with a reduced number of various neighborhood amenities (e.g. pharmacies, banks, credit unions, and movie theatres) (Kwate et al. in press; Small and McDermott 2006; Hellig and Sawicki 2003). Results from these previous studies collectively suggest that neighborhood amenities may serve as potential mediating mechanisms linking segregation to deleterious health outcomes such as obesity, hypertension, and all-cause mortality (Chang 2006; Collins and Williams 1999; Kershaw et al. 2011; Lopez 2006). Identifying intermediary mechanisms can provide important clues and improve our understanding of how broader social and spatial
Demographic Research: Volume 26, Article 17
http://www.demographic-research.org 433
inequalities such as segregation function to influence health status (White and Borrell 2011).
A key implication from our study is that spatial inequalities do not necessarily show up using a composite measure like the Walk Score. Walk Score only measures whether there is at least a single case of the various types of establishments nearby in one of the five categories we described previously. Indeed, Walk Score does not differentiate between types of establishments in one of the five categories measured. Therefore, composite measures inherently can minimize the importance of any single feature and it does not measure quality of features–which all may matter when examining spatial inequalities in neighborhood amenities. It is also important to note that most neighborhoods in Boston have relatively good Walk Scores. Because we aggregated the Walk Scores to census tracts, we further diminished the variability in them. While we recognize the possibility that other (perhaps more salient) factors besides spatial demographic factors drive economic geographies, such as the decision to locate a business, there is emerging research suggesting that retail redlining based on the neighborhood racial/ethnic composition may in fact be important (Kwate et al. in press). Given that past research has shown an inequitable spatial distribution by socio-demographic characteristics in multiple specific walkable neighborhood amenities (Kwate et al. in press; Lovasi et al. 2009; Small and McDermott 2006; Hellig and Sawicki 2003), future research is needed to monitor spatial inequalities in neighborhood conditions vis-a-vis socio-demographic characteristics in Boston, other areas in the US, and abroad. Such monitoring can be done with innovative, web-based geospatial technologies, perhaps including with Walk Score as it is a validated, up-to-date measure of walkable neighborhood amenities constantly being refined to improve its neighborhood walkability estimates (though potential limitations of the tool should be considered). In addition to monitoring spatial inequalities, policy-level interventions may be necessary and appropriate if such inequalities are documented. The inequitable distribution of certain neighborhood amenities could potentially be remedied with the modification of urban and density zoning laws and the investment of businesses in disadvantaged communities (Rothwell 2011). Such infrastructure developments in communities can also improve population health, including for historically disadvantaged groups (Williams and Marks 2011). Additionally, the implementation of health impact assessments (HIA) have been promising in minimizing the adverse health impact of segregation that are not traditionally evaluated in land use decisions (Dannenberg et al. 2008; Bhatia 2007). It is possible that the wider use of HIA may promote equitable land use development, improvement, and expansion projects across communities.
This study has some limitations. The research was conducted in a restricted geographic area which limits the ability to generalize its findings. However, we

Duncan et al: Space, race, and poverty: Spatial inequalities in walkable neighborhood amenities?
http://www.demographic-research.org 434
explicitly and specifically wanted to focus on Boston because it is an understudied city in neighborhood research and it consistently ranks as one of the top metropolitan areas exhibiting a high degree of residential segregation (Logan and Stults 2011; Iceland, Weinberg, and Steinmetz 2002). This was supported in our study with the most current demographic data. Focusing on local-level spatial inequalities can also be important for the development of local policies. As sociologist Roderick McKenzie noted in the early 1920s, “probably no other term is used so loosely or with such changing content as the term neighborhood, and very few concepts are more difficult to define” (McKenzie 1923:334-335). The neighborhood definition we selected was US census tracts. As indicated by the modifiable areal unit problem (Openshaw and Taylor 1979; Wong 2009), results may change depending on the neighborhood definition used. Of the several definitions of neighborhoods that have been used in research, US census-defined boundaries (especially census tracts) are common neighborhood definitions in the US, including in Boston-based neighborhood research (Subramanian et al. 2006, 2005; Krieger et al. 2003, 2002). This is one notable reason we specifically selected the census tract as our neighborhood definition. In addition, while other definitions of neighborhood have been used in Boston, including those based on the Boston Public Health Commission (Chen et al. 2006) and the Boston Redevelopment Authority (Li et al. 2009a, 2009b), these neighborhood definitions are relatively large (much larger than census tracts) and thus there is likely to be less variance among the units being measured due to the aggregation at these coarser spatial scales (Reynolds and Amrhein 1997). Also, potential “edge effects” can lead to underestimation of access to walkable neighborhood amenities, i.e. where census tracts are adjacent to amenities outside of Boston.
We recognize that disparate measures of segregation may differentially be associated with outcomes and that population composition within neighborhoods can be measured as a continuous variable or a categorical variable (e.g. predominantly Black neighborhoods could be defined as census tracts with >60% or >80% Black individuals) as some studies have done (Franco et al. 2008; Moore et al. 2008; Morland and Filomena 2007; Moore and Diez Roux 2006; Morland et al. 2002). We a priori chose to evaluate segregation using percent minority racial/ethnic composition and to assess population composition as a continuous variable. Post-hoc analyses using categorical variables for population composition produced similar findings. In addition, we recognize that other aspects of neighborhood disadvantage exist, including percent of households receiving public assistance, and that different measures can be combined via principal component analysis to create a single measure of neighborhood disadvantage. However, we a priori chose to evaluate neighborhood poverty because it is arguably the most commonly-used measure of neighborhood disadvantage which we believe to be an important feature of neighborhoods. Neighborhood poverty has shown pronounced and

Demographic Research: Volume 26, Article 17
http://www.demographic-research.org 435
consistent associations with various outcomes. Composite measures may reduce the salience of individual components of the measure. It is also important to note that we obtained population-weighted Walk Scores for the centroid of census blocks and then aggregated those scores to census tracts. We recognize that there are alternate aggregation approaches. For example, we could have randomly selected a certain number of addresses (e.g. 50 addresses) within each census tract to estimate the Walk Score. However, we believe that our approach is likely more accurate of the actual Walk Score and we are not aware of any published research that aggregated Walk Score data to census tracts (or any other areal unit for that matter), highlighting that our study adds to the literature in a novel way.
Additionally, it is important to discuss limitations that pertain to the Walk Score algorithm. Walk Score is a composite measure of walkable neighborhood amenities (as we previously mentioned). As such, the types of walkable neighborhood amenities are presented in aggregate of different types (e.g. educational, retail, entertainment, food). Furthermore, at present, the Walk Score does not account for intersection density, average block length, or walking distances (Walk Score calculations are based on straight-line distances rather than distances based on the street network). Walk Score also ignores other factors that likely influence active pedestrian neighborhood transportation including crime, neighborhood aesthetics, traffic, topography, and natural walking barriers such as bodies of water. Finally, the validity of Walk Score can vary by geographic locale (Duncan et al. 2011). However, the Walk Score algorithm seems to work best in areas with high population densities such as Boston (Duncan et al. 2011, in press). Despite these limitations, the current study does provide evidence that there is residential segregation in Boston and suggests that spatial inequalities do not necessarily show up using a composite measure. Future research in other geographic areas (including international contexts) and using different definitions of neighborhoods (including small-area definitions) should evaluate if spatial inequalities are found using composite measures, but also should use measures of specific neighborhood amenities.
5. Acknowledgements
D.T. Duncan was supported by the Alonzo Smythe Yerby Postdoctoral Fellowship at Harvard School of Public Health. D.T. Duncan acknowledges that this paper substantially benefited from participation in the Spatial Pattern Analysis Workshop (July 2010) and the Spatial Regression Modeling Workshop (June 2011) held at the University of California-Santa Barbara and The Pennsylvania State University, respectively, both which are part of the Advanced Spatial Analysis Training Program for Population Scientists supported by the Eunice Kennedy Shriver National Institute of

Duncan et al: Space, race, and poverty: Spatial inequalities in walkable neighborhood amenities?
http://www.demographic-research.org 436
Child Health and Human Development (Grant #R25-HD057002) (Stephen A. Matthews, PhD, Principal Investigator). We thank Jeff Blossom for providing technical assistance with building the geospatial dataset used in this research. We also wish to thank the anonymous reviewers who offered very helpful comments and suggestions which allowed us to greatly improve our manuscript.

Demographic Research: Volume 26, Article 17
http://www.demographic-research.org 437
References
Acevedo-Garcia, D. and Lochner, K.A. (2003). Residential segregation and health. In: Kawachi, I. and Berkman, L.F. (eds.). Neighborhoods and Health. Oxford: Oxford University Press: 265-287. doi:10.1093/acprof:oso/9780195138382. 003.0012.
Acevedo-Garcia, D., Lochner, K.A., Osypuk, T. L., and Subramanian, S.V. (2003). Future directions in residential segregation and health research: A multilevel approach. American Journal of Public Health 93(2): 215-221. doi:10.2105/ AJPH.93.2.215.
Akaike, H. (1974) A new look at the statistical model identification. IEEE Transactions on Automatic Control 19(6): 716-723. doi:10.1109/TAC.1974.1100705.
Anselin, L. (1988). Lagrange multiplier test diagnostics for spatial dependence and spatial heterogeneity. Geographical Analysis 20(1): 1-17. doi:10.1111/j.1538-4632.1988.tb00159.x.
Anselin, L. and Bera, A.K. (1998). Spatial dependence in linear regression models with an introduction to spatial econometrics. In: Ullah, A. and Giles, D.E.A. (eds). Handbook of Applied Economic Statistics. New York: Marcel Dekker: 237-289.
Anselin, L., Bera, A.K., Florax, R., and Yoon, M.J. (1996). Simple diagnostic tests for spatial dependence. Regional Science and Urban Economics 26(1): 77-104. doi:10.1016/0166-0462(95)02111-6.
Auchincloss, A.H., H Diez Roux, A.V., Brown, D.G., Raghunathan, T.E., and Erdmann, C.A. (2007). Filling the gaps: Spatial interpolation of residential survey data in the estimation of neighborhood characteristics. Epidemiology 18(4): 469-478. doi:10.1097/EDE.0b013e3180646320.
Bailey, T.C. and Gatrell, A.C. (1995). Interactive Spatial Data Analysis. Harlow Essex, England: Longman Scientific & Technical; J Wiley.
Bechle, M.J., Millet, D.B., and Marshall, J.D. (2011). Effects of income and urban form on urban NO2: Global evidence from satellites. Environmental Science and Technology 45(11): 4914-4919. doi:10.1021/es103866b.
Bhatia, R. (2007). Protecting health using an environmental impact assessment: A case study of San Francisco land use decisionmaking. American Journal of Public Health 97(3): 406-413. doi:10.2105/AJPH.2005.073817.

Duncan et al: Space, race, and poverty: Spatial inequalities in walkable neighborhood amenities?
http://www.demographic-research.org 438
Bivand, R. (2011). Spdep: Spatial dependence: Weighting schemes, statistics and models. http://cran.r-project.org/web/packages/spdep/index.html.
Bivand, R.S., Pebesma, E.J., and Gómez-Rubio, V. (2008). Applied Spatial Data Analysis with R. New York, NY: Springer.
Block, J.P., Scribner, R.A., and DeSalvo, K.B. (2004). Fast food, race/ethnicity, and income: A geographic analysis. American Journal of Preventive Medicine 27(3): 211-217. doi:10.1016/j.amepre.2004.06.007
Brewer, C. and Harrower, M. (2012). Color Brewer 2.0. http://www.colorbrewer2.org.
Carr, L.J., Dunsiger, S.I., and Marcus, B.H. (2010). Walk score™ as a global estimate of neighborhood walkability. American Journal of Preventive Medicine 39(5): 460-463. doi:10.1016/j.amepre.2010.07.007.
Carr, L.J., Dunsiger, S.I., and Marcus, B.H. (2011). Validation of Walk Score for estimating access to walkable amenities. British Journal of Sports Medicine 45(14): 1144-1148. doi:10.1136/bjsm.2009.069609.
Castro, M.C. de (2007). Spatial demography: An opportunity to improve policy making at diverse decision levels. Population Research and Policy Review 26(5-6): 477-509. doi:10.1007/s11113-007-9041-x.
Chaix, B., Merlo, J., and Chauvin, P. (2005). Comparison of a spatial approach with the multilevel approach for investigating place effects on health: The example of healthcare utilisation in France. Journal of Epidemiology and Community Health 59(6): 517-526. doi:10.1136/jech.2004.025478.
Chaix, B., Merlo, J., Subramanian, S.V., Lynch, J., and Chauvin, P. (2005). Comparison of a spatial perspective with the multilevel analytical approach in neighborhood studies: The case of mental and behavioral disorders due to psychoactive substance use in Malmö, Sweden, 2001. American Journal of Epidemiology 162(2): 171-182. doi:10.1093/aje/kwi175.
Chang, V.W. (2006). Racial residential segregation and weight status among US adults. Social Science and Medicine 63(5): 1289-1303. doi:10.1016/j.socscimed.2006. 03.049.
Charles, C.Z. (2003). The dynamics of racial residential segregation. Annual Review of Sociology 29: 167-207. doi:10.1146/annurev.soc.29.010202.100002.
Chen, J.T., Rehkopf, D.H., Waterman, P.D., Subramanian, S.V., Coull, B.A., Cohen, B., Ostrem, M., and Krieger, N. (2006). Mapping and measuring social disparities in premature mortality: The impact of census tract poverty within and

Demographic Research: Volume 26, Article 17
http://www.demographic-research.org 439
across Boston neighborhoods, 1999-2001. Journal of Urban Health 83(6): 1063-1084. doi:10.1007/s11524-006-9089-7.
Chi, G. and Zhu, J. (2008). Spatial regression models for demographic analysis. Population Research and Policy Review 27(1): 17-42. doi:10.1007/s11113-007-9051-8.
City of Boston (2012). Boston: A City of Neighborhoods http://www.cityofboston. gov/neighborhoods/.
Clifford, P. and Richardson, S. (1985). Testing the association between two spatial processes. Statistics and Decisions 2(Supp. issue): 155-160.
Cohen, D.A., Inagami, S., and Finch, B. (2008). The built environment and collective efficacy. Health and Place 14(2): 198-208. doi:10.1016/j.healthplace.2007.06. 001.
Collins, C.A. and Williams, D.R. (1999). Segregation and mortality: The deadly effects of racism? Sociological Forum 14(3): 495-523. doi:10.1023/A:1021403820451.
Cortright, J. (2009). Walking the Walk: How walkability raises home values in U.S. cities [unpublished manuscript]. CEO for Cities. http://www.ceosforcities.org/ pagefiles/WalkingTheWalk_CEOsforCities.pdf.
Cradock, A.L., Kawachi, I., Colditz, G.A., Hannon, C., Melly, S.J., Wiecha, J.L., and Gortmaker, S.L. (2005). Playground safety and access in Boston neighborhoods. American Journal of Preventive Medicine 28(4): 357-363. doi:10.1016/j.amepre. 2005.01.012.
Dahmann, N., Wolch, J., Joassart-Marcelli, P., Reynolds, K., and Jerrett, M. (2010). The active city? Disparities in provision of urban public recreation resources. Health and Place 16(3): 431-445. doi:10.1016/j.healthplace.2009.11.005.
Dannenberg, A.L., Bhatia, R., Cole, B.L., Heaton, S.K., Feldman, J.D., and Rutt, C.D. (2008). Use of health impact assessment in the U.S.: 27 case studies, 1999-2007. American Journal of Preventive Medicine 34(3): 241-256. doi:10.1016/j. amepre.2007.11.015.
Dawkins, C.J. (2004). Recent evidence on the continuing causes of black-white residential segregation. Journal of Urban Affairs 26(3): 379-400. doi:10.1111/j.0735-2166.2004.00205.x.
de Toit, L., Cerin, E., Leslie, E., and Owen, N. (2007). Does walking in the neighborhood enhance local sociability? Urban Studies 44(9): 1677-1695. doi:10.1080/00420980701426665.
Duncan et al: Space, race, and poverty: Spatial inequalities in walkable neighborhood amenities?
http://www.demographic-research.org 440
Ding, D., Sallis, J.F., Kerr, J., Lee, S., and Rosenberg, D.E. (2011). Neighborhood environment and physical activity among youth: A review. American Journal of Preventive Medicine 41(4): 442-455. doi:10.1016/j.amepre.2011.06.036.
Drennen, E. (2003). Economic Effects of Traffic Calming on Urban Small Businesses [unpublished manuscript]. San Francisco State University. http://www.emilydrennen.org/TrafficCalming_full.pdf.
Duncan, D.T., Aldstadt, J., Whalen, J., and Melly, S.J. (in press). Validation of walk scores and transit scores for estimating neighborhood walkability and transit availability: A small-area analysis. GeoJournal doi:10.1007/s10708-011-9444-4.
Duncan, D.T., Aldstadt, J., Whalen, J., Melly, S.J., and Gortmaker, S.L. (2011). Validation of Walk Score® for Estimating Neighborhood Walkability: An Analysis of Four US Metropolitan Areas. International Journal of Environmental Research and Public Health 8(11): 4160-4179. doi:10.3390/ ijerph8114160.
Dunton, G.F., Kaplan, J., Wolch, J., Jerrett, M., and Reynolds, K.D. (2009). Physical environmental correlates of childhood obesity: A systematic review. Obesity Reviews 10(4): 393-402. doi:10.1111/j.1467-789X.2009.00572.x.
Estabrooks, P.A., Lee, R.E., and Gyurcsik, N.C. (2003). Resources for physical activity participation: Does availability and accessibility differ by neighborhood socioeconomic status? Annals of Behavioral Medicine 25(2): 100-104. doi:10.1207/S15324796ABM2502_05.
Feng, J., Glass, T.A., Curriero, F.C., Stewart, W.F., and Schwartz, B.S. (2010). The built environment and obesity: A systematic review of the epidemiologic evidence. Health and Place 16(2): 175-190. doi.org/10.1016/j.healthplace.2009. 09.008.
Fix, M. and Struyk, R.J. (1993). Clear and convincing evidence: Measurement of discrimination in America. Washington: Urban Institute Press.
Flegal, K.M., Carroll, M.D., Kit, B.K., and Ogden, C.L. (2012). Prevalence of obesity and trends in the distribution of body mass index among US adults, 1999-2010. Journal of the American Medical Association 307(5): 491-497. doi:10.1001/ jama.2012.39.
Franco, M., Diez Roux, A.V., Glass, T.A., Caballero, B., and Brancati, F.L. (2008). Neighborhood characteristics and availability of healthy foods in Baltimore. American Journal of Preventive Medicine 35(6): 561-567. doi:10.1016/j. amepre.2008.07.003.

Demographic Research: Volume 26, Article 17
http://www.demographic-research.org 441
Frank, A.I. (2003). Using measures of spatial autocorrelation to describe socio-economic and racial residential patterns in US urban areas. In: Kidner, D., Higgs, G., and White, S. (eds). Socio-economic applications of geographic information science (Innovations in GIS). London: Taylor & Francis: 147-162.
Front Seat (2011a). Walk Score Methodology. http://www.walkscore.com/ methodology.shtml.
Front Seat (2011b). Walk Score API. http://www.walkscore.com/professional/api.php.
Giles-Corti, B., Kelty, S.F., Zubrick, S.R., and Villanueva, K.P. (2009). Encouraging walking for transport and physical activity in children and adolescents: How important is the built environment? Sports Medicine 39(12): 995-1009. doi:10.2165/11319620-000000000-00000.
Glaeser, E.L. and Vigdor, J.L. (2001). Racial Segregation in the 2000 Census: Promising News. Washington, DC: Brookings Institution.
Google. (2011). Geolocation API. http://code.google.com/apis/gears/api_geolocation. html.
Gordon-Larsen, P., Nelson, M.C., Page, P., and Popkin, B.M. (2006). Inequality in the built environment underlies key health disparities in physical activity and obesity. Pediatrics 117(2): 417-424. doi:10.1542/peds.2005-0058.
Haining, R. (1991). Bivariate correlation with spatial data. Geographical Analysis 23(3): 210-227. doi:10.1111/j.1538-4632.1991.tb00235.x.
Hellig, A. and Sawicki, D.S. (2003). Race and residential accessibility to shopping and services. Housing Policy Debate 14(1-2): 69-101. doi:10.1080/10511482.2003. 9521469.
Iceland, J., Weinberg, D. H., and Steinmetz, E. (2002). Racial and Ethnic Residential Segregation in the United States: 1980-2000. Washington, DC: Government Printing Office. http://www.census.gov/hhes/www/housing/housing_patterns /pdf/censr-3.pdf.
Iceland, J. and Wilkes, R. (2006). Does socioeconomic status matter? Race, class, and residential segregation. Social Problems 53(2): 248-273. doi:10.1525/sp.2006. 53.2.248.
Kain, J.F. (1968). Housing segregation, negro employment, and metropolitan decentralization. Quarterly Journal of Economics 82(2): 175-197. doi:10.2307/1885893.
Duncan et al: Space, race, and poverty: Spatial inequalities in walkable neighborhood amenities?
http://www.demographic-research.org 442
Kelejian, H.H. and Prucha, I. (1999). A generalized moments estimator for the autoregressive parameter in a Spatial Model. International Economic Review 40(2): 509-533. doi:10.1111/1468-2354.00027.
Kershaw, K.N., Diez Roux, A.V., Burgard, S.A., Lisabeth, L.D., Mujahid, M.S., and Schulz, A.J. (2011). Metropolitan-level racial residential segregation and black-white disparities in hypertension. American Journal of Epidemiology 174(5): 537-545. doi:10.1093/aje/kwr116.
Kim, D. (2008). Blues from the neighborhood? Neighborhood characteristics and depression. Epidemiologic Reviews 30(1): 101-117. doi:10.1093/epirev/mxn009.
Kramer, M.R. and Hogue, C.R. (2009). Is segregation bad for your health? Epidemiologic Reviews 31(1): 178-194. doi:10.1093/epirev/mxp001.
Krieger, N., Chen, J.T., Waterman, P.D., Rehkopf, D.H., and H Subramanian, S.V. (2003). Race/ethnicity, gender, and monitoring socioeconomic gradients in health: A comparison of area-based socioeconomic measures—the Public Health Disparities Geocoding Project. American Journal of Public Health 93(10): 1655-1671. doi:10.2105/AJPH.93.10.1655.
Krieger, N., Chen, J.T., Waterman, P.D., Soobader, M.J., Subramanian, S.V., and Carson, R. (2002). Geocoding and monitoring of US socioeconomic inequalities in mortality and cancer incidence: Does the choice of area-based measure and geographic level matter? The Public Health Disparities Geocoding Project. American Journal of Epidemiology 156(5): 471-482. doi:10.1093/aje/kwf068.
Kwate, N.O.A., Loh, J., White, K., and Saldana, N.T. (in press). Retail redlining in New York City: Racialized access to day-to-day retail resources. Journal of Urban Health.
LeSage, J. and Pace, K.R. (2009). Introduction to Spatial Econometrics. Boca Raton, FL: CRC Press. doi:10.1201/9781420064254.
Leyden, K.M. (2003). Social capital and the built environment: The importance of walkable neighborhoods. American Journal of Public Health 93(9): 1546-1551. doi:10.2105/AJPH.93.9.1546.
Li, W., Land, T., Zhang, Z., Keithly, L., and Kelsey, J.L. (2009). Small-area estimation and prioritizing communities for tobacco control efforts in Massachusetts. American Journal of Public Health 99(3): 470-479. doi.:10.2105/AJPH.2007. 130112.

Demographic Research: Volume 26, Article 17
http://www.demographic-research.org 443
Li, W., Kelsey, J.L., Zhang, Z., Lemon, S.C., Mezgebu, S., Boddie-Willis, C., and Reed, G.W. (2009). Small-area estimation and prioritizing communities for obesity control in Massachusetts. American Journal of Public Health 99(3): 511-519. doi:10.2105/AJPH.2008.137364.
Litman, T. (2003), Economic Value of Walkability. Victory Transportation Policy Institute. www.vtpi.org/walkability.pdf
Lo, R.H. (2009). Walkability: What is it? Journal of Urbanism 2(2): 145-166. doi:10.1080/17549170903092867.
Lobao, L.M., Hooks, G., and Tickamyer, A.R. (eds). (2007). The Sociology of Spatial Inequality. Albany, NY: SUNY Press Albany.
Local Government Commission (2012). The Economic Benefits of Walkable Communities. http://www.lgc.org/freepub/docs/community_design/focus/walk_ to_money.pdf.
Logan, J.R. and Stults, B. (2011). The Persistence of Segregation in the Metropolis: New Findings from the 2010 Census. Census Brief prepared for Project US2010. http://www.s4.brown.edu/us2010.
Lopez, R. (2006). Black-White residential segregation and physical activity. Ethnicity and Disease 16(2): 495-502.
Lovasi, G.S., Hutson, M.A., Guerra, M., and Neckerman, K.M. (2009). Built environments and obesity in disadvantaged populations. Epidemiologic Reviews 31(1): 7-20. doi:10.1093/epirev/mxp005.
Marshall, J.D., Brauer, M., and Frank, L.D. (2009). Healthy neighborhoods: Walkability and air pollution. Environmental Health Perspectives. 117(11): 1752-1759. doi:10.1289/ehp.0900595.
Massey, D.S. and Denton, N.A. (1993). American Apartheid: Segregation and the Making of the Underclass. Cambridge, MA: Harvard University Press.
McKenzie, R.D. (1923). The Neighborhood: A Study of Local Life in the City of Columbus, Ohio. Chicago IL: The University of Chicago Press.
Moore, L.V. and Diez Roux, A.V. (2006). Associations of neighborhood characteristics with the location and type of food stores. American Journal of Public Health 96(2): 325-331. doi:10.2105/AJPH.2004.058040.
Moore, L.V., Diez Roux, A.V., Evenson, K.R., McGinn, A.P., and Brines, S.J. (2008). Availability of recreational resources in minority and low socioeconomic status
Duncan et al: Space, race, and poverty: Spatial inequalities in walkable neighborhood amenities?
http://www.demographic-research.org 444
areas. American Journal of Preventive Medicine 34(1): 16-22. doi:10.1016/ j.amepre.2007.09.021.
Morland, K. and Filomena, S. (2007). Disparities in the availability of fruits and vegetables between racially segregated urban neighbourhoods. Public Health Nutrition 10(12): 1481-1489. doi:10.1017/S1368980007000079.
Morland, K., Wing, S., Diez Roux, A.V., and Poole, C. (2002). Neighborhood characteristics associated with the location of food stores and food service places. American Journal of Preventive Medicine 22(1): 23-29. doi:10.1016/ S0749-3797(01)00403-2.
Ogden, C.L., Carroll, M.D., Kit, B.K., and Flegal, K.M. (2012). Prevalence of obesity and trends in body mass index among US children and adolescents, 1999-2010. Journal of the American Medical Association. 307(5): 483-490. doi:10.1001/ jama.2012.40.
Openshaw, S. and Taylor, P. (1979). A million or so correlation coefficients: Three experiments on the modifiable area unit problem. In: Wrigley, N. (ed.). Statistical Applications in the Spatial Sciences. London, UK: Pion Ltd: 127-144.
Pace, K.R. and LeSage, J.P. (2008). A spatial Hausman test. Economic Letters 101(3): 282-284. doi:10.1016/j.econlet.2008.09.003.
Pivo, G. and Fisher, J.D. (2011). The walkability premium in commercial real estate investments. Real Estate Economics 39(2): 185-219. doi:10.1111/j.1540-6229.2010.00296.x.
Powell, L.M., Slater, S., Chaloupka, F.J., and Harper, D. (2006). Availability of physical activity-related facilities and neighborhood demographic and socioeconomic characteristics: A national study. American Journal of Public Health 96(9): 1676-1680. doi:10.2105/AJPH.2005.065573.
Powell, L.M., Slater, S., Mirtcheva, D., Bao, Y., and Chaloupka, F.J. (2007). Food store availability and neighborhood characteristics in the United States. Preventive Medicine 44(3): 189-195. doi:10.1016/j.ypmed.2006.08.008.
Reardon, S.F. (2006). A conceptual framework for measuring segregation and its association with population outcomes. In: Oakes, J.M. and Kaufman, J.S. (eds.). Methods in Social Epidemiology. San Francisco: Jossey-Bass: 169-192.
Reynolds, H. and Amrhein, C. (1997). Using a spatial data set generator in an empirical analysis of aggregation effects on univariate statistics. Geographical and Environmental Modelling 1: 199-220.
Demographic Research: Volume 26, Article 17
http://www.demographic-research.org 445
Rogers, S.H., Halstead, J..M., Gardner, K.H., and Carlson, C.H. (2011). Examining walkability and social capital as indicators of quality of life at the municipal and neighborhood scales. Applied Research in Quality of Life 6(2): 201-213. doi:10.1007/s11482-010-9132-4.
Rothwell, J.T. (2011). Racial Enclaves and Density Zoning: The institutionalized segregation of racial minorities in the United States. American Law and Economics Review 13(1): 290-358. doi:10.1093/aler/ahq015.
Saelens, B.E. and Handy, S.L. (2008) Built environment correlates of walking: A review. Medicine and Science in Sports and Exercise 40(7): S550-S566. doi:10.1249/MSS.0b013e31817c67a4.
Saelens, B.E. and Papadopoulos, C. (2008). The importance of the built environment in older adults’ physical activity: A review of the literature. Washington State Journal of Public Health Practice 1(1): 13-21.
Setton, E., Marshall, J.D., Brauer, M., Lundquist, K.R., Hystad, P., Keller, P., and Cloutier-Fisher, D. (2011). The impact of daily mobility on exposure to traffic-related air pollution and health effect estimates. Journal of Exposure Science and Environmental Epidemiology 21(1): 42-48.doi:10.1038/jes.2010.14.
Sharkey, J.R., Horel, S., Han, D., and Huber, J.C. (2009). Association between neighborhood need and spatial access to food stores and fast food restaurants in neighborhoods of colonias. International Journal of Health Geographics 8: 9. doi:10.1186/1476-072X-8-9.
Small, M.L. and McDermott, M. (2006). The presence of organizational resources in poor urban neighborhoods: An analysis of average and contextual effects. Social Forces 84(3): 1697-1724. doi:10.1353/sof.2006.0067.
Smiley, M.J., Diez Roux, A.V., Brines, S.J., Brown, D.G., Evenson, K.R., and Rodriguez, D.A. (2010). A spatial analysis of health-related resources in three diverse metropolitan areas. Health and Place. 16(5): 885-892. doi:10.1016/j. healthplace.2010.04.014.
“Student” (1914). The elimination of spurious correlation due to position in time or space. Biometrika 10(1): 179-180.
Subramanian, S.V., Chen, J.T., Rehkopf, D.H., Waterman, P.D., and Krieger, N. (2005). Racial disparities in context: A multilevel analysis of neighborhood variations in poverty and excess mortality among black populations in Massachusetts. American Journal of Public Health 95(2): 260-265. doi:10.2105/AJPH.2003.034132.
Duncan et al: Space, race, and poverty: Spatial inequalities in walkable neighborhood amenities?
http://www.demographic-research.org 446
Subramanian, S.V., Chen, J.T., Rehkopf, D.H., Waterman, P.D., and Krieger, N. (2006). Comparing individual- and area-based socioeconomic measures for the surveillance of health disparities: A multilevel analysis of Massachusetts births, 1989-1991. American Journal of Epidemiology 164(9): 823-834. doi:10.1093/aje/kwj313.
Talen, E. (1997). The social equity of urban service distribution: An exploration of park access in Pueblo, Colorado, and Macon, Georgia. Urban Geography 18(6): 521-541. doi:10.2747/0272-3638.18.6.521.
Talen, E. and Anselin, L. (1998). Assessing spatial equity: An evaluation of measures of accessibility to public playgrounds. Environment and Planning 30(4): 595-613. doi:10.1068/a300595.
Tobler, W.R. (1970). A computer movie simulating urban growth in the Detroit region. Economic Geography. 46(2): 234-240. doi:10.2307/143141.
Truong, K.D. and Ma, S. (2006). A systematic review of relations between neighborhoods and mental health. Journal of Mental Health Policy and Economics 9(3): 137-154.
U.S. Census Bureau (2010). http://2010.census.gov/2010census.
U.S. Census Bureau (2012). Decennial Management Division Glossary. http://www. census.gov/dmd/www/glossary.html.
Voss, P.V. (2007). Demography as a Spatial Social Science. Population Research and Policy Review 26(5-6): 457-476. doi:10.1007/s11113-007-9047-4.
Waller, L.A. and Gotway, C.A. (2004). Applied Spatial Statistics for Public Health Data. Hoboken NJ: Wiley-Interscience. doi:10.1002/0471662682.
Ward, M.D. and Gleditsch, K.S. (2008). Spatial Regression Models. Thousand Oaks, CA: Sage Publications, Inc.
Weeks, J. (2004). The role of spatial analysis in demographic research. In: Goodchild, M.F. and Janelle, D.G. (eds.). Spatially Integrated Social Science. New York, NY: Oxford University Press: 381-399.
White, K. and Borrell, L.N. (2011). Racial/ethnic residential segregation: Framing the context of health risk and health disparities. Health and Place 17(2): 438-448. doi:10.1016/j.healthplace.2010.12.002.
Williams, D.R. and Collins, C. (2001). Racial residential segregation: A fundamental cause of racial disparities in health. Public Health Reports 116(5): 404-416.

Demographic Research: Volume 26, Article 17
http://www.demographic-research.org 447
Williams, D.R. and Marks, J. (2011). Community development efforts offer a major opportunity to advance Americans' health. Health Affairs (Millwood) 30(11): 2052-2055. doi:10.1377/hlthaff.2011.0987.
Wong, D. (2009). The Modifiable Areal Unit Problem (MAUP). In: Fotheringham, A.S. and Rogerson, P.A. (eds.). The SAGE Handbook of Spatial Analysis. London: SAGE Publications: 105-124.
Zenk, S.N., Schulz, A.J., Israel, B.A., James, S.A., Bao, S., and Wilson, M.L. (2005). Neighborhood racial composition, neighborhood poverty, and the spatial access of supermarkets in metropolitan Detroit. American Journal of Public Health 95(4): 660-667. doi:10.2105/AJPH.2004.042150.

Duncan et al: Space, race, and poverty: Spatial inequalities in walkable neighborhood amenities?
http://www.demographic-research.org 448