sparebanken pluss · · 2014-01-27consumption growth was relatively low compared to previous...
TRANSCRIPT

Sparebanken Pluss
Annual report 2012(This translation from Norwegian has been
made for information purposes only)
THE BANK FOR SØRLANDET
ANNUAL REPORT 2012 FOR SPAREBANKEN PLUSS
ECONOMIC FRAMEWORK CONDITIONS 2012Economic growth was again negative for the Euro area in 2012. In order to deal with growing public debt, several countries in the Euro area conducted a tightening of their fiscal policy, which hampered their economic production. The American economy showed a moderate growth in 2012, against a backdrop of uncertainty concerning how a growing public debt should be handled. Weakened economic growth was also seen in many emerging economies during 2012. Nevertheless, the contributions from growth countries meant that the world economy retained a growth rate of around 3 per cent.
Despite the weakened global economy, the Norwegian economy continued to develop positively in 2012. Mainland growth increased from 2.5 per cent to 3.5 per cent during the year, with the delivery industry that supplies the oil sector contributing in particular to output growth. Companies with different export activities were increasingly affected by weaker demand from Europe, the strong Norwegian krone and high costs. These negative effects increased during the course of 2012.
In 2012, Norwegian households could enjoy low interest rates, good wage settlement and low unemployment. At the same time, demand for consumer goods from Norwegian trade and service was stable. Consumption growth was relatively low compared to previous periods where consumers saw real wage growth. Norwegian households are now saving considerably more than they were before the financial crisis. The savings rate accounts for 8-9 per cent of disposable income.
House prices rose by almost 8 per cent in 2012, down from 9 per cent the previous year. High real wage growth, a strong labour market and large work immigration, in combination with relatively low housing production, contributed to a further growth in the house prices.
Core inflation was also low in 2012. The domestic core inflation was 2 per cent, up from 1.4 per cent the year before. Lower prices for imported goods, combined with the strong Norwegian krone, contributed to the inflation figure remaining low.
Growth in household debt was 7.2 per cent, and therefore exceeded income growth in 2012. The Norwegian government has set a goal of curbing credit growth for the household sector, among other things, to regulate the lending activities of banks in different ways.
At the beginning of 2012, the European Central Bank (ECB) introduced a loan scheme that gave European banks unlimited access to three-year loans at an interest rate of 1 per cent. This gave great impetus to the banks, and also contributed to a transitional phase in which government bond yields were pushed down following banks’ investments in government bonds. In addition, the EU’s Central Bank Governor announced in July that the ECB was ready to implement the necessary measures to stabilise the Euro zone. In the autumn, the ECB said it was prepared to contribute to the short-term refinancing of debt-ridden Euro zone countries, provided that the countries conformed to the regulations for receiving emergency loans from the IMF, with the consequences this would entail for the individual country’s autonomy. The EU’s permanent crisis fund was put in place in October and the ECB took over the supervision of several large banks in December.
In the United States, the Federal Reserve continued its expansive monetary policy in 2012. During the year, the Federal Reserve gave increasingly clear signals that the policy key rate would be kept low for a long time, even after economic growth had begun to pick up. A bond-purchase programme to help the situation in the housing market was also introduced in 2012. The reason for the expansive monetary policy was the need for fiscal tightening, which all political parties in Congress agreed to implement. Even so, the dosage between cuts in public spending and tax increases contributed to the political conflicts and financial turmoil seen in the United States during 2012.
In 2012, economic growth in China fell to its lowest point in more than 10 years, with weaker demand for Chinese goods an important factor in this. Domestic demand and consumption kept themselves up, partly as a result of low unemployment.
2012 was a turbulent year in the currency markets. The negative economic growth for the Euro zone meant that the Euro weakened significantly against foreign currencies. As a consequence of the reduced appetite for risk in the markets, there was a search for safe investments which led to supposedly safe currencies strengthening themselves considerably. The ECB’s implementation of its money market measures was an important contributor to the development of the currency markets in 2012.
It was also a turbulent 2012 for the stock markets. International the stock markets were dominated by both US economic policy and the presidential election, slowing economic growth in Asia and not least the crisis in the Euro zone. Greater uncertainty about how politicians would handle the crisis in Europe had a negative effect on the interest of equity investments. Investments were increasingly found to be placed in asset classes other than equities, and trading activity in the stock market went down. Nevertheless, the main index of the Oslo Stock Exchange still rose by 15.4 per cent in 2012.
BUSINESS AREA AND MARKET Sparebanken Pluss provides services within the areas of financing, savings and placements, insurance and payment transmission.
The bank’s vision states, among other things, the following:Sparebanken Pluss should be ‘The Bank for Sørlandet; a leading, strong and independent bank with Sørlandet (the area along the southern coast and immediate inland districts of Norway, including Vest- and Aust-Agder) as its main market.
The bank has its headquarters in Kristiansand and has a total of 14 offices: 10 in Vest – Agder and four in Aust – Agder. The office in Øvrebø was closed down in July after a fire destroyed the building in which the bank was based. Customers are now serviced from an office in the centre of Vennesla. Over the past eight years, the bank has opened six new branches in Arendal, Grimstad, Lillesand, Søgne, Kvinesdal and Flekkefjord.
The new branches have provided a large number of new customers and have been very important for the bank’s overall growth in recent years. Over NOK 6.4 billion, or 18.2 per cent of the Bank’s total loans, can be attributed to these newly established offices.
1

Sparebanken Pluss has three branches in Kristiansand, and is the only bank with more than one branch in the town.
Competition in the banking market in Sørlandet is very strong, which applies to both the retail and corporate markets. Indeed, several of the Norwegian and Nordic banks have been present for several years, while Sørlandet still has a number of smaller local savings banks.
The bank’s total loans of NOK 36 billion are split by 62 per cent in the retail market and 38 per cent in corporate and organisations markets. Of the lending made to retail customers, nearly 47 per cent is transferred to Pluss Boligkreditt A/S - the bank’s wholly owned mortgage company.
The total increase in loans in 2012 was 7.3 per cent. This breaks down to 8 per cent in retail markets and 7 per cent for the corporate - and organisations markets.
In 2012, loans, both absolutely and relatively, have increased most in the bank’s main market; - Sørlandet. The proportion of loans outside the bank’s main market represents NOK 6.8 billion or 19 per cent of total volume. Most of this volume can be linked to the bank’s agreement with the Christian organisation” Norway Christian Purchasing Society” (KNIF), otherwise it is principally expatriate”Sørlendinger”. Most of these customers are located in Oslo, Stavanger, Bergen and Trondheim.
For the past two years, the bank’s deposits have increased significantly. In 2012, the increase was 26.7 per cent, distributed with an increase of 12.7 per cent in the retail markets and 37.3 per cent in the corporate markets. This is due, not least, to the bank having established a separate deposit centre in 2012. In addition, a deposit responsibility was set up in the offices outside the main office. An increased focus on deposits is expected to provide additional deposit growth and an improvement of the bank’s deposit ratio in the years to come.
The bank has an agreement with Tennant Insurance for the delivery of injury - and personal insurance. Tennant is a part of Gjensidige Forsikring.
Sparebanken Pluss has agreements with three suppliers to sell their equity funds: Skagen Fondene, DnB Asset Management and Odin Forvaltning. In 2012, sales to the bank’s customers were fairly low.
Since 2007, Sørlandet Boligbyggelag and Sparebanken Pluss have collaborated on an estate agency business, and both have 20 per cent of the shares in Plussmegleren Holding AS. The remaining shares are owned by six brokers, who have 10 per cent each. Plussmegleren has three offices – respectively in Kristiansand, Vennesla and Mandal. The office in Mandal was opened at the beginning of 2013.
OPERATING RESULTIn 2012, Sparebanken Pluss (Group) had a NOK 403 million profit after losses on loans, as against NOK 281 million in 2011. This is equivalent to 0.97 per cent of average assets, as against 0.73 per cent last year.
The Group’s net interest income totalled NOK 551 million, against NOK 479 million the year before. As a per cent of average assets, the net interest amounted to 1.32 per cent, against 1.24 in 2011.
Other operating income amounted to NOK 124 million, an increase of NOK 66 million when compared to 2011. The increase is mainly due to fluctuations in the item ‘Net value change and gains on foreign exchange and securities.’ The item principally considers fluctuations in the liquidity
portfolio of bonds, and fair value adjustments of fixed-rate loans. Total operating expenses amounted to NOK 251 million, up by NOK 15 million in comparison to 2011. Costs as a percentage of average assets totalled 0.60 per cent, against 0.61 per cent a year ago.
Costs as a percentage of income was at the end of 2012 37.1 per cent, against 43.9 a year ago.
LOSSES ON LOANS AND COMMITMENTS IN DEFAULTIn 2012, the Group ended up with a gross loss cost of NOK 26 million. Recoveries relating to previous losses totalled NOK 2 million. In addition, there was an input of a warranty relating to Export Finance, so that net losses in 2012 were NOK 21 million.
Write-downs of groups of loans at the end of the year totalled NOK 92 million, equivalent to 0.26 per cent of gross lending. Given the composition of the loan portfolio that the bank has in different industries, and the risks contained in the portfolio, the Board considers that write-downs are at a satisfactory level, and are sufficient to cover the credit risk in the bank’s loan portfolio.
Throughout 2012, there has been a major reduction in gross defaults over 30 days from NOK 204 million to NOK 134 million. The proportion of defaults over 90 days has been reduced from NOK 125 million to NOK 116 million. The relationship between gross defaults of 90 days and gross lending therefore constitutes 0.46 per cent for the parent bank and 0.32 per cent for the group, while the corresponding figures for 2011 were 0.53 per cent and 0.38 per cent respectively. The level of non-performing loans over 90 days is considered very low.
The Bank has had very low loss charges on loans for many years, a trend which was also applicable during the period of financial crisis in 2008 and 2009. Based on experience, local market conditions and the composition of the existing portfolio, combined with the present economic situation, it is expected that the bank’s net losses for 2013 will be at approximately the same level as they were for 2012. For the period 2014-2017, it is an aim to maintain the Bank’s total loss level on loans at well below 0.25 per cent of gross loans.
ALLOCATION OF PROFIT FOR THE YEARThe net income for 2012, after tax charge of NOK 113 million, amounted to NOK 290 million for the Group. Profit after tax in 2011 was NOK 195 million.
The profit for the Parent Bank in 2012 was NOK 244 million.
The Board of Directors proposes that Sparebanken Pluss’s NOK 244 million profit for the year is allocated as follows: (NOK 1000)Dividend of NOK 10,00 per EC 12 500Transferred to the Dividend Equalisation Fund 6 580Transferred to the Donation Fund 15 000Transferred to the Savings Bank’s Fund 209 739
With reference to Law of Annual Financial Statements etc., paragraph 3-3, the Bank’s Board of Directors confirms that the assumption of a going concern still applies, and that the annual report and accounts have been prepared on the basis of this assumption. The Group does not engage in research and development activities
2
ASSETSAt the end of 2012, total assets were NOK 44,122 million. Compared to the same period at the end of 2011, this is an increase of NOK 3,611 million or 8.9 per cent.
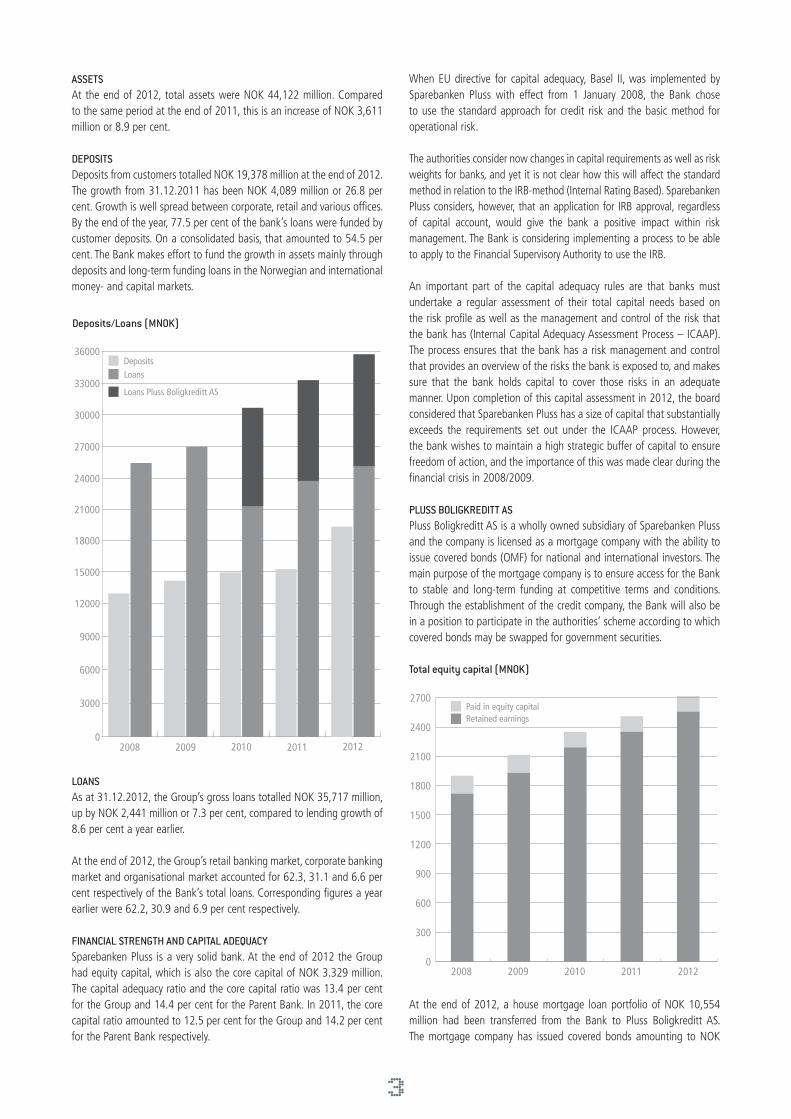
DEPOSITS Deposits from customers totalled NOK 19,378 million at the end of 2012. The growth from 31.12.2011 has been NOK 4,089 million or 26.8 per cent. Growth is well spread between corporate, retail and various offices. By the end of the year, 77.5 per cent of the bank’s loans were funded by customer deposits. On a consolidated basis, that amounted to 54.5 per cent. The Bank makes effort to fund the growth in assets mainly through deposits and long-term funding loans in the Norwegian and international money- and capital markets.
LOANS As at 31.12.2012, the Group’s gross loans totalled NOK 35,717 million, up by NOK 2,441 million or 7.3 per cent, compared to lending growth of 8.6 per cent a year earlier. At the end of 2012, the Group’s retail banking market, corporate banking market and organisational market accounted for 62.3, 31.1 and 6.6 per cent respectively of the Bank’s total loans. Corresponding figures a year earlier were 62.2, 30.9 and 6.9 per cent respectively.
FINANCIAL STRENGTH AND CAPITAL ADEQUACY Sparebanken Pluss is a very solid bank. At the end of 2012 the Group had equity capital, which is also the core capital of NOK 3.329 million. The capital adequacy ratio and the core capital ratio was 13.4 per cent for the Group and 14.4 per cent for the Parent Bank. In 2011, the core capital ratio amounted to 12.5 per cent for the Group and 14.2 per cent for the Parent Bank respectively.
When EU directive for capital adequacy, Basel II, was implemented by Sparebanken Pluss with effect from 1 January 2008, the Bank chose to use the standard approach for credit risk and the basic method for operational risk.
The authorities consider now changes in capital requirements as well as risk weights for banks, and yet it is not clear how this will affect the standard method in relation to the IRB-method (Internal Rating Based). Sparebanken Pluss considers, however, that an application for IRB approval, regardless of capital account, would give the bank a positive impact within risk management. The Bank is considering implementing a process to be able to apply to the Financial Supervisory Authority to use the IRB.
An important part of the capital adequacy rules are that banks must undertake a regular assessment of their total capital needs based on the risk profile as well as the management and control of the risk that the bank has (Internal Capital Adequacy Assessment Process – ICAAP). The process ensures that the bank has a risk management and control that provides an overview of the risks the bank is exposed to, and makes sure that the bank holds capital to cover those risks in an adequate manner. Upon completion of this capital assessment in 2012, the board considered that Sparebanken Pluss has a size of capital that substantially exceeds the requirements set out under the ICAAP process. However, the bank wishes to maintain a high strategic buffer of capital to ensure freedom of action, and the importance of this was made clear during the financial crisis in 2008/2009.
PLUSS BOLIGKREDITT ASPluss Boligkreditt AS is a wholly owned subsidiary of Sparebanken Pluss and the company is licensed as a mortgage company with the ability to issue covered bonds (OMF) for national and international investors. The main purpose of the mortgage company is to ensure access for the Bank to stable and long-term funding at competitive terms and conditions. Through the establishment of the credit company, the Bank will also be in a position to participate in the authorities’ scheme according to which covered bonds may be swapped for government securities.
At the end of 2012, a house mortgage loan portfolio of NOK 10,554 million had been transferred from the Bank to Pluss Boligkreditt AS. The mortgage company has issued covered bonds amounting to NOK
3
2008 2009 2010 2011 2012
15000
12000
6000
9000
3000
0
18000
Brutto utlån morbank
Brutto utlån Pluss Boligkreditt AS
Innskudd
21000
24000
27000
30000
33000
36000
Deposits/Loans (MNOK)
DepositsLoans
Loans Pluss Boligkreditt AS
Total equity capital (MNOK)
Opptjent egenkapitalEierandelskapital
1200
900
600
300
02008 2009 2010 2011 2012
1500
1800
2100
2400
2700Paid in equity capitalRetained earnings
9,400 million. By issuing covered bonds, NOK 4.152 million was used as collateral in swap arrangements with the government.
EQUITY CERTIFICATES A summary of the 20 largest equity certificate owners as of 31.12.2012 is included in note 26. The result per equity certificate was NOK 15.26, as against NOK 11.53 at the same time last year. For the Group, the figures were NOK 18.16 and NOK 12.67 respectively. The Board of Directors will propose to the Bank’s Board of Trustees payment of a dividend for 2012 of NOK 10.00 per equity certificate.
At the end of 2012, after tax return on equity capital was 10.7 per cent, compared with 7.8 per cent at the end of 2011.
RISK AND INTERNAL CONTROLRisk is a fundamental aspect of banking business, and risk management and -control represents a key area of the Bank’s day-to-day operations and follow-up by the Board of Directors.
The Bank’s risk management and internal control shall help to ensure that the Bank’s risk is managed in a way which supports the Bank’s strategic targets, contributing to the Bank’s long-term wealth creation. The overall framework of the Bank’s risk management and -exposure is assessed and agreed annually by the Board of Directors in connection with the maintenance of the Bank’s internal strategy- and policy documents. The Board of Directors fixes concrete targets and limits for the Bank’s credit risk, market risk and funding risk, as well as powers of attorney and a structure for follow-up and control. The Bank’s aim is to have a low level of risk exposure, and there is a continual process aimed at further developing and improving the Bank’s risk management.
The most significant risk factors can be classified as financial risk, operational risk, plus strategic and business risk. Financial risk comprises credit risk, market risk (relating to the Bank’s exposure in the interest rate-, foreign exchange- and stock markets) and funding risk. Operational risk is defined as the risk of loss which may be incurred due to insufficient or failing internal processes, systems or external events. Strategic risk is related to the strategies, plans and changes which the Bank has or is planning to have in connection with its marketing efforts, while business risk includes reputation risk.
The Bank has an ongoing process relating to the monitoring and assessment of the different risk factors. Against the background of rules and regulations for risk management and internal control, all main areas have been subject to the completion of internal control confirmation, and an overall risk assessment has also been done. The Bank has a separate risk management committee. In the Board of Directors’ opinion, the Bank’s risk management is satisfactory.
Credit riskCredit risk represents the most significant area of risk in the Bank, and is defined as the risk of loss as a result of customers or counterparts failing to meet their obligations to the Bank. As a consequence of this, all work involving credit risk is therefore given high priority in day-to-day operations and as far as follow-up by the Board of Directors is concerned. The Board of Directors agrees the Bank’s credit strategy and credit policy, and credit risk is also managed through credit routines, credit processes and delegated lending authority. The board has set goals and direction statements, as well as quantitative frameworks, that specify the constraints and objectives of risk tolerance. Compliance with the
Bank’s credit policy is monitored by a unit which is independent of the customer-related departments.
The Bank’s customers with credit commitments are classified through the Bank’s own risk classification system, where customers are classified in default classes where the likelihood of default during a 12-month period is calculated on the basis of different internal and external financial data. The portfolio is divided into 10 different risk classes in addition to 2 classes for commitments in default and commitments with loss write-downs which are not in default. Risk development in the portfolio is registered through the classification system.
Market riskMarket risk arises from open positions in currency-, interest- and equity instruments. The risk is tied to the loss of earnings resulting from fluctuations in market prices and exchange rates.
The Board sets the limits for the Bank’s market risk and also the requirements for reporting form and frequency. To ensure that the Bank’s ordinary operations are not be affected by the impact of fluctuations in market prices, limits are stipulated; these are measured as the expected negative effect of equity-, interest-, credit - and currency instruments.
In 2012, the Bank’s market position was within the approved guidelines.
Liquidity riskThe Bank’s lending operations will be funded long-term. For measurement, management and control of liquidity risk, there are established targets for the indicator values that measure the relationship between long-term and non-liquid assets, of which loans constitute a significant part. The composition and objective requirements of indicator values follow guidelines set by the Financial Supervisory Authority under risk-based supervision. At the end of the year, the indicator values for Sparebanken Pluss were within the standards adopted by the Board, and in line with the corresponding average figure for reference banks, which the Financial Supervisory Authority provided separately. The Bank’s liquidity reserves in the form of undrawn borrowing facilities in Norges Bank and the holding of liquid securities was significant at the year’s end, both in absolute size and set in relation to the Bank’s refinancing needs. In addition, the Bank had a significant buffer of mortgages that were ready to be transferred to Pluss Boligkreditt AS.
In its adaptation, the Bank has also taken into account and reported to the FSA under the new requirements for liquidity management (LCR and NSRF) that banks will be required to comply with in a specified time frame.
Operational riskOperational risk is the risk of losses from various sources of potential losses, related to the ongoing operations of the Bank. This may result from inadequate or failed internal procedures and processes, human error or inadequate expertise, failure of EDP systems, crime or internal fraud, error from subcontractors, etc.
The Bank has routines which cover all significant areas, and the internal control is an important help in order to reduce operational risk, both as far as the revealing of risk and follow-up are concerned.
The Bank’s security systems are maintained and periodically tested throughout the year.
4
INTERNATIONAL RATINGIn order to expand the possibilities for funding both internationally and from various investors, the bank has an international rating from Moody’s, one of the world’s most recognised ratings agencies. In addition to the fact that the rating outcome will show a value for the bank, the Board considers that the actual rating process and maintenance of the rating has a value for the bank in terms of improving the quality of various processes and procedures.
In 2012, Moody’s put the ratings of several banks as “Under Review”, which resulted in lowered ratings for some of Norway’s regional banks. Sparebanken Pluss was not among the banks that were reassessed, and Moody’s has upheld the bank’s good rating, which is expressed as a long-term rating of A2 and short-term “Issuer” rating of Prime-1. The rating has “Stable outlook”.
Covered bonds issued by Pluss Boligkreditt AS are also rated by Moody’s, and these bonds have the highest possible rating of Aaa.
ORGANISATIONThe Bank has a good working environment, and the systems and procedures are in accordance with the requirements of ‘Regulations on Health, Safety and Security.’
The Bank’s operations do not cause any pollution of the external environment.
Equality between the sexes – equal opportunitiesSparebanken Pluss’s goal is to have a relatively even distribution of men and women at all staff levels.
At the present time, the ratio of women among the Bank’s managers and professional experts is 31 per cent.
In the case of the Bank’s staff (excluding General Managers), the salary index for men is 111 and for women 91.
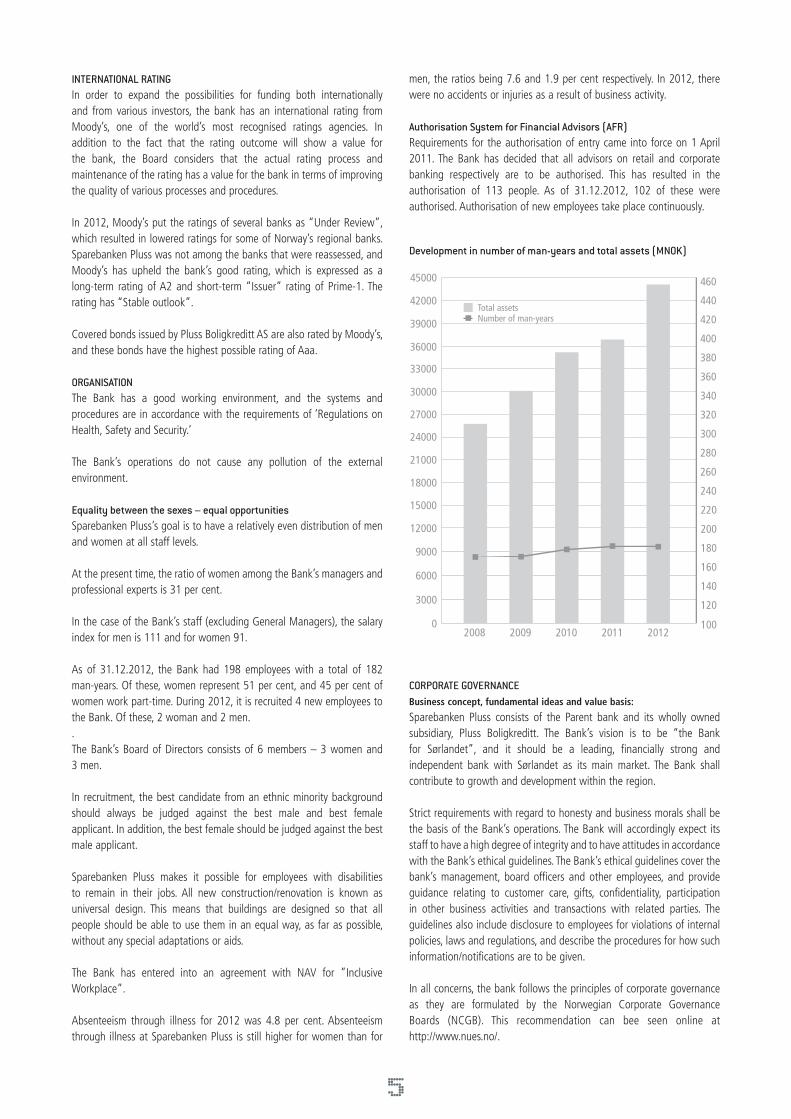
As of 31.12.2012, the Bank had 198 employees with a total of 182 man-years. Of these, women represent 51 per cent, and 45 per cent of women work part-time. During 2012, it is recruited 4 new employees to the Bank. Of these, 2 woman and 2 men..The Bank’s Board of Directors consists of 6 members – 3 women and 3 men.
In recruitment, the best candidate from an ethnic minority background should always be judged against the best male and best female applicant. In addition, the best female should be judged against the best male applicant.
Sparebanken Pluss makes it possible for employees with disabilities to remain in their jobs. All new construction/renovation is known as universal design. This means that buildings are designed so that all people should be able to use them in an equal way, as far as possible, without any special adaptations or aids.
The Bank has entered into an agreement with NAV for ”Inclusive Workplace”.
Absenteeism through illness for 2012 was 4.8 per cent. Absenteeism through illness at Sparebanken Pluss is still higher for women than for
men, the ratios being 7.6 and 1.9 per cent respectively. In 2012, there were no accidents or injuries as a result of business activity.
Authorisation System for Financial Advisors (AFR)Requirements for the authorisation of entry came into force on 1 April 2011. The Bank has decided that all advisors on retail and corporate banking respectively are to be authorised. This has resulted in the authorisation of 113 people. As of 31.12.2012, 102 of these were authorised. Authorisation of new employees take place continuously.
CORPORATE GOVERNANCEBusiness concept, fundamental ideas and value basis:
Sparebanken Pluss consists of the Parent bank and its wholly owned subsidiary, Pluss Boligkreditt. The Bank’s vision is to be “the Bank for Sørlandet”, and it should be a leading, financially strong and independent bank with Sørlandet as its main market. The Bank shall contribute to growth and development within the region.
Strict requirements with regard to honesty and business morals shall be the basis of the Bank’s operations. The Bank will accordingly expect its staff to have a high degree of integrity and to have attitudes in accordance with the Bank’s ethical guidelines. The Bank’s ethical guidelines cover the bank’s management, board officers and other employees, and provide guidance relating to customer care, gifts, confidentiality, participation in other business activities and transactions with related parties. The guidelines also include disclosure to employees for violations of internal policies, laws and regulations, and describe the procedures for how such information/notifications are to be given.
In all concerns, the bank follows the principles of corporate governance as they are formulated by the Norwegian Corporate Governance Boards (NCGB). This recommendation can bee seen online at http://www.nues.no/.
5
Development in number of man-years and total assets (MNOK)
100
120
140
160
180
200
220
ÅrsverkForvaltningskapital
240
12000
2008 2009 2010 2011 2012
15000
18000
21000
24000
27000
30000
33000
36000
39000
42000
45000
260
280
300
320
340
360
380
400
420
440
460
0
3000
6000
9000
Total assetsNumber of man-years
119.52435231071703%

Management structure:The Bank’s most senior body is the Board of Trustees, which consists of representatives from the depositors, EC-holders, staff and publicly appointed members, each of the four groups being represented in equal proportions. The Board of Trustees elects an election committee which proposes elected representatives for the Bank’s various bodies.
The bank is managed by a Board of Directors of six members. The Bank’s staff provides one member of the Board of Directors. The Managing Director or members of the senior management are not members of the Board. It is prepared instructions for the Board’s work and instructions for the Managing Director.
Board members are elected for two-year terms and can hold a directorship for a maximum of eight years in accordance the Bank’s Statute, which reads: ”An elected member or Chairman of the Board of Trustees or the Control Committee or the Board of Directors cannot have this position of trust for a continuous period longer than eight years or have these offices for a total period longer than 12 years.”
The Bank has introduced a separate routine for the assessment of suitability requirements for members and deputy members of the Board of Directors. The purpose of the routine is to ensure that those people meet the requirements of the provisions of the Savings Banks Act and the Securities Trading Act.
The Board has appointed a separate audit committee and a remuneration committee. The Audit Committee’s main purpose is to ensure that the bank has independent and effective internal and external auditing, and that accounting and risk reporting is in compliance with laws and regulations. The Remuneration Committee shall prepare all matters relating to remuneration schemes / bonuses to be determined by the Board. The Bank’s senior management and internal auditor do not participate in the Bank’s bonus scheme.
The Bank’s Articles of Association do not contain provisions for the purchase of its own equity sertificate capital, so a decision on this will be resolved in the Board of Trustees, who may give authorisation to the Board. Such decisions / authorisations are based elsewhere in the Financial Institutions Act and the principles of public limited companies.
Control mechanisms:The Control Committee is the Board of Trustees’ control body for monitoring the Bank’s operations and consists of 3 members and one deputy member. One member of the committee shall satisfy the requirements of a judge under the law of 13 August 1915, no5. The committee shall submit an annual declaration to the Board of Trustees, and give a report of their work to the Financial Supervisory Authority of Norway’s (FSAN). It is worked out instructions for the Control Committee.
The bank’s internal auditor is subject to the Board and submits an annual report to the Board in accordance with approved and completed audit projects. The internal auditor shall, on behalf of the Board, ensure that it has established and implemented adequate and effective internal control and risk management. The internal auditor is involved in the control committee meetings. Instructions for the internal auditor have been prepared. The board approves the internal audit annual plan and resource requirements on an annual basis.
The external auditor is appointed by the Board of Trustees and submits an annual audit report in connection with the financial statements. The
external auditor attends the board meeting that deals with the final annual accounts. Otherwise, the external auditor has an annual meeting with the Audit Committee, in addition to an annual meeting with the Board without management present. Remuneration of the Board of Trustees is dealt with in the annual account meeting. The relationship with the external auditor is also regulated in a separate engagement letter, which deals with parties’ responsibilities, among other things.
The Bank is subject to the “Regulations on risk management and internal control”. An annual report to the Board on the status of internal control is an integral part of the ICAAP reporting. The financial reporting process is a part of internal control.
The Bank has a clear risk strategy which is explained in the ’Credit Document’, the ‘Finance Document’, “EDP Document” and the ‘ICAAP Document’, which are discussed every year at the Board of Directors. In addition, there are the ‘Principles for Internal Control’, which have been agreed by the Board of Directors. In general, the Bank has a low risk profile.
In addition, the Bank is subject to the Financial Supervisory Authority of Norway’s (FSAN) rules and regulations relating to ‘Minimum requirements for capital adequacy and rules pertaining to large commitments to individual customers in relation to equity and related capital’.
Equity and dividends:Sparebanken Pluss has one class of equity certificate. Equity certificate holders are guaranteed equal treatment and equal opportunity for influence. The net profits are distributed between bank equity and equity share capital in accordance with the ownership fraction.
Sparebanken Pluss’s equity certificates are listed on the Oslo Stock Exchange and are freely transferable. The only limitation is the statutory requirement which currently states that the acquisition of qualified shares of the equity share capital, at 10 per cent or more, requires the consent of the Ministry of Finance. The listing ensures that the Bank relates to the market conditions at any time in the equity market.
The Bank is bound by the Exchange’s rules for the reporting of financial and other information to the market.
Risk management and internal control:Responsibility for the implementation of the Bank’s risk management is shared between the board, management and operational units. The Bank has its own risk management committee and risk management department, which have important functions relating to management, control, reporting and analysis. A system has been established for risk assessment and internal control, which determines the organisation and implementation of internal control procedures.
Remuneration of directors and senior management:The remuneration of the Board of Directors is determined by the Board of Trustees, on the recommendation of the nomination committee. Remuneration of the Managing Director is determined by the Board, while the remuneration of senior executives is decided by the Managing Director.
OUTLOOK FOR 2013At the beginning of 2013, the risk of a collapse of Euro co-operation has reduced. However, there remains much to do before the vulnerable countries in Europe have control over their own budget balances. Both the private and public sectors have isolated requirements to implement
6
savings measures. The consequences of a contractionary fiscal policy can be expected to be lower demand for growth and the risk of even weaker economic growth in a period. Emerging challenges are further emphasised by the situation in the labour market, with unemployment still rising and especially with a banking system that is not set up to take adequate financial risk. The European Central Bank’s approach to the challenges is likely to see the expansionary monetary policy continued. Established financial measures are likely to be maintained, and new ones are likely to be introduced due to the need to deal with market turmoil. As part of the expansionary monetary policy, it is expected that key rates in Europe will be kept low in 2013.
The final month of the previous year was dominated by the uncertainty surrounding the lack of a solution regarding the so-called “fiscal cliff” in the United States. By the end of 2012, however, Congress was able to put in place a tax treaty. Cuts in the spending budget and the raising of the debt-ceiling remains to be clarified in the spring of 2013. The composition of the measures that are being implemented are crucial for the growth impulses the US economy gets, and the resulting opportunities to give impetus to the world economy. However, there are factors that will help to moderate economic growth, including positive trends in both the labour and housing markets, which support household demand.
A hard landing has been avoided so far in China, and 2012 offered contributions towards rebalancing the economy. The greatest concern is linked to the risk of a collapse in the housing market. Measures to limit housing investment have been implemented and incentives given to private demand. The economic relationships in China are complicated; the economy is enormous and the importance of China’s contribution to international economic growth is considerable.
The outlook for the Norwegian economy is expected to be positive in 2013. Traditional export industry is expected to be affected to an even greater extent by the economic downturn. The situation in the labour market depends on the rate of investment in the oil industry and mainland enterprises. If investment declines as a result of stricter credit standards and lower international demand, the labour market could weaken somewhat. Impetus from the oil industry depends on the development of oil prices and the rate of investment, which has been very high in recent years. As more businesses are finding, capacity limitations nevertheless suggest that unemployment will only change by a limited amount in 2013 from 2012.
In the wake of the financial crisis, governments both internationally and in Norway introduced a continuing number of stringent requirements for banks to steer away unmanageable financial imbalances in the future. There are now requirements for banks to hold far more capital
and greater liquidity buffers as a basis for running their lending activity. In addition, there have been the introduction of increasingly stringent limits on the size of mortgages customers can be offered, and the size of commitment banks can have with business customers. The intention of tightening these rules is to make banks more reliable and robust. In this way, there are safety nets and buffers against future financial crises. At the same time, however, banks have had significant costs applied to them. One should therefore expect that higher funding costs could hamper banks’ lending and lead to higher interest costs for the borrowing customers of banks. It is therefore important for the government to provide the dosage and rate of introduction of new regulatory requirements, so that the objective of robustness is achieved without unnecessarily stifling economic growth.
At the beginning of 2013, the appetite for risk in global financial markets has been raised. In the Euro zone, access to capital has risen. The financial markets remain open for financial transactions at far lower prices than in 2012. The financial markets work better, but the real economic improvement areas are numerous. It may well be that the medicine prescribed has a positive effect.
Interest rates in the Norwegian money markets are expected to remain low as a result of expansive international monetary policy. Tighter credit standards at banks and increased capital costs can still push lending rates slightly upwards. However, Norwegian banks are well equipped to contribute to further economic growth in the regions where they operate.
The Board expects the Bank’s operating profit for 2013 to be satisfactory, but the turmoil in several countries’ economies and financial markets could continue to have a negative effect on the Norwegian economy and the financial sector. However, the Bank is only directly exposed to foreign capital markets to a very modest extent. In addition to that, the Bank’s default- and loss development will be affected by further economic development, but it is expected that the losses will remain modest.
VOTE OF THANKSThe Board of Directors would like to thank all staff and elected representatives for another good year for the Bank. At the same time, the Board would wish to thank the Bank’s customers, EC-holders and other connections for the way in which they have all supported the Bank, and for the trust they have shown in the Bank during the year which is now behind us.
Kristiansand, 31. December 2012 5. March 2013
Trond BjørnenakChairman
Norunn Tveiten BenestadDeputy Chairman
Peder Syrdalen Magne Haug
Bjørg Sveinall Øgaard Bente Pedersen
Stein A. HannevikChief Executive Officer
7
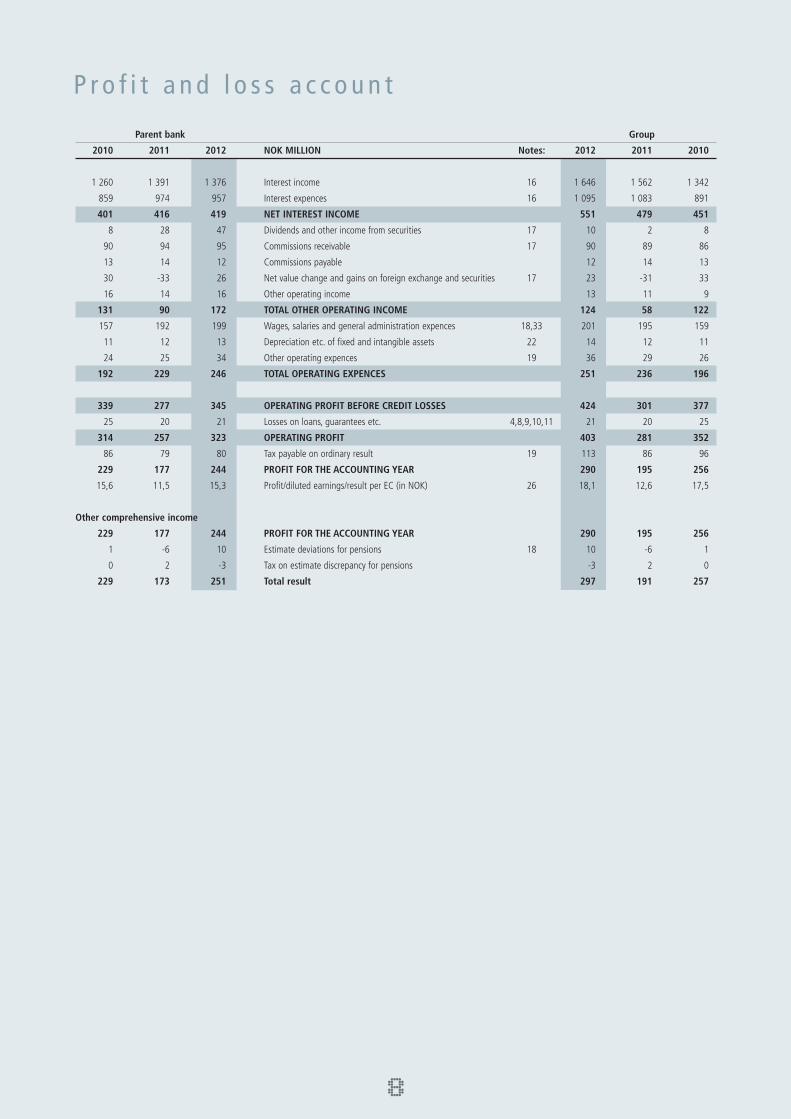
Parent bank Group
2010 2011 2012 NOK MILLION Notes: 2012 2011 2010
1 260 1 391 1 376 Interest income 16 1 646 1 562 1 342
859 974 957 Interest expences 16 1 095 1 083 891
401 416 419 NET INTEREST INCOME 551 479 451
8 28 47 Dividends and other income from securities 17 10 2 8
90 94 95 Commissions receivable 17 90 89 86
13 14 12 Commissions payable 12 14 13
30 -33 26 Net value change and gains on foreign exchange and securities 17 23 -31 33
16 14 16 Other operating income 13 11 9
131 90 172 TOTAL OTHER OPERATING INCOME 124 58 122
157 192 199 Wages, salaries and general administration expences 18,33 201 195 159
11 12 13 Depreciation etc. of fixed and intangible assets 22 14 12 11
24 25 34 Other operating expences 19 36 29 26
192 229 246 TOTAL OPERATING EXPENCES 251 236 196
339 277 345 OPERATING PROFIT BEFORE CREDIT LOSSES 424 301 377
25 20 21 Losses on loans, guarantees etc. 4,8,9,10,11 21 20 25
314 257 323 OPERATING PROFIT 403 281 352
86 79 80 Tax payable on ordinary result 19 113 86 96
229 177 244 PROFIT FOR THE ACCOUNTING YEAR 290 195 256
15,6 11,5 15,3 Profit/diluted earnings/result per EC (in NOK) 26 18,1 12,6 17,5
Other comprehensive income
229 177 244 PROFIT FOR THE ACCOUNTING YEAR 290 195 256
1 -6 10 Estimate deviations for pensions 18 10 -6 1
0 2 -3 Tax on estimate discrepancy for pensions -3 2 0
229 173 251 Total result 297 191 257
P r o f i t a n d l o s s a c c o u n t
8

B a l a n c e s h e e t
Parent bank Group
31.12.10 31.12.11 31.12.12 NOK MILLION Notes: 31.12.12 31.12.11 31.12.10
ASSETS
1 191 568 475 Cash-in-hand and claims on central banks 28 475 568 1 191
696 667 574 Loans to and claims on credit institutions 4,32 19 30 107
21 154 23 579 25 019 Loans and claims on customers 4,8,9,10,11 35 573 33 147 30 503
7 0 0 Repossessed assets 0 0 7
10 772 10 453 11 484 Certificates, bonds and other interest-bearing securities 4,12 7 156 5 918 4 373
205 207 215 Shares, unit trust shares and ECs with variable yield 20 215 207 205
300 450 450 Equity stakes in Group companies 21 0 0 0
0 1 0 Deferred tax assets 19 0 1 0
276 274 271 Fixed assets 22 271 275 277
92 150 217 Other assets 23 217 150 92
Prepaid costs, not yet incurred
129 203 186 - accrued income, not yet received 23 195 214 136
34 823 36 552 38 892 TOTAL ASSETS 44 122 40 511 36 893
LIABILITIES AND EQUITY CAPITAL
6 152 6 093 5 304 Liabilities to credit institutions 13 5 304 6 093 6 152
14 963 15 289 19 378 Deposits from and liabilities to customers 15 19 378 15 289 14 963
10 092 11 305 10 304 Borrowings through the issuance of securities 14 15 377 15 167 12 089
172 227 299 Other liabilities 24 299 227 172
85 91 82 Payable tax 19 115 98 95
225 262 220 Incurred costs and income received, not yet accrued 24 234 287 241
74 77 57 Provisions for liabilities 18,24 57 77 74
12 0 8 Deferred tax 19 8 0 12
698 699 498 Subordinated loan capital 6,25 498 699 698
32 474 34 043 36 150 TOTAL LIABILITIES 41 270 37 937 34 496
EQUITY CAPITAL
159 159 159 Paid-in equity capital 26 159 159 159
2 190 2 350 2 582 Retained earnings 2 693 2 415 2 238
2 350 2 510 2 742 TOTAL EQUITY CAPITAL 26 2 852 2 575 2 397
34 823 36 552 38 892 TOTAL LIABILITIES AND EQUITY CAPITAL 44 122 40 511 36 893
Proposed dividend 27
Guaranties and assets pledged as collateral security 30
Kristiansand, 31. December 2012
5. March 2013
Trond BjørnenakChairman
Norunn Tveiten BenestadDeputy Chairman
Peder Syrdalen Magne Haug
Bjørg Sveinall Øgaard Bente Pedersen
Stein A. HannevikChief Executive Officer
9
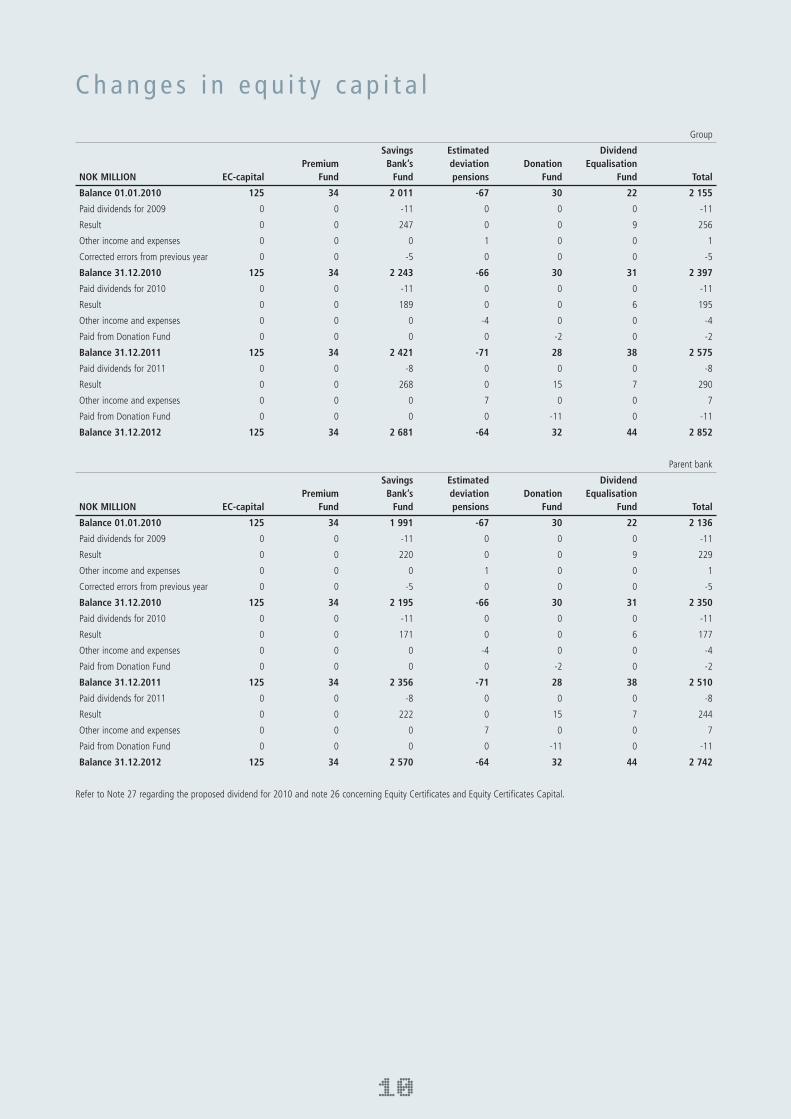
C h a n g e s i n e q u i t y c a p i t a l
Group
Savings Estimated Dividend Premium Bank’s deviation Donation Equalisation NOK MILLION EC-capital Fund Fund pensions Fund Fund Total
Balance 01.01.2010 125 34 2 011 -67 30 22 2 155
Paid dividends for 2009 0 0 -11 0 0 0 -11
Result 0 0 247 0 0 9 256
Other income and expenses 0 0 0 1 0 0 1
Corrected errors from previous year 0 0 -5 0 0 0 -5
Balance 31.12.2010 125 34 2 243 -66 30 31 2 397
Paid dividends for 2010 0 0 -11 0 0 0 -11
Result 0 0 189 0 0 6 195
Other income and expenses 0 0 0 -4 0 0 -4
Paid from Donation Fund 0 0 0 0 -2 0 -2
Balance 31.12.2011 125 34 2 421 -71 28 38 2 575
Paid dividends for 2011 0 0 -8 0 0 0 -8
Result 0 0 268 0 15 7 290
Other income and expenses 0 0 0 7 0 0 7
Paid from Donation Fund 0 0 0 0 -11 0 -11
Balance 31.12.2012 125 34 2 681 -64 32 44 2 852
Parent bank
Savings Estimated Dividend Premium Bank’s deviation Donation Equalisation NOK MILLION EC-capital Fund Fund pensions Fund Fund Total
Balance 01.01.2010 125 34 1 991 -67 30 22 2 136
Paid dividends for 2009 0 0 -11 0 0 0 -11
Result 0 0 220 0 0 9 229
Other income and expenses 0 0 0 1 0 0 1
Corrected errors from previous year 0 0 -5 0 0 0 -5
Balance 31.12.2010 125 34 2 195 -66 30 31 2 350
Paid dividends for 2010 0 0 -11 0 0 0 -11
Result 0 0 171 0 0 6 177
Other income and expenses 0 0 0 -4 0 0 -4
Paid from Donation Fund 0 0 0 0 -2 0 -2
Balance 31.12.2011 125 34 2 356 -71 28 38 2 510
Paid dividends for 2011 0 0 -8 0 0 0 -8
Result 0 0 222 0 15 7 244
Other income and expenses 0 0 0 7 0 0 7
Paid from Donation Fund 0 0 0 0 -11 0 -11
Balance 31.12.2012 125 34 2 570 -64 32 44 2 742
Refer to Note 27 regarding the proposed dividend for 2010 and note 26 concerning Equity Certificates and Equity Certificates Capital.
10

C a s h f l o w s t a t e m e n t
Parent bank Group
31.12.10 31.12.11 31.12.12 NOK MILLION 31.12.12 31.12.11 31.12.10
Cash flows from operating activities
1 287 1 340 1 492 Interest receivable 1 763 1 507 1 366
-877 -733 -1 005 Interest payable -1 154 -872 -898
8 2 47 Dividends received 10 2 8
0 26 0 Payments received from the group contributions 0 0 0
106 108 109 Other payments received 100 117 95
-213 -227 -264 Other payments made -269 -250 -217
3 3 2 Recoveries relating to confirmed losses 2 3 3
-70 -81 -91 Payment of tax -98 -91 -78
-13 -21 -12 Payment - donations -12 -21 -13
799 326 4 089 Net change in deposits from customers 4 089 326 799
1 152 -2 447 -1 467 Changes in net loans to and claims on customers -2 452 -2 667 -3 265
2 181 -1 744 2 901 Net cash flow from operating activities 1 980 -1 945 -2 201
Cash flow from investment activities
10 888 11 080 22 417 Payment received relating to securities 22 417 10 080 10 888
-11 552 -10 945 -23 428 Payment relating to securities -23 428 -9 795 -9 952
0 7 6 Payment received in fixed assets 6 7 0
-21 -17 -13 Payment in fixed assets -13 -17 -21
-67 -63 -15 Change in other claims -15 -63 -67
-752 63 -1 032 Net cash flow from investment activities -1 032 213 848
Cash flows from financing activities
-615 29 93 Net change in deposits from customers 11 77 170
-661 -59 -789 Net change in deposits from Norges Bank and other financial institutions -789 -59 -661
2 624 4 663 2 098 Payment received of bond debt 3 100 5 666 4 621
-3 500 -3 450 -3 154 Payment of bond debt -3 154 -4 450 -3 500
162 -114 0 Change in short-term liabilities 0 -114 162
0 0 199 Payment received subordinated loan capital 199 0 0
0 0 -400 Payment subordinated loan capital -400 0 0
-11 -11 -8 Payment of dividend -8 -11 -11
-2 000 1 059 -1 961 Net cash flow from financing activities -1 041 1 110 782
-571 -622 -93 Net change in liquid assets during the year -93 -622 -571
1 762 1 191 568 Liquid assets as at 01.01. 568 1 191 1 762
1 191 568 475 Liquid assets as at 31.12. 475 568 1 191
11
The cash flow statement shows receipts and payments and cash equivalents during the year. Statement has been prepared in accordance with the direct method. Cash flows
are classified as operating activities, investing activities or financing activities. Cash is defined as cash and balances with central banks.
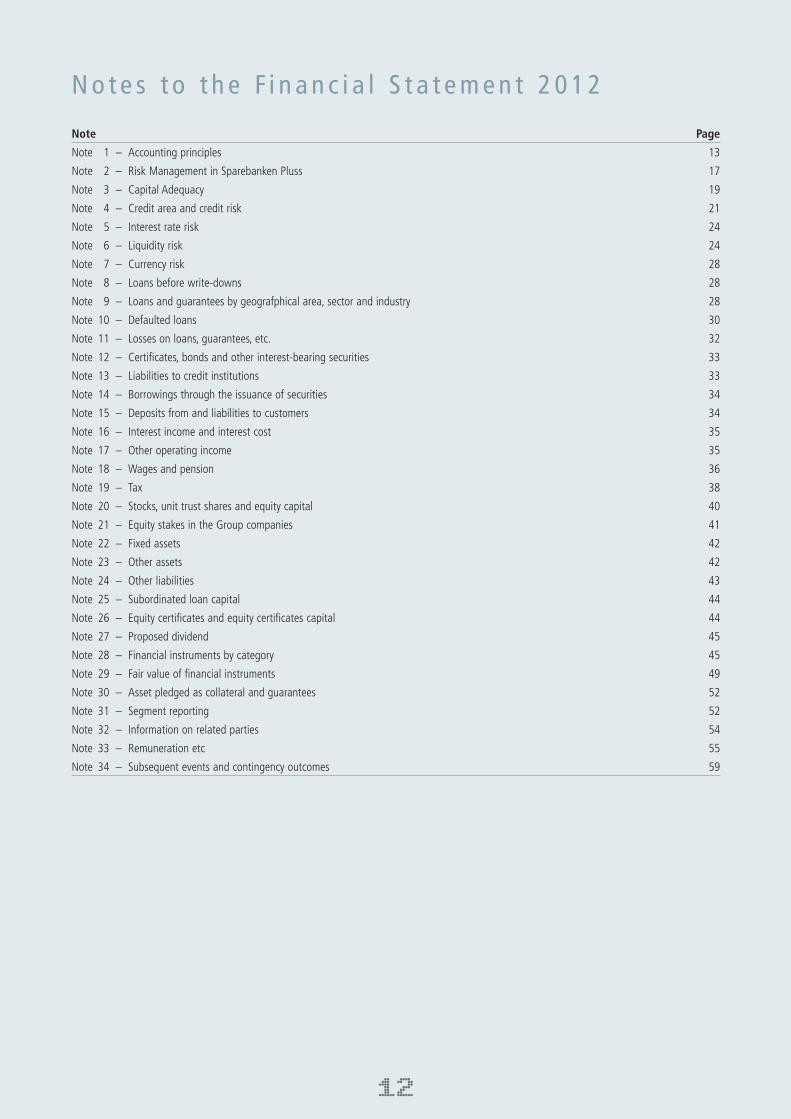
N o t e s t o t h e F i n a n c i a l S t a t e m e n t 2 0 1 2
Note Page
Note 1 – Accounting principles 13
Note 2 – Risk Management in Sparebanken Pluss 17
Note 3 – Capital Adequacy 19
Note 4 – Credit area and credit risk 21
Note 5 – Interest rate risk 24
Note 6 – Liquidity risk 24
Note 7 – Currency risk 28
Note 8 – Loans before write-downs 28
Note 9 – Loans and guarantees by geografphical area, sector and industry 28
Note 10 – Defaulted loans 30
Note 11 – Losses on loans, guarantees, etc. 32
Note 12 – Certificates, bonds and other interest-bearing securities 33
Note 13 – Liabilities to credit institutions 33
Note 14 – Borrowings through the issuance of securities 34
Note 15 – Deposits from and liabilities to customers 34
Note 16 – Interest income and interest cost 35
Note 17 – Other operating income 35
Note 18 – Wages and pension 36
Note 19 – Tax 38
Note 20 – Stocks, unit trust shares and equity capital 40
Note 21 – Equity stakes in the Group companies 41
Note 22 – Fixed assets 42
Note 23 – Other assets 42
Note 24 – Other liabilities 43
Note 25 – Subordinated loan capital 44
Note 26 – Equity certificates and equity certificates capital 44
Note 27 – Proposed dividend 45
Note 28 – Financial instruments by category 45
Note 29 – Fair value of financial instruments 49
Note 30 – Asset pledged as collateral and guarantees 52
Note 31 – Segment reporting 52
Note 32 – Information on related parties 54
Note 33 – Remuneration etc 55
Note 34 – Subsequent events and contingency outcomes 59
12

N o t e s t o t h e F i n a n c i a l S t a t e m e n t
NOTE 1 – ACCOUNTING PRINCIPLES
1. INTRODUCTIONSparebanken Pluss is an equity certificate bank, with its registered office in
Kristiansand but with several branches in the Agder counties. The bank may, within
the framework of the statues and the laws that apply at any time, carry out all the
services that banks in general have a license to perform. The Bank is licensed as an
investment firm.
The Sparebanken Pluss Group includes Pluss Boligkreditt AS, a wholly owned
subsidiary. Pluss Boligkreditt AS was established with effect from 01.01.2009
to offer loans with a security in the mortgage within 75% of the property value.
Intercompany transactions, balances and unrealised gains on transactions between
Group companies are eliminated.
Sparebanken Pluss has a significant ownership interest in Plussmegleren Holding
AS, but not control over its financial and operating policies. Significant influence is
normally for investments the Group has of between 20% and 50% equity interest. As
of 31.12.2012, the Group has an equity interest in Plussmegleren Holding AS of 20%.
The investment accounted for the equity method in the consolidated accounts and the
cost method for accounting purposes.
Sparebanken Pluss gives it statements in Norwegian kroner (NOK), which is the
Group’s functional currency.
The consolidated financial statements for 2012 were prepared by the Board on 5th
March 2013, and will be finally approved by the Board of Trustees on 21th March
2013. The Board of Trustees is the Bank’s highest body.
2. BASIS FOR PREPARATION OF FINANCIAL STATEMENTSThe consolidated financial statements have been prepared in accordance with
International Financial Reporting Standards (IFRS), as adopted by the EU and
mandatory for all financial years beginning 1st January 2012 onwards.
Both the parent company and the subsidiary’s accounts are prepared in accordance
with IFRS.
Unless otherwise indicated, values on accounts are rounded to the nearest million.
The measurement basis for both the Parent Bank and the Group is historical cost with
the following modifications:
• Financialassetsandliabilities,includingderivatives,aremeasuredatfairvaluewith
changes in the income statement.
3. REVENUEInterest income and costs related to assets and liabilities which are measured at
the amortised cost are expensed as incurred using the effective interest method.
All charges related to interest-bearing loans and borrowings are included in the
calculation of the effective interest rate and are amortised over the expected term.
Interest income and costs related to instruments that are measured at fair value
through the results are presented as part of the net interest income, changes in market
values are recognised in net gains on foreign exchange and securities.
Fees, which are a direct payment for services rendered, are recorded as income when
the service is delivered. Fees for the establishment of loan agreements are amortised
over the expected term.
4. DISCRETIONARY JUDGMENTS, ESTIMATES AND CONDITIONSWith the preparation of financial statements, the management makes estimates
and judgments. Areas that are largely comprised of discretionary estimates have a
high degree of complexity, and where assumptions and estimates are significant to
the parent company the consolidated financial statements are presented below in
paragraphs 4.2 and 4.3.
4.1. GeneralIn applying the Group’s accounting policies, the company’s leadership exercised
discretion in some areas and made assumptions about future events as the basis of
accounting. There will naturally be an inherent uncertainty in the financial records
based on the use of discretion and assumptions about future events. The exercise of
discretion and the determination of assumptions about future events management
will look to available information on the balance sheet date, historical experience
with similar assessments, as well as market and third-party assessments of current
conditions. Although the management considers its estimates are based on the best
estimates available, one must expect that the actual outcome in some cases may differ
materially from what is the basis estimates. Estimates, assumptions and conditions
that represent a significant risk of substantial changes in the carrying value of assets
and liabilities within the next financial year are discussed below.
4.2. Write-downs on loansAssessment of individual and group-related write-downs will always be based on
a significant degree of discretion. Predictions based on historical information may
prove to be incorrect because it can never be known for certain what relevance
historical data’s decisions are. When the security values are related to specific items
or industries that are in crisis, the security must be realised in illiquid markets, and
the assessment of the security values will in such situations to be associated with
significant uncertainty.
4.3. Fair value of financial instrumentsThe fair value of financial instruments is partly calculated based on assumptions
that are not observable in the market. This is particularly relevant in determining
the premiums for credit risk by determining the fair value of fixed interest-bearing
securities in the form of deposits, loans and securities issued by others. The
management has, in these cases, based its assessments on information available in the
market combined with the best of its judgment. Such information will include credit
reviews conducted by other credit institutions.
5. FINANCIAL INSTRUMENTS5.1 Recognition and deductionsFinancial assets and liabilities are recognised when the bank becomes a party to the
contractual decisions.
A financial asset is deducted when the contractual rights to the cash flows from the
financial asset expire, or the bank transfers the financial asset in such a way that the
risk and profit potential of the asset in question is substantially transferred. A financial
liability is deducted when the financial liability is discharged, cancelled or expired.
5.2 ClassificationFinancial instruments are classified into one of the following categories at the initial
recognition.
• Financialinstrumentssubjecttofairvaluethroughprofitorloss
• Financial instrumentssubjecttovoluntarycategorisedatfairvaluethroughprofit
or loss
13

• Loansandreceivablesatamortisedcost
• Investmentswhichareheldtomaturity
• Otherliabilitiesatamortisedcost
5.2.1 Financial instruments subject to fair value/financial derivativesFinancial derivatives are valued at actual value with changes in the income statement.
Sparebanken Pluss has made use of the following financial derivatives: Options related
to interest rate swap agreements (swap), currency futures, currency swaps and stock
indexes. Financial derivatives will be recognised at actual value and changes in the
value will be shown in the results. With the calculation of fair value, the markets use
the current yield curve as a basis at all times.
5.2.2 Financial instruments that are voluntary valued at fair value The group chooses the initial recognition to define any assets or liabilities at fair value
with changes in the result if:
• Classificationreducesamismatchinthemeasurementorrecognitionthatotherwise
would have occurred as a result of different rules for measurement of assets and
liabilities. This applies to fixed rate loans that are hedged using derivatives.
• Thefinancialinstrumentsareincludedinaportfoliothatiscontinuouslymeasured
and reported at fair value.
In the said portfolios, certificates and bonds, fixed rate loans and shares are included.
5.2.3 Loans and receivables to the amortised cost This category includes loans and receivables that are measured at amortised cost.
5.2.4 Investment to be held to maturityThe Sparebanken Pluss Group has earmarked a selection of the bond holding which
will be held to maturity.
5.2.5 Other liabilities at amortised costThis category mainly includes loans and commitments that are measured at amortised
cost.
5.3 Measurement on initial recognition Financial assets and liabilities are recognised when the bank becomes a party to the
contractual terms. Initial recognition of financial assets and liabilities at fair value,
plus, for instruments that are not derivatives or measured at fair value through profit
or loss, transaction costs directly attributable to the acquisition or issue of the financial
asset or financial liability.
5.4 Subsequent measurement5.4.1 Measurement at fair valueFair value is the amount for which an asset could be exchanged or a liability could be
settled by a transaction between independent parties. This means that for financial
assets is the purchase rate used, for financial liabilities is the asking price used and for
derivatives which are considered net, is the middle rate used.
5.4.1.1 Measuring of financial instruments which are traded in active marketsFinancial instruments traded in an active market are valued at the observed market
prices.
5.4.1.2 Measurement of financial instruments which are not traded in an active marketFinancial instruments not traded in an active market are valued using valuation
techniques. Valuation techniques are based on the recently signed transactions
between independent parties, by referencing instruments with virtually the same
content or by discounting cash flows. As far as possible, valuations are based on
externally observed parameter values.
The fair value of interest-bearing securities is determined by established market values
reported by leading external market players, or at the fair value calculated on the basis
of current market yield- and credit spread curves at any time.
In calculating the fair value of swaps entered into, the market value of the relevant
inter-bank interest rate curve is used at all times.
For shares that are not listed or traded actively, the change in value is based primarily
on valuations carried out by others. If this is not available, the value of the shares is
based on the available accounting information, and an assessment is made of the
obvious added value or impairment.
Fixed rate loans are not traded in an active market. The bank must therefore establish
a market spread to estimate a fair value of loans as of 31st December.
5.4.2 Measurement of financial guaranteesFinancial guarantees are measured at fair value on initial recognition. At subsequent
measurements, issued financial guarantee are considered to the highest amount of
consideration received for the guarantees, less any amortized recognition and best
estimate in the eventual redemption of the guarantee.
5.4.3 Measurement of amortised cost Financial instruments not measured at fair value are measured at amortised cost.
Revenues are calculated at the instrument’s effective interest rate.
Amortised cost is defined as the book value at the initial measurement, adjusted for
received/paid installments and any cumulative accrual of fees, commissions etc, with
any writedowns.
The effective interest method is one which calculates the amortised cost and the
accrued interest income/expenses for the relevant period. Interest income is recognised
using the effective interest method. The effective interest rate is the rate of the loan’s
discounted cash flows over the expected life of the loan’s amortised cost at the time
it was established. This means that any difference between the loan’s original book
value and the accrued value is being amortised over the loan’s expected maturity. This
means that any difference between the loan’s original amortised cost and book value
is accrued over the expected maturity.
5.4.4 Write-down of financial assets Losses on loans are calculated as the difference between the book value and net
present value of estimated future cash flows, discounted using the effective interest
rate. Use of the effective interest method means that it is made recognition of interest
income on impaired loans. These loans are recognised at the interbank interest rate at
the date adjusted for changes in interest rates until the time of impairment. The income
rates are based on the loan’s recorded value.
In the income statement, posted losses consist of realised losses, changes in
impairment losses on loans and provisions for guarantees, as well as payment on
past realised losses. Losses on loans are based on an assessment of the Bank’s loan
and guarantee portfolio in accordance with IAS 39. The Bank determines the losses
on loans and guarantees on a quarterly basis. Non-performing and doubtful loans are
followed up with regular reviews.
5.4.4.1 Reduction in value of loans and individual write-down lossesImpairment loss is made when there is objective evidence that a loan is impaired
14
as a result of credit losses. An impairment loss is reversed when the loss is reduced
and can be related objectively to an event occurring after the impairment date. All
loans that are considered material will be assessed to see whether there is objective
evidence of impaired credit, and the objective indication is likely to result in reduced
future cash flows to the service of the engagement. Objective evidence may be
defaults, bankruptcies, debt settlement, a lack of liquidity or other significant financial
problems.
5.4.4.2 Group write-downsLoans that have not been subject to individual impairment write-downs are
included in the Group’s write-downs. Loans are divided into groups with similar risk
characteristics, with regard to servicing.
Group write-downs are calculated on sub-groups of loans where there is objective
evidence that shows that the future cash flow for the service of the engagements is
weakened. Group write-downs made in order to cover expected credit losses caused by
incidents that have occurred, shall take into account losses in the portfolio at the time
of measurement, but that are not yet identified at the individual’s commitment level.
Objective events could be a negative trend in risk classification, adverse developments
in security values or negative industry developments.
5.4.4.3 Realised lossesWhen it is highly probable that the loss is final, this is recognised as a realised loss. This
includes losses in which the Bank has lost its claim against the debtor in bankruptcy,
confirmed by dept settlement, by levying, by a court ruling and by the debt remission.
This applies even if the Bank has otherwise suspended enforcement or waived part
of or all loans. Some realised losses will be covered through the previous decision
made on individual loan loss write-downs, and booked against the former provision.
Realised losses, without coverage in individual impairment loss, as well as over-or
under cover in relation to previous impairment loss, are recognised.
5.5 Presentation in balance sheet and income statement 5.5.1 LoansLoans are recorded as either loans and receivables to credit institutions or loans and
receivables from customers. Accrued interest is calculated using the effective interest
rate method and is included in the profit and loss account.
Changes in value due to impairment charges are recognised in the profit and loss
account on loans, guarantees, etc. Accrued interest on loans is recognised in the
balance sheet under prepaid costs, not yet incurred - accrued income and not yet
received.
Changes in value of fixed rate loans, which are selected at fair value, are included in
the income statement under net value changes and gains on foreign exchange and
securities.
5.5.2 Certificates, bonds and other interest bearing securitiesThe balance sheet item includes the Group’s certificates and bond holdings. All
changes in value are recognised in the profit and loss account under net value changes
and gains on foreign exchange and securities. Accrued interest on interest bearing
securities is recognised in the balance sheet under prepaid costs, not yet incurred -
accrued income and not yet received.
5.5.3 Shares, unit trust shares and equity certificatesThe balance sheet includes the Group’s shares at fair value. All changes in value are
recognised in the income statement under net value changes and gains on foreign
exchange and securities.
5.5.4 Other assetsThe balance sheet includes financial derivatives and value adjustments related to
derivative instruments, which are recognised in the income statement under net value
changes and gains on foreign exchange and securities.
5.5.5 Debt to credit institutions, and deposits from and debt to customersThe balance sheet item includes liabilities to credit institutions and customers.
Accrued interest expenses are calculated using the effective interest rate method and
recognised in the income statement under interest expenses.
5.5.6 Issued securitiesThe balance sheet item includes securities debt. Interest expenses are recognised
in the income statement under interest expenses. Inefficiencies regarding hedge
accounting are recognised in the income statement in interest costs. Accrued interest
on securities are issued in the balance sheet under accrued expenses and prepaid, not
yet earned income.
5.5.7 Other debtsThe balance sheet includes financial derivatives and guarantees. Value changes related
to derivatives are recognised in the income statement under net value changes and
gains on foreign exchange and securities.
5.5.8 Subordinated loan capitalThe balance sheet includes issued subordinated loans. Interest expenses are
recognised in the income statement as interest cost.
6. HEDGE ACCOUNTINGSparebanken Pluss has found it appropriate to select hedge accounting when it comes
to the Bank’s funding of fixed rate terms in which hedge is effective within 80% to
125%. The hedge covers interest risk in bonds.
Sparebanken Pluss is using fair value hedges. The hedge is measured and documented
every quarter to ensure that it is effective. As a method to measure the effectiveness
of security, the dollar-offset method is used.
When the hedging is established and effective, the fair value of the interest rate swap
is carried at the fair value. Hedge objects are carried at amortised cost, and fair value
adjustments arising from the hedged risk are recognised as an addition or deduction
from the balance value.
Given that both the derivative and the change in value of the hedged item is
recognised, the ineffectiveness of the hedge will be recognised automatically.
If it occurs that the hedge is not effective, the Bank/Group will have to amortise the
value adjustments over the maturity of the bond.
7. ACCOUNTING FOR EXCHANGE RATE EFFECTIncome and expenses in foreign currency are translated into Norwegian kroner at the
rates on the transaction date.
Balance sheet items denominated in foreign currencies are hedged towards similar
posts on the opposite side of the balance sheet or the execution of hedging
transactions. Currency derivatives (currency futures) traded with customers are hedged
in similar manner to any external party. Assets and liabilities in foreign currencies are
translated into Norwegian kroner at the banks’ middle rates on the balance sheet date.
8. FIXED ASSETS Fixed assets are stated at cost less accumulated depreciation and amortisation.
Depreciation is computed at a straight-line basis over the expected economic life of the
asset. There will be an annual reassessment of the remaining useful life and residual
values for each asset.
15
At each reporting date, it will be evaluated as to whether there are any indications
of impairment. If there is impairment of an asset, it is calculated on the asset’s
recoverable amount. The asset is written down immediately at the lower of book
value and recoverable amount. The basis of previous write-downs are considered at
the same time.
There has been a decomposition in the estimated value of land, plants and building.
Land is not depreciated. Technical facilities are depreciated over their estimated useful
life and are not considered to have any residual value. Buildings are depreciated
over their estimated useful life with no residual value. Improvements and periodic
maintenance are amortised over the estimated useful life.
9. PENSION COST AND – OBLIGATIONS In accordance with IAS 19, both obligations related to collective schemes in life
insurance companies and unsecured obligations contained in the financial statements
in accordance with the calculations performed by an external actuary. Net pension
expense consists of the present value of net pension and interest cost on pension
obligations, net of expected return on plan assets. Net pension costs are included
in the record wages and general administration costs. Changes in estimates are
recognised with other incomes and changes in plans are expensed as incurred.
10. TAXTaxes are accrued as an expense regardless of the payment date. The tax charge
therefore reflects this year’s and future taxes payable as a result of this year’s activity.
The tax is expected to offset net income included in this year’s tax cost and in the
balance sheet called payable tax. Deferred tax is calculated on the basis of differences
between the reported tax and accounting results that will be offset in the future. Tax
increasing and tax reducing temporary differences within the same time interval are
offset against each other.
Any net deferred tax assets are recognised as an asset in the balance sheet when it is
probable that the tax reducing differences will be realised.
Wealth tax is calculated and included in other operating expenses in 2012 and payable
tax in the balance sheet.
11. PRESENTATION OF DIVIDENDSThe proposed distribution of dividends are presented as equity until the final decision
of the distribution has taken place. Distribution is then presented as a dividend until
payout has taken place.
12. LEASE AGREEMENTSLeases where a significant part of the risk and return which is associated with that
the ownership of the asset are not transferred, are classified as operating lease
agreements. Lease payments are classified as operating expenses and the income
statement displays them linearly over their lifetime. Sparebanken Pluss has not entered
into financial lease agreements.
13. SEGMENT/SEGMENT ACCOUNTING Segment Reporting is divided according to how the different areas are reported and
monitored internally by management and the Board.
Sparebanken Pluss has three operating segments:
• PM (personal markets) which include all local banks and branches. They also
include corporate loans related to local banks.
• CM(corporatemarkets)whichareapplicabletotheBusinessCentreatthemain
office – this includes the major corporate loans inside and outside the Agder
counties.
• Boligkreditt (Pluss Boligkreditt AS) which offers loans secured on residential property
within 75% of the property value. Pluss Boligkreditt AS operates only with loans.
The Bank’s own investment activities are not a separate reportable segment and
come under the record as undistributed. This item also includes unallocated Group
eliminations.
14. SUBSIDIARIES AND AFFILIATESPluss Boligkreditt AS is the sole subsidiary of Sparebanken Pluss as of 31.12.2012
and all transactions between the companies will take place at market prices. There
are no employees in Pluss Boligkreditt AS; all of the company’s work is performed by
employees of Sparebanken Pluss.
15. CHANGES IN ACCOUNTING POLICIES AND NOTE INFORMATION The Group has not made changes to its accounting principles in 2012, but has
implemented the following new standards:
IFRS 7 Financial instruments
– clarifications relating to the transfers of financial assets
The changes involve clarification demands for financial assets that have been
transferred, in which the Group has a continued involvement. The purpose is to
provide a better basis to understand the relationship between transferred financial
assets that are not deducted in their entirety, and the associated liabilities. There is
a further change of information involved that is given about the Group’s continuing
involvement in financial assets that are deducted in their entirety. This will allow
users to be able to evaluate the nature of risks associated with the Group’s
continuing involvement in deducted financial assets.
The changes to IFRS 7 are of importance for the Group, but these amendments have
not had a significant impact when the relationship around deductions has been
discussed earlier. This refers to the arrangement with the state, referred to in note 12
to the annual accounts.
16. APPROVED, STANDARDS NOT ENTERED INTO FORCE AND INTERPRETATIONSThe following new standards and interpretations to existing standards have been
published and are mandatory for the company and consolidated financial statements
in future periods, but management has chosen not to adopt early use:
• IAS1PresentationofFinancialStatements
The amendments to IAS 1 require that the records in the statement of other
comprehensive income (OCI) should be grouped into two categories. Items that
may be reclassified to profit or loss at a future date (for example, the net gain
on the hedge of a net investment, exchange differences on translation of foreign
operations into the reporting currency, net change in cash flow hedges and
net gains or losses on financial assets classified as available for sale) are to be
presented separately from items which will never be reclassified (for example,
actuarial gains and losses linked to contribution-based pension arrangements).
The changes only affect the presentation and have no impact on the financial
position or results. The amendments are effective for annual periods beginning 1st
July 2012 or later, and will therefore be implemented in the Group’s first financial
statements.
• IAS19Contributionstoemployees
IASB has adopted a number of amendments to IAS 19. The changes are both of
fundamental character, due to the corridor method being no longer permitted
and that the expected return on pension resources changes conceptually, and of
simpler character which give clarifications and reformulation. The elimination of
the corridor method means that actuarial gains and losses are recognised in other
comprehensive income (OCI) in the period they occur. The amendment to IAS 19
will affect net pension costs as a result of the expected return on pension resources
being calculated with the same interest rate used for discounting pension liabilities.
The amendments are effective for annual periods beginning 1st January 2013 or
later.
16

The Group does not use the corridor method but leads actuarial gains and losses
directly in other comprehensive income (OCI), but the change regarding returns for
pension funds will have a direct impact on the Group’s recognised pension costs.
• IAS32FinancialInstruments–presentation
IAS 32 has been amended to clarify the meaning of “currently has a legally
enforceable right to set-off”, and also to clarify the application of IAS 32s in the
offsetting of payment systems such as central clearing house systems which use
gross settlement mechanisms that do not happen simultaneously. The amendments
are effective for annual periods beginning 1st January 2014 or later.
The Group has not finalised its assessment of the effect this may have on the
application of the set-off in the balance sheet.
• IFRS7FinancialInstruments–clarifications
The changes mean that companies are required to provide details of set-off
agreements and related agreements (for example, securities). This information will
provide users of financial statements useful information in evaluating the effects
of set-off agreements on the financial position. The new notes are required for all
recognised financial instruments net-presented in accordance with ‘IAS 32 Financial
Instruments – presentation’. Reporting requirements also include recognised financial
instruments that are subject to an “enforceable master netting arrangement” or
a similar agreement, regardless of whether they are net-presented in accordance
with IAS 32. The changes will not affect the financial position or results, and the
amendments are effective for annual periods beginning 1st January 2013 or later.
• IFRS9FinancialInstruments
IFRS 9, as it is published today, reflects the first phase of the IASB’s work in
replacing IAS 39, and applies to the classification and measurement of financial
assets and liabilities as defined in IAS 39. The initial standard would become
effective for financial years starting 1st January 2013 or later, but changes in IFRS
9 were adopted in December 2011, delaying the effective date until 1st January
2015. Later phases of this project are related to the accounting for hedging and
write-down of financial assets.
The Group will evaluate the potential effects of IFRS 9 in accordance with the other
phases, as soon as the final standard, including all phases, is published.
• IFRS 12 Disclosure of Interests in Other Entities
IFRS 12 applies to entities that have interests in subsidiaries, joint arrangements,
associates or unconsolidated structured entities. IFRS 12 replaces the disclosure
requirements in IAS 27 Consolidated and Separate Financial Statements, IAS 28
Investments in Associates and IAS 31 Interests in Joint Ventures. In addition, it
introduces a number of new disclosure requirements. The changes do not affect
the Group’s financial position or results. IFRS 12 is effective for annual periods
beginning 1st January 2014 or later.
• IFRS 13 Fair Value Measurement
This standard sets out principles and guidance for the fair value measurements of
assets and liabilities that other standards require or permit to be measured at fair
value. IFRS 13 is effective for annual periods beginning 1st January 2013 or later.
The standard will define principles and guidelines for the measurement of fair value.
It is not expected to have a significant affect on the current recognised fair value.
• IAS1PresentationofFinancialStatements
(Annual Improvement Project 2009 – 2011)
The amendments to IAS 1 clarify the difference between voluntary comparative
figures and minimum requirements. Normally, the presentation of the previous
period’s comparative figures will meet the minimum requirements. The changes do
not affect the Group’s financial position or results. The amendments are effective
for annual periods beginning 1st January 2013 or later, but the EU has not
approved the changes.
The following new standards and interpretations to existing standards have been
announced and are mandatory for the company and consolidated financial statements
in future periods, but the management has decided that the changes in the standards
are not of significance to the company or the Group:
•AmendmentstoIAS28InvestmentinAssociatesandJointVentures
– The changes will be effective from 1st January 2014 or later.
•IFRS10ConsolidatedFinancialStatements
– The changes will be effective from 1st January 2014 or later.
•IAS32Financialinstruments:Presentation
(Annual Improvement Project 2009 – 2011)
– The changes will be effective from 1st January 2013 or later, but the EU has not
approved the changes.
NOTE 2 – RISK MANAGEMENT IN SPAREBANKEN PLUSS
Sparebanken Pluss will maximize its long term value creation, and with this objective,
it is essential that the risk is subject to an active and satisfactory management. As part
of its business strategy, the Group has to keep a low to moderate risk profile in all
activities. Taking risks is a basic feature of banking, and risk management is therefore a
key area in both daily operations as well as the Board’s ongoing work. We also refer to
the Bank’s document on “Risk and capital management in Sparebanken Pluss,” which
is available on the Bank’s website.
ORGANISATION
Board of Directors
The Board has overall responsibility for the Bank’s risk management and shall ensure
that the Bank has appropriate systems for risk management and internal control. The
Board sets the risk strategy, risk profile and risk tolerance, and the risk profile is put
into practice through the framework for risk management, including the determination
of powers. The Board also establishes strategy and policy level, composition and
distribution of equity, and approves the process to ensure adequate capital level at
any time (ICAAP).
Audit committee
The Board has appointed an audit committee, which is a sub-committee of the Board.
The purpose is to make a more thorough assessment of agreed matters, including
strengthening work on financial reporting and internal control.
The bank’s management
The CEO and other management are responsible for implementing risk management
and internal control. The CEO has established a management group and a risk
management committee that meets regularly. The Risk Control Committee will consider
the Bank’s total risk exposure and reconcile this with respect to the Bank’s capital
requirements. Matters pertaining to changes or the implementation of new policies
and strategies within the Group, should always be presented to the management
group for discussion and decision. The Management considers the risk situation
continuously, and evaluates the overall risk situation and its capital at least once a year.
These assessments are then presented to the Board.
The CEO has delegated duties in accordance with the formal responsibility for internal
control and risk management. The responsibility for the implementation of the annual
assessment of the risk situation and the capital has been delegated to the Risk Control
Department. This analysis should be coordinated and integrated with other planning
and strategy work in the Bank. It is further delegated to the various inspections and line
managers within the framework of agreed principles, instructions and authorisations.
17

The Bank has a Risk Control department that covers the entire group and does not
perform activities that it is the intention that the control function to monitor. This
department should identify, measure and evaluate the Bank’s overall risk, and be
responsible for compliance.
Internal auditor
The Bank has an internal auditor on its staff. This is a monitoring function regardless
of the administration in general, designed to perform risk assessments, controls and
investigations of the Bank’s internal control and governance processes to assess
whether they are appropriate and proper.
Risk control process
There are justifiable and appropriate strategies and processes for risk management
and the assessment of capital needs and how this can be maintained. The term for this
is ICAAP (the Internal Capital Adequacy Assessment Process). In order to structure the
framework, Sparebanken Pluss has its ICAAP divided into five stages.
I) Identification of risk
There is an analysis of the risks to which the Bank is exposed. For all the risks, there
is a suitable system for risk monitoring. There is also a process to capture changes
in existing risks and possible exposure to new risks. The latter is especially true in
connection with the alteration of existing or creation of new business areas or products.
II) Quantification of risk and equity
In order to analyse the Bank’s risk-bearing capacity, all of the risks are quantified and
aggregated.
III) Assessment of capital
The calculations are based on a requirement that the bank must meet the regulatory
requirements to equity and subordinated loan capital, and calculations have been
made for different time horizons. The level of capital is appropriate to the bank’s
business plans and growth ambitions, development framework, capital planning and
crisis preparedness.
IV) Framework setting
All significant risks have a frame.
V) Risk monitoring
Procedures have been established for handling violations of limits. In cases where the
risk is not quantifiable, the purpose of risk monitoring is to control the process-related
requirements or qualitative requirements. The reporting of risk monitoring follows a
fixed frequency and provides an accurate picture of the situation. In cases where the
risk exposure occurs quickly or unexpectedly, ‘ad hoc’ reporting will be prepared.
Should the risk monitoring reveal that the real exposure is greater than the desired
exposure, initiative should be taken. Ex post control means that if the risk monitoring
reveals that the real exposure is greater than the desired exposure, action will be
taken. Recent measures are risk management, change of frames (reallocation of risk
capital) or greater equity.
RISK CATEGORIES
For risk management purposes Sparebanken Pluss distinguishes between the following risks:
Credit risk
Credit risk is the risk of loss due to the Group’s counterparties or customers not having
the ability or willingness to meet its payment obligations to the Group Sparebanken
Pluss. Credit risk concerns all claims on counterparties/customers. Essentially this
means loans and credits, but also responsibilities under issued guarantees, securities
and counterparty risk arising from derivatives and foreign exchange contracts.
Credit risk is a function of two factors: servicing and the will and the value of
underlying collateral. Both factors must occur for it to be able to experience losses. The
first is the lack of ability to pay or the will of the debtor, and the other is that the value
of the underlying collateral is not sufficient to cover the Bank’s requirements for any
default and subsequent realisation of security.
Credit risk is defined as a significant risk, and the Bank’s policy is that credit risk
exposure is low to moderate. The Board approves the Group’s credit strategy and
credit policy, and credit risk is controlled by fixed limits and goals linked to the risk
profile and exposure on the portfolio level.
The Board, Management and control bodies receive regular reports of credit risk.
Central to this is the development of lending by the various risk classes and movement
between these classes.
Settlement risk
Settlement risk is a form of credit risk where a contracting party fails to fulfil its
obligations regarding settlements in the form of cash or securities, and that the Bank
has given notice of the payment or transfer of a security or safety. Settlement risk that
the Group is exposed is considered to be low.
Liquidity risk
Liquidity risk is defined as the risk that the group is unable to finance loan growth
and meet the bank’s financial obligations when they are due (refinancing risk).
Liquidity risk includes the risk that financial markets that the Group wants to use do
not work (market liquidity). Liquidity risk is in the risk policy defined as a significant
risk. Exposure should be moderate and in line with the average in the market. The
monitoring is done by the control of exposure in relation to adopted limits and control
of qualitative requirements.
Market risk
Market risk arises from the Group’s unsecured transactions in interest rate-, currency-
and equity markets, and can be divided into interest rate risk, currency risk, equity
risk and spread risk. The risk is linked to variations due to changes in market prices
and/ or - rates.
Interest rate risk
Interest rate risk is defined as the risk for the revenue losses arising from changes
in interest rates if the fixed rate period for the Bank’s liabilities and assets in and
off balance, not coincides. The Group’s interest rate risk is governed by limits on the
maximum alteration in value resulting from a change in interest rates of two per cent.
Fixed interest on the Group’s instruments are mainly short, and the Group’s interest
rate risk is low.
Currency risk
Currency risk is defined as the risk for the revenue losses that occur if exchange rates
change. Currency risk is subject to limits for the maximum aggregate foreign exchange
position. The extent of the Group’s trading activity in foreign exchange is low, and
foreign exchange risk is considered low.
Share risk
Rate risk (share risk) consists of market risk associated with positions in equity
securities, including derivatives with underlying equity instruments. Price risk is subject
to limits for the maximum aggregate position in an equity portfolio. The extent of the
Group’s equity positions is low, and price risk is considered low.
Spread risk
Spread risk is related to the performance in fixed income securities as a result of
changes in credit spreads, and this factor exists in addition to the interest rate risk.
Spread risk is regulated by the frameworks for maximum aggregate spread risk on the
bond portfolio, and spread risk is considered low.
18

Business risks
Business risk is defined as the risk of unexpected revenue fluctuations based on factors
other than credit risk, market risk and operational risk. The risk can occur in various
business and product segments and is linked to cyclical fluctuations and changes in
customer behavior. Business risk can also arise as a result of government regulations.
The risks also include the reputation- or the reputational risk, which is the risk,
associated with increased losses, reduced income and/or increased costs as a result of
the Group’s reputation having been damaged.
Strategic risk
Strategic risks are defined as internal matters on which the strategic risks relate to the
strategies, plans and changes that the Bank either has or has proposed.
Operational risk
Operational risk is defined as the risk the Group has as a result of inadequate or
failing internal processes or systems, human errors or external events. Operational risk
includes risk of default. Examples of operational risk relationships can be several types
of adverse actions and events, including money laundering, corruption, embezzlement,
insider trading, fraud, robbery, threats to employees, authorisation failures and
violations on adopted procedures, the failure of EDP systems, among other things.
The monitoring of operational risk is done by regular qualitative assessments. The
estimated capital requirements for operational risk are carried out under the basic
method, and it is assessed whether these ICAAP capital calculations are adequate. It
is considered that the Group has a low operational risk.
Concentrations of risk
Concentrations of financial risk arise when financial instruments with similar
characteristics are uniformly affected by economic changes or other factors. The
identification of concentrations of risk includes judgments. In the Group’s risk
management there is a general aim to reduce or control risk concentrations.
The Bank faces various types of risk concentration. If individual borrowers or groups
of related debtors constitute a significant portion of the portfolio, this will represent a
form of concentration risk as the portfolio provides company-specific or systematic risk.
Another form of risk concentration comes as a result of high exposures to certain
sectors or geographic areas. Individual sectors and geographical areas may have
different cyclical developments, and failure to spread the exposure in different sectors
means that diversification opportunities may be missed.
The risk associated with the financing of commercial real terms is often an exposure to
the tenants in the buildings. If a large proportion of the buildings in the loan portfolio
are leased out to large single tenants, or a large proportion of tenants are associated
with a specific industry, this will also involve a form of concentration risk.
With regards to credit risk, it is an objective to avoid major risk concentrations,
including large exposure to individual customers or customer groups and groups of
commitments in classes within high-risk industries or geographic areas.
More risk due to the debtor’s concentration is present in the opinion of the Bank, but
does not represent a significant risk for the Group. This is a result of low exposure
when one takes into account the quality of the collateral. A similar argument can be
made in relation to the concentration on the tenant’s side.
The largest sector concentration for Sparebanken Pluss is related to the ”rental of
commercial property”. Thus, this part of the portfolio may be exposed to risk factors
that affect real estate companies specifically. These risk factors are mainly vacancies,
rents and interest rates. The latter is a general macro variable, but real estate
companies are more heavily exposed to interest rates than many other industries due
to high loan interest and because the property is an asset with a long life.
The single-level involvement will mean considerable variation in terms of sensitivity to
these factors, and how involvement thus contributes to the portfolio’s concentration
risk. Among other thing, this depends on the tenancy, property location and type of
building. In addition, the debtor’s financial situation may have great significance.
HEDGING INSTRUMENTS
The Group uses the following hedging instruments:
• Interestrateswaps-agreementstoexchangeinterestratesforaparticularnominal
amount over a specified number of periods.
• FRAcontracts-agreementstoexchangeanagreedrateatafuturefixedinterest
rate for a particular nominal amount for a specified period.
• Shareindexoptionsandequityinterestrateswapagreements-inthisconnection
meaning agreements to receive the return on one or more shares, share indices or
funds at a specific future date by paying a premium at the conclusion of the contract
(equity index options), or by paying a variable interest incurred during the option
maturity (equity interest rate swaps). The agreements entered into at the time of
borrowing are in the form of equity index or equity index deposits. The agreements
are designed so that Sparebanken Pluss has no net exposure to equity instruments.
• Currencyfutures-agreementstobuyorsellforeigncurrencieswithsettlementata
specified future date.
The purpose of the use of interest rate, currency and equity instruments are to hedge
future interest rate conditions or counteract the effect of exchange rate fluctuations.
NOTE 3 – CAPITAL ADEQUACY
Sparebanken Pluss has a goal of maximising long-term value creation. The Group also
has a goal that the risk profile should be moderate to low. This means that effective
risk and capital management is a key strategic element.
Sparebanken Pluss has established a strategy and process for risk measurement,
-management and -control that provides an overview of the risks the Bank is exposed
to. This therefore provides the basis for the assessment and calculation of the Bank’s
total capital, and how this can be maintained to meet the specific risks in an adequate
manner. The process is described as ICAAP (the Internal Capital Adequacy Assessment
Process) or ”Total Capital Assessment Process.” The assessment of capital needs
including size, composition and the distribution of their capital needs and the level of
the risks the Bank is or may be subjected to, is based on the completed stress tests that
show what changes in macro variables can do to inflict greater bank losses.
19

Capital adequacy ensures that the Bank has the necessary buffer for events that occur
in addition to ordinary loss write-downs. In order to have greater flexibility in terms
of strategic choices and business opportunities, the Bank has a higher equity and
subordinated loan capital than the demand which is calculated from ICAAP.
The minimum requirement of equity and subordinated loan capital is 8%. The Financial
Authority finds (with effect from 1st July 2012) that banks should have a core capital
adequacy of at least 9%. Sparebanken Pluss has set a goal that the minimum core capital
adequacy shall amount to 10%. Sparebanken Pluss uses the standardised approach for
credit- and market risk and the basic method for operational risk to calculate capital
adequacy in accordance with the capital adequacy rules – Basel II.
The authorities are considering changes to the capital adequacy requirements and risk weights
for banks, although it is unclear how this will affect the standard approach in relation to the
IRB method (Internal Rating Based). However, Sparebanken Pluss considers that an application
for IRB approval, regardless of capital adequacy considerations, would give the Bank a positive
impact within risk management. The Bank has therefore decided to implement a process so
that one is able to apply to the Financial Supervisory Authority to use IRB.
Parent bank Group
31.12.10 31.12.11 31.12.12 NOK MILLION 31.12.12 31.12.11 31.12.10
17,36% 16,24% 14,43% Capital adequacy ratio 13,41 % 14,23 % 14,67 %
15,10% 14,22% 14,43% Core capital adequacy ratio 13,41 % 12,50 % 12,79 %
1 633 1 622 1 428 Capital buffer 1 338 1 428 1 398
1 395 1 574 1 777 Minimum requirements for equity and related capital 1 979 1 833 1 677
17 437 19 679 22 216 Total calculation basis 24 739 22 917 20 962
3 038 3 197 3 206 Net equity and related capital 3 317 3 261 3 075
2 633 2 799 3 206 Core capital 3 317 2 864 2 680
2 339 2 503 2 729 Equity capital 2 840 2 567 2 386
125 125 125 - EC-capital 125 125 125
34 34 34 - Premium Fund 34 34 34
2 195 2 356 2 570 - Savings Bank’s Fund 2 681 2 421 2 243
-66 -71 -64 - Estimated aberrations on pension -64 -71 -66
30 28 32 - Donations Fund 32 28 30
31 38 44 - Dividend Equalisation Fund 44 38 31
-11 -8 -13 - Deduction for dividends incl. in the savingsbank fund -13 -8 -11
294 296 477 Other core capital 477 296 294
299 299 498 - Capital bond 498 299 299
-5 -2 -21 - Deduction for equity and related capital in other financial institutions -21 -2 -5
395 398 0 Supplementary capital 0 398 395
400 400 0 - Subordinated loan 0 400 400
-5 -2 0 - Deduction for equity and related capital in other financial institutions 0 -2 -5
1 395 1 574 1 777 Minimum requirements for equity and related capital 1 979 1 833 1 677
1 325 1 504 1 706 Capital requirements for credit risk according to standard method 1 903 1 759 1 605
5 2 4 - Local and regional authorities (incl. municipalities) 4 2 5
52 94 152 - Institutions 32 47 52
634 617 734 - Companies 734 617 634
225 313 332 - Mass market commitments 333 317 225
329 384 388 - Commitments secured by mortgage on property 704 683 609
15 14 14 - Commitments due 14 14 15
2 2 2 - High risk commitments 2 2 2
15 24 24 - Covered bonds 24 22 15
2 2 2 - Shares in securities funds 2 2 2
48 53 55 - Other commitments 55 53 48
78 78 80 Capital requirements for operational risk 85 82 80
78 78 80 - Capital requirements according to the basis method 85 82 80
-8 -8 -9 Deductions in capital requirements -9 -8 -8
-1 0 -2 - Equity and related capital in other financial institutions -2 0 -1
-7 -7 -7 - Write-downs on groups of loans -7 -7 -7
20

TOTAL COMMITMENTS DISTRIBUTED IN RISK GROUPS
The total commitment includes the balance of approved loans and credits to customers, any unused portion of approved loans and guarantee limits and established guarantees.
21
Parent bank Group
31.12.10 31.12.11 31.12.12 NOK MILLION 31.12.12 31.12.11 31.12.10
Retail banking customers:
6 257 60,6 % 7 417 60,5 % 7 401 57,2 % Low risk 16 615 66,6 % 16 093 69,5 % 13 861 66,5 %
2 276 22,0 % 2 660 21,7 % 3 152 24,3 % Medium risk 5 298 21,2 % 4 224 18,2 % 3 895 18,7 %
1 290 12,5 % 1 770 14,4 % 2 051 15,8 % High risk 2 685 10,8 % 2 426 10,5 % 2 093 10,0 %
455 4,4 % 327 2,7 % 280 2,2 % Unclassified 300 1,2 % 327 1,4 % 945 4,5 %
10 278 12 173 12 884 Total non-matured or written down 24 898 23 070 20 794
47 0,5 % 92 0,8 % 62 0,5 % Commitm. in default and write-downs comm. 64 0,3 % 93 0,4 % 50 0,2 %
10 325 100 % 12 266 100 % 12 946 100 % Total retail banking customers 24 962 100 % 23 163 100 % 20 844 100 %
Corporate customers:
8 224 58,4 % 8 548 57,6 % 8 959 56,9 % Low risk 9 050 57,1 % 8 627 57,8 % 8 303 58,7 %
4 581 32,6 % 5 041 34,0 % 4 649 29,5 % Medium risk 4 649 29,3 % 5 041 33,8 % 4 581 32,4 %
797 5,7 % 1 064 7,2 % 1 960 12,5 % High risk 1 960 12,4 % 1 064 7,1 % 797 5,6 %
200 1,4 % 27 0,2 % 7 0,0 % Unclassified 20 0,1 % 27 0,2 % 200 1,4 %
13 802 14 680 15 575 Total non-matured or written down 15 679 14 759 13 881
270 1,9 % 165 1,1 % 167 1,1 % Commitm. in default and write-downs comm. 167 1,1 % 165 1,1 % 270 1,9 %
14 072 100 % 14 845 100 % 15 742 100 % Total corporate customers 15 846 100 % 14 924 100 % 14 151 100 %
24 397 27 111 28 688 Total commitments 40 808 38 086 34 995
NOTE 4 – CREDIT AREA AND CREDIT RISK
Credit risk represents the greatest risk area for the Group. The Board sets the Bank’s
credit strategy with the Bank’s credit policies and guidelines for credit processes to
ensure that the customer portfolio has an acceptable risk profile and helps the Group
to maximise its long-term value creation.
Sparebanken Pluss has Sørlandet as its regional primary market. In addition, the Bank
has a national market area, the organisations that are part of KNIF and their employees.
The Group will not have a lending volume outside the Agder counties exceeding 25 per
cent of the Group’s total lending.
PRINCIPLES FOR RISK CLASSIFICATION OF COMMITMENTS
The Group has a system for the risk classification of customers, where all customers
are risk classified in the loan application process. In addition, risk classification of the
customer base at the portfolio level is done quarterly by all commitments of over NOK
50,000. (The limit for this portfolio classification was changed from NOK 500,000 to
NOK 50,000 in 2011, and this is important in the evaluation of the comparative figures
for previous years.) The risk classification system means that customers are classified
into classes of default, where the probability of default within a 12-month period is
calculated from various internal and external financial data. In order to group customers
by default probability, both the retail and commercial portfolios are divided into 10
different risk classes (Class A - J) and 2 risk classes (K and L) respectively: defaulted
loans and loans with loan loss allowances that are not defaulted. Risk development in
the portfolio is mapped using the classification system, and the migration between the
different risk categories is measured each quarter.
The Bank’s risk classes are:
Risk classes Lower limit Upper limit
A 0,00 % 0,10 %
B 0,11 % 0,25 %
C 0,26 % 0,50 %
D 0,51 % 0,75 %
E 0,76 % 1,25 %
F 1,26 % 2,00 %
G 2,01 % 3,00 %
H 3,01 % 5,00 %
I 5,01 % 10,00 %
J 10,01 % 100,00 %
Risk grouping:
Probability of default
Low risk 0,00 – 0,75 %
Medium risk 0,76 – 2,00 %
High risk 2,01 – 100 %

Parent bank Group
31.12.10 31.12.11 31.12.12 NOK MILLION 31.12.12 31.12.11 31.12.10
34 26 31 Commitments in default 31 26 34
23 11 21 Other doubtful commitments 21 11 23
57 37 52 Total individual write downs 52 37 57
1) The impairment losses on loans are the capital regardless of risk classification before moving to risk classification defaults. The term ”Other doubtful commitments” is used for
loans which before write-down were not formally in default
INDIVIDUAL WRITE DOWNS DISTRIBUTED BY RISK GROUPS 1)
SHIFTS BETWEEN RISK GROUPS DURING THE YEAR
For the Group, in the retail market portfolio there is a reduction in units of loans
with low risk, while the share of medium and high risk has seen a slight increase.
The proportion of unclassified loans has reduced. There has been a marginal negative
migration in risk categories for the retail market in 2012, but the overall risk of the
retail portfolio is nevertheless regarded as very satisfactory.
For the corporate portfolio, there is a reduction in the proportion of loans with low
and medium risk, while the share of loans with high risk has increased somewhat. The
proportion of unclassified loans has also increased slightly. There has been a slightly
positive migration in risk classes for the corporate portfolio in 2012, and the total risk
for the corporate portfolio is considered very satisfactory.
Collateral
The Group uses a variety of collateral to reduce risk depending on market and type of
transaction. The main principles for the assessment of collateral are that the estimated
realisable value is as it is believed to be when there is a need for security. With the
exception of the commitment which has been written down, the collateral value is
calculated under the assumption of continued operation. The valuation of the security
has taken into account the estimated costs to sell. The main types of collateral used
are secured on real property (residential / commercial), bail (consumer guarantees
and surety) the registering of useful personal property (inventory, operating supplies),
and receivables. The estimated value of collateral for mortgages and loans that are
transferred to Pluss Boligkreditt AS are updated quarterly, while collateral for other
loans are updated at the very least with the processing of new credit issues or the
commitment follow-up. The Group’s loans generally have very good security.
Security in personal markets
The majority of the retail portfolio is secured by mortgages, and the group’s mortgage
portfolio has the following distribution of LTV (Loan to Value – LTV) .
22
GROSS LOANS DISTRIBUTED BY RISK GROUPS
Parent bank Group
31.12.10 31.12.11 31.12.12 NOK MILLION 31.12.12 31.12.11 31.12.10
Retail banking customers:
5 435 58,7 % 6 542 58,4 % 6 577 55,7 % Low risk 14 304 64,2 % 13 870 67,0 % 11 855 64,0 %
2 142 23,1 % 2 554 22,8 % 3 040 25,7 % Medium risk 5 118 23,0 % 4 068 19,7 % 3 708 20,0 %
1 190 12,9 % 1 732 15,5 % 2 006 17,0 % High risk 2 633 11,8 % 2 380 11,5 % 1 983 10,7 %
443 4,8 % 275 2,5 % 121 1,0 % Unclassified 152 0,7 % 276 1,3 % 931 5,0 %
9 210 11 103 11 744 Total non-matured or written down 22 207 20 593 18 477
47 0,5 % 92 0,8 % 64 0,5 % Commitm. in default and write-downs comm. 64 0,3 % 93 0,4 % 50 0,3 %
9 257 100 % 11 195 100 % 11 808 100 % Total retail banking customers 22 271 100 % 20 686 100 % 18 527 100 %
Corporate customers:
6 846 56,8 % 7 727 61,8 % 7 450 55,8 % Low risk 7 541 56,1 % 7 805 62,0 % 6 925 57,1 %
4 044 33,6 % 3 837 30,7 % 3 628 27,2 % Medium risk 3 628 27,0 % 3 837 30,5 % 4 044 33,4 %
746 6,2 % 755 6,0 % 1 818 13,6 % High risk 1 818 13,5 % 755 6,0 % 746 6,2 %
140 1,2 % 27 0,2 % 292 2,2 % Unclassified 292 2,2 % 27 0,2 % 140 1,2 %
11 776 12 346 13 188 Total non-matured or written down 13 279 12 425 11 855
270 2,2 % 165 1,3 % 167 1,3 % Commitm. in default and write-downs comm. 167 1,2 % 165 1,3 % 270 2,2 %
12 046 100 % 12 511 100 % 13 355 100 % Total corporate customers 13 446 100 % 12 590 100 % 12 125 100 %
21 303 23 707 25 163 Total gross loans 35 717 33 276 30 652
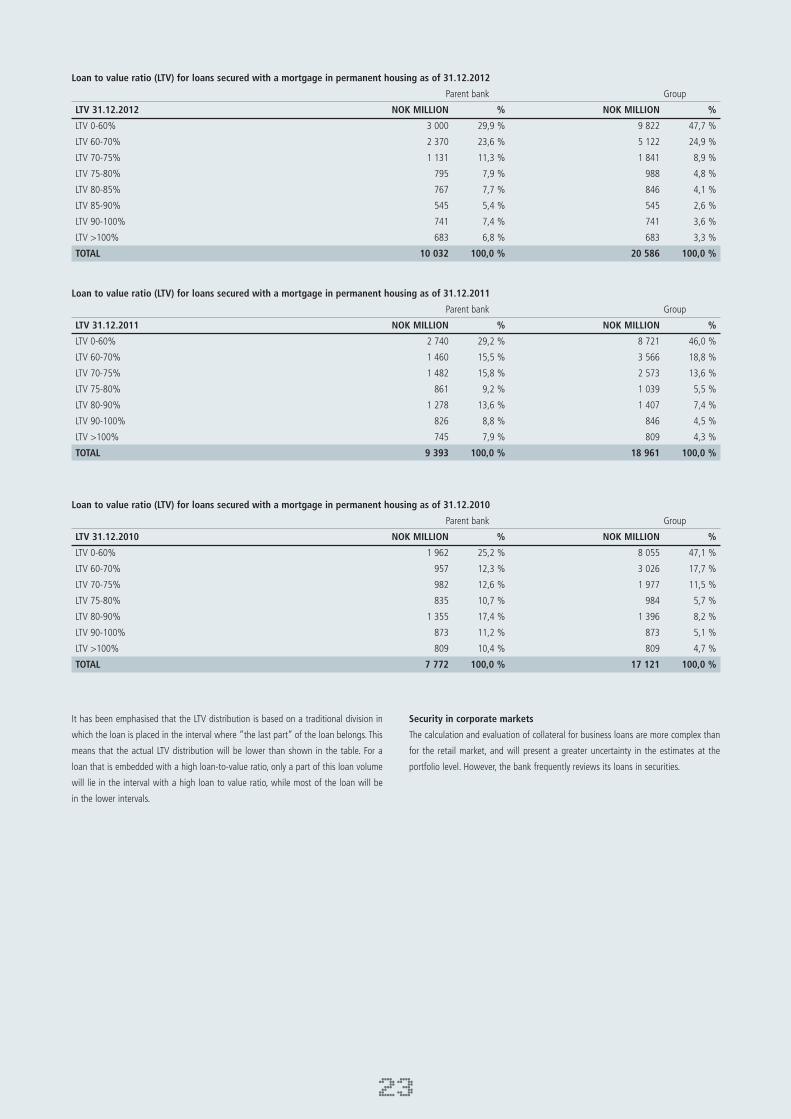
23
It has been emphasised that the LTV distribution is based on a traditional division in
which the loan is placed in the interval where ”the last part” of the loan belongs. This
means that the actual LTV distribution will be lower than shown in the table. For a
loan that is embedded with a high loan-to-value ratio, only a part of this loan volume
will lie in the interval with a high loan to value ratio, while most of the loan will be
in the lower intervals.
Security in corporate markets
The calculation and evaluation of collateral for business loans are more complex than
for the retail market, and will present a greater uncertainty in the estimates at the
portfolio level. However, the bank frequently reviews its loans in securities.
Loan to value ratio (LTV) for loans secured with a mortgage in permanent housing as of 31.12.2012
Parent bank Group
LTV 31.12.2012 NOK MILLION % NOK MILLION %
LTV 0-60% 3 000 29,9 % 9 822 47,7 %
LTV 60-70% 2 370 23,6 % 5 122 24,9 %
LTV 70-75% 1 131 11,3 % 1 841 8,9 %
LTV 75-80% 795 7,9 % 988 4,8 %
LTV 80-85% 767 7,7 % 846 4,1 %
LTV 85-90% 545 5,4 % 545 2,6 %
LTV 90-100% 741 7,4 % 741 3,6 %
LTV >100% 683 6,8 % 683 3,3 %
TOTAL 10 032 100,0 % 20 586 100,0 %
Loan to value ratio (LTV) for loans secured with a mortgage in permanent housing as of 31.12.2011
Parent bank Group
LTV 31.12.2011 NOK MILLION % NOK MILLION %
LTV 0-60% 2 740 29,2 % 8 721 46,0 %
LTV 60-70% 1 460 15,5 % 3 566 18,8 %
LTV 70-75% 1 482 15,8 % 2 573 13,6 %
LTV 75-80% 861 9,2 % 1 039 5,5 %
LTV 80-90% 1 278 13,6 % 1 407 7,4 %
LTV 90-100% 826 8,8 % 846 4,5 %
LTV >100% 745 7,9 % 809 4,3 %
TOTAL 9 393 100,0 % 18 961 100,0 %
Loan to value ratio (LTV) for loans secured with a mortgage in permanent housing as of 31.12.2010
Parent bank Group
LTV 31.12.2010 NOK MILLION % NOK MILLION %
LTV 0-60% 1 962 25,2 % 8 055 47,1 %
LTV 60-70% 957 12,3 % 3 026 17,7 %
LTV 70-75% 982 12,6 % 1 977 11,5 %
LTV 75-80% 835 10,7 % 984 5,7 %
LTV 80-90% 1 355 17,4 % 1 396 8,2 %
LTV 90-100% 873 11,2 % 873 5,1 %
LTV >100% 809 10,4 % 809 4,7 %
TOTAL 7 772 100,0 % 17 121 100,0 %

NOTE 5 – INTEREST RATE RISK
Interest rate risk occurs in connection with the Bank’s ordinary lending and borrowing
activities and in relation to the activities in the Norwegian and international money
and capital markets. Interest risk may occur when reprising dates on assets and
liabilities also including off-balance instruments, are not matched. An interest risk limit
has been adopted by the Board of Directors, and is measured as a maximum loss as a
result of a parallel displacement of the yield curve by two percentage point. The bank
has in quarterly reporting to the Board. With the monitoring of interest rates risk in
relation to established frameworks, it is considered that interest rate risk on positions
with a remaining fixed interest period is longer than six months. Interest rate exposure
was as at the end of December far lower than the risk limit adopted by the Board. The
Bank’s interest rate position meant that any rate increase was projected to provide a
positive contribution equivalent to NOK 4.7 million as of 31.12.2012.
Interest rate risk is managed by the choice of fixed interest rates of assets and liabilities
and the use of financial derivatives.
INTEREST RATE SENSITIVITY
The table indicates the effect on Bank earnings by 2 percentage points, an interest
rate rise parallel to the Bank’s total interest positions. According to the Bank’s internal
regulations to this effect, the amount is a maximum of NOK 50 million. The table
shows the results at the end of the last 3 years.
Parent bank Group
31.12.10 31.12.11 31.12.12 NOK MILLION 31.12.12 31.12.11 31.12.10
3 6 5 Interest rate change 2%-points 5 6 3
3 6 5 Total 5 6 3
NOTE 6 – LIQUIDITY RISK
Funding risk is defined as the risk of the Bank being unable to meet its obligations
at maturity. The Bank’s funding risk is in general low in 2012. This was illustrated
by the fact that a high proportion of the Bank’s loans were funded on a long-term
basis. Long-term funding is defined as customer deposits, funding from the money-
and capital markets with maturities in excess of 12 months, coupled with unutilised
committed drawing rights facilities. The bank must at all time have sufficient liquid
assets in order to meet its obligations. As of 31.12.2012, the bank’s holdings of debt
securities, held to manage the bank’s liquidity risk, stood at NOK 6,969 million. The
investment portfolio provides the bank a borrowing facility from Norges Bank of
NOK 4,702 miillion. The Bank’s targets with regard to the composition and size of
its liquidity reserves have been adopted by the Board of Directors. Other benchmark
figures agreed by the Board of Directors, applied to the Bank’s operational activities,
are guidelines for its refinancing requirement within different time intervals. In
addition to diversification with regard to different maturities, the Bank has a policy to
obtain its funding from different markets and through different instruments. In 2012,
the Bank’s funding structure complied with all requirements introduced by law and by
the Bank’s Board of Directors.
BALANCE SHEET ITEMS GAINED AFTER REMAINING MATURITY
The table shows credits and flexible loans as loans and receivables to customers with
a maturity of one month, because there is no agreed repayment time on the loans. In
the same way, deposits and loans to customers with no fixed term are presented in the
column for a maturity of one month. In the ongoing management of liquidity risk, other
assumptions are placed with respect to the maturity date of these balance sheet items.
REMAINING TIME TO MATURITY OF KEY ITEMS IN THE BALANCE SHEET AS OF 31.12.2012 - GROUP
Up to From 1 to 3 months- From 1year Over
NOK MILLION Total 1 month 3 months to 1 year to 5 years 5 years Undefined
Assets
Cash-in-hand and claims on the Central Bank 475 438 37
Loans to and claims on financial institutions 19 19
Loans to and claims on customers 35 573 11 028 863 948 3 815 19 064 -144
Bonds and certificates 7 126 351 464 1 497 4 307 507
Other assets 439 194 245
Total Assets 43 634 12 030 1 327 2 444 8 122 19 571 138
Liabilities / non-derivative obligations
Liabilities to financial institutions 5 304 891 898 3 516
Deposits from and liabilities to customers 19 378 18 466 809 104
Borrowings through the issuance of securities 15 213 604 2 435 12 174
Other liabilities 489 131 194 76 3 86
Subordinated loan capital 500 500
Total liabilities 40 884 20 091 1 002 3 513 15 692 500 86
Derivative obligations
Financial derivatives gross settlement
Payments -1 163 -444 -580 -139
Payment received 1 152 440 572 139
Total derivative obligations -12 -4 -7 0 0 0 0
As of 31.12.2012, unused credit facilities on approved credit, credit cards and guarantees amounted to NOK 4,272 million, while issued guarantees stood at NOK 819 million.
24
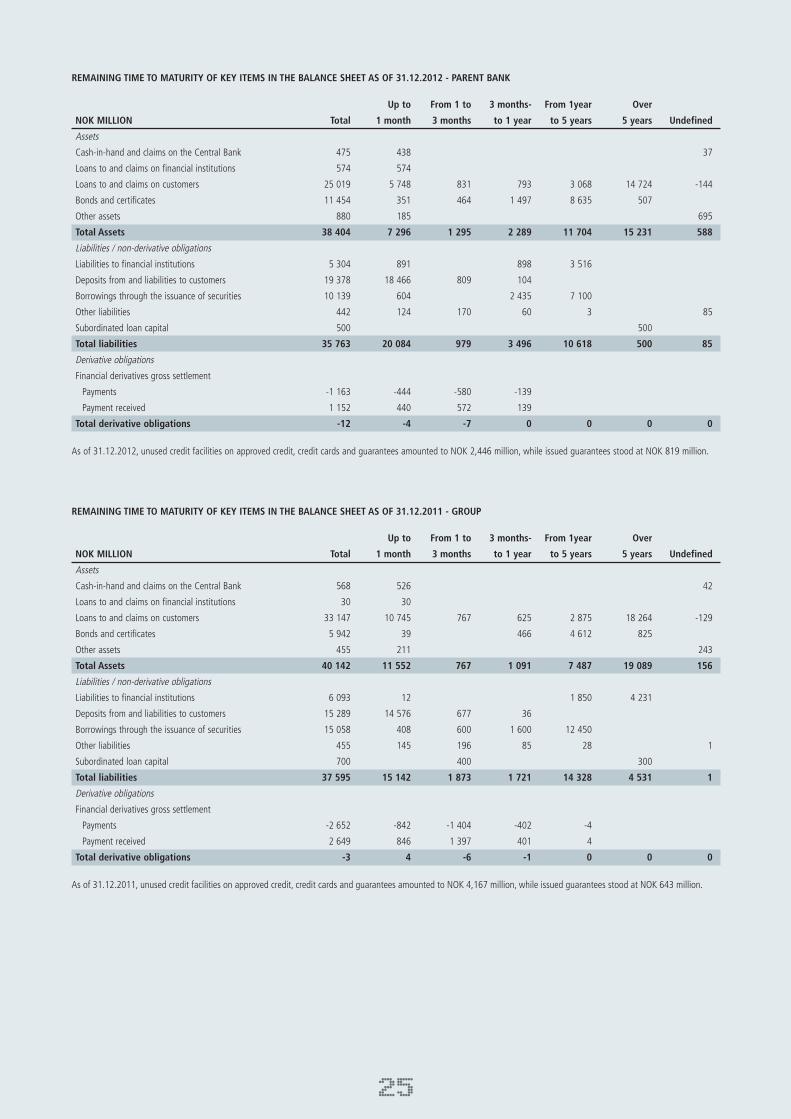
25
REMAINING TIME TO MATURITY OF KEY ITEMS IN THE BALANCE SHEET AS OF 31.12.2012 - PARENT BANK
Up to From 1 to 3 months- From 1year Over
NOK MILLION Total 1 month 3 months to 1 year to 5 years 5 years Undefined
Assets
Cash-in-hand and claims on the Central Bank 475 438 37
Loans to and claims on financial institutions 574 574
Loans to and claims on customers 25 019 5 748 831 793 3 068 14 724 -144
Bonds and certificates 11 454 351 464 1 497 8 635 507
Other assets 880 185 695
Total Assets 38 404 7 296 1 295 2 289 11 704 15 231 588
Liabilities / non-derivative obligations
Liabilities to financial institutions 5 304 891 898 3 516
Deposits from and liabilities to customers 19 378 18 466 809 104
Borrowings through the issuance of securities 10 139 604 2 435 7 100
Other liabilities 442 124 170 60 3 85
Subordinated loan capital 500 500
Total liabilities 35 763 20 084 979 3 496 10 618 500 85
Derivative obligations
Financial derivatives gross settlement
Payments -1 163 -444 -580 -139
Payment received 1 152 440 572 139
Total derivative obligations -12 -4 -7 0 0 0 0
REMAINING TIME TO MATURITY OF KEY ITEMS IN THE BALANCE SHEET AS OF 31.12.2011 - GROUP
Up to From 1 to 3 months- From 1year Over
NOK MILLION Total 1 month 3 months to 1 year to 5 years 5 years Undefined
Assets
Cash-in-hand and claims on the Central Bank 568 526 42
Loans to and claims on financial institutions 30 30
Loans to and claims on customers 33 147 10 745 767 625 2 875 18 264 -129
Bonds and certificates 5 942 39 466 4 612 825
Other assets 455 211 243
Total Assets 40 142 11 552 767 1 091 7 487 19 089 156
Liabilities / non-derivative obligations
Liabilities to financial institutions 6 093 12 1 850 4 231
Deposits from and liabilities to customers 15 289 14 576 677 36
Borrowings through the issuance of securities 15 058 408 600 1 600 12 450
Other liabilities 455 145 196 85 28 1
Subordinated loan capital 700 400 300
Total liabilities 37 595 15 142 1 873 1 721 14 328 4 531 1
Derivative obligations
Financial derivatives gross settlement
Payments -2 652 -842 -1 404 -402 -4
Payment received 2 649 846 1 397 401 4
Total derivative obligations -3 4 -6 -1 0 0 0
As of 31.12.2012, unused credit facilities on approved credit, credit cards and guarantees amounted to NOK 2,446 million, while issued guarantees stood at NOK 819 million.
As of 31.12.2011, unused credit facilities on approved credit, credit cards and guarantees amounted to NOK 4,167 million, while issued guarantees stood at NOK 643 million.

REMAINING TIME TO MATURITY OF KEY ITEMS IN THE BALANCE SHEET AS OF 31.12.2011 - PARENT BANK
Up to From 1 to 3 months- From 1year Over
NOK MILLION Total 1 month 3 months to 1 year to 5 years 5 years Undefined
Assets
Cash-in-hand and claims on the Central Bank 568 526 42
Loans to and claims on financial institutions 667 667
Loans to and claims on customers 23 579 5 704 739 498 2 217 14 550 -129
Bonds and certificates 10 477 39 466 9 147 825
Other assets 885 201 684
Total Assets 36 176 7 137 739 964 11 364 15 375 597
Liabilities / non-derivative obligations
Liabilities to financial institutions 6 093 12 1 850 4 231
Deposits from and liabilities to customers 15 289 14 576 677 36
Borrowings through the issuance of securities 11 193 408 600 1 600 8 585
Other liabilities 423 133 180 82 28 1
Subordinated loan capital 700 400 300
Total liabilities 33 697 15 129 1 857 1 718 10 463 4 531 1
Derivative obligations
Financial derivatives gross settlement
Payments -2 652 -842 -1 404 -402 -4
Payment received 2 649 846 1 397 401 4
Total derivative obligations -3 4 -6 -1 0 0 0
REMAINING TIME TO MATURITY OF KEY ITEMS IN THE BALANCE SHEET AS OF 31.12.2010 - GROUP
Up to From 1 to 3 months- From 1year Over
NOK MILLION Total 1 month 3 months to 1 year to 5 years 5 years Undefined
Assets
Cash-in-hand and claims on the Central Bank 1 190 1 144 47
Loans to and claims on financial institutions 107 107
Loans to and claims on customers 30 503 9 324 998 624 2 741 16 966 -149
Bonds and certificates 4 373 97 225 347 2 997 706
Other assets 360 134 226
Total Assets 36 534 10 806 1 223 971 5 737 17 672 124
Liabilities / non-derivative obligations
Liabilities to financial institutions 6 152 71 6 081
Deposits from and liabilities to customers 15 289 12 657 1 575 1 057
Borrowings through the issuance of securities 12 053 800 2 168 9 085
Other liabilities 674 156 195 119 160 38 5
Subordinated loan capital 700 700
Total liabilities 34 868 12 884 2 570 3 344 15 326 738 5
Derivative obligations
Financial derivatives gross settlement
Payments -2 426 -1 051 -1 011 -357 -8
Payment received 2 399 1 031 1 005 356 7
Total derivative obligations -27 -20 -6 -1 0 0 0
As of 31.12.2011, unused credit facilities on approved credit, credit and guarantees amounted to NOK 2,761 million, while issued guarantees stood at NOK 643 million.
As of 31.12.2010, unused credit facilities on approved credit, credit cards and guarantees amounted to NOK 3,858 million, while issued guarantees stood at NOK 485 million.
26

27
REMAINING TIME TO MATURITY OF KEY ITEMS IN THE BALANCE SHEET AS OF 31.12.2010 - PARENT BANK
Up to From 1 to 3 months- From 1year Over
NOK MILLION Total 1 month 3 months to 1 year to 5 years 5 years Undefined
Assets
Cash-in-hand and claims on the Central Bank 1 191 1 144 47
Loans to and claims on financial institutions 696 696
Loans to and claims on customers 21 154 4 842 966 471 1 976 13 049 -149
Bonds and certificates 10 772 97 225 347 6 396 3 706
Other assets 654 127 527
Total Assets 34 467 6 906 1 191 818 8 372 16 756 425
Liabilities / non-derivative obligations
Liabilities to financial institutions 6 152 71 6 081
Deposits from and liabilities to customers 15 289 12 657 1 575 1 057
Borrowings through the issuance of securities 10 053 800 2 168 7 085
Other liabilities 424 135 164 74 50 2
Subordinated loan capital 700 700
Total liabilities 32 618 12 863 2 539 3 299 13 216 700 2
Derivative obligations
Financial derivatives gross settlement
Payments -2 426 -1 051 -1 011 -357 -8
Payment received 2 399 1 031 1 005 356 7
Total derivative obligations -27 -20 -6 -1 0 0 0
1) Pluss Boligkreditt AS has the opportunity to extend the term to maturity by one year.
As of 31.12.2010, unused credit facilities on approved credit, credit cards and guarantees amounted to NOK 2,609 million, while issued guarantees stood at NOK 485 million.
MATURITY STRUCTURE OF ISSUED BONDS AS OF 31.12.2012
NOK MILLION
Fair Recognised Reference- Repayment Final
ISIN Number Ticker Nominal Owned value value rate structure maturity
NO0010561590 PLUG 31 PRO 604 604 604 NIBOR 3 months No installment 15.01.2013
NO0010590722 PLUG 34 PRO 1 000 1 002 1 000 NIBOR 3 months No installment 03.05.2013
NO0010389687 PLUG 22 PRO 800 823 818 Fixed No installment 08.10.2013
NO0010470636 PLUG 29 PRO 635 645 636 NIBOR 3 months No installment 30.10.2013
NO0010601164 PLUG 36 PRO 1 000 1 007 1 000 NIBOR 3 months No installment 25.08.2014
NO0010627623 PLUG 39 PRO 700 709 700 NIBOR 3 months No installment 17.10.2014
NO0010629124 PLUG 40 PRO 1 000 1 013 1 000 NIBOR 3 months No installment 18.02.2015
NO0010580533 PLUG 33 PRO 800 838 828 Fixed No installment 25.09.2015
NO0010605454 PLUG 37 PRO 800 854 859 Fixed No installment 30.03.2016
NO0010609720 PLUG 38 PRO 800 802 794 NIBOR 3 months No installment 09.05.2016
NO0010599731 PLUG 35 PRO 1 000 1 067 1 068 Fixed No installment 11.08.2016
NO0010664956 PLUG 41 PRO 1 000 998 999 NIBOR 3 months No installment 30.11.2017
Issued by Parent bank 10 139 - 10 363 10 304
NO0010503428 PLBK06 1 000 884 1 006 116 NIBOR 3 months No installment 26.09.20141)
NO0010520406 PLBK05 1 000 939 1 013 61 NIBOR 3 months No installment 16.03.20151)
NO0010572118 PLBK01 1 000 1 009 999 NIBOR 3 months No installment 23.04.20151)
NO0010503410 PLBK09 900 814 907 87 NIBOR 3 months No installment 28.09.20151)
NO0010575210 PLBK02 500 506 500 NIBOR 3 months No installment 26.11.20151)
NO0010593437 PLBK03 1 000 1 009 1 000 NIBOR 3 months No installment 14.12.20151)
NO0010512502 PLBK08 1 000 939 1 011 62 NIBOR 3 months No installment 14.12.20151)
NO0010515406 PLBK07 1 000 751 1 010 249 NIBOR 3 months No installment 16.03.20161)
NO0010605801 PLBK10 1 000 1 010 999 NIBOR 3 months No installment 30.03.20161)
NO0010641624 PLBK11 1 000 1 012 1 002 NIBOR 3 months No installment 28.03.20171)
Issued by Pluss Boligkreditt AS 9 400 4 326 9 493 5 073
Total bonds 19 539 4 326 19 855 15 377
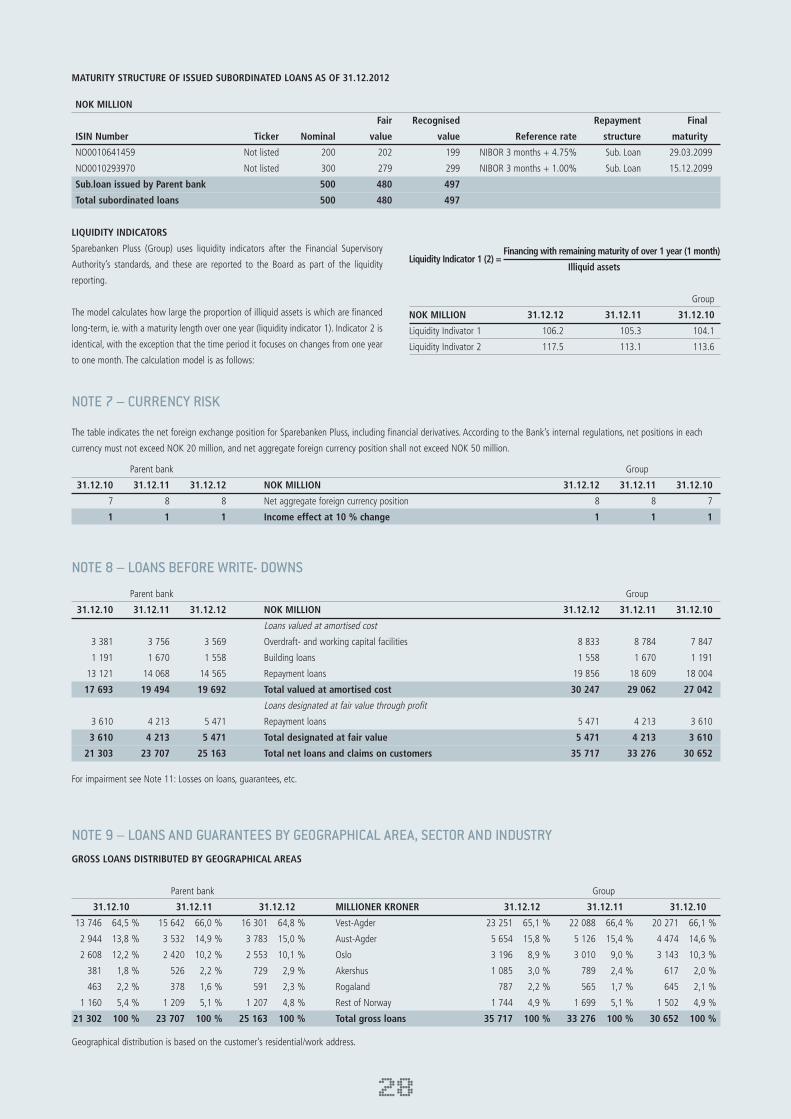
Parent bank Group
31.12.10 31.12.11 31.12.12 NOK MILLION 31.12.12 31.12.11 31.12.10
7 8 8 Net aggregate foreign currency position 8 8 7
1 1 1 Income effect at 10 % change 1 1 1
NOTE 7 – CURRENCY RISK
The table indicates the net foreign exchange position for Sparebanken Pluss, including financial derivatives. According to the Bank’s internal regulations, net positions in each
currency must not exceed NOK 20 million, and net aggregate foreign currency position shall not exceed NOK 50 million.
Parent bank Group
31.12.10 31.12.11 31.12.12 NOK MILLION 31.12.12 31.12.11 31.12.10
Loans valued at amortised cost
3 381 3 756 3 569 Overdraft- and working capital facilities 8 833 8 784 7 847
1 191 1 670 1 558 Building loans 1 558 1 670 1 191
13 121 14 068 14 565 Repayment loans 19 856 18 609 18 004
17 693 19 494 19 692 Total valued at amortised cost 30 247 29 062 27 042
Loans designated at fair value through profit
3 610 4 213 5 471 Repayment loans 5 471 4 213 3 610
3 610 4 213 5 471 Total designated at fair value 5 471 4 213 3 610
21 303 23 707 25 163 Total net loans and claims on customers 35 717 33 276 30 652
NOTE 8 – LOANS BEFORE WRITE- DOWNS
For impairment see Note 11: Losses on loans, guarantees, etc.
Geographical distribution is based on the customer’s residential/work address.
NOTE 9 – LOANS AND GUARANTEES BY GEOGRAPHICAL AREA, SECTOR AND INDUSTRY
28
GROSS LOANS DISTRIBUTED BY GEOGRAPHICAL AREAS
Parent bank Group
31.12.10 31.12.11 31.12.12 MILLIONER KRONER 31.12.12 31.12.11 31.12.10
13 746 64,5 % 15 642 66,0 % 16 301 64,8 % Vest-Agder 23 251 65,1 % 22 088 66,4 % 20 271 66,1 %
2 944 13,8 % 3 532 14,9 % 3 783 15,0 % Aust-Agder 5 654 15,8 % 5 126 15,4 % 4 474 14,6 %
2 608 12,2 % 2 420 10,2 % 2 553 10,1 % Oslo 3 196 8,9 % 3 010 9,0 % 3 143 10,3 %
381 1,8 % 526 2,2 % 729 2,9 % Akershus 1 085 3,0 % 789 2,4 % 617 2,0 %
463 2,2 % 378 1,6 % 591 2,3 % Rogaland 787 2,2 % 565 1,7 % 645 2,1 %
1 160 5,4 % 1 209 5,1 % 1 207 4,8 % Rest of Norway 1 744 4,9 % 1 699 5,1 % 1 502 4,9 %
21 302 100 % 23 707 100 % 25 163 100 % Total gross loans 35 717 100 % 33 276 100 % 30 652 100 %
MATURITY STRUCTURE OF ISSUED SUBORDINATED LOANS AS OF 31.12.2012
NOK MILLION
Fair Recognised Repayment Final
ISIN Number Ticker Nominal value value Reference rate structure maturity
NO0010641459 Not listed 200 202 199 NIBOR 3 months + 4.75% Sub. Loan 29.03.2099
NO0010293970 Not listed 300 279 299 NIBOR 3 months + 1.00% Sub. Loan 15.12.2099
Sub.loan issued by Parent bank 500 480 497
Total subordinated loans 500 480 497
LIQUIDITY INDICATORS
Sparebanken Pluss (Group) uses liquidity indicators after the Financial Supervisory
Authority’s standards, and these are reported to the Board as part of the liquidity
reporting.
The model calculates how large the proportion of illiquid assets is which are financed
long-term, ie. with a maturity length over one year (liquidity indicator 1). Indicator 2 is
identical, with the exception that the time period it focuses on changes from one year
to one month. The calculation model is as follows:
Liquidity Indicator 1 (2) = Financing with remaining maturity of over 1 year (1 month)
Illiquid assets
Group
NOK MILLION 31.12.12 31.12.11 31.12.10
Liquidity Indivator 1 106.2 105.3 104.1
Liquidity Indivator 2 117.5 113.1 113.6

WARRANTIES DISTRIBUTED BY SECTORS AND INDUSTRIES
Parent bank Group
31.12.10 31.12.11 31.12.12 NOK MILLION 31.12.12 31.12.11 31.12.10
12 13 27 Retail banking customers 27 13 12
473 630 792 Corporate customers 792 630 473
485 643 819 Total commitments 819 643 485
1 0 0 Agriculture, forestry and fishing 0 0 1
55 50 60 Industry, incl.manufacturing industry 60 50 55
131 164 122 Building and construction 122 164 131
46 47 45 Retail and wholesale trade 45 47 46
3 3 4 Hotel- and restaurant industry 4 3 3
21 21 21 Transport 21 21 21
102 234 344 Real estate management 344 234 102
62 69 148 Rental of real estate and housing 148 69 62
19 17 17 Professional and business services 17 17 19
32 24 5 Other services 5 24 32
0 0 26 Organisations 26 0 0
1 1 0 Central and local government adm. 0 1 1
473 630 792 Total corporate customers 792 630 473
29
GROSS LOANS DISTRIBUTED BY SECTORS AND INDUSTRIES
Parent bank Group
31.12.10 31.12.11 31.12.12 NOK MILLION 31.12.12 31.12.11 31.12.10
9 257 11 195 11 808 Retail banking customers 22 271 20 686 18 527
12 046 12 512 13 355 Corporate customers 13 446 12 590 12 125
21 303 23 708 25 163 Total commitments 35 717 33 276 30 652
93 99 105 Agriculture, forestry and fishing 128 121 107
199 231 235 Industry, incl.manufacturing industry 236 232 201
406 356 353 Building and construction 374 370 419
331 360 394 Retail and wholesale trade 404 368 335
43 34 28 Hotel- and restaurant industry 29 35 45
87 104 98 Transport 99 108 93
1 330 1 458 1 616 Real estate management 1 616 1 458 1 330
5 425 6 208 6 620 Rental of real estate and housing 6 621 6 209 5 429
627 463 511 Professional and business services 519 472 637
445 514 656 Other services 680 532 469
2 647 2 309 2 345 Organisations 2 345 2 309 2 647
413 376 395 Central and local government adm. 395 376 413
12 046 12 512 13 355 Total corporate customers 13 446 12 590 12 125
Parent bank Group
31.12.10 31.12.11 31.12.12 NOK MILLION 31.12.12 31.12.11 31.12.10
10 325 12 265 12 946 Retail banking customers 24 962 23 163 20 844
14 072 14 845 15 742 Corporate customers 15 847 14 923 14 151
24 397 27 110 28 688 Total commitments 40 809 38 086 34 995
106 113 124 Agriculture, forestry and fishing 148 135 120
436 470 453 Industry, incl.manufacturing industry 454 471 438
750 795 685 Building and construction 710 809 763
530 536 573 Retail and wholesale trade 584 543 534
48 39 34 Hotel- and restaurant industry 35 41 50
119 139 131 Transport 132 143 125
1 677 2 002 2 242 Real estate management 2 242 2 002 1 677
5 800 6 648 7 201 Rental of real estate and housing 7 202 6 649 5 804
702 544 584 Professional and business services 596 554 712
570 604 695 Other services 723 622 594
2 918 2 575 2 624 Organisations 2 624 2 575 2 918
416 379 395 Central and local government adm. 395 379 416
14 072 14 845 15 742 Total corporate customers 15 847 14 923 14 151
TOTAL COMMITMENT DISTRIBUTED BY SECTORS AND INDUSTRIES
The total commitment includes the balance of approved loans and credits to customers, any unused portion of approved loans and guarantee limits and established guarantees.

POTENTIAL EXPOSURE BY SECTORS AND INDUSTRIES
Potential exposure consists of undrawn credit facilities on approved credit, credit cards and guarantee limits.
Parent bank Group
31.12.10 31.12.11 31.12.12 NOK MILLION 31.12.12 31.12.11 31.12.10
1 056 1 057 1 110 Retail banking customers 2 663 2 463 2 305
1 553 1 704 1 599 Corporate customers 1 608 1 704 1 553
2 609 2 761 2 709 Total commitments 4 271 4 167 3 858
13 14 19 Agriculture, forestry and fishing 20 14 13
182 191 158 Industry, incl.manufacturing industry 159 191 182
212 277 214 Building and construction 214 277 212
154 133 134 Retail and wholesale trade 134 133 154
3 3 2 Hotel- and restaurant industry 2 3 3
11 14 12 Transport 12 14 11
244 312 282 Real estate management 282 312 244
314 372 433 Rental of real estate and housing 433 372 314
58 70 57 Professional and business services 60 70 58
117 73 34 Other services 39 73 117
244 243 253 Organisations 253 243 244
1 1 1 Central and local government adm. 1 1 1
1 553 1 704 1 599 Total corporate customers 1 608 1 704 1 553
Parent bank Retail banking market Group
31.12.10 31.12.11 31.12.12 NOK MILLION 31.12.12 31.12.11 31.12.10
29 24 15 Gross defaulted loans 31 - 60 days. 18 25 32
3 41 1 Gross defaulted loans 61 - 90 days. 1 41 3
13 15 30 Gross defaulted loans > 90 days. 30 15 13
45 80 46 Gross defaulted loans / credits 48 81 48
0 1 2 - Specific write-downs 2 1 0
45 79 44 Net defaulted loans / credits 46 80 48
0,0 % 1,3 % 4,4 % Provision ratio defaulted loans 4,1 % 1,2 % 0,0 %
Parent bank Corporate banking market Group
31.12.10 31.12.11 31.12.12 NOK MILLION 31.12.12 31.12.11 31.12.10
74 7 0 Gross defaulted loans 31 - 60 days. 0 7 74
0 6 0 Gross defaulted loans 61 - 90 days. 0 6 0
78 110 86 Gross defaulted loans > 90 days. 86 110 78
152 123 86 Gross defaulted loans / credits 86 123 152
34 24 29 - Specific write-downs 29 24 34
118 99 57 Net defaulted loans / credits 57 99 118
22,4 % 19,5 % 33,7 % Provision ratio defaulted loans 33,7 % 19,5 % 22,4 %
Parent bank Total defaulted loans/credits Group
31.12.10 31.12.11 31.12.12 NOK MILLION 31.12.12 31.12.11 31.12.10
103 31 15 Gross defaulted loans 31 - 60 days. 18 32 106
3 47 1 Gross defaulted loans 61 - 90 days. 1 47 3
91 125 116 Gross defaulted loans > 90 days. 116 125 91
197 203 132 Gross defaulted loans / credits 134 204 200
34 25 31 - Specific write-downs 31 25 34
163 178 101 Net defaulted loans / credits 104 179 166
17,3 % 12,3 % 23,4 % Provision ratio defaulted loans 23,0 % 12,3 % 17,0 %
0,43 % 0,53 % 0,46 % Gross defaulted loans >90 days as % of gross loans 0,32 % 0,38 % 0,30 %
NOTE 10 – DEFAULTED LOANS
A client’s commitment is considered to be in default if a payment is not paid within 30
days after the due date, or a frame credit has been overdrawn for more than 30 days.
Default is also deemed to be available when debt negotiation or bankruptcy has been
opened, or legal steps have been taken to collect the claim. When a customer has one
or more non-performing loans, it is the customer’s total debit involvement as reported
as in default and not the individual loan.
When there is a default, objective evidence implies that the need for impairment loss
should be considered.
The total non-performing loans to customers was the fair value of its mortgage debts rates. As at 31.12.2012 it was NOK 147.9 million, as at 31.12.2011 it was NOK 141.6 mil-
lion and as at 31.12.2010 it was NOK 134.4 million.
30

Parent bank Other bad and doubtful loans/credits Group
31.12.10 31.12.11 31.12.12 NOK MILLION 31.12.12 31.12.11 31.12.10
119 55 97 Not defaulted commitments with write-downs 97 55 119
23 12 21 - Specific write-downs 21 12 23
96 43 76 Net other bad and doubtful loans 76 43 96
19,3 % 21,8 % 22,0 % Provision ratio not defaulted loans 22,0 % 21,8 % 19,3 %
Other doubtful commitments
Commitments that are not in default, but where the customer’s financial situation means that the Bank has made individual loan loss write-downs, or it is highly probable that the
Bank must make loan loss write-downs, are classified as doubtful.
Parent bank Group
31.12.10 31.12.11 31.12.12 NOK MILLION 31.12.12 31.12.11 31.12.10
45 80 46 Retail banking customers 48 81 48
152 123 86 Corporate customers 86 123 152
197 203 132 Total commitments 134 204 200
Agriculture, forestry and fishing
1 Industry, incl.manufacturing industry 1
23 8 3 Building and construction 3 8 23
1 1 Retail and wholesale trade 1 1
Hotel- and restaurant industry
Transport
54 25 5 Real estate management 5 25 54
50 89 75 Rental of real estate and housing 75 89 50
1 Professional and business services 1
23 1 Other services 1 23
Organisations
Central and local government adm.
152 123 86 Total corporate customers 86 123 152
GROSS NON-PERFORMING LOANS DISTRIBUTED BY SECTORS AND INDUSTRIES
31
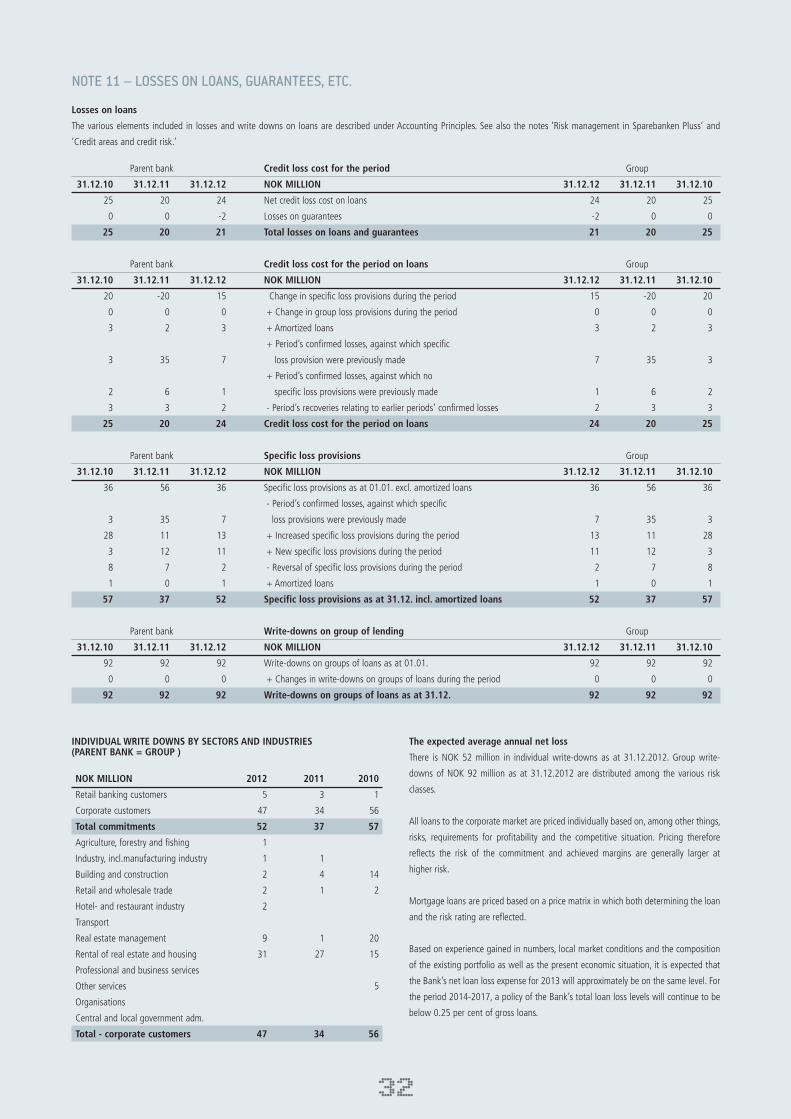
Parent bank Credit loss cost for the period Group
31.12.10 31.12.11 31.12.12 NOK MILLION 31.12.12 31.12.11 31.12.10
25 20 24 Net credit loss cost on loans 24 20 25
0 0 -2 Losses on guarantees -2 0 0
25 20 21 Total losses on loans and guarantees 21 20 25
Parent bank Credit loss cost for the period on loans Group
31.12.10 31.12.11 31.12.12 NOK MILLION 31.12.12 31.12.11 31.12.10
20 -20 15 Change in specific loss provisions during the period 15 -20 20
0 0 0 + Change in group loss provisions during the period 0 0 0
3 2 3 + Amortized loans 3 2 3
+ Period’s confirmed losses, against which specific
3 35 7 loss provision were previously made 7 35 3
+ Period’s confirmed losses, against which no
2 6 1 specific loss provisions were previously made 1 6 2
3 3 2 - Period’s recoveries relating to earlier periods’ confirmed losses 2 3 3
25 20 24 Credit loss cost for the period on loans 24 20 25
Parent bank Specific loss provisions Group
31.12.10 31.12.11 31.12.12 NOK MILLION 31.12.12 31.12.11 31.12.10
36 56 36 Specific loss provisions as at 01.01. excl. amortized loans 36 56 36
- Period’s confirmed losses, against which specific
3 35 7 loss provisions were previously made 7 35 3
28 11 13 + Increased specific loss provisions during the period 13 11 28
3 12 11 + New specific loss provisions during the period 11 12 3
8 7 2 - Reversal of specific loss provisions during the period 2 7 8
1 0 1 + Amortized loans 1 0 1
57 37 52 Specific loss provisions as at 31.12. incl. amortized loans 52 37 57
Parent bank Write-downs on group of lending Group
31.12.10 31.12.11 31.12.12 NOK MILLION 31.12.12 31.12.11 31.12.10
92 92 92 Write-downs on groups of loans as at 01.01. 92 92 92
0 0 0 + Changes in write-downs on groups of loans during the period 0 0 0
92 92 92 Write-downs on groups of loans as at 31.12. 92 92 92
NOTE 11 – LOSSES ON LOANS, GUARANTEES, ETC.
Losses on loans
The various elements included in losses and write downs on loans are described under Accounting Principles. See also the notes ‘Risk management in Sparebanken Pluss’ and
‘Credit areas and credit risk.’
INDIVIDUAL WRITE DOWNS BY SECTORS AND INDUSTRIES (PARENT BANK = GROUP )
NOK MILLION 2012 2011 2010
Retail banking customers 5 3 1
Corporate customers 47 34 56
Total commitments 52 37 57
Agriculture, forestry and fishing 1
Industry, incl.manufacturing industry 1 1
Building and construction 2 4 14
Retail and wholesale trade 2 1 2
Hotel- and restaurant industry 2
Transport
Real estate management 9 1 20
Rental of real estate and housing 31 27 15
Professional and business services
Other services 5
Organisations
Central and local government adm.
Total - corporate customers 47 34 56
The expected average annual net loss
There is NOK 52 million in individual write-downs as at 31.12.2012. Group write-
downs of NOK 92 million as at 31.12.2012 are distributed among the various risk
classes.
All loans to the corporate market are priced individually based on, among other things,
risks, requirements for profitability and the competitive situation. Pricing therefore
reflects the risk of the commitment and achieved margins are generally larger at
higher risk.
Mortgage loans are priced based on a price matrix in which both determining the loan
and the risk rating are reflected.
Based on experience gained in numbers, local market conditions and the composition
of the existing portfolio as well as the present economic situation, it is expected that
the Bank’s net loan loss expense for 2013 will approximately be on the same level. For
the period 2014-2017, a policy of the Bank’s total loan loss levels will continue to be
below 0.25 per cent of gross loans.
32

Covered bonds (OMF) are recognised in the balance of the Parent Bank as at
31.12.2010, 31.12.2011 and 31.12.2012. On 24 October 2008, the Government gave
the Ministry of Finance the authority to implement a scheme where the government
and banks replace Treasury Bills with covered bonds OMF, for an agreed period. Norges
Bank manages the scheme on behalf of the Ministry of Finance. At the end of the
agreement, banks are required to buy OMFs back from the state for the same price
they were sold for. Payments from OMFs are credited the same day that payments take
place, unless there is a breach of trade agreement. Sparebanken Pluss has purchased
bonds from Pluss Boligkreditt AS and used them as collateral for the settlement of
swap agreements with Norges Bank. The Bank is obligated to buy these bonds back for
the same price they were sold for. The Bank receives interest on OMFs, as if these were
not sold. Sparebanken Pluss has considered the requirement for the transfer of risk and
return of the bonds in accordance with IAS 39 is not met, so that bonds can not be
removed from the balance of the parent bank. On a consolidated basis, the bonds will
be treated as own bonds and eliminated against issued bonds in Pluss Boligkreditt AS.
Classification of financial investments
Certificates and bonds are rated externally. Where securities have an official rating that
will be used, in cases where the official rating does not exist an external broker will
provide a shadow rating as a basis for risk classification.
The Bank’s risk category Rating
Lowest risk AAA, AA+, AA og AA-
Low risk A+, A og A-
Medium risk BBB+, BBB og BBB-
High risk BB+, BB, BB-
Highest risk B+ and lower
NOTE 12 – CERTIFICATES, BONDS AND OTHER INTEREST-BEARING SECURITIES
Parent bank Group
31.12.10 31.12.11 31.12.12 NOK MILLION 31.12.12 31.12.11 31.12.10
Short-term investments valued at amortised cost
135 135 91 Certificates and bonds issued by others 91 135 135
4 608 4 326 4 152 Certificates and bonds issued by subsidiary 0 0 0
4 743 4 461 4 243 Total short-term investment valued at amortised cost 91 135 135
Short-term investments designated at fair value through profit
50 398 1 633 Certificates and bonds issued by public sector 1 633 398 50
4 188 5 385 5 433 Certificates and bonds issued by others 5 433 5 385 4 188
1 791 209 176 Certificates and bonds issued by subsidiary 0 0 0
6 029 5 992 7 241 Total short-term investment designated at fair value through profit 7 065 5 783 4 238
10 772 10 453 11 484 Short-term investment in securities 7 156 5 918 4 373
NOTE 13 – LIABILITIES TO CREDIT INSTITUTIONS
Parent bank Group
31.12.10 31.12.11 31.12.12 NOK MILLION 31.12.12 31.12.11 31.12.10
Liabilities to credit institutions valued at amortised cost
71 12 144 Loan and deposits from credit institutions without agreed maturity 144 12 71
6 081 6 081 5 161 Loan and deposits from credit institutions with agreed maturity 5 161 6 081 6 081
6 152 6 093 5 304 Liabilities to credit institutions valued at amortised cost 5 304 6 093 6 152
The loans and deposits from credit institutions with agreed maturity includes the liability related to the exchange scheme, see also the discussion in note 12.
CERTIFICATES AND BONDS
Parent bank Group
31.12.10 31.12.11 31.12.12 NOK MILLION 31.12.12 31.12.11 31.12.10
Certificates and bonds
8 970 9 740 10 793 Lowest risk 6 465 5 205 2 571
1 097 383 451 Low risk 451 383 1 097
705 330 240 Medium risk 240 330 705
0 0 0 High risk 0 0 0
0 0 0 Highest risk 0 0 0
10 772 10 453 11 484 Total certificates and bonds 7 156 5 918 4 373
33
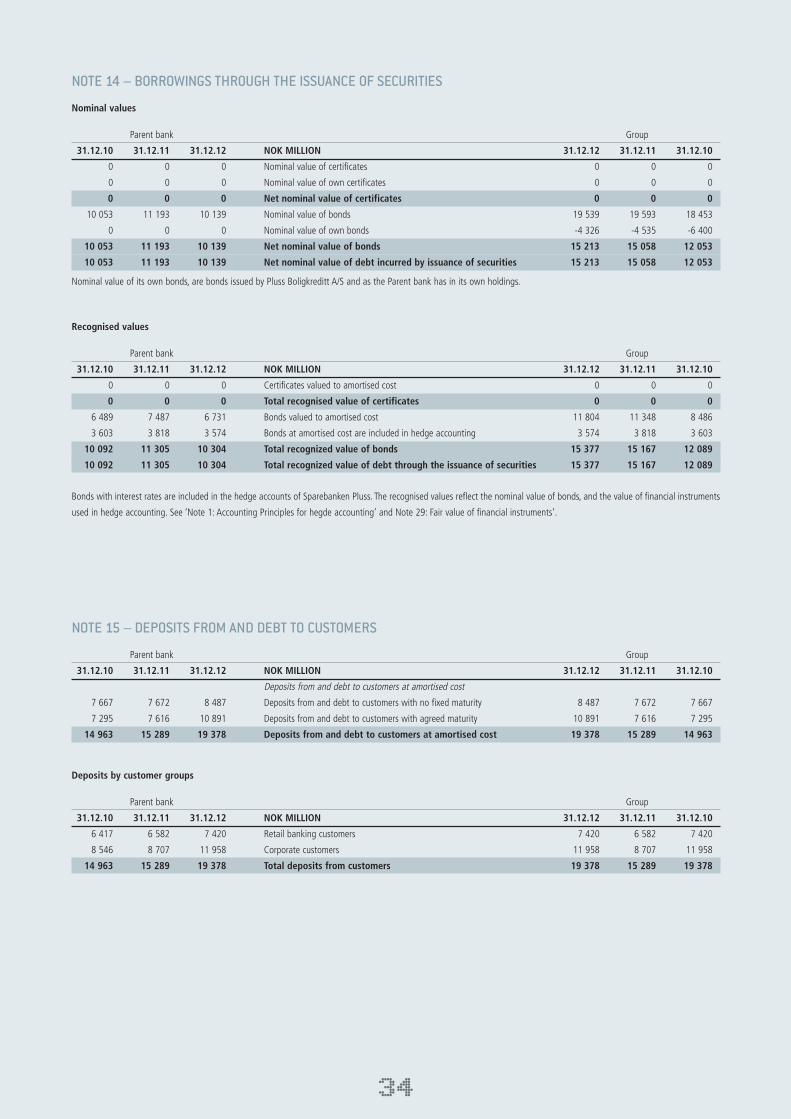
Parent bank Group
31.12.10 31.12.11 31.12.12 NOK MILLION 31.12.12 31.12.11 31.12.10
Deposits from and debt to customers at amortised cost
7 667 7 672 8 487 Deposits from and debt to customers with no fixed maturity 8 487 7 672 7 667
7 295 7 616 10 891 Deposits from and debt to customers with agreed maturity 10 891 7 616 7 295
14 963 15 289 19 378 Deposits from and debt to customers at amortised cost 19 378 15 289 14 963
Deposits by customer groups
Parent bank Group
31.12.10 31.12.11 31.12.12 NOK MILLION 31.12.12 31.12.11 31.12.10
6 417 6 582 7 420 Retail banking customers 7 420 6 582 7 420
8 546 8 707 11 958 Corporate customers 11 958 8 707 11 958
14 963 15 289 19 378 Total deposits from customers 19 378 15 289 19 378
NOTE 15 – DEPOSITS FROM AND DEBT TO CUSTOMERS
Recognised values
Parent bank Group
31.12.10 31.12.11 31.12.12 NOK MILLION 31.12.12 31.12.11 31.12.10
0 0 0 Certificates valued to amortised cost 0 0 0
0 0 0 Total recognised value of certificates 0 0 0
6 489 7 487 6 731 Bonds valued to amortised cost 11 804 11 348 8 486
3 603 3 818 3 574 Bonds at amortised cost are included in hedge accounting 3 574 3 818 3 603
10 092 11 305 10 304 Total recognized value of bonds 15 377 15 167 12 089
10 092 11 305 10 304 Total recognized value of debt through the issuance of securities 15 377 15 167 12 089
Bonds with interest rates are included in the hedge accounts of Sparebanken Pluss. The recognised values reflect the nominal value of bonds, and the value of financial instruments
used in hedge accounting. See ‘Note 1: Accounting Principles for hegde accounting’ and Note 29: Fair value of financial instruments’.
Nominal value of its own bonds, are bonds issued by Pluss Boligkreditt A/S and as the Parent bank has in its own holdings.
Nominal values
Parent bank Group
31.12.10 31.12.11 31.12.12 NOK MILLION 31.12.12 31.12.11 31.12.10
0 0 0 Nominal value of certificates 0 0 0
0 0 0 Nominal value of own certificates 0 0 0
0 0 0 Net nominal value of certificates 0 0 0
10 053 11 193 10 139 Nominal value of bonds 19 539 19 593 18 453
0 0 0 Nominal value of own bonds -4 326 -4 535 -6 400
10 053 11 193 10 139 Net nominal value of bonds 15 213 15 058 12 053
10 053 11 193 10 139 Net nominal value of debt incurred by issuance of securities 15 213 15 058 12 053
NOTE 14 – BORROWINGS THROUGH THE ISSUANCE OF SECURITIES
34
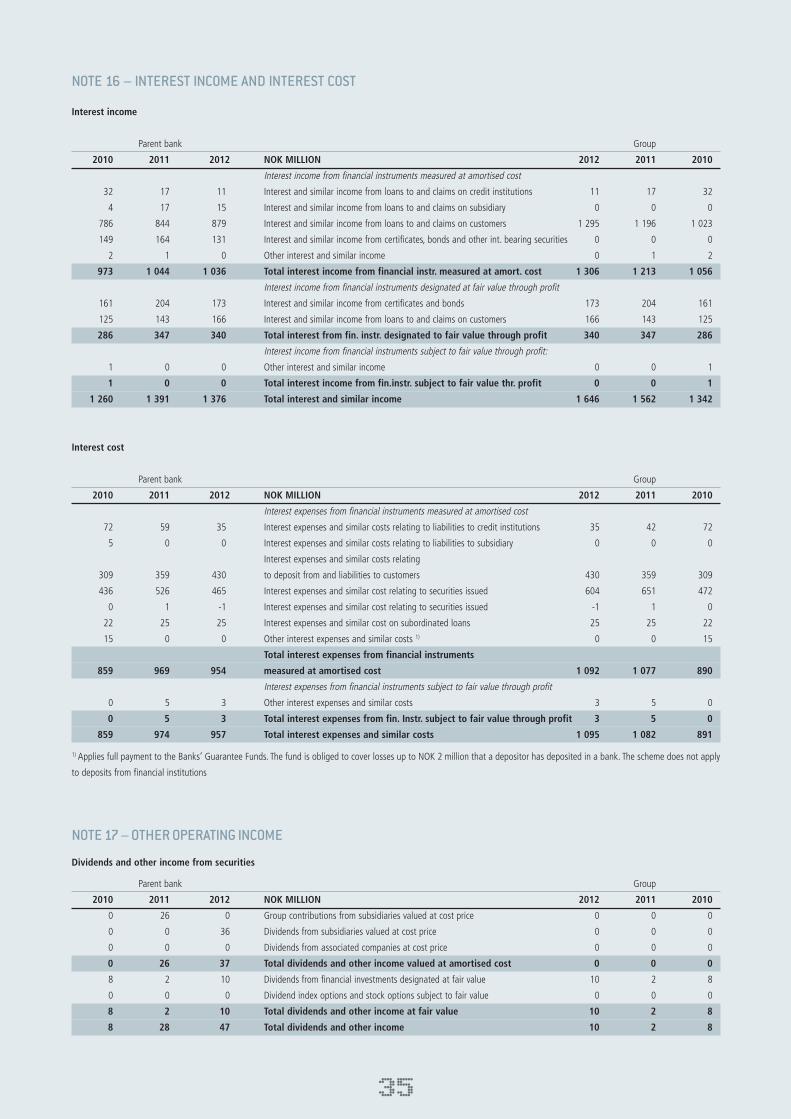
Dividends and other income from securities
Parent bank Group
2010 2011 2012 NOK MILLION 2012 2011 2010
0 26 0 Group contributions from subsidiaries valued at cost price 0 0 0
0 0 36 Dividends from subsidiaries valued at cost price 0 0 0
0 0 0 Dividends from associated companies at cost price 0 0 0
0 26 37 Total dividends and other income valued at amortised cost 0 0 0
8 2 10 Dividends from financial investments designated at fair value 10 2 8
0 0 0 Dividend index options and stock options subject to fair value 0 0 0
8 2 10 Total dividends and other income at fair value 10 2 8
8 28 47 Total dividends and other income 10 2 8
NOTE 17 – OTHER OPERATING INCOME
Interest cost
Parent bank Group
2010 2011 2012 NOK MILLION 2012 2011 2010
Interest expenses from financial instruments measured at amortised cost
72 59 35 Interest expenses and similar costs relating to liabilities to credit institutions 35 42 72
5 0 0 Interest expenses and similar costs relating to liabilities to subsidiary 0 0 0
Interest expenses and similar costs relating
309 359 430 to deposit from and liabilities to customers 430 359 309
436 526 465 Interest expenses and similar cost relating to securities issued 604 651 472
0 1 -1 Interest expenses and similar cost relating to securities issued -1 1 0
22 25 25 Interest expenses and similar cost on subordinated loans 25 25 22
15 0 0 Other interest expenses and similar costs 1) 0 0 15
Total interest expenses from financial instruments
859 969 954 measured at amortised cost 1 092 1 077 890
Interest expenses from financial instruments subject to fair value through profit
0 5 3 Other interest expenses and similar costs 3 5 0
0 5 3 Total interest expenses from fin. Instr. subject to fair value through profit 3 5 0
859 974 957 Total interest expenses and similar costs 1 095 1 082 891
1) Applies full payment to the Banks’ Guarantee Funds. The fund is obliged to cover losses up to NOK 2 million that a depositor has deposited in a bank. The scheme does not apply
to deposits from financial institutions
Interest income
Parent bank Group
2010 2011 2012 NOK MILLION 2012 2011 2010
Interest income from financial instruments measured at amortised cost
32 17 11 Interest and similar income from loans to and claims on credit institutions 11 17 32
4 17 15 Interest and similar income from loans to and claims on subsidiary 0 0 0
786 844 879 Interest and similar income from loans to and claims on customers 1 295 1 196 1 023
149 164 131 Interest and similar income from certificates, bonds and other int. bearing securities 0 0 0
2 1 0 Other interest and similar income 0 1 2
973 1 044 1 036 Total interest income from financial instr. measured at amort. cost 1 306 1 213 1 056
Interest income from financial instruments designated at fair value through profit
161 204 173 Interest and similar income from certificates and bonds 173 204 161
125 143 166 Interest and similar income from loans to and claims on customers 166 143 125
286 347 340 Total interest from fin. instr. designated to fair value through profit 340 347 286
Interest income from financial instruments subject to fair value through profit:
1 0 0 Other interest and similar income 0 0 1
1 0 0 Total interest income from fin.instr. subject to fair value thr. profit 0 0 1
1 260 1 391 1 376 Total interest and similar income 1 646 1 562 1 342
NOTE 16 – INTEREST INCOME AND INTEREST COST
35

Commissions
Parent bank Group
2010 2011 2012 NOK MILLION 2012 2011 2010
6 6 8 Guarantee Commission 8 6 6
8 12 12 Commission -credit brokerage 12 12 8
11 10 9 Fees-securities trading and management/administration 4 5 6
54 55 53 Payment transmission 53 55 54
10 9 10 Insurance service 10 9 10
2 2 3 Other fees 3 2 2
90 94 95 Total fee and com. income and income from banking services 90 89 86
NOTE 18 – WAGES AND PENSION
Wages and general administration cost
Parent bank Group
2010 2011 2012 NOK MILLION 2012 2011 2010
93 95 103 Salaries to employees and fees paid to elected represntativs (1) 103 95 93
-11 14 11 Net pension costs 11 14 -11
17 20 19 Social security costs 19 20 17
99 129 134 Salaries and other personal costs 134 129 99
31 36 38 EDP cost 40 38 32
5 6 5 Postage and freight 5 6 5
6 6 6 Office expenses 6 6 6
3 2 3 Training and travel expenses 3 2 3
13 14 13 Marketing 13 14 13
58 64 65 General administration costs 67 66 60
157 192 199 Wages and general administration costs 201 195 159
180 183 182 Number of man years as of 31.12. 182 183 180
176 182 183 Average number of man years per year 183 182 176
1) The Bank has a system of performance pay. The scheme covers all employees, with the exception of members of the management team and internal auditor. Depending on the
achievement of objectives, a bonus payment can be provided of a maximum of 1.5 months salary per employee. Board members are not included in the bonus scheme.
Net value change and gains on foreign exchange and securities
Parent bank Group
2010 2011 2012 NOK MILLION 2012 2011 2010
0 0 0 Changes in value to amortised cost 0 0 0
Changes in value subject to fair value through profit:
3 -11 -44 Changes in value of financial derivatives: -44 -11 3
3 -11 -44 Changes in value subject to fair value through profit: -44 -11 3
Changes in value designated at fair value through profit:
-6 -36 45 Changes in value in certificates, bonds, other interest bearing securities 43 -34 -4
22 -4 10 Changes in value of shares and other securities 9 -4 22
11 18 14 Changes in value in borrowing /lending currency(foreign exchange gains/losses) 14 18 11
27 -22 70 Changes in value designated at fair value through profit: 67 -20 30
30 -33 26 Total value adjustments and gains on foreign exchange and securities 23 -31 33
36
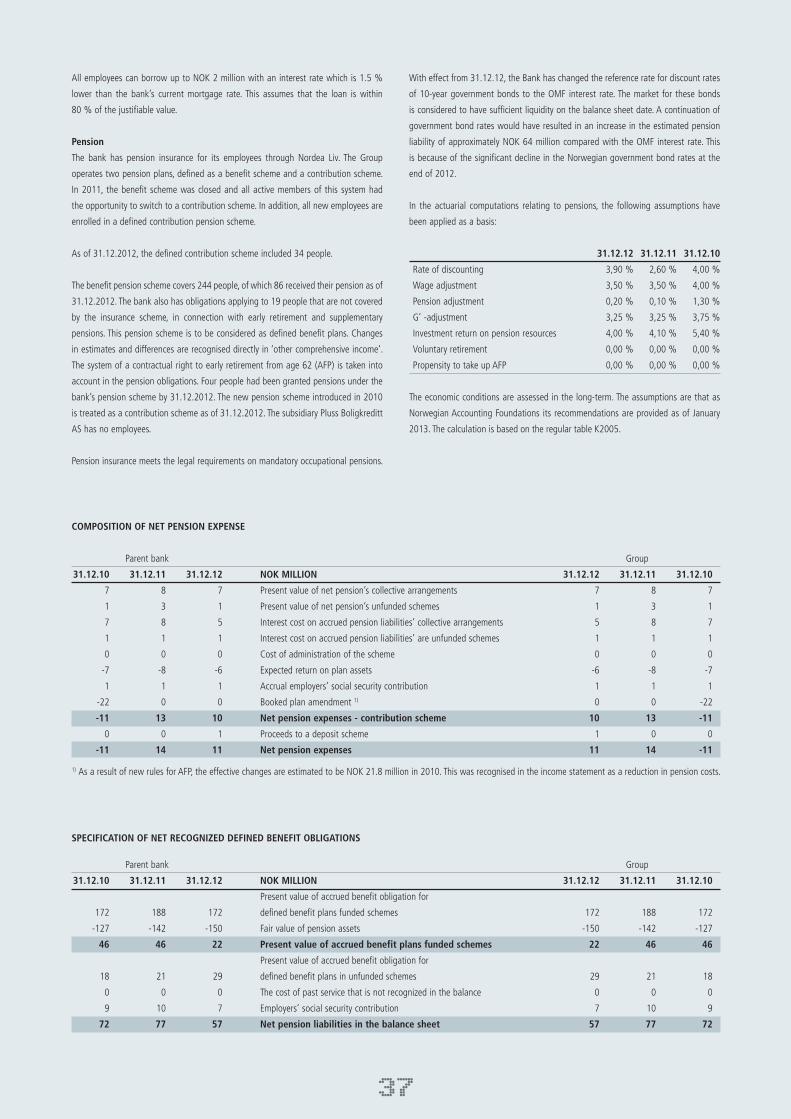
All employees can borrow up to NOK 2 million with an interest rate which is 1.5 %
lower than the bank’s current mortgage rate. This assumes that the loan is within
80 % of the justifiable value.
Pension
The bank has pension insurance for its employees through Nordea Liv. The Group
operates two pension plans, defined as a benefit scheme and a contribution scheme.
In 2011, the benefit scheme was closed and all active members of this system had
the opportunity to switch to a contribution scheme. In addition, all new employees are
enrolled in a defined contribution pension scheme.
As of 31.12.2012, the defined contribution scheme included 34 people.
The benefit pension scheme covers 244 people, of which 86 received their pension as of
31.12.2012. The bank also has obligations applying to 19 people that are not covered
by the insurance scheme, in connection with early retirement and supplementary
pensions. This pension scheme is to be considered as defined benefit plans. Changes
in estimates and differences are recognised directly in ‘other comprehensive income’.
The system of a contractual right to early retirement from age 62 (AFP) is taken into
account in the pension obligations. Four people had been granted pensions under the
bank’s pension scheme by 31.12.2012. The new pension scheme introduced in 2010
is treated as a contribution scheme as of 31.12.2012. The subsidiary Pluss Boligkreditt
AS has no employees.
Pension insurance meets the legal requirements on mandatory occupational pensions.
With effect from 31.12.12, the Bank has changed the reference rate for discount rates
of 10-year government bonds to the OMF interest rate. The market for these bonds
is considered to have sufficient liquidity on the balance sheet date. A continuation of
government bond rates would have resulted in an increase in the estimated pension
liability of approximately NOK 64 million compared with the OMF interest rate. This
is because of the significant decline in the Norwegian government bond rates at the
end of 2012.
In the actuarial computations relating to pensions, the following assumptions have
been applied as a basis:
31.12.12 31.12.11 31.12.10
Rate of discounting 3,90 % 2,60 % 4,00 %
Wage adjustment 3,50 % 3,50 % 4,00 %
Pension adjustment 0,20 % 0,10 % 1,30 %
G’ -adjustment 3,25 % 3,25 % 3,75 %
Investment return on pension resources 4,00 % 4,10 % 5,40 %
Voluntary retirement 0,00 % 0,00 % 0,00 %
Propensity to take up AFP 0,00 % 0,00 % 0,00 %
The economic conditions are assessed in the long-term. The assumptions are that as
Norwegian Accounting Foundations its recommendations are provided as of January
2013. The calculation is based on the regular table K2005.
COMPOSITION OF NET PENSION EXPENSE
Parent bank Group
31.12.10 31.12.11 31.12.12 NOK MILLION 31.12.12 31.12.11 31.12.10
7 8 7 Present value of net pension’s collective arrangements 7 8 7
1 3 1 Present value of net pension’s unfunded schemes 1 3 1
7 8 5 Interest cost on accrued pension liabilities’ collective arrangements 5 8 7
1 1 1 Interest cost on accrued pension liabilities’ are unfunded schemes 1 1 1
0 0 0 Cost of administration of the scheme 0 0 0
-7 -8 -6 Expected return on plan assets -6 -8 -7
1 1 1 Accrual employers’ social security contribution 1 1 1
-22 0 0 Booked plan amendment 1) 0 0 -22
-11 13 10 Net pension expenses - contribution scheme 10 13 -11
0 0 1 Proceeds to a deposit scheme 1 0 0
-11 14 11 Net pension expenses 11 14 -11
1) As a result of new rules for AFP, the effective changes are estimated to be NOK 21.8 million in 2010. This was recognised in the income statement as a reduction in pension costs.
SPECIFICATION OF NET RECOGNIZED DEFINED BENEFIT OBLIGATIONS
Parent bank Group
31.12.10 31.12.11 31.12.12 NOK MILLION 31.12.12 31.12.11 31.12.10
Present value of accrued benefit obligation for
172 188 172 defined benefit plans funded schemes 172 188 172
-127 -142 -150 Fair value of pension assets -150 -142 -127
46 46 22 Present value of accrued benefit plans funded schemes 22 46 46
Present value of accrued benefit obligation for
18 21 29 defined benefit plans in unfunded schemes 29 21 18
0 0 0 The cost of past service that is not recognized in the balance 0 0 0
9 10 7 Employers’ social security contribution 7 10 9
72 77 57 Net pension liabilities in the balance sheet 57 77 72
37

Parent bank Group
2010 2011 2012 NOK MILLION 2012 2011 2010
314 257 323 Result before taxation cost 403 281 352
5 1 1 Permanent differences 1 1 5
-4 -3 -2 Dividends received -2 -3 -4
0 0 -36 Dividends from subsidiaries 0 0 0
-14 35 -39 None taxable income -36 36 -14
-26 9 17 Changes in temporary income differences that affect the tax base 17 9 -26
276 298 264 Taxable income 383 324 314
77 84 74 Income tax (28%) 107 91 88
2 632 2 432 2 581 Basis wealth tax 1) 2 581 2 432 2 362
7 7 8 Wealth tax1) 8 7 7
84 91 82 Total tax payable 115 98 95
1) Wealth tax is included in the current tax liability as of 31.12.2012. In 2012, however, wealth tax was presented under other operating expenses in the income statement and not
as a part of tax costs.
Parent bank Group
2010 2011 2012 NOK MILLION 2012 2011 2010
84 91 74 Income tax 107 98 95
0 -11 6 Changes in deferred taxes 6 -11 0
1 0 0 Too much/little tax provision in last year 0 0 1
84 79 80 Tax cost 113 86 96
NOTE 19 – TAX
ACTIVE PEOPLE IN THE DIFFERENT SCHEME
Parent bank Group
31.12.10 31.12.11 31.12.12 31.12.12 31.12.11 31.12.10
190 165 158 Active members of the benefit pension scheme 158 165 190
75 71 86 Seniors and /or disabled in the scheme 86 71 75
265 236 244 Total number of persons who are included in the benefit scheme 244 236 265
- - - Active members of the AFP scheme - - -
8 6 4 Seniors and disabled people in the AFP scheme 4 6 8
8 6 4 Total number of persons who are included in the AFP scheme 4 6 8
22 15 14 Aktiv members of non-insured schemes 14 15 22
4 4 5 Seniors and disabled people in non-insured schemes 5 4 4
26 19 19 Total number of people in non-insured schemes 19 19 26
26 34 Aktiv members of contribution scheme 34 26
26 34 Total number of people in the contribution scheme 34 26
Expected pension expenses in 2013 are NOK 12.9 million for the Parent company / Group. Of this, NOK 11.0 million is related to the company’s benefit pension scheme.
Change in pension liability during the year
NOK MILLION 2012 2011 2010
OB 01.01. 209 190 200
The year’ vesting 8 8 8
The year’ interest expense 5 8 8
Payments -4 -3 -4
Plan changes 0 0 -20
Unrecognised estmated deviation -18 6 -2
CB 31.12. 200 209 190
Change in pension funds during the year
NOK MILLION 2012 2011 2010
OB 01.01. 142 127 120
Expected return 6 7 7
Payments 15 11 5
Payout pension -3 -3 -3
Plan changes 0 0 0
Unrecognised estimated deviation -9 0 -1
Administration cost 0 0 0
CB 31.12. 150 142 127
Pension funds are not invested in own financial instruments or other assets of the company.
Pension funds are managed by the insurance company, Nordea Liv.
38
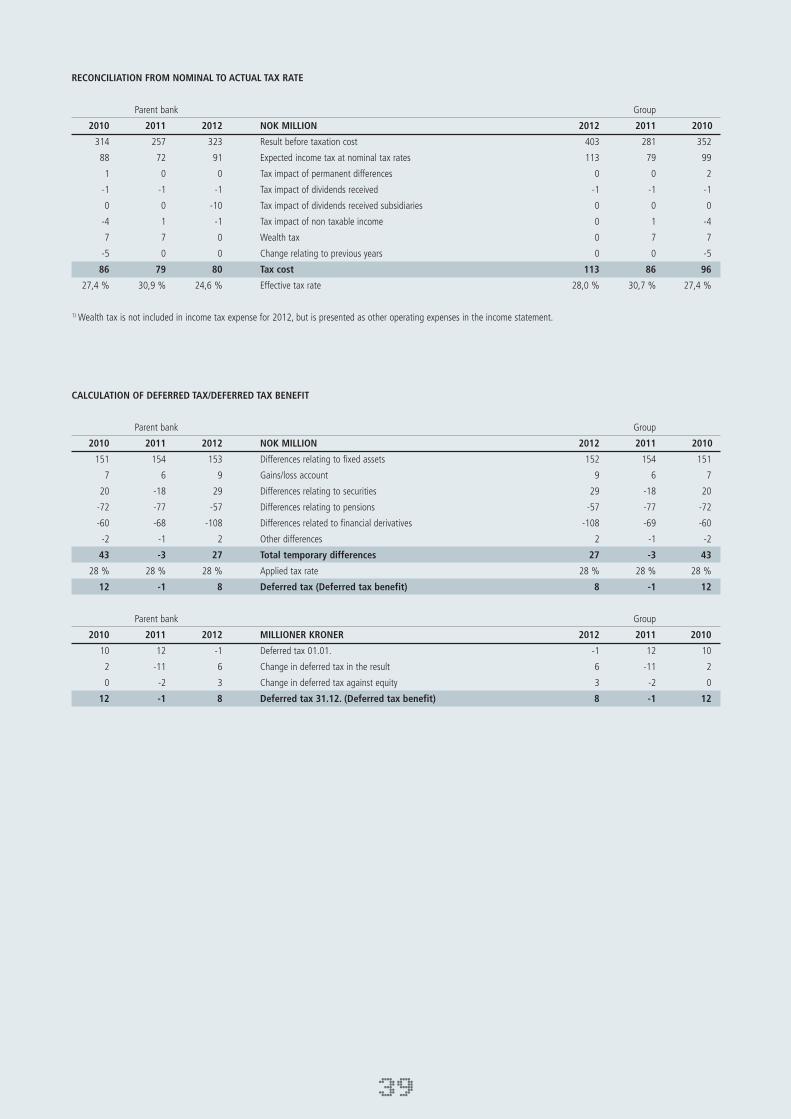
CALCULATION OF DEFERRED TAX/DEFERRED TAX BENEFIT
Parent bank Group
2010 2011 2012 NOK MILLION 2012 2011 2010
151 154 153 Differences relating to fixed assets 152 154 151
7 6 9 Gains/loss account 9 6 7
20 -18 29 Differences relating to securities 29 -18 20
-72 -77 -57 Differences relating to pensions -57 -77 -72
-60 -68 -108 Differences related to financial derivatives -108 -69 -60
-2 -1 2 Other differences 2 -1 -2
43 -3 27 Total temporary differences 27 -3 43
28 % 28 % 28 % Applied tax rate 28 % 28 % 28 %
12 -1 8 Deferred tax (Deferred tax benefit) 8 -1 12
Parent bank Group
2010 2011 2012 MILLIONER KRONER 2012 2011 2010
10 12 -1 Deferred tax 01.01. -1 12 10
2 -11 6 Change in deferred tax in the result 6 -11 2
0 -2 3 Change in deferred tax against equity 3 -2 0
12 -1 8 Deferred tax 31.12. (Deferred tax benefit) 8 -1 12
39
RECONCILIATION FROM NOMINAL TO ACTUAL TAX RATE
Parent bank Group
2010 2011 2012 NOK MILLION 2012 2011 2010
314 257 323 Result before taxation cost 403 281 352
88 72 91 Expected income tax at nominal tax rates 113 79 99
1 0 0 Tax impact of permanent differences 0 0 2
-1 -1 -1 Tax impact of dividends received -1 -1 -1
0 0 -10 Tax impact of dividends received subsidiaries 0 0 0
-4 1 -1 Tax impact of non taxable income 0 1 -4
7 7 0 Wealth tax 0 7 7
-5 0 0 Change relating to previous years 0 0 -5
86 79 80 Tax cost 113 86 96
27,4 % 30,9 % 24,6 % Effective tax rate 28,0 % 30,7 % 27,4 %
1) Wealth tax is not included in income tax expense for 2012, but is presented as other operating expenses in the income statement.

31.12.2012 Group
Number Equity Book Acquisition
NOK THOUSAND of shares stake value cost
Total shares at fair value
NorgesInvestor Pro AS 130 000 9,4 14 593 13 000
NorgesInvestor IV AS 92 500 2,1 10 110 8 997
NorgesInvestor Oppotunities AS 60 000 9,6 5 784 6 000
NorgesInvestor Oppotunities ll AS 13 000 21,0 1 236 1 300
Nets AS 501 350 0,27 23 087 21 729
Nordito Property AS 60 698 0,6 2 064 2 064
Eiendomskreditt AS 112 396 4,1 11 689 11 321
Eksportfinans ASA 529 0,2 8 300 7 879
VISA International a-shares 1 489 0 1 256 638
VISA International c-shares 3 475 0 2 932 1 488
Other companies (15) 1 779 784
Total shares valued at fair value 82 830 75 200
Shares valued at equity method
Plussmegleren Holding AS 1,2) 10 000 20,0 2 250 2 970
Total shares valued at equity method 2 250 2 970
Participations classified at fair value
Banklikviditet Global 12,5 120 108 99 180
Skagerak Venture Capital 1 KS 9,7 9 773 13 854
Total participations valued at fair value 129 881 113 034
TOTAL 214 961 191 204
NOTE 20 – STOCKS, UNIT TRUST SHARES AND CAPITAL CERTIFICATES
All shares are classified at fair value through profit. Associate businesses (TS) are valued using the equity method in the consolidated financial statements.
1) Sparebanken Pluss’ subsidiary Pluss Boligkreditt AS have no investments in equities. The only difference between Parent Company and Group is that the shares in the
associate company Plussmegleren Holding AS (previously known as Plussmegleren AS) were carried at the equity method in the consolidated accounts and the cost method in
the Parent Company. The shares were valued at NOK 2.25 million in the Parent Company.2) Plussmegleren Holding AS has its registered office in Kristiansand.
31.12.2011 Group
Number Equity Book Acquisition
NOK THOUSAND of shares stake value cost
Total shares at fair value
NorgesInvestor Pro AS 130 000 9,4 13 512 13 000
NorgesInvestor IV AS 92 500 2,1 9 139 8 997
NorgesInvestor Oppotunities AS 60 000 9,6 5 501 6 000
Other NorgesInvestor (4) 1 816 697
Nets AS 501 350 0,27 21 729 21 729
Nordito Property AS 60 698 0,6 2 064 2 064
Eiendomskreditt AS 112 396 7,0 11 321 11 321
Sparebankmateriell AS 590 1,9 59 59
Eksportfinans ASA 529 0,2 8 300 7 879
VISA International 4 964 0 3 020 2 126
Other companies (12) 897 1 216
Total shares valued at fair value 77 359 75 088
Shares valued at equity method
Plussmegleren AS 1,2) 12 500 25,0 2 000 3 210
Total shares valued at equity method 2 000 3 210
Participations classified at fair value
Banklikviditet Global 12,5 111 831 99 180
Skagerak Venture Capital 1 KS 9,7 11 433 19 108
Other funds 4 761 5 000
Total participations valued at fair value 128 025 123 288
TOTAL 207 384 201 586
1) Sparebanken Pluss’ subsidiary Pluss Boligkreditt AS have no investments in equities. The only difference between Parent Company and Group is that the shares in the
associate company Plussmegleren AS were carried at the equity method in the consolidated accounts and the cost method in the Parent Company. The shares were valued at
NOK 1.25 million in the Parent Company.2) Plussmegleren AS has its registered office in Kristiansand.
40

41
Subsidiary’s Book Book Book
share Equity value value value
NOK MILLION capital stake 31.12.2010 31.12.2011 31.12.2012
Pluss Boligkreditt AS 450 100 % 300 450 450
Equity stakes in Group companies 450 300 450 450
NOTE 21 – EQUITY STAKES IN GROUP COMPANIES
On 22.12.2008, Sparebanken Pluss obtained a license to establish a mortgage company with the option of issuing covered bonds (OMF). The company Pluss Boligkreditt AS was
purchased in 2009 and established as a residential mortgage company in the financial year of 2009.
Pluss Boligkreditt AS has its registered office in Kristiansand.
Refer to ‘Note 32: Informations of related parties’ for additional information relating to transactions with subsidiaries.
The Bank’s investment in the venture company is largely a participation in an investment company. The company prepares valuations itself based on the underlying portfolio value,
which the bank use in valuation.
The Group has committed to additional payments related to investment in the Skagerrak Venture Capital 1 KS. As of 31.12.2012 non-mobilised capital is NOK 3,980,000 (as of
31.12.2011 NOK 5,890,000 and as of 31.12.2010 NOK 9,030,000).
Refer to ‘Note 32: Information of related parties’ for additional information relating to transactions with affiliated companies.
31.12.2010 Group
Number Equity Book Acquisition
NOK THOUSAND of shares stake value cost
Total shares at fair value
NorgesInvestor Pro AS 130 000 9,4 18 959 13 000
NorgesInvestor IV AS 77 500 3,8 7 765 7 750
NorgesInvestor Oppotunities AS 60 000 9,6 8 046 4 500
Other NorgesInvestor (3 stk) 360 167
Nets AS 501 350 0,27 21 729 21 729
Nordito Property AS 60 698 0,6 2 064 2 064
Eiendomskreditt AS 112 396 7,0 11 321 11 321
Sparebankmateriell AS 590 1,9 59 59
Eksportfinans ASA 529 0,2 5 766 7 879
VISA International 4 964 0 2 047 2 126
Other companies (12) 1 030 1 224
Total shares valued at fair value 79 146 71 819
Shares valued at equity method
Plussmegleren AS 1, 2) 19 500 49,0 1 115 2 960
Total shares valued at equity method 1 115 2 960
Participations classified at fair value
Banklikviditet Global 12,5 112 312 99 180
Skagerak Venture Capital 1 KS 9,7 7 756 15 971
Other funds 5 167 5 000
Total participations valued at fair value 125 235 120 151
TOTAL 205 496 194 930
1) Sparebanken Pluss’ subsidiary Pluss Boligkreditt AS have no investments in equities. The only difference between Parent Company and Group is that the shares in the
associate company Plussmegleren AS (previously known as Pluss Garanti Eiendomsmegling AS) were carried at the equity method in the consolidated accounts and the cost
method in the Parent Company. The shares were valued at NOK 1.0 million in the Parent Company.2) Plussmegleren AS has its registered office in Kristiansand.
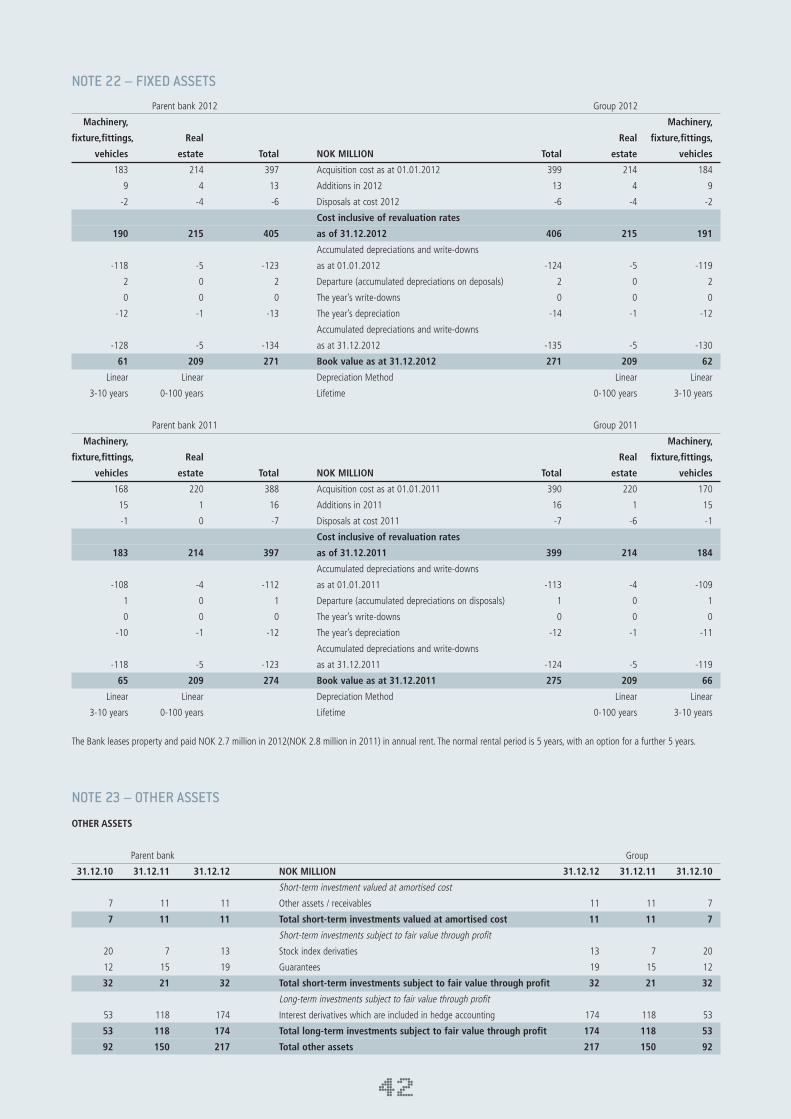
OTHER ASSETS
Parent bank Group
31.12.10 31.12.11 31.12.12 NOK MILLION 31.12.12 31.12.11 31.12.10
Short-term investment valued at amortised cost
7 11 11 Other assets / receivables 11 11 7
7 11 11 Total short-term investments valued at amortised cost 11 11 7
Short-term investments subject to fair value through profit
20 7 13 Stock index derivaties 13 7 20
12 15 19 Guarantees 19 15 12
32 21 32 Total short-term investments subject to fair value through profit 32 21 32
Long-term investments subject to fair value through profit
53 118 174 Interest derivatives which are included in hedge accounting 174 118 53
53 118 174 Total long-term investments subject to fair value through profit 174 118 53
92 150 217 Total other assets 217 150 92
NOTE 23 – OTHER ASSETS
Parent bank 2012 Group 2012
Machinery, Machinery,
fixture,fittings, Real Real fixture,fittings,
vehicles estate Total NOK MILLION Total estate vehicles
183 214 397 Acquisition cost as at 01.01.2012 399 214 184
9 4 13 Additions in 2012 13 4 9
-2 -4 -6 Disposals at cost 2012 -6 -4 -2
Cost inclusive of revaluation rates
190 215 405 as of 31.12.2012 406 215 191
Accumulated depreciations and write-downs
-118 -5 -123 as at 01.01.2012 -124 -5 -119
2 0 2 Departure (accumulated depreciations on deposals) 2 0 2
0 0 0 The year’s write-downs 0 0 0
-12 -1 -13 The year’s depreciation -14 -1 -12
Accumulated depreciations and write-downs
-128 -5 -134 as at 31.12.2012 -135 -5 -130
61 209 271 Book value as at 31.12.2012 271 209 62
Linear Linear Depreciation Method Linear Linear
3-10 years 0-100 years Lifetime 0-100 years 3-10 years
Parent bank 2011 Group 2011
Machinery, Machinery,
fixture,fittings, Real Real fixture,fittings,
vehicles estate Total NOK MILLION Total estate vehicles
168 220 388 Acquisition cost as at 01.01.2011 390 220 170
15 1 16 Additions in 2011 16 1 15
-1 0 -7 Disposals at cost 2011 -7 -6 -1
Cost inclusive of revaluation rates
183 214 397 as of 31.12.2011 399 214 184
Accumulated depreciations and write-downs
-108 -4 -112 as at 01.01.2011 -113 -4 -109
1 0 1 Departure (accumulated depreciations on disposals) 1 0 1
0 0 0 The year’s write-downs 0 0 0
-10 -1 -12 The year’s depreciation -12 -1 -11
Accumulated depreciations and write-downs
-118 -5 -123 as at 31.12.2011 -124 -5 -119
65 209 274 Book value as at 31.12.2011 275 209 66
Linear Linear Depreciation Method Linear Linear
3-10 years 0-100 years Lifetime 0-100 years 3-10 years
NOTE 22 – FIXED ASSETS
The Bank leases property and paid NOK 2.7 million in 2012(NOK 2.8 million in 2011) in annual rent. The normal rental period is 5 years, with an option for a further 5 years.
42

43
NOTE 24 – OTHER LIABILITIES
OTHER LIABILITIES
Parent bank Group
31.12.10 31.12.11 31.12.12 NOK MILLION 31.12.12 31.12.11 31.12.10
Liabilities valued at amortised cost
5 5 5 Liabilities to public/state 5 5 5
29 11 10 Gifts 10 11 29
27 40 21 Other liabilities 21 40 27
60 55 36 Total liabilities valued at amortised cost 36 55 60
Financial derivatives subject to fair value
80 150 245 Interest rate derivatives 245 151 80
12 15 18 Guarantees 18 15 12
20 7 0 Stock indexes derivatives 0 7 20
112 172 263 Total financial derivatives subject to fair value 263 172 112
172 227 299 Total other liabilities 299 227 172
ACCRUED EXPENSES AND PREPAID INCOME AND PROVISION
Parent bank Group
31.12.10 31.12.11 31.12.12 NOK MILLION 31.12.12 31.12.11 31.12.10
Accrued expenses and prepaid income
186 236 188 Accrued interest 202 261 202
22 19 26 Accruals salary 26 19 22
18 7 6 Other accruals 6 7 18
225 262 220 Accrued expenses and prepaid income 234 287 241
PROVISION FOR LIABILITIES
Parent bank Group
31.12.10 31.12.11 31.12.12 NOK MILLION 31.12.12 31.12.11 31.12.10
Provisions for accrued expenses and liabilities
72 77 57 Pension commitments 57 77 72
2 1 0 Specific allocations on guarantees (subject to fair value) 0 1 2
74 77 57 Provisions for accrued expenses and liabilities 57 77 74
ADVANCE PAYMENTS NOT ACCRUED EXPENSES AND ACQUIRED NOT RECEIVED INCOME
Parent bank Group
31.12.10 31.12.11 31.12.12 NOK MILLION 31.12.12 31.12.11 31.12.10
Valued at amortised cost
128 202 185 Accrued income, not yet received 194 213 135
1 1 1 Prepaid expenses, not yet incurred 1 1 1
Prepaid expenses not yet incurred and
129 203 186 accrued income not yet received 195 214 136

NOTE 25 – SUBORDINATED LOAN CAPITAL Group/Parent bank
31.12.12 31.12.11 31.12.10
Recognised Recognised Recognised
NOK MILLION value Nominal value Nominal value Nominal Currency Due
Subordinated loans valued at amortised cost
NO0010359730 400 400 400 400 NOK 26.03.12
NO0010641459 199 200 NOK Perpetual
NO0010293970 299 300 299 300 299 300 NOK Perpetual
Subordinated loans valued at amortised cost 498 500 699 700 698 700
Also refer to Note 6 where the payment structure of the bond debt is listed.
NOTE 26 – EQUITY CERTIFICATES AND EQUITY CERTIFICATES CAPITAL
The 20 largest equity certificates owners as of 31.12.12
NUMBER SHARE OF NUMBER SHARE OF
NAME OF EC EC-CAP. % NAME OF EC EC-CAP. %
1. Glastad Invest AS 91 250 7,30 11. Birkenes Sparebank 20 000 1,60
2. Sparebankstiftelsen DnB NOR 62 300 4,98 12. Flekkefjord Sparebank 15 800 1,26
3. Brøvig Holding AS 33 300 2,66 13. Sparebank 1 SR-bank 13 918 1,11
4. Varodd AS 32 800 2,62 14. Apriori Holding AS 13 900 1,11
5. Gumpens Bileiendom AS 32 350 2,59 15. Strømme Leif Eiendom 13 400 1,07
6. Terra Utbytte VPF 32 150 2,57 16. Bratland Bjørn 12 800 1,02
7. Sparebanken Sør 31 600 2,53 17. Sparebank 1 Ringerike 11 500 0,92
8. MP Pensjon PK 26 900 2,15 18. Rynning Jens Emil 11 137 0,89
9. Spareskillingsbanken 26 600 2,13 19. Akselsen Carsten 10 250 0,82
10. Allumgården 25 179 2,01 20. Mørch Gerd Turid 10 200 0,82
Total 10 largest EC holders 394 429 31,55 Total - 20 largest EC holders 527 334 42,19
44
Equity certificates capital and results per equity certificates
Results per equity certificates are calculated as the relationship between the year’s results attributable to the owners of the equity certificates according to the equity certificates
fraction of the parent company 01.01. and the number of issues equity certificates at the end of the year.
Equity certificates holders share of total equity is 7.44 per cent as of 31.12.2012
Sparebanken Pluss does not own its own equity certificates as of 31.12.2012.
2012
Profit for Profit for the Profit for Profit for the
Number of Nominal Certificates Premium Owner the year , the year per EC, the year, the year per EC,
equity cerficates value capital fund fractions Parent Bank 1) Parent Bank Group 1) Group
1 250 000 100 125 34 7,83 % 244 15,3 290 18,2
2011
Profit for Profit for the Profit for Profit for the
Number of Nominal Certificates Premium Owner the year , the year per EC, the year, the year per EC,
equity cerficates value capital fund fractions Parent Bank 1) Parent Bank Group 1) Group
1 250 000 100 125 34 8,13% 177 11,5 195 12,7
2010
Profit for Profit for the Profit for Profit for the
Number of Nominal Certificates Premium Owner the year , the year per EC, the year, the year per EC,
equity cerficates value capital fund fractions Parent Bank 1) Parent Bank Group 1) Group
1 250 000 100 125 34 8,51% 229 15,6 256 17,5 1) NOK million.

45
NOTE 28 – FINANCIAL INSTRUMENTS BY CATEGORY
Parent bank
2012 2011 2010
Total proposed dividend NOK 12,500 mill. NOK 8,125 mill. NOK10,625 mill.
Proposed dividend per equity certificates NOK 10.00 per EC NOK 6.50 per EC NOK 8.50 per EC
Number of equity certificates 1,250,000 1,250,000 1,250,000
NOTE 27 – PROPOSED DIVIDEND
Proposed, not adopted dividend
Dividends approved by the Board of Trustees on 29th March 2012 for the 2011 financial year were paid in 2012.
Group as of 31.12.2012
Financiel
The fair value Voluntary assets and
relating to categorized liabilities at
Fair hegde at fair amortised Hold to
NOK MILLION value accounting value cost maturity Total
Net loans to and claims on central banks 0 0 0 475 0 475
Net loans to and claims on credit institutions 0 0 0 19 0 19
Net loans to and claims on customers 0 0 5 471 30 102 0 35 573
Certificates, bonds and other interest-bearing securities 0 0 7 065 0 91 7 156
Equities, unit trust shares and ECs with variable yield 0 0 213 2 0 215
Other assets 32 174 0 11 0 217
Liabilities to credit institutions 0 0 0 -5 304 0 -5 304
Deposits from and liabilities to customers 0 0 0 -19 378 0 -19 378
Borrowings through the issuance of securities 0 -174 0 -15 203 0 -15 377
Other liabilities -263 0 0 -36 0 -299
Subordinated loan capital 0 0 0 -498 0 -498
Total -231 0 12 749 -9 809 91 2 799
Parent bank as of 31.12.2012
Financiel
The fair value Voluntary assets and
relating to categorized liabilities at
Fair hegde at fair amortised Hold to
NOK MILLION value accounting value cost maturity Total
Net loans to and claims on central banks 0 0 0 475 0 475
Net loans to and claims on credit institutions 0 0 0 574 0 574
Net loans to and claims on customers 0 0 5 471 19 548 0 25 019
Certificates, bonds and other interest-bearing securities 0 0 7 241 4 152 91 11 484
Equities, unit trust shares and ECs with variable yield 0 0 213 2 0 215
Equity stakes in Group companies 0 0 0 450 0 450
Other assets 32 174 0 11 0 217
Liabilities to credit institutions 0 0 0 -5 304 0 -5 304
Deposits from and liabilities to customers 0 0 0 -19 378 0 -19 378
Borrowings through the issuance of securities 0 -174 0 -10 130 0 -10 304
Other liabilities -263 0 0 -36 0 -299
Subordinated loan capital 0 0 0 -498 0 -498
Total -231 0 12 925 -10 134 91 2 651

46
Group as of 31.12.2011
Financiel
The fair value Voluntary assets and
relating to categorized liabilities at
Fair hegde at fair amortised Hold to
NOK MILLION value accounting value cost maturity Total
Net loans to and claims on central banks 0 0 0 568 0 568
Net loans to and claims on credit institutions 0 0 0 30 0 30
Net loans to and claims on customers 0 0 4 213 28 933 0 33 147
Certificates, bonds and other interest-bearing securities 0 0 5 783 0 135 5 918
Equities, unit trust shares and ECs with variable yield 0 0 205 2 0 207
Other assets 21 118 0 11 0 150
Liabilities to credit institutions 0 0 0 -6 093 0 -6 093
Deposits from and liabilities to customers 0 0 0 -15 289 0 -15 289
Borrowings through the issuance of securities 0 -118 0 -15 049 0 -15 167
Other liabilities -172 0 0 -55 0 -227
Provisions for liabilities -1 0 0 0 0 -1
Subordinated loan capital 0 0 0 -699 0 -699
Total -151 0 10 202 -7 641 135 2 545
Parent bank as of 31.12.2011
Financiel
The fair value Voluntary assets and
relating to categorized liabilities at
Fair hegde at fair amortised Hold to
NOK MILLION value accounting value cost maturity Total
Net loans to and claims on central banks 0 0 0 568 0 568
Net loans to and claims on credit institutions 0 0 0 667 0 667
Net loans to and claims on customers 0 0 4 213 19 365 0 23 579
Certificates, bonds and other interest-bearing securities 0 0 5 992 4 326 135 10 453
Equities, unit trust shares and ECs with variable yield 0 0 205 1 0 207
Equity stakes in Group companies 0 0 0 450 0 450
Other assets 21 118 0 11 0 150
Liabilities to credit institutions 0 0 0 -6 093 0 -6 093
Deposits from and liabilities to customers 0 0 0 -15 289 0 -15 289
Borrowings through the issuance of securities 0 -118 0 -11 187 0 -11 305
Other liabilities -172 0 0 -55 0 -227
Provisions for liabilities -1 0 0 0 0 -1
Subordinated loan capital 0 0 0 -699 0 -699
Total -151 0 10 411 -7 935 135 2 460
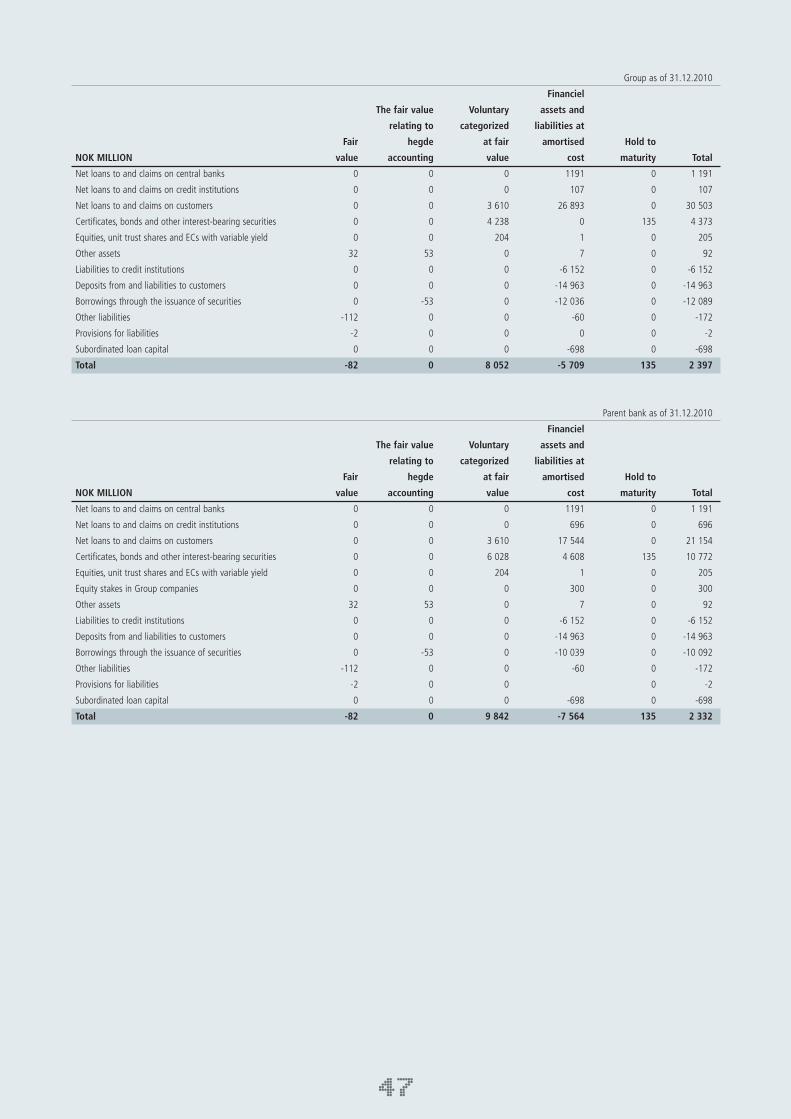
47
Group as of 31.12.2010
Financiel
The fair value Voluntary assets and
relating to categorized liabilities at
Fair hegde at fair amortised Hold to
NOK MILLION value accounting value cost maturity Total
Net loans to and claims on central banks 0 0 0 1191 0 1 191
Net loans to and claims on credit institutions 0 0 0 107 0 107
Net loans to and claims on customers 0 0 3 610 26 893 0 30 503
Certificates, bonds and other interest-bearing securities 0 0 4 238 0 135 4 373
Equities, unit trust shares and ECs with variable yield 0 0 204 1 0 205
Other assets 32 53 0 7 0 92
Liabilities to credit institutions 0 0 0 -6 152 0 -6 152
Deposits from and liabilities to customers 0 0 0 -14 963 0 -14 963
Borrowings through the issuance of securities 0 -53 0 -12 036 0 -12 089
Other liabilities -112 0 0 -60 0 -172
Provisions for liabilities -2 0 0 0 0 -2
Subordinated loan capital 0 0 0 -698 0 -698
Total -82 0 8 052 -5 709 135 2 397
Parent bank as of 31.12.2010
Financiel
The fair value Voluntary assets and
relating to categorized liabilities at
Fair hegde at fair amortised Hold to
NOK MILLION value accounting value cost maturity Total
Net loans to and claims on central banks 0 0 0 1191 0 1 191
Net loans to and claims on credit institutions 0 0 0 696 0 696
Net loans to and claims on customers 0 0 3 610 17 544 0 21 154
Certificates, bonds and other interest-bearing securities 0 0 6 028 4 608 135 10 772
Equities, unit trust shares and ECs with variable yield 0 0 204 1 0 205
Equity stakes in Group companies 0 0 0 300 0 300
Other assets 32 53 0 7 0 92
Liabilities to credit institutions 0 0 0 -6 152 0 -6 152
Deposits from and liabilities to customers 0 0 0 -14 963 0 -14 963
Borrowings through the issuance of securities 0 -53 0 -10 039 0 -10 092
Other liabilities -112 0 0 -60 0 -172
Provisions for liabilities -2 0 0 0 -2
Subordinated loan capital 0 0 0 -698 0 -698
Total -82 0 9 842 -7 564 135 2 332
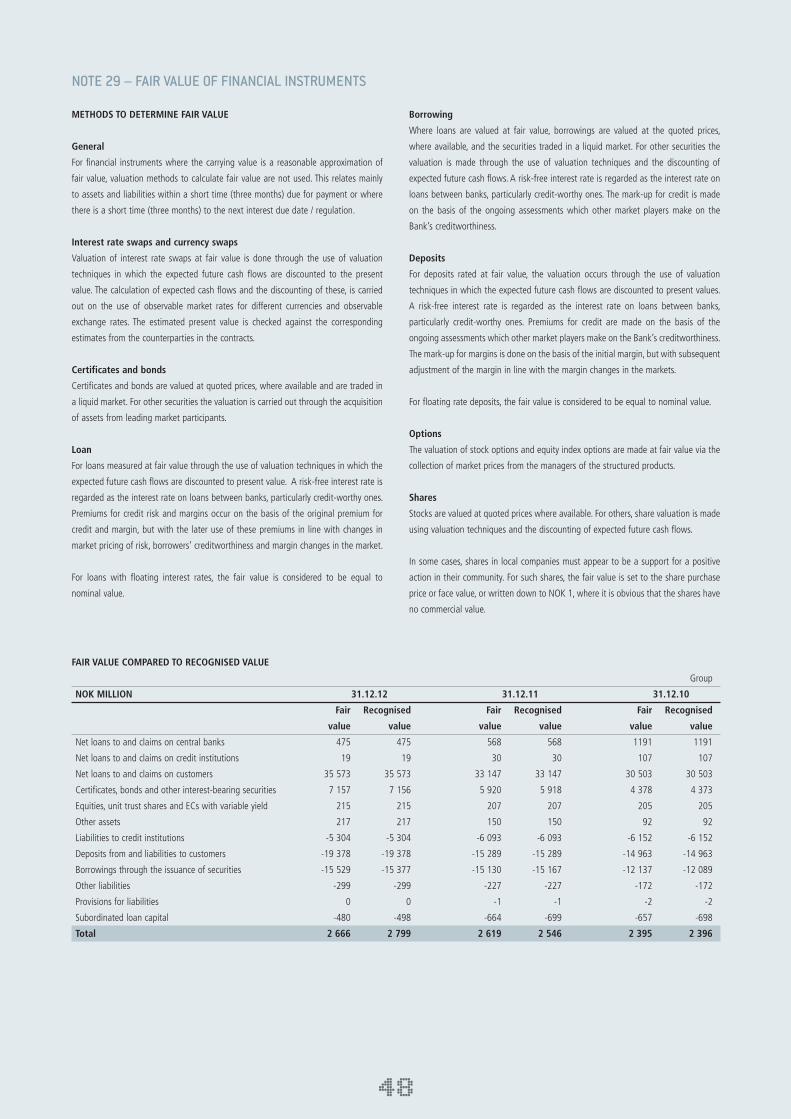
NOTE 29 – FAIR VALUE OF FINANCIAL INSTRUMENTS
METHODS TO DETERMINE FAIR VALUE
General
For financial instruments where the carrying value is a reasonable approximation of
fair value, valuation methods to calculate fair value are not used. This relates mainly
to assets and liabilities within a short time (three months) due for payment or where
there is a short time (three months) to the next interest due date / regulation.
Interest rate swaps and currency swaps
Valuation of interest rate swaps at fair value is done through the use of valuation
techniques in which the expected future cash flows are discounted to the present
value. The calculation of expected cash flows and the discounting of these, is carried
out on the use of observable market rates for different currencies and observable
exchange rates. The estimated present value is checked against the corresponding
estimates from the counterparties in the contracts.
Certificates and bonds
Certificates and bonds are valued at quoted prices, where available and are traded in
a liquid market. For other securities the valuation is carried out through the acquisition
of assets from leading market participants.
Loan
For loans measured at fair value through the use of valuation techniques in which the
expected future cash flows are discounted to present value. A risk-free interest rate is
regarded as the interest rate on loans between banks, particularly credit-worthy ones.
Premiums for credit risk and margins occur on the basis of the original premium for
credit and margin, but with the later use of these premiums in line with changes in
market pricing of risk, borrowers’ creditworthiness and margin changes in the market.
For loans with floating interest rates, the fair value is considered to be equal to
nominal value.
Borrowing
Where loans are valued at fair value, borrowings are valued at the quoted prices,
where available, and the securities traded in a liquid market. For other securities the
valuation is made through the use of valuation techniques and the discounting of
expected future cash flows. A risk-free interest rate is regarded as the interest rate on
loans between banks, particularly credit-worthy ones. The mark-up for credit is made
on the basis of the ongoing assessments which other market players make on the
Bank’s creditworthiness.
Deposits
For deposits rated at fair value, the valuation occurs through the use of valuation
techniques in which the expected future cash flows are discounted to present values.
A risk-free interest rate is regarded as the interest rate on loans between banks,
particularly credit-worthy ones. Premiums for credit are made on the basis of the
ongoing assessments which other market players make on the Bank’s creditworthiness.
The mark-up for margins is done on the basis of the initial margin, but with subsequent
adjustment of the margin in line with the margin changes in the markets.
For floating rate deposits, the fair value is considered to be equal to nominal value.
Options
The valuation of stock options and equity index options are made at fair value via the
collection of market prices from the managers of the structured products.
Shares
Stocks are valued at quoted prices where available. For others, share valuation is made
using valuation techniques and the discounting of expected future cash flows.
In some cases, shares in local companies must appear to be a support for a positive
action in their community. For such shares, the fair value is set to the share purchase
price or face value, or written down to NOK 1, where it is obvious that the shares have
no commercial value.
FAIR VALUE COMPARED TO RECOGNISED VALUE
Group
NOK MILLION 31.12.12 31.12.11 31.12.10
Fair Recognised Fair Recognised Fair Recognised
value value value value value value
Net loans to and claims on central banks 475 475 568 568 1191 1191
Net loans to and claims on credit institutions 19 19 30 30 107 107
Net loans to and claims on customers 35 573 35 573 33 147 33 147 30 503 30 503
Certificates, bonds and other interest-bearing securities 7 157 7 156 5 920 5 918 4 378 4 373
Equities, unit trust shares and ECs with variable yield 215 215 207 207 205 205
Other assets 217 217 150 150 92 92
Liabilities to credit institutions -5 304 -5 304 -6 093 -6 093 -6 152 -6 152
Deposits from and liabilities to customers -19 378 -19 378 -15 289 -15 289 -14 963 -14 963
Borrowings through the issuance of securities -15 529 -15 377 -15 130 -15 167 -12 137 -12 089
Other liabilities -299 -299 -227 -227 -172 -172
Provisions for liabilities 0 0 -1 -1 -2 -2
Subordinated loan capital -480 -498 -664 -699 -657 -698
Total 2 666 2 799 2 619 2 546 2 395 2 396
48

49
CLASSIFICATION OF FINANCIAL INSTRUMENTS - FAIR VALUE OF HIERARCHY
Financial instruments are classified in different levels. Only financial instruments
carried at fair value are presented.
Level 1: Includes financial assets and liabilities valued using the uncorrected
observable market values. This includes listed shares, derivatives traded on active
market places and other securities with quoted market values.
Level 2: Instrument value based on valuation techniques in which all the assumptions
(all input) is based on directly or indirectly observable market data. Values here can be
obtained from external market players or reconciled with the external markets which
offer these type of services.
Level 3: Instruments are based on valuation techniques in which at least one essential
requirement cannot be supported based on observable market values. This category
includes investments in companies and fixed rate loans where there is no market
information.
Parent bank
NOK MILLION 31.12.12 31.12.11 31.12.10
Fair Recognised Fair Recognised Fair Recognised
value value value value value value
Net loans to and claims on central banks 475 475 568 568 1191 1191
Net loans to and claims on credit institutions 574 574 667 667 696 696
Net loans to and claims on customers 25 019 25 019 23 579 23 579 21 154 21 154
Certificates, bonds and other interest-bearing securities 11 485 11 484 10 454 10 453 10 777 10 772
Equities, unit trust shares and Ecs with variable yeild 215 215 207 207 205 205
Equities stakes in group companies 450 450 450 450 300 300
Other assets 217 217 150 150 92 92
Liabilities to credit institutions -5 304 -5 304 -6 093 -6 093 -6 152 -6 152
Deposits from and liabilities to customers -19 378 -19 378 -15 289 -15 289 -14 963 -14 963
Borrowings through the issuance of securities -10 363 -10 304 -11 281 -11 305 -10 141 -10 092
Other liabilities -299 -299 -227 -227 -172 -172
Provisions for liabilities 0 0 -1 -1 -2 -2
Subordinated loan capital -480 -498 -664 -699 -657 -698
Total 2 611 2 651 2 522 2 460 2 330 2 332
For short-term financial instruments, it is recognised that amounts are normally always a good approximation to the fair value. Financial derivatives and short-term investments in
securities are made entirely at fair value.
Group 31.12.2012
Recognised Fair value
NOK MILLION value Level 1 Level 2 Level 3
Loans to and claims on customers 5 471 0 0 5 471
Certificates, bonds and other
interest-bearing securities 7 065 0 7 065 0
Equities, unit trust shares and ECs 213 4 120 88
Other assets 206 0 206 0
Other liabilities -263 0 -263 0
Total 12 692 4 7 129 5 559
Parent bank 31.12.2012
Recognised Fair value
NOK MILLION value Level 1 Level 2 Level 3
Loans to and claims on customers 5 471 0 0 5 471
Certificates, bonds and other
interest-bearing securities 7 241 0 7 241 0
Equities, unit trust shares and ECs 213 4 120 88
Other assets 206 0 206 0
Other liabilities -263 0 -263 0
Total 12 868 4 7 305 5 559
The parent bank has recognised the bonds issued by the subsidiary at fair value, and the bonds have been eliminated in the consolidated financial statements – hence the difference
between the fair value of bonds in the parent bank against the consolidated financial statements as at 31.12.2012.

Changes in value recognised in the year relate primarily to financial instruments which are recognised in the balance as of 31.12.
Group 31.12.2011
Recognised Fair value
NOK MILLION value Level 1 Level 2 Level 3
Loans to and claims on customers 4 213 0 0 4 213
Certificates, bonds and other
interest-bearing securities 5 783 0 5 783 0
Equities, unit trust shares and ECs 205 8 112 85
Other assets 140 0 140 0
Other liabilities -172 0 -172 0
Provisions for liabilities -1 0 -1 0
Total 10 169 8 5 862 4 298
Parent bank 31.12.2011
Recognised Fair value
NOK MILLION value Level 1 Level 2 Level 3
Loans to and claims on customers 4 213 0 0 4 213
Certificates, bonds and other
interest-bearing securities 5 992 0 5 992 0
Equities, unit trust shares and ECs 205 8 112 85
Other assets 140 0 140 0
Other liabilities -172 0 -172 0
Provisions for liabilities -1 0 -1 0
Total 10 378 8 6 071 4 298
The parent bank has recognised the bonds issued by the subsidiary at fair value, and
the bonds have been eliminated in the consolidated financial statements – hence the
difference between the fair value of bonds in the parent bank against the consolidated
financial statements as at 31.12.2011.
Group 31.12.2010
Recognised Fair value
NOK MILLION value Level 1 Level 2 Level 3
Loans to and claims on customers 3 610 0 0 3 610
Certificates, bonds and other
interest-bearing securities 4 238 0 4 238 0
Equities, unit trust shares and ECs 204 7 134 63
Other assets 85 0 85 0
Other liabilities -112 0 -112 0
Provisions for liabilities -2 0 -2 0
Total 8 023 7 4 343 3 673
Parent bank 31.12.2010
Recognised Fair value
NOK MILLION value Level 1 Level 2 Level 3
Net loans to and claims on customers 3 610 0 0 3 610
Certificates, bonds and other
interest-bearing securities 6 028 0 6 028 0
Equities, unit trust shares and ECs 204 7 134 63
Other assets 85 0 85 0
Other liabilities -112 0 -112 0
Provisions for liabilities -2 0 -2 0
Total 9 814 7 6 134 3 673
In 2010, the subsidiary issued bonds that were purchased by the Parent Bank. These
are recognised at fair value in the Parent Bank, but eliminated in the consolidated
financial statements. Hence the difference between the fair value of bonds in the
Parent Bank versus the consolidated financial statements as at 31.12.2010.
MOVEMENT IN VALUES THAT ARE CATEGORISED IN CATEGORY 3
Group/Parent bank
NOK MILLION Net loans and Shares and equity
receivables from of which Repossed of which certficates with of which
customers credit risk assets credit risk variable yield credit risk
Recognised value 01.01.2010 3 720 -45 3 0 0 0
Access 2010 393 0 55
Of which transferred from level 1 or 2 0 0 55
Changes in value recognised in the year 50 18 0 0 8 0
Departure 2010 -553 -3 0
Recognised value 31.12.2010 3 610 -27 0 0 63 0
Access 2011 1 272 0 24
Of which transferred from level 1 or 2 0 0 24
Changes in value recognised in the year 59 -20 0 0 -3 0
Departure 2011 -728 0 0
Recognised value 31.12.2011 4 213 -47 0 0 85 0
Access 2012 1 909 0 0
Of which transferred from level 1 or 2 0 0 0
Changes in value recognised in the year 47 -46 0 0 3 0
Departure 2012 -699 0 0
Recognised value 31.12.2012 5 471 -93 0 0 88
50
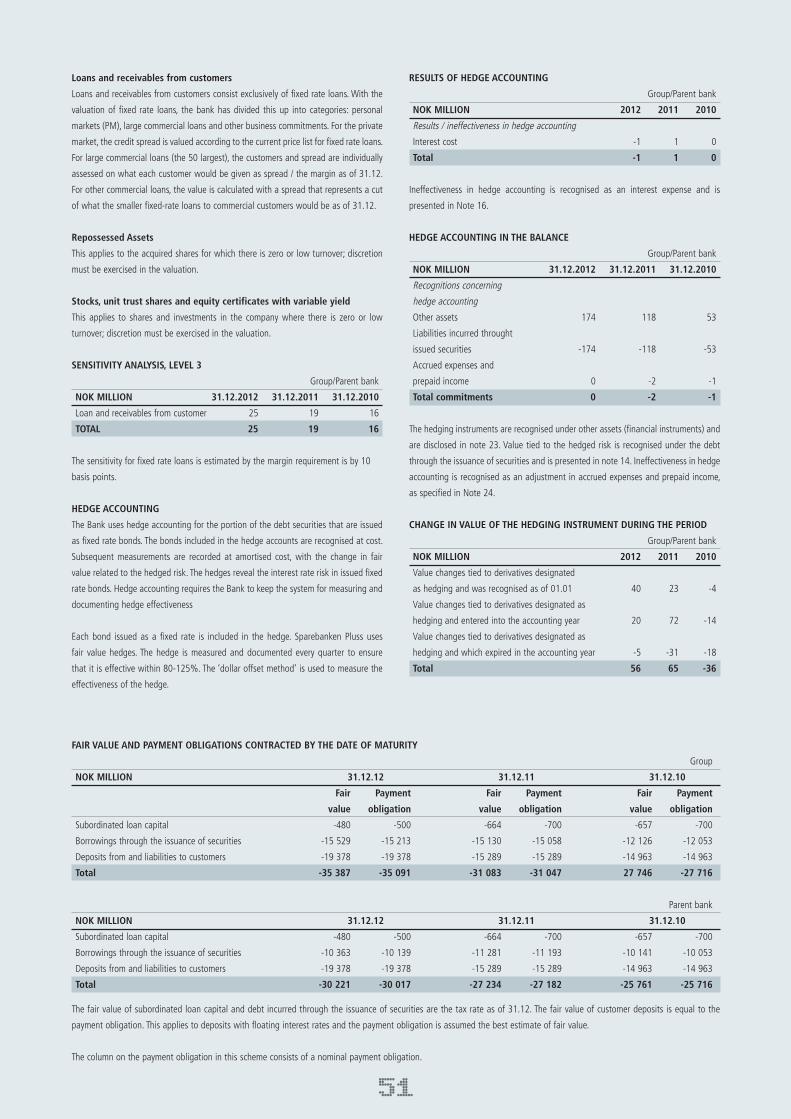
51
FAIR VALUE AND PAYMENT OBLIGATIONS CONTRACTED BY THE DATE OF MATURITY
Group
NOK MILLION 31.12.12 31.12.11 31.12.10
Fair Payment Fair Payment Fair Payment
value obligation value obligation value obligation
Subordinated loan capital -480 -500 -664 -700 -657 -700
Borrowings through the issuance of securities -15 529 -15 213 -15 130 -15 058 -12 126 -12 053
Deposits from and liabilities to customers -19 378 -19 378 -15 289 -15 289 -14 963 -14 963
Total -35 387 -35 091 -31 083 -31 047 27 746 -27 716
Parent bank
NOK MILLION 31.12.12 31.12.11 31.12.10
Subordinated loan capital -480 -500 -664 -700 -657 -700
Borrowings through the issuance of securities -10 363 -10 139 -11 281 -11 193 -10 141 -10 053
Deposits from and liabilities to customers -19 378 -19 378 -15 289 -15 289 -14 963 -14 963
Total -30 221 -30 017 -27 234 -27 182 -25 761 -25 716
The fair value of subordinated loan capital and debt incurred through the issuance of securities are the tax rate as of 31.12. The fair value of customer deposits is equal to the
payment obligation. This applies to deposits with floating interest rates and the payment obligation is assumed the best estimate of fair value.
The column on the payment obligation in this scheme consists of a nominal payment obligation.
Loans and receivables from customers
Loans and receivables from customers consist exclusively of fixed rate loans. With the
valuation of fixed rate loans, the bank has divided this up into categories: personal
markets (PM), large commercial loans and other business commitments. For the private
market, the credit spread is valued according to the current price list for fixed rate loans.
For large commercial loans (the 50 largest), the customers and spread are individually
assessed on what each customer would be given as spread / the margin as of 31.12.
For other commercial loans, the value is calculated with a spread that represents a cut
of what the smaller fixed-rate loans to commercial customers would be as of 31.12.
Repossessed Assets
This applies to the acquired shares for which there is zero or low turnover; discretion
must be exercised in the valuation.
Stocks, unit trust shares and equity certificates with variable yield
This applies to shares and investments in the company where there is zero or low
turnover; discretion must be exercised in the valuation.
SENSITIVITY ANALYSIS, LEVEL 3
Group/Parent bank
NOK MILLION 31.12.2012 31.12.2011 31.12.2010
Loan and receivables from customer 25 19 16
TOTAL 25 19 16
The sensitivity for fixed rate loans is estimated by the margin requirement is by 10
basis points.
HEDGE ACCOUNTING
The Bank uses hedge accounting for the portion of the debt securities that are issued
as fixed rate bonds. The bonds included in the hedge accounts are recognised at cost.
Subsequent measurements are recorded at amortised cost, with the change in fair
value related to the hedged risk. The hedges reveal the interest rate risk in issued fixed
rate bonds. Hedge accounting requires the Bank to keep the system for measuring and
documenting hedge effectiveness
Each bond issued as a fixed rate is included in the hedge. Sparebanken Pluss uses
fair value hedges. The hedge is measured and documented every quarter to ensure
that it is effective within 80-125%. The ‘dollar offset method’ is used to measure the
effectiveness of the hedge.
RESULTS OF HEDGE ACCOUNTING
Group/Parent bank
NOK MILLION 2012 2011 2010
Results / ineffectiveness in hedge accounting
Interest cost -1 1 0
Total -1 1 0
Ineffectiveness in hedge accounting is recognised as an interest expense and is
presented in Note 16.
HEDGE ACCOUNTING IN THE BALANCE
Group/Parent bank
NOK MILLION 31.12.2012 31.12.2011 31.12.2010
Recognitions concerning
hedge accounting
Other assets 174 118 53
Liabilities incurred throught
issued securities -174 -118 -53
Accrued expenses and
prepaid income 0 -2 -1
Total commitments 0 -2 -1
The hedging instruments are recognised under other assets (financial instruments) and
are disclosed in note 23. Value tied to the hedged risk is recognised under the debt
through the issuance of securities and is presented in note 14. Ineffectiveness in hedge
accounting is recognised as an adjustment in accrued expenses and prepaid income,
as specified in Note 24.
CHANGE IN VALUE OF THE HEDGING INSTRUMENT DURING THE PERIOD
Group/Parent bank
NOK MILLION 2012 2011 2010
Value changes tied to derivatives designated
as hedging and was recognised as of 01.01 40 23 -4
Value changes tied to derivatives designated as
hedging and entered into the accounting year 20 72 -14
Value changes tied to derivatives designated as
hedging and which expired in the accounting year -5 -31 -18
Total 56 65 -36
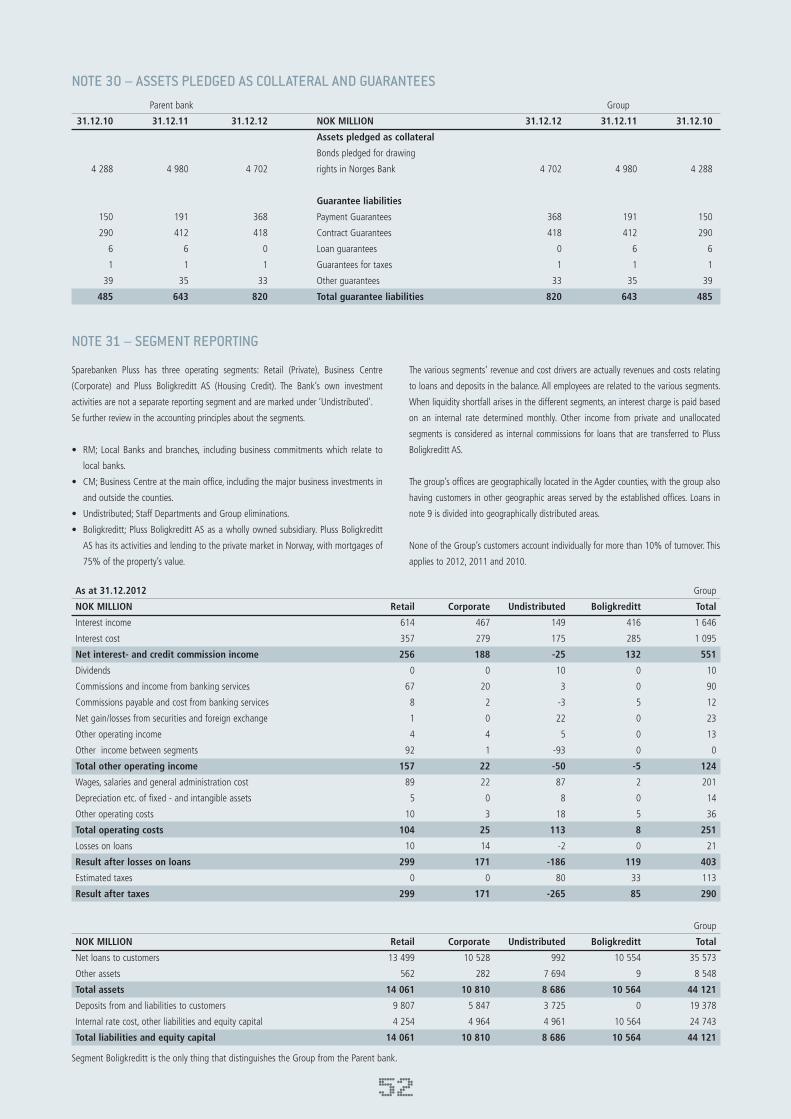
NOTE 30 – ASSETS PLEDGED AS COLLATERAL AND GUARANTEES
Parent bank Group
31.12.10 31.12.11 31.12.12 NOK MILLION 31.12.12 31.12.11 31.12.10
Assets pledged as collateral
Bonds pledged for drawing
4 288 4 980 4 702 rights in Norges Bank 4 702 4 980 4 288
Guarantee liabilities
150 191 368 Payment Guarantees 368 191 150
290 412 418 Contract Guarantees 418 412 290
6 6 0 Loan guarantees 0 6 6
1 1 1 Guarantees for taxes 1 1 1
39 35 33 Other guarantees 33 35 39
485 643 820 Total guarantee liabilities 820 643 485
NOTE 31 – SEGMENT REPORTING
Sparebanken Pluss has three operating segments: Retail (Private), Business Centre
(Corporate) and Pluss Boligkreditt AS (Housing Credit). The Bank’s own investment
activities are not a separate reporting segment and are marked under ‘Undistributed’.
Se further review in the accounting principles about the segments.
• RM; Local Banks and branches, including business commitments which relate to
local banks.
• CM;BusinessCentreatthemainoffice,includingthemajorbusinessinvestmentsin
and outside the counties.
• Undistributed;StaffDepartmentsandGroupeliminations.
• Boligkreditt;PlussBoligkredittASasawhollyownedsubsidiary.PlussBoligkreditt
AS has its activities and lending to the private market in Norway, with mortgages of
75% of the property’s value.
The various segments’ revenue and cost drivers are actually revenues and costs relating
to loans and deposits in the balance. All employees are related to the various segments.
When liquidity shortfall arises in the different segments, an interest charge is paid based
on an internal rate determined monthly. Other income from private and unallocated
segments is considered as internal commissions for loans that are transferred to Pluss
Boligkreditt AS.
The group’s offices are geographically located in the Agder counties, with the group also
having customers in other geographic areas served by the established offices. Loans in
note 9 is divided into geographically distributed areas.
None of the Group’s customers account individually for more than 10% of turnover. This
applies to 2012, 2011 and 2010.
As at 31.12.2012 Group
NOK MILLION Retail Corporate Undistributed Boligkreditt Total
Interest income 614 467 149 416 1 646
Interest cost 357 279 175 285 1 095
Net interest- and credit commission income 256 188 -25 132 551
Dividends 0 0 10 0 10
Commissions and income from banking services 67 20 3 0 90
Commissions payable and cost from banking services 8 2 -3 5 12
Net gain/losses from securities and foreign exchange 1 0 22 0 23
Other operating income 4 4 5 0 13
Other income between segments 92 1 -93 0 0
Total other operating income 157 22 -50 -5 124
Wages, salaries and general administration cost 89 22 87 2 201
Depreciation etc. of fixed - and intangible assets 5 0 8 0 14
Other operating costs 10 3 18 5 36
Total operating costs 104 25 113 8 251
Losses on loans 10 14 -2 0 21
Result after losses on loans 299 171 -186 119 403
Estimated taxes 0 0 80 33 113
Result after taxes 299 171 -265 85 290
Group
NOK MILLION Retail Corporate Undistributed Boligkreditt Total
Net loans to customers 13 499 10 528 992 10 554 35 573
Other assets 562 282 7 694 9 8 548
Total assets 14 061 10 810 8 686 10 564 44 121
Deposits from and liabilities to customers 9 807 5 847 3 725 0 19 378
Internal rate cost, other liabilities and equity capital 4 254 4 964 4 961 10 564 24 743
Total liabilities and equity capital 14 061 10 810 8 686 10 564 44 121
Segment Boligkreditt is the only thing that distinguishes the Group from the Parent bank.
52
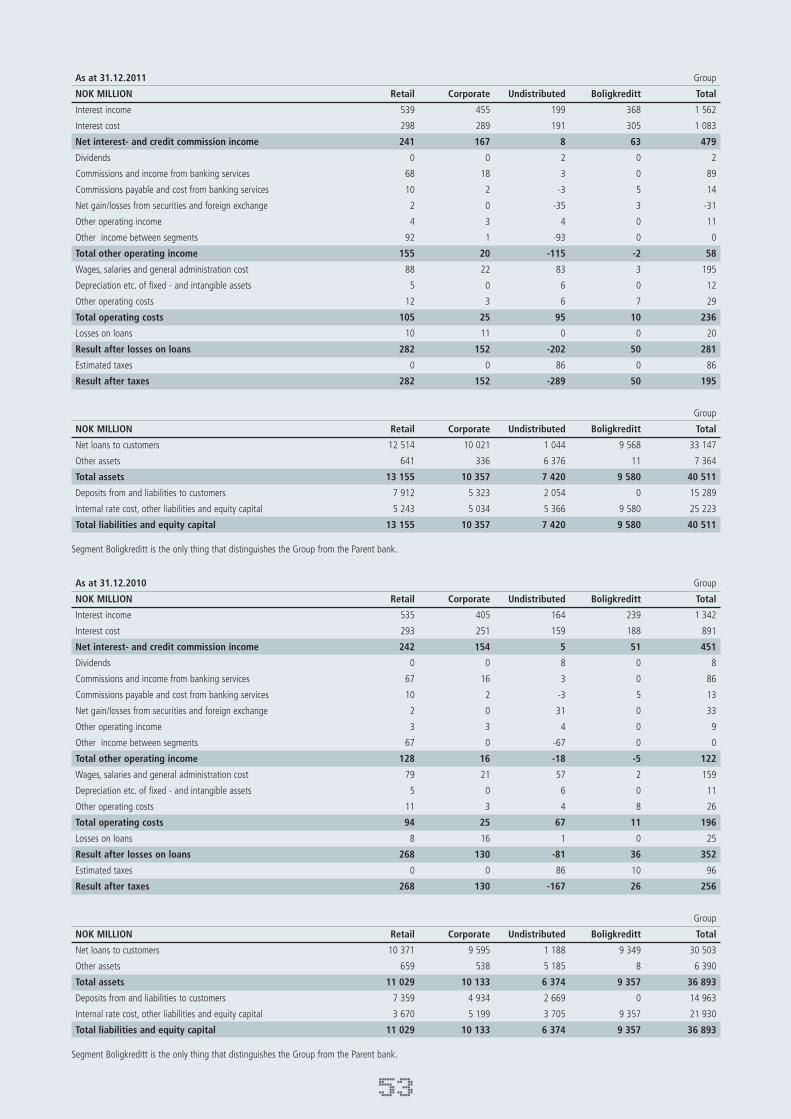
53
As at 31.12.2010 Group
NOK MILLION Retail Corporate Undistributed Boligkreditt Total
Interest income 535 405 164 239 1 342
Interest cost 293 251 159 188 891
Net interest- and credit commission income 242 154 5 51 451
Dividends 0 0 8 0 8
Commissions and income from banking services 67 16 3 0 86
Commissions payable and cost from banking services 10 2 -3 5 13
Net gain/losses from securities and foreign exchange 2 0 31 0 33
Other operating income 3 3 4 0 9
Other income between segments 67 0 -67 0 0
Total other operating income 128 16 -18 -5 122
Wages, salaries and general administration cost 79 21 57 2 159
Depreciation etc. of fixed - and intangible assets 5 0 6 0 11
Other operating costs 11 3 4 8 26
Total operating costs 94 25 67 11 196
Losses on loans 8 16 1 0 25
Result after losses on loans 268 130 -81 36 352
Estimated taxes 0 0 86 10 96
Result after taxes 268 130 -167 26 256
Group
NOK MILLION Retail Corporate Undistributed Boligkreditt Total
Net loans to customers 10 371 9 595 1 188 9 349 30 503
Other assets 659 538 5 185 8 6 390
Total assets 11 029 10 133 6 374 9 357 36 893
Deposits from and liabilities to customers 7 359 4 934 2 669 0 14 963
Internal rate cost, other liabilities and equity capital 3 670 5 199 3 705 9 357 21 930
Total liabilities and equity capital 11 029 10 133 6 374 9 357 36 893
Segment Boligkreditt is the only thing that distinguishes the Group from the Parent bank.
Segment Boligkreditt is the only thing that distinguishes the Group from the Parent bank.
As at 31.12.2011 Group
NOK MILLION Retail Corporate Undistributed Boligkreditt Total
Interest income 539 455 199 368 1 562
Interest cost 298 289 191 305 1 083
Net interest- and credit commission income 241 167 8 63 479
Dividends 0 0 2 0 2
Commissions and income from banking services 68 18 3 0 89
Commissions payable and cost from banking services 10 2 -3 5 14
Net gain/losses from securities and foreign exchange 2 0 -35 3 -31
Other operating income 4 3 4 0 11
Other income between segments 92 1 -93 0 0
Total other operating income 155 20 -115 -2 58
Wages, salaries and general administration cost 88 22 83 3 195
Depreciation etc. of fixed - and intangible assets 5 0 6 0 12
Other operating costs 12 3 6 7 29
Total operating costs 105 25 95 10 236
Losses on loans 10 11 0 0 20
Result after losses on loans 282 152 -202 50 281
Estimated taxes 0 0 86 0 86
Result after taxes 282 152 -289 50 195
Group
NOK MILLION Retail Corporate Undistributed Boligkreditt Total
Net loans to customers 12 514 10 021 1 044 9 568 33 147
Other assets 641 336 6 376 11 7 364
Total assets 13 155 10 357 7 420 9 580 40 511
Deposits from and liabilities to customers 7 912 5 323 2 054 0 15 289
Internal rate cost, other liabilities and equity capital 5 243 5 034 5 366 9 580 25 223
Total liabilities and equity capital 13 155 10 357 7 420 9 580 40 511

NOTE 32 – INFORMATION ON RELATED PARTIES
Sparebanken Pluss has entered into transactions with related parties as described in
the present note, as well as note 33. Transactions with subsidiaries are eliminated
in the consolidated financial statements. Sparebanken Pluss and its equity capital
owners are shown in Note 26. Besides the loans granted to the special conditions for
employees, all transactions with related parties are entered into on market terms. In
addition to the transactions identified in this note and note 33, as well as eliminating
transactions within the group Sparebanken Pluss there are no transactions or
significant outstanding related party.
Parent bank Group
31.12.10 31.12.11 31.12.12 NOK THOUSAND 31.12.12 31.12.11 31.12.10
Interest income
155 187 197 033 146 404 Pluss Boligkreditt AS - Subsidiary 1) NA NA NA
334 318 223 Plussmegleren AS - Associated company 223 318 334
Net value change and gains on foreign exchange and securities
0 2 800 0 Pluss Boligkreditt AS - Subsidiary NA NA NA
-2 000 0 1 250 Plussmegleren AS - Associated company 500 750 -1 885
Other income
10 727 8 426 8 380 Pluss Boligkreditt AS - Subsidiary NA NA NA
253 60 60 Plussmegleren AS - Associated company 60 60 253
Interest cost
1 643 0 0 Pluss Boligkreditt AS - Subsidiary NA NA NA
1 062 1 613 2 704 Plussmegleren AS - Associated company 2 704 1 613 1 062
Other costs
0 0 0 Pluss Boligkreditt AS - Subsidiary NA NA NA
187 650 321 Plussmegleren AS - Associated company 321 650 187
Receivables 31.12
588 835 636 809 554 903 Pluss Boligkreditt AS - Subsidiary NA NA NA
6 000 6 000 3 000 Plussmegleren AS - Associated company 3 000 6 000 6 000
Debt 31.12
0 0 0 Pluss Boligkreditt AS - Subsidiary NA NA NA
22 147 92 850 92 967 Plussmegleren AS - Associated company 92 967 92 850 22 147
1) Of the interest costs of NOK 146.4 million, NOK 129.3 million represents interest expense on covered bonds (OMF).
Sparebanken Pluss has derecognised loans transferred to Pluss Boligkreditt AS.
Agreements are designed so that the loans will qualify for derecognition. The extent of
such derecognised loans is given below.
Parent bank
NOK MILLION 31.12.12 31.12.11 31.12.10
Pluss Boligkreditt AS 10 554 9 568 9 349
Pluss Boligkreditt AS buys most of its services from the Bank. All agreements between
the companies are entered into on market terms. As of 31.12.2012, Pluss Boligkreditt
AS has been granted a credit limit of NOK 3,000 million in Sparebanken Pluss. In
addition, Pluss Boligkreditt AS has a loan facility available at any time for which the
Parent Bank is paid an annual commission.
54

55
NOTE 33 – REMUNERATION, ETC
Remuneration of the Board, management and union representatives.
The Group’s management team consists of the management team at the Bank.
2012
Fringe
benefits and Total Loans
Performance other taxable Pension remune- and
NOK THOUSAND Fees Wages Bonus (5,6) benefits expences ration guarantees
Former senior employees
No former senior employees receive benefits - - - - - - -
Senior employees
CEO 1) - 2 188 - 190 909 3 287 2 533
Deputy CEO/Head of Corporate market - 1 373 - 169 299 1 841 1 976
Divisional Director, Retail market - 1 232 - 142 418 1 792 985
General Manager, Credit risk - 1 084 - 169 148 1 401 1 616
General Manager, Accounting and reporting - 1 053 - 156 212 1 421 -
Board of Directors 2)
Chairman 1) 130 - - - - 130 6
Deputy Chairman 70 - - - - 70 -
Other members 70 - - - - 280 3 979
Control Committee 3)
Chairman 50 - - - - 50 305
Other members 33 - - - - 66 4 639
Board of Trustees 4)
Chairman 20 20 -
Other members 62 30 896
Total 678 6 930 - 826 1 986 10 420 46 936
1) The Bank’s Chief Executive Officer has 6 months’ notice. A significant change in job content means the Chief Executive Officer has the opportunity to leave with half salary for
two years. Any earned income from other sources during the severance period will lead to reduction. The Chairman of the Board has no agreement for severance payment.2) Deputies of the Board receive NOK 2,000 per meeting. 3) Deputy control committee receives NOK 1,650 per meeting.4) Members and alternate member Board of Trustees will receive NOK 1.350 per meeting.5) There is a bonus system for all of the bank’s employees, although as of 01.01.2011 the bank’s management team and internal auditor are not included in the bonus scheme.

2011
Fringe
benefits and Total Loans
Performance other taxable Pension remune- and
NOK THOUSAND Fees Wages Bonus (5,6) benefits expences ration guarantees
Former senior employees
No former senior employees receive benefits - - - - - - -
Senior employees
CEO 1) - 2 065 106 215 764 3 150 3 081
Deputy CEO/Head of Corporate market - 1 307 77 178 246 1 808 1 922
Divisional Director, Retail market - 1 165 72 147 328 1 712 1 230
General Manager, Credit risk - 1 032 66 155 145 1 398 1 485
General Manager, Accounting and reporting - 1 015 63 157 170 1 405 90
Board of Directors 2)
Chairman 1) 130 - - - - 130 -
Deputy Chairman 70 - - - - 70 -
Other members 70 - - - - 280 3 459
Control Committee 3)
Chairman 50 - - - - 50 118
Other members 33 - - - - 66 3 843
Board of Trustees 4)
Chairman 20 20 -
Other members 82 31 638
Total 698 6 584 384 851 1 653 10 169 46 866
1) The Bank’s Chief Executive Officer has 6 months’ notice. A significant change in job content means the Chief Executive Officer has the opportunity to leave with half salary for
two years. Any earned income from other sources during the severance period will lead to reduction. The Chairman of the Board has no agreement for severance payment.2) Deputies of the Board receive NOK 2,000 per meeting. 3) Deputy control committee receives NOK 1,650 per meeting.4) Members and alternate member Board of Trustees will receive NOK 1.350 per meeting.5) There is a bonus system for all of the bank’s employees, although as of 01.01.2011 the bank’s management team and internal auditor are not included in the bonus scheme.
The bonus paid in 2011 applies to payments earned in 2010. The bank has no options arrangement.
56

57
2010
Fringe
benefits and Total Loans
Performance other taxable Pension remune- and
NOK THOUSAND Fees Wages Bonus (5,6) benefits expences ration guarantees
Former senior employees
No former senior employees receive benefits - - - - - - -
Senior employees
CEO 1) - 1 789 68 210 656 2 723 2 635
Deputy CEO/Head of Corporate market - 1 254 51 152 210 1 666 1 976
Divisional Director, Retail market - 1 015 47 153 290 1 505 1 443
General Manager, Credit risk - 894 44 154 125 1 217 1 615
General Manager, Accounting and reporting - 825 41 157 151 1 175 509
Board of Directors 2)
Chairman 1) 130 - - - - 130 -
Deputy Chairman 70 - - - - 70 -
Other members 70 - - - - 280 4 617
Control Committee 3)
Chairman 50 - - - - 50 3 778
Other members 33 - - - - 66 154
Board of Trustees 4)
Chairman 20 20 -
Other members 31 33 020
Total 647 5 777 251 825 1 432 8 933 49 747
1) The Bank’s Chief Executive Officer has 6 months’ notice. A significant change in job content means the Chief Executive Officer has the opportunity to leave with half salary for
two years. Any earned income from other sources during the severance period will lead to reduction. The Chairman of the Board has no agreement for severance payment.2) Deputies of the Board receive NOK 2,000 per meeting. 3) Deputy control committee receives NOK 1,650 per meeting.4) Members and alternate member Board of Trustees will receive NOK 1.350 per meeting.5) There is a bonus scheme for all the Bank’s employees. As of 01.01.2011 the Bank’s management team and internal auditor will not be included in this scheme. See Note 8 for
further details6) The notes state that performance-related pay and bonuses are paid in the financial year, acquired in previous years.
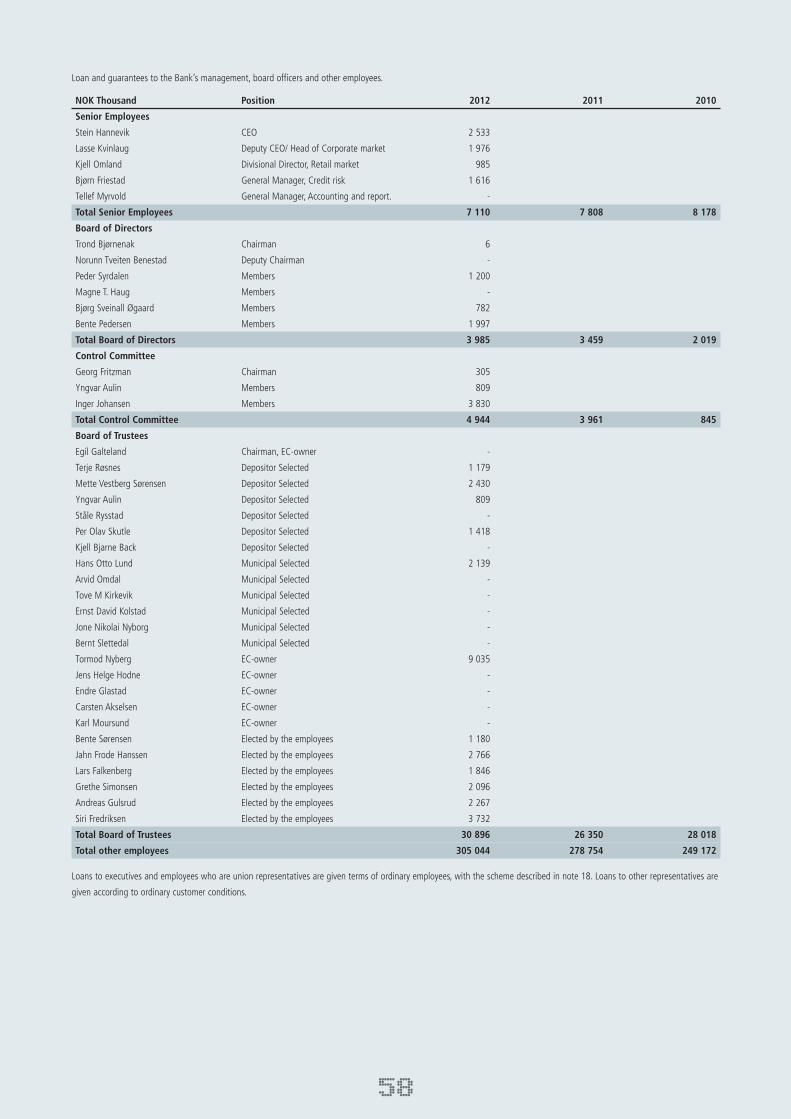
Loan and guarantees to the Bank’s management, board officers and other employees.
NOK Thousand Position 2012 2011 2010
Senior Employees
Stein Hannevik CEO 2 533
Lasse Kvinlaug Deputy CEO/ Head of Corporate market 1 976
Kjell Omland Divisional Director, Retail market 985
Bjørn Friestad General Manager, Credit risk 1 616
Tellef Myrvold General Manager, Accounting and report. -
Total Senior Employees 7 110 7 808 8 178
Board of Directors
Trond Bjørnenak Chairman 6
Norunn Tveiten Benestad Deputy Chairman -
Peder Syrdalen Members 1 200
Magne T. Haug Members -
Bjørg Sveinall Øgaard Members 782
Bente Pedersen Members 1 997
Total Board of Directors 3 985 3 459 2 019
Control Committee
Georg Fritzman Chairman 305
Yngvar Aulin Members 809
Inger Johansen Members 3 830
Total Control Committee 4 944 3 961 845
Board of Trustees
Egil Galteland Chairman, EC-owner -
Terje Røsnes Depositor Selected 1 179
Mette Vestberg Sørensen Depositor Selected 2 430
Yngvar Aulin Depositor Selected 809
Ståle Rysstad Depositor Selected -
Per Olav Skutle Depositor Selected 1 418
Kjell Bjarne Back Depositor Selected -
Hans Otto Lund Municipal Selected 2 139
Arvid Omdal Municipal Selected -
Tove M Kirkevik Municipal Selected -
Ernst David Kolstad Municipal Selected -
Jone Nikolai Nyborg Municipal Selected -
Bernt Slettedal Municipal Selected -
Tormod Nyberg EC-owner 9 035
Jens Helge Hodne EC-owner -
Endre Glastad EC-owner -
Carsten Akselsen EC-owner -
Karl Moursund EC-owner -
Bente Sørensen Elected by the employees 1 180
Jahn Frode Hanssen Elected by the employees 2 766
Lars Falkenberg Elected by the employees 1 846
Grethe Simonsen Elected by the employees 2 096
Andreas Gulsrud Elected by the employees 2 267
Siri Fredriksen Elected by the employees 3 732
Total Board of Trustees 30 896 26 350 28 018
Total other employees 305 044 278 754 249 172
Loans to executives and employees who are union representatives are given terms of ordinary employees, with the scheme described in note 18. Loans to other representatives are
given according to ordinary customer conditions.
58

59
Remuneration to auditors is included in other operating expenses
Parent bank Group
2010 2011 2012 NOK THOUSAND 2012 2011 2010
781 1 084 825 Ordinary audit fees 994 1 215 893
34 26 25 Tax advice 25 26 78
Other attestation services 75 121 39
161 72 67 Fees for other services 72 99 176
976 1 182 917 Total remuneration of elected auditor (incl.VAT) 1 166 1 461 1 186
NOTE 34 – SUBSEQUENT EVENTS AND CONTINGENCIES
It has not been any events of major significance to the accounts after the balance sheet date.
Trond BjørnenakChairman
Norunn Tveiten BenestadDeputy Chairman
Peder Syrdalen Magne Haug
Bjørg Sveinall Øgaard Bente Pedersen
Stein A. HannevikChief Executive Officer
The Board of Directors and Sparebanken Pluss’s Chief Executive Officer hereby confirm that the Bank’s 2012 annual accounts have been prepared in accordance with the currently valid accounting standards and that the information provided in the accounts provides a true and correct picture of the Parent Bank’s and Group’s assets, liabilities, financial position and overall result.
In addition, we confirm that the annual accounts give a true and correct picture of the Bank’s development, result and financial position, together with a description of the most central risk- and uncertainty factors facing the Bank.
DECLARATION IN ACCORDANCE WITH THE SECURITIES ACT, PARAGRAPH 5-5
Kristiansand, 31. December 2012 5. March 2013
The Control Committee has monitored the Bank’s operations, making sure that these operations have been conducted in accordance with the rules and regulations contained in the Savings Banks Act, the Bank’s bylaws, the Board of Trustees’ resolutions and other rules and regulations to which the Bank has to adhere.
The Control Committee has reviewed the minutes of the Board of Directors’ meetings and also examined various matters in compliance with the Savings Banks Act and the instructions applying to the Control Committee.
The Control Committee has examined the annual report from the Board of Directors,
the profit and loss account and balance sheet, with notes to the accounts, as well as the auditor’s report, and has no comments to make in that connection.The Control Committee would like to recommend that the profit and loss account and balance sheet are adopted as the Bank’s annual financial statement for 2012.
Kristiansand, 11. March 2013
Report on the financial statementsWe have audited the accompanying financial statements of Sparebanken Pluss, comprising the financial statements for the Parent Company and the Group. The financial statements of the Parent Company and the Group comprise the statement of financial position as at 31 December 2012, the statements of income, comprehensive income, cash flows and changes in equity for the year then ended as well as a summary of significant accounting policies and other explanatory information.
The Board of Directors’ and Chief Executive Officer’s responsibility for the financial statementsThe Board of Directors and Chief Executive Officer are responsible for the preparation and fair presentation of these financial statements in accordance with International Financial Reporting Standards as adopted by the EU, and for such internal control as the Board of Directors and Chief Executive Officer determine is necessary to enable the preparation of financial statements that are free from material misstatement, whether due to fraud or error.
Auditor’s responsibilityOur responsibility is to express an opinion on these financial statements based on our audit. We conducted our audit in accordance with laws, regulations, and auditing standards and practices generally accepted in Norway, including International Standards on Auditing. Those standards require that we comply with ethical requirements and plan and perform the audit to obtain reasonable assurance about whether the financial statements are free from material misstatement.
An audit involves performing procedures to obtain audit evidence about the amounts and disclosures in the financial statements. The procedures selected depend on the auditor’s judgment, including the assessment of the risks of material misstatement of the financial statements, whether due to fraud or error. In making those risk assessments, the auditor considers internal control relevant to the Bank’s preparation and fair presentation of the financial statements in order to design audit procedures that are appropriate in the circumstances, but not for the purpose of expressing an opinion on the effectiveness of the Bank’s internal control. An audit also includes evaluating the appropriateness of accounting policies used and the reasonableness of accounting estimates made by management, as well as evaluating the overall presentation of the financial statements.
We believe that the audit evidence we have obtained is sufficient and appropriate to provide a basis for our audit opinion on the financial statements for the Parent Company and the Group.
OpinionIn our opinion, the financial statements of Sparebanken Pluss have been prepared in accordance with laws and regulations and present fairly, in all material respects, the financial position of the Parent Company and the Group as at 31 December 2012 and their financial performance and cash flows for the year then ended in accordance with International Financial Reporting Standards as adopted by the EU.
Report on other legal and regulatory requirementsOpinion on the Board of Directors’ reportBased on our audit of the financial statements as described above, it is our opinion that the information presented in the Directors’ report concerning the financial statements and the going concern assumption is consistent with the financial statements and complies with the law and regulations.
Opinion on registration and documentationBased on our audit of the financial statements as described above, and control procedures we have considered necessary in accordance with International Standard on Assurance Engagements (ISAE) 3000, «Assurance Engagements Other than Audits or Reviews of Historical Financial Information», it is our opinion that the Board of Directors and Chief Executive Officer have fulfilled their duty to ensure that the Company’s accounting information is properly recorded and documented as required by law and bookkeeping standards and practices generally accepted in Norway.
Kristiansand, 5. March 2013
Øystein A. KvåseState Authorised Public Accountant (Norway)
(This translation from Norwegian has been made for information purposes only.)
REPORT FROM THE CONTROL COMMITTEE FOR 2012
Yngvar Aulin Inger Johansen
Georg FritzmanChairman
AUDITOR’S REPORT
60
Business Register: NO 976 389 387 MVATel.: +47 38 14 62 20www.ey.noMember of the Norwegian Institute of Public Accountants
State Authorised Public AccountantsErnst & Young ASGravane 12, NO-4610 KristiansandPO Box 184, NO-4662 Kristiansand

Rådhusgaten 7/9, PO Box 200, 4662 Kristiansand • Tel: 38 17 35 00 • Fax: 38 17 35 04 • Email: [email protected]
THE BANK FOR SØRLANDET