spark gap electrode · pdf file6.-.-final report spark gap electrode erosion 0 afosr grant...
TRANSCRIPT

N~JFOSR-TR- 85-0282o ~FINAL REPORT S
SPARK GAP ELECTRODE EROSION
00i
Air Force Office of Scientific ResearchGrant No. 84-0015-
Approve", t'r p.11blic release~
0- i :T EMASAAND SN)iTCHING LABORATORY -~ 95 S
JLASER LABORATORY
C.2- Department of Electrical EngineeringTEXAS TECH UNNVERSI1Y
Lubbock~, Texas 79409
<0 13

Tunn!assified:.'JU LSS-s.:AlO% cc -- IS PAGE
I REPORT DOCUMENTATION PAGE~A iPCPTSi,;.AITV C1.A$SSFtCA&TION 1.0. RtEST FCTIVE MARKINGS
Unclassifieda4. SEC,., T'r C;.ASSIFICATIO.% AU.THORITY 3. OISTRI9UTIONiAVA'-.ABI-.ITV.0 F RtEPORT
N/A__ _ _ _ _ _ _ _ _ _ _ _ _ _ _ _ _
A.PAFRIN RGNZAIN kPOF% NUMBERIS) 5. MONITGAING ORGANIZATION REPORT NumSa&FS)AEOSR -TR 0 02 82 -
6.a. NAME CF PERFORMING ORGANIZATION 6.OFFICE SYMBOL 7a. NAME OF MONITORING ORGANIZATION
Texas Tech University IDibj Air Office of Scientific Research
it- ADORESS rCat.. State and ZIP CG*, 7b. ADONESS 'CitY. State and ZIP COde,.Dept. Electrical Engineering Eldg. 410, Boiling AFBP.O. Box 4439 Washington, DC 20332Lubbock, TX 79409
U. NAME CF F.J%ZiNG;SPONSOAiNG lab. OFFICE SYMBOL S. PROCUREMENT INST RUMENT IDENTIFICAT ION NUMBEROFIGANiZA' iON Air Force (i 40U~ pdCgb6aj
Office of Scientific Res. ~ FS-4016d. ACORESS IC.*~. State and ZIP Code, 10. SOURCE OF9 FUNDING NOS.
Bldg. 410, Boiling AFB PROGAAM PAROAECT TASK WORK U-44
Washington, DC 20332 RELEMENT NO. NO. No. NO.
61102F 2301 A7
PefS&A A;TqC(S H. Krompholz, M. Kristiansen
I6. S.PPF iV.%TARtY NOTATION
20 -
19. ABSTRACT7 Conarnuea on YIrerse if necesar) and identify by Miock numberi
2~The results of a one-year contract on electrode erosion phenomena aresummarized. The arc voltage drop-in a spark gap was measured for variouselectrode, gas, and pressure combinations. A previously developed model ofself breakdown voltage distribution was extended. A jet model for elec-trode erosion was proposed and an *experimental arrangement for testing the .model was constructed. The effects of inhomogeneities and impurities inthe electrodeswere investigated. ->,I) /...
VS
20. Q4TSFS...ICNA-A lLAt.~SILITY OF ASSTOAC- V ABST AACT SECURITY Cý..ASFICATION
UC.ASFEOLVIEO"SMEAS OP~T. OTIC USERAS Unclassified
2.NAME CF RE *SF*, LE iNOiviCuAI. 22b. TELSP-CNE %UW!ER1 2c OFFICE SY-ABOL
Maj. H. Pugh 2 6/2" c ý AFOSR/NP
A.' . . - . . . . . . . . ..1 ... . . . . . . .

...... '.. ... ... .. ... ... ... ... .... .-.-6
Final Report
SPARK GAP ELECTRODE EROSION 0
AFOSR Grant #84-0015
"O0
December 20, 1985
Principal Investigators: H. Krompholz
M. Kristiansen
Technician III: K. Zinsmeyer _
Secretary: M. Byrd
Graduate Students: A. DonaldsonB. M~aasC. Yeh*
* Paid by the Republic of China (Taiwan) ~rYC
-i"."." V, "
.~ *.-,........
A.
.~~~~~~~~~~ . .. ... " . . . . .

INTRODUCT ION
This report describes the work performed on a 1-year grant
but also includes some related work, based on a previous AFOSR
contract (F49620-79-C-0191), which was completed during this
grant period.,"Some of the work described here is scheduled for
completion in 1985 under a current grant (AFOSR #84-0032).
The areas of investigation described here include:
1. Self breakdown voltage distributions
2. Electrode erosion
3. Spark gap voltage recovery
st.. 'For.
. -. -.>VT- -
Q.u.nA'#A *
"iDOG

Table of Contents
Summary . . . . . . ................... . . . . i
Spark Gap Electrode Erosion ............. ................ ..
References. . ........... . ............... . . 21
Appendices . . . . . ....................... . . . . . . 27
Publications and rnateractions ....... ........... . . . . 130
dpe
*,
* ....................................... . ..- ,•.

Spark Gap Electrode Erosion i•[['' %-
A. SUMMARY "--"
The work performed during this contract period has primarily
been concerned with clarifying some of the remaining questions on [-
performance limitations of high energy, rep-rated spark gap oper-
ation, i.e. voltage breakdown stability, electrode erosion, and i[
voltage recovery. The accomplishments during the contract period
sinclude : --
1. The theoretical model which had previously been devel- ./i
oped to describe the self breakdown voltage distribution ""[
* as a function of the relevant parameters (such as elec-
trode surface conditions, gas type and pressure, and -•-
charging rate) has been extended to include effects "••"
*caused by an inhomogeneous surface temperature distribu- -'-
tion and by variations of the work function over the i
surface due to surface contaminations..-.[
2. It has been found from a literature study, that one of
the major physical mechanisms likely to contribute to
erosion in all relevant parameter regimes is the impact ••••i
*of high temperature, supersonic "jets" - electrode
material ejected from the opposite electrode surface. . •[
The characteristics of the jets, the process by which"",
they are formed, and their influence on electrode ero- _
sion have mainly been discussed in early U.S., Soviet,...•..
.... ,. .

2 0
and Czech literature but have not been considered in
our previous work or in any of the recent U.S. or Soviet
literature on spark gaps. This provides new interpreta-
tions of our recent experimental results and may explain
the major trends and parameter dependence of erosion on
a physical basis. Futhermore, appropriate spark gap
design offers promise for dramatically reducing the
effect of erosion from this mechanism.
3. An experimental set up has been designed and tested
which allows for a decoupling of breakdown conditions
from the parameters relevant for erosion, i.e. gap dis-
tance, gas pressure, and current can be chosen indepen-
dently.
4. Important background information for the quantitative
analysis of erosion is a knowledge of the deposited
energy in both the arc plasma and the electrode surface.
Different diagnostic methods have been developed to
measure these energies or the deposited power in the arc
and in the electrodes. Measurements have been made for
a sample space of 3 electrode materials, 3 gases, and 3
gas pressures.
5. Additional information concerning the basic erosion
mechanisms in stainless steel, e.g. crack formation due
to material inhomogeneities such as manganese stringers,
has been obtained.
*..--..-.:..-.....-

... . . . . . . . . ..
3
6. Studies concerning the voltage recovery mechanisms for
rep rated spark gaps have been completed. For repeti- -
tion rates on the order of kHz the voltage recovery is
determined only by heat conduction in the electrodes and
the surrounding gas. These mechanisms have been investi-
gated by electrical diagnostics and interferometry,
yielding complete information about the temperature
distribution (temporal and spatial dependence) and its
influence on the breakdown voltage. The results allow
the development of scaling laws and design criteria for
b rep-rated spark gaps.
7. A facility for comparing high current, oscillatory dis-
charge effects with those previously obtained for unipo-
lar pulses has been constructed and instrumented.
B. MODELING OF SELF-BREAKDOWN VOLTAGE STATISTICS
Further development occurred on a model which relates the
electrode surface structure produced by a high energy discharge
to the self-breakdown voltage statistics. This model, previously
described in Appendix I of the Fourth Annual Report [1] on AFOSR
contract No. 49620-79-C-0191, has been modified to include the
electrode surface temperature and work function as spatially
dependent random variables. Details of this model are given in
the Preprint of "Modeling of Self-Breakdown Voltage Statistics in
High Energy Spark Gaps" in Appendix I and has been accepted for
publication in the Journal of Applied Physics.
""2 2'...
4
C. JET IMPACT EROSION (JIE)
During current conduction in a high energy spark gap high
speed (104 m/s), directed streams of ionized electrode vapor
("jets") are produced in the space adjacent to the electrode
surfaces. As the jets pass through the cathode and anode fall
regions of the arc they are thought to become superheated (up to
40,000 OK) and upon impact with the opposite electrode produce
macroscopic, crater-like, erosion. Numerous papers [2-25] have
recently been found in the U.S., Soviet and Czech literature
which describe both the means of jet production and its impor-
tance as a source of electrode erosion. The following includes
a review of the important literature, and a description of the
implications on more recent electrode erosion results at TTU and
elsewhere.
1. Jet Production
Although the existence of high velocity jets of electrodv-
vapor has been known since at least the 1920's, the mechanism
of their production and acceleration has been a subject of
considerable controversy since that time [2-9]. Starting with
the work of Haynes (2] and Finkelnbury [3] in the 1940's
serious attempts were made to explain the experimental find-
ings in terms of the electrodynamic and thermal processes
which occur in the region of the cathode and anode fall. A
thorough review of the work done prior to 1972 is given by
Holmes (7]. One of the most complete and tractable treatments
of this problem for cathode jets was made by Minoo [6], and is

reproduced here. In his work, based on the transport equa-
tions of magnetogasdynamics in the cathode region, he derived
an analytical expression for the plasma jet velocity v1 at
the end of the cathode region (assumed to be 10- 3 cm from the
cathode). It shows that v1 strongly depends on the discharge
current, I, and current density, J, the pressure, pl, at the
end of the cathode region, the ratio of the jet radius to the
cathode spot radius, a, and the properties of the cathode
material. To prove tnese dependencies he started with the
equation for the the energy balance in the cathode region;
given by
G = Pv + Pj + Pc + Pr, (1)
where G is the source power (assumed to be VarcI), and the
components of the power dissipated are: Pv- by cathode
heating and evaporation, Pj - by plasma jet heating and
acceleration, Pc - by heat transfer to the electrode, and Pr -
oy cathode spot radiation. The following expression (Eq. 2)
was then derived by a detailed analysis of Eq. (1) in the
..athode region.
Vc I = t(Q+hI + v 12 /2) + XI/J) 1 / 2 XTO + eaT0 4 (I/J) (2)
T bwith Q = Lf + Lb + f c(t)dT (3)
Ti
and hl = Na(5kT1 + eVi)/M (4)
'.S •

6 0
In these equations To is the cathode temperature at the
cathode surface, X is the average thermal conductivity, is
the total emissivity of the cathode surface, is the Stefan-
Boltzmann constant, Lf and Lb are the latent heat of fusion
and vaporization per unit mass, c(t) is the heat capacity per
unit mass, Ti and Tb are the initial and the boiling tempera-
tures of the cathode, hl is the enthalpy per unit mass of the
jet at the edge of the cathode fall, Na is Avayadro's number,
M is the atomic mass of the ions, Vi is the ionization
potential of the vapor atoms and T1 the temperature of the
plasma jet at the edge of the cathode fall. 0
From Eq. (2) and the other transport equations an expres-
sion for the velocity of the catnode jet was found which is
highly dependent on pressure and current. It is hoped that a
similar expression can be derived for anode jets as well.
2. Jet Characteristics
In order to substantiate a given mechanism which is
responsible for the jet production and to apply this infor-
mation to actual electrode erosion data the physical proper-
ties of the jet (temperature and velocity as a function of 0
space and time) need to be determined for differing discharge
conditions. Fortunately, many experiments have been perform-
6 ed which were designed to accomplish this and, although they
were performed under a variety of conditions, the following
list is a summary of those characteristics and trends appli-
cable to high energy sparks.
* 9 l

70
"* Initial jet temperature approaches 40,000 *K near the
electrode surface [101, (10 kJ arc)
"" Amount of jet material increases significantly with
voltage (could be current) [111
* Jet velocities increase with increasing current, and
approach speeds of 2 x 10⁴ m/sec (16, 221
e Initial jet velocities are independent of the surround-
ing gas pressure [21
* Jet emission occurs at high frequencies as a result of
explosive emission of vapor from the electrode surface
* due to the transient nature of individual arc attachment
points [13, 14, 201
"* Jets are always ejected perpendicular (within a very
* small solid angle) to the electrode surface regardless
of the angle of the arc column gradient [2]
"* Substitution of an oscillatory current pulse for a
* unipolar pulse produces little change in jet front velo-
city and, therefore, reversal of the electric field has
little effect [2]
* * Jets could be bent with an external magnetic field [2]
and interact with the magnetic field produced by the arc
current [23]
* * Anode and cathode jets interact, forming regions of com-
pression and rarefaction of the plasma which may move
from electrode to electrode [12, 19-21]
e Periodicity of jet structure in the direction of propa-
gation is inversely proportional to discharge volume
[11] "'
-.S
-:.. *.

8 S
0 Properties for jet production between two electrodes is
similar to processes occurring with an intense laser
beam interacting with an electrode surface [131.
The discovery of several of these characteristics
implied that the plasma jets could not only be a means of
erosion, since material which makes up the jet is part of the
electrode, but, more importantly, could act as a source of
erosion as they impacted the opposite electrode surface.
3. Jet Influence on Erosion
Perhaps the first indication* that jet impact was a
source of electrode erosion was reported by Zitka (15]. He --
concluded from experimental results that:
1. The wear of any electrode is influenced in most cases by
the material of the opposing electrode.
2. The wear depends primarily on the energy transmitted by
the vapor to the opposite electrode, and this energy
increases rapidly as the gap distance decreases.
3. "One can expect that anode wear will be greater than the
cathode wear in cases where the effect of the sprays
(jets) does not exceed the effect of the energies which
enter the electrodes by other paths".
Earlier work is often referenced buteat this time, trans-
lations have not been obtained. See, for example S.L.
Mandel'shtam and S.M. Raiskii, Izv. AN SSSR, ser.fizicn.,
13, 5, 549-565 (1949).
*L

9 0
Although these experiments were conducted at low levels
of energy (60 joules for a 500 V, 5 kA discharge) they were
important in that they suggested a "new" mechanism (JIE)
which could account for electrode erosion under certain con-
ditions. Beginning in the 1960's Sultanov and others (16-211
started to study the effect of JIE for high energy discharg-
es. Although much of their work made use of an electrode-
insulator arrangement which was designed to act as a nozzle
for the vapor jets, they reported that the results were simi-
lar for more conventional electrode arrangements. The princi-
ple findings of their work included:
1. The erosion pattern was essentially the same with or
without the pulse current actually entering the elec-
trode. ..
2. The amount of energy transferred to the electrode by the
jet is given by the following proportionality
1 2)w v'r (1 + Y2 Ma)
where v is the jet velocity, T is the jet temperature, Y
is the ratio of specific heats, cp/cv, and Ma is the Mach
number.
3. Regions of compression and rarefaction in the plasma
between the electrodes (produced by the interaction of
the sporadic emission of cathode and anode jets) moved
back and forth between the electrodes and their "contact"
with the electrodes was likely to be as important a
factor on electrode erosion as the initial jet impact.4. .

10 0
A theoretical comparison of the relative contributions of
40 several sources (jet impact, charged particle impact, joule heat-
ing in the electrode, radiation from the arc) to the energy
delivered to the electrode surface was done by Kalyatskiy et al.
[24]. They found that the energy delivered by the jets repre-
sented the largest source by one to two orders of magnitude.
Their calculations were done for breakdown through a solid
* dielectric but it is quite possible that the same trend would be S
true in gases (although probably not as large a difference).
It should be noted that Belkin and Kiselev, who are respon-
sible for a large portion of the Soviet electrode erosion work,
did mention JIE as a possible erosion factor in one of their
brief papers [251, but it is interesting that they and others
(II'in and Lebedev (26]) reference some of the literature men- 0 .
tioned above but never used this information to explain quantita-
tively their results.
4. Implications on Previous Erosion Results
The mechanism of electrode erosion by jet impact possi-
bly explains several phenomena which have defied adequate
explanation in the past: S
Material removal parallel to the electrode surface - It has
been reported for a wide variety of conditions that the bulk
of the electrode material is removed in droplet form parallel
to the electrode surface [27-311. Several theories were
developed (32,331 which explained droplet formation in terms
of various mechanisms for material removal from the micro-
scopic craters formed by the individual points of current
.*.'.................................... . . . .'
•- .'•.- +.j." ..- jo-'•'-. +.- , • -..- .. .-.. ,." ...- % .. '...-.- -. -°-'-. .-.. .-.. .... . . . . . .•.. . . . . . . . .. ,..,,.. . .... ,.-.. .,.. ..... ,- -,. ... '

110
attachment in the arc. However, Daalder [27] showed that the
droplets were often considerably larger that the craters and
thus, their origin must be from another source. Although
several suggestions have been given to explain the removal of
the molten material - J x B forces (Belkin [34]), .
thermoelastic waves (Rakhovskii [35]), and hydromagnetic flow
of the molten material (Watson [361) - it is oelieved that
the experiments by Sultanov [16-21] strongly suggest the
material is removed primarily by jet impact. For example,
metal surfaces which were eroded by jet impact with and with-
out current flow were virtually identical. (They also bore a
remarkable similarity to the surfaces generated under unipo-
lar pulse conditions at TTU). Thus, upon hitting the opposite
electrode, high speed vapor jets melt the surface and remove
the molten material as the jet is directed by the surface in
the radial direction.
p..Erosion as a function pressure - Although experimental
results for erosion as a function of pressure are quite
varied (23, 34, 37, 401 generally the results can be grouped
Sinto two categories for pressures greater that 10-2 atm - the
erosion either increases or does not change with increasing
pressure. Most of the results which showed an increase
* involved reducing the gap spacing as the pressure was
increased to keep the breakdown voltage and current the same.
Interestingly, Gruber [371 found that there was a true dis-
* tance effect (erosion decreasing with increasing distance)
and when distance was fixed the erosion remained constant for
.*-

12 0
increasing pressure (keeping current and voltage the same by
using an external trigger). His results explain the other
observations in that the increased erosion with pressure was
probably due to the corresponding decrease with distance
although Gruber offered no physical explanation. Erosion by
jet impact clearly would predict this trend, since at shorter
gap distances the jet does not loose as much energy or become
as diffuse.
To examine the effect of JIE several experiments are
currently being designed. These experiments are scheduled
for completion in May 1985. The experiments will make use of
a special, ferrite isolated circuit designed to trigger the ...-
spark gap externally so as to allow for the decoupling of the -.
variables which may affect erosion.
D. POWER DISSIPATED IN THE ARC PLASMA AND THE ELECTRODES .
1. Measurement of tne Power Dissipated in the Arc
Information about the power dissipated in the arc plasma
(including the attachment sites at the electrodes and its
dependence on the relevant parameters (material and circuit
0 data)) is important for the quantitative analysis of elec-
trode erosion.
The general problem in determining arc voltage or resis-
tance is the presence of inductive terms in the circuit equa- 0
t ion
VO f1 d t + (dL +R i + L di,
. . .. -. . .~... --'_-" '-" " '". . .. ." .• "."-

13
where L= LO + Larc(t), R = + Rarc(t) with Lo, RO are the
circuit values which are determined by bulk material proper-
ties (major part is time independent) and surface properties
(time dependent via skin effect).
The arc resistance Rarc(t) has been determined with
reasonable accuracy by measuring the arc radius vs time
(using a streak camera registering the self luminance), and
by estimating the circuit parameters, Lo, Ro, from a basic 0
treatment of the time dependent skin effect [41]. These
estimates have been checked by measurements of the anode and
cathode voltage.
The measurements have been performed on an over-damped
spark gap set up (Fig. 1) with a breakdown voltage of 35 kV
and a maximum current of 30 kA. Figure 2 shows, as an
example, the waveforms of current, arc resistance and resis-
tive arc voltage drop for graphite electrodes and SF 6 filling
gas at a pressure of 1 atm. The overall results can be sum-
marized as follows:
1. Within the statistical error the resistance is indepen-
dent of the electrode material.
2. The dependence of the minimum arc resistance on gap dis-
tance and pressure is
Rmin a• pd
3. The constant a depends on the gas and has the values
a f 31 + 7 for air
48 + 15 for N2 .
71 + 17 for SF 6 in (E as27)c bar
- °. ... ... . . . - .. .. • o. ,. ......... .. ... ........ .- .. '.

14
-CATHODE SHAFT1P
xlý_-
411
U *U *U U U U U U* * * U U U U -U * U U* U U U U U U U U *U E* T IPS *
U.. ¶U"roe ,

156
30
hh 20
wS 10
00 1 2 a 5
0.5 11U,
0.40
S '-~0.3
wUZ 0.2'C
b-4 0.1w
0.00 1 2 3 45
06
0
0-
* ~TIME E MICROSECONDS 3
Fig. 2 Current, arc resistance and resistive arc voltage vs timefor graph ite-electrodes (gap distance 0.76 cm), fillinggas SF6 at a pressure of I atm.

160
4. The time dependence R(t) is in reasonable agreement with
*the description by Mesyats [42].
Table 1 gives an overview on some of the results
* (minimum arc resistance and total energy dissipated in the
arc) for a variety of parameters.

17 0
TABLE I
Electrode gas pressure Rmin Rmin/Pd Ediss(J)Material
SS air 1 41 32 702 33 30 673 29 30 62
Graphite air 1 55 42 882 42 33 733 36 31 67
CuW air 1 51 37 792 35 28 693 27 20 57
SS N2 1 76 72 1102 65 59 103 -
3 45 43 83
Graphite N2 1 51 45 902 48 43 783 46 41 81
CuW N2 1 81 60 1202 50 31 753 56 32 90 p
SS SF 6 1 39 77 812 40 68 773 39 69 74
6 Graphite SF 6 1 34 72 64 S2 34 68 603 24 46 51
CuW SF 6 1 42 90 762 34 67 653 40 79 73 9
Min. Resistance Rmin, Rmin/pd and Energy dissipated in the arc S
for different parameters. Total energy is 1.15 kJ.
U.•.-- .'

18
2. Measurement of the energy deposited
To calculate the amount of energy deposited in the elec-
trode and its origin an experiment is being performed similar
to those done by Carder [43] and Foosnaes and Rondeel [44].
Figure 3 shows a typical heating and cooling curve for a
thermally isolated electrode. Basically the experiment con-
sists of measuring the temperature of the electrode during
the cool-down cycle and calculating the effective temperature
produced at the electrode during the firing cycle. From this
information the energy delivered to the electrode per shot is
calculated from E = McAT, where m = mass and c = specific
heat. A microprocessor controlled temperature acquisition
device has been interfaced to our laboratory computer and the
required thermocouples have been tested. In order to check
the dependency of the energy on the resistive losses in the
electrodes three different electrode materials are being used
whose resistivities vary by almost three orders of magnitude
(copper-tungsten; 3.4 1i•cm, stainless steel; 72 picm, and
graphite; 2700 p•cm). To determine the effect of the gas the
b tests will be run in air and inert gases for pressures up to
3 atm. Both sets of experiments will be run with a ringing
and a unipolar pulse and the results will be compared with
b the erosion rates obtained for these two pulse types in order
to see if a correlation exists between the energy deposited
in the electrode and the erosion rate.
S 9
......................................................................

190
00
0 z
00
a- Cl
I 0
0 -
0l 0
Z >1
000 E-
ra
0 ~ 0 o
CL ix
L~d L
0 2W 4 z z
wn w
Li.
o ~ 0 E0-'
Milndw3

20
E. Electrode Surface Analysis
Surface analysis work continued on tne spark gap electrodes.
This work, partially described in the Final Report [1] on AFOSR -
contract No. F49620-79-C-0191, is described in detail in Appendix
II and is currently being revised in order to be submitted to the
Journal of Applied Physics.
F. Voltage Recovery
Voltage recovery studies were concluded and resulted in a
Ph.D. Dissertation [45]. Details of the diagnostic techniques
and the results are discussed in a conference proceedings paper
[46) reprinted in Appendix III.
* S .
*O
-I
• -
..............................................................,..

21 0
F. REFERENCES
1. Final Report on Coordinated Research Program in Pulsed Power
Physics, February 27, 1984, AFOSR Contract # F 49620-79-C-
0191.
2. J. Haynes, Phys. Rev., 73, 891 (1948).
3. W. Finkelnburg, Phys. Rev., 74, 1475 (1948).
4. A.A. Plyutto, V.iN. Ryzhkov, and A.T. Tapin, Soviet Phys.
JETP, 20, 328 (1965).
5. H. Hugel, G. Kruelle, and T. Peters, AIAA Journ., 5, 551
(1967).
6. H. Minoo, 11th International Conference on Phenomena in
Ionized Gases, Prague, Czechoslovakia, 74, (September "
1973).
7. Electrical Breakdown of Gases, J.M. Meek and J.D. Craggs,
ed, John Wiley and Sons, Chapter 11, p. 855 (1978).
8. M.P. Zekster and G.A. Lyubimov, Soy. Phys. Tech. Phys., 24,
1 (1979).
9. B. Ya Moizhes and V.A. Nemchinskii, Soy. Phys. Tech. Phys.,
25, 43 (1980).
10. N.K. Suknodrev and S.L. Mandel'shtam, Optics and Spectro-
scopy, 6, 473 (1959).
11. L.I. Grechikhin and L. Ya Min'ko, Sov. Phys. Tech. Phys., 7,
784 1963).
12. M.A. Sultanov and L.I. Kiselevskii, High Temperature, 4, 34
((1966).
•'i / ''"- <-<-" - - ." - .. - . - .- "- ". '-- . - -. -. .' . " " ", - '. . "" " - .S-'" *-.- ..... " *.............-"-- :" -""-' ' .- ,-......". -' -- . ...... -'.-', '.- .'.- . .-- -."•'. .-••"<..-. -. -i••

"- • •" " • . -i-I - " . • ." "- " " " •'- •- J ' " - .-- ,- I. * • . -• - j - -- - . • : • % < - r .
22
13. L.I. Grechikhin and L. Ya Min'ko, Sov. Phys. Tech. Phys.,
12, 846 (1967).
14. B.B. Davydov and L. Ya Min'ko Sov. Phys. Tech. Phys., 16, 53
(1971).
15. B.H. Zitka, Czech. Journ. of Phys., 3, 241.(1953).
16. M.A. Sultanov and L.I. Kiselevskii, High Temperature, 4, 375
(1966).
17. M.A. Sultanov, 9th International Conference on Phenomena in
Ionized Gases, Bucharest, Romania, 669 (1969).
18. M.A. Sultanov, High Temperature, 8, 906 (1970).
19. M.A. Sultanov, Soy. Phys. Tech. Phys., 19, 478 (1974).
20. M.A. Sultanov and L.D. Senickin, Soy. Phys. Tech. Phys., 20,
1089 (1975).
* 21. M.A. Sultanov, Soy. Phys. Tech. Phys., 21, 815 (1976).
22. S.V. Gurov, T.A. Dzhafarov, A.A. Malinin, B.A. Osadin, and
Yu. F. Tainov, Soy. Phys. Tech. Phys., 9, 665 (1964).
* 23. R. Dethlefsen, Aerospace Research Laboratories Report
# ARt 68-0112, p. 48 (June 1968).
24. 1.1. Kalyatskiy, V.I. Kurets, E. and E.N. Tarakanovskiy,
* translation from Elektromaya, Obrabotka Materialov, 76,
44-48.
25. G.S. Selkin and V.Ya. Kiselev, Soy. Phys. Tech. Phys., 12,
702 (1967).
26. V.A. Il'in and S.V. Lebedev, Soy. Phys. Tech. Phys., 7, 707
(1963).
4 27. J.E. Daalder, Physica, 104c, 91 (1981).
*", 9 .

N . - -.•
23 ,
28. Y. Udris, Proc. (st Int. Conf. on Gas Discharges, London,
England, 108 (1970).
29. G.A. Farrall, F.G. Hudda, and J.C. Toney, IEEE Trans. on
Plasma Science, PS-11, 132 (1983).
30. S. Shalev, I. Goldsmith, and R.L. Boxman, IEEE Trans. on
Plasma Science, PS-11, 146 (1983).
31. A.L. Donaldson, M.O. Hagler, M. Kristiansen, G. Jackson, and
L. Hatfield, IEEE Trans. on Plasma Science, PS-12, 28
(1984).
32. E.W. Gray and J.R. Pharney, J. Appl. Phys., 45, 667 (1974).
33. G.W. McClure, J. Appl. Phys. 45, 667 (1974).
34. G.S. Belkin and V.Ya. Kiselev, Soy. Phys. Tech. Phys., 23,
24 (1978).
* 35. V.I. Ratkhovskii and A.M. Yagudaev, Soy. Phys. Tech. Phys.,
14, 227 (1969).
36. A. Watson, Proc. 2nd IEEE Int. Pulsed Power Conf., Lubbock,
* Tx, 471 (June 1979).
37. J.E. Gruber and R. Suess, Max Planck Inst. fur Plasmaphysik,
Garching bei Munchen, IPP 4/72 (Dec. 1969).
fb 38. R.A. Burden and T.E. James, Proc. 7th Symp. Fusion Techno-
logy, Grenoble, France, 24 (Oct. 1972).
39. C.W. Kimblin, J. Appl. Phys., 45, 5235 (1974).
40. C.W. Kimblin, IEEE Trans. on Plasma Science, P3-10 322
(1982).
41. J. Knoepfel, Pulsed High Magnetic Fields, North Holland
* Publishing Company, Amsterdam-London, pp. 46-72, (1970).

24
42. Mesyats, G.A., "Techniques of Shaping High voltage Nano-
second Pulses", FTD-HC-23-643-70, Foreign Technology Divi-
sion, Wright-Patterson Air Force Base, March 1971.
43. B. Carder, Physics Int. Report., PIIR 12-74 (Dec. 1974).
44. J.A. Foosnaes and W.G.J. Rondeel, J. Phys D: Appi. Phys.
12, 1867 (1979).
45. C.H. Yeh, Doctoral Dissertation, August 1984, Texas Tech
University.
46. C.H. Yeh, M. Hagler, M. Kristiansen, and H. Krompholz,
"Recovery Measurements in a Spark Gap", 16th Power Modulator
* ~Syn~. Arlington, VA (1984.

25 0
Interact ions
a. Papers
* K. Schoenbach, G. Schaefer, M. Kristiansen, H. Krompholz,
H.C. Harjes, and D. Skaggs, "Investigations of E-Beam
Controlled Diffuse Discharges", IEEE International Conference
• on Plasma Science, St. Louis, MO, 1984.
K.H. Schoenbach, G. Schaefer, M. Kristiansen, H. Krompholz,
H. Harjes, and D. Skaggs, "Investigations of E-Beam Controll-
ed Diffuse Discharges' 4th Int. Symp. on Gaseous Dielec-
trics, Knoxville, TN, USA, 1984.
b. Consultative and Advisory Functions
1. Dr. M. Kristiansen served on the UShF Scientific Advisory
Board (SAB).
2. Dr. Kristiansen served on the AF SAB committee to study
Basic Research in the Air Force.
3. Dr. M. Kristiansen served on the Air Force SAB Ad Hoc
committee on Effects of High Altitude EMP on Military
* C3.
4. Dr. Kristiansen served as to Co-organizer (with Dr. A.
Hyder of Auburn University) of the DoD workshop on-
4- "Foreign Switch Technology".
•~.-. . . ... °...................°........•. .•..... . .° .. •.. °• . . ° .••. . . . . . ..

26
5. Dr. Kristiansen served as a Visiting Staff Member
(Collaborator) at Los alamos National Laboratory and
supervised a completed Ph.D. reseach project by one of
their Staff Members.
6. Dr. Kristiansen directed the Foreign Applied Science
Assessment Centers Study of Soviet Macroelectronics
(Pulsed Power).
c. Other Interactions
1. Dr. Kristiansen gave an invited lecture series on pulsed
power in Taiwan and Japan (together with Dr. F. Rose,
NSWC).
'.°...,
-......... .... .. ... .`... .`.......... . `.`... •...... i... .-... , - '.:.- - . ... ' .-- ."' . .. - - -. i k "

Accepted for publication in
Journal of Applied Physics
Appendix 17
MODELING OF SELF-BREAKDOWN VOLTAGE STATISTICS
IN HIGH ENERGY SPARK GAPS 0
A. L. Donaldson, M. 0. Hagler, M. Kristiansen
Department of Electrical Engineering/Computer Science
Texas Tech University, Lubbock, Texas 79409
L. L. Hatfield
Department of Physics
Texas Tech University, Lubbock, Texas 79409
and
R. M. Ness p
Maxwell Laboratories
8835 Balboa Avenue, San Diego, CA 92123
Abstract
A model which incorporates the influence of electrode sur- -
face conditions, gas pressure, and charging rate on the voltage -
stability of high energy spark gaps is discussed. Experimental
results support several predictions of the model; namely, that
increasing the pressure and the rate of voltage charging both
produce a broadening of the self-breakdown voltage distribution,
whereas a narrow voltage distribution can be produced by supply-
ing a copious source of electron3 at the cathode surface.
. .. . . . . . . . . . . . . .•.
-1- I.. . . . . .

~-- -~- - - - -. - -- , - °.Oo
28 0
Experimental results also indicate that two different mechanisms
can produce this broadening, both of which can be taken into -
account with the use of the model presented. Further implica-
tions of the model include changes in the width of the self-
breakdown voltage probability density function as the primary
emission characteristics of the cathode are modified by, for
example, oxide or nitride coatings and/or deposits from the
insulator. Overall, the model provides a useful and physically
sound framework from which the properties of spark gaps under a
wide variety of experimental conditions may be evaluated.
Introduction
Low-jitter, triggered spark gaps are needed for a wide vari-
ety of switching applications, including fusion machinesl, wea-
pons systems, and high energy physics experiments. To achieve
low jitter, the switch should be triggered as close to the
self-breakdown voltage as possible. Thus, an ideal switch
should have a delta function for the self-breakdown voltage
probability density function. In actual operation the self-
breakdown voltage will be somewhat erratic, and in most cases
"prefires", or breakdown voltages which are significantly less
than the mean, will occur. The self-breakdown voltage density
functions and the respective distributions for these cases are
shown in Fig. 1. This paper presents a model which incorporates
the processes which can produce the voltage distribution shown in
Fig. l(b). The problem of prefires is not addressed here but is
being considered for future work.
-2-

29 0
Numerous studies 2 - 6 have shown that the choice of gas,
electrode, and insulator material can significantly influence the
width and shape of the actual voltage density function. More
specifically, several studies 7 - 9 have suggested a correlation of
the statistical distribution in the self-breakdown voltage of a
spark gap and the properties of the cathode surface, including
its microstructure. The data have been interpreted in terms of
models that consider:
1) the effect of the field enhancement, due to cathode micro-
structure, and the effect of lower surface work functions,
resulting from surface coatings, on the generation rate of
electrons at the cathode 7 , 1 0 ,1 1 ,
2) the effect of the field enhancement on Townsend's first
ionization coefficient, a,7,12,13, and
3) the effect of the surface coatings and the applied field on°*.
the secondary emission coefficient, y, at the cathode 1 4 .
These models usually include the concept of "waiting-for-an-
electron," in that breakdown is assumed to occur when the first
electron appears at the cathode after a breakdown condition
(Townsend or Streamer condition) has been satisfied. The 0
theoretical model presented here includes all of these mechanisms
by which the cathode surface can affect the statistical distribu-
tion in the breakdown voltage, and includes the field enhancement
effects on the cathode surface in a new way.
Hodges 1 5 et al. take into account the probability that no
breakdown occurs even if the breakdown condition is satisfied.
However, this probability goes from 0 to 1 quite rapidly near
-3-

- - -'.-- r.--s.---,-
30 0
self-breakdown and hence is ignored for simplicity in the present
analysis.
Theoretical Model
General Case
Consider a spark gap subjected to a monotonically increasing 0
applied voltage, v(t). Denote the breakdown voltage, a random
variable, as V. The field enhancement factor, M, defined as the
ratio of the enhanced electric field at the cathode with micro-
structure to the electric field without microstructure, is also
considered to be a random variable (the underlying sample space
is the geometrical surface of the cathode). The random variable
M is characterized by a probability density function, PM(m). A
basic assumption of the model is that the gap breaks down when anelectron is born at a site on the cathode surface where M is as
large as or larger than the value that satisfies the breakdown
condition (perhaps Townsend or streamer) *at the particular
voltage applied. We denote this threshold value of the field en-
hancement as mt(v). Physically we expect that mt(v) is a
monotonically decreasing function of v (3mt(v)/av<O), an increas-
ing function of pressure (amt(v)/3p>O), and that mt(O) = . and S
mt(vmax) = 1. Figure 2 shows an actual calculation of mt(v)
using a model microstructure described in Appendix A. The trends
for this model are listed in Table I.
We now calculate the probability, Pt, that the gap breaks
down during the time between t and t + at and hence at a voltage
between v and v + Av. For at small, the probability (apt) that
an electron is born between t and t + At at a site where M takes
a value between m and m + am is
-4-
- • . '.". . o. , o... ..... j-. . .o .j- .. . . . . . . . . . . . -. . ... - . .. . .. -
S~~~. . . . . . . . ....... . ."._,. .- _.._ '...."_-.,..'_ii,. •..- .- . .

31 0
ie(m,v(t)) tap At PM(M) am()•Pt = e
The quantity e is the charge on an electron and ie is the primary
electron current generated at the cathode. In general, ie could
be generated naturally by:
a) cosmic rays ionizing the gas in front of the cathode
surface1 6 ,
b) Fowler-Nordheim field emission1 7, and/or
c) Schottky field assisted thermal emission1 0 .
These emission processes could occur directly from the cath-
ode material or from compounds existing on the cathode surface
whose work function is usually lower than that of the metal and
which can be effectively lowered even further by surface charg-
ing. Thus, in general, ie could be a function of total cathode
surface area, voltage, field enhancement, temperature, and work
function. The last three are also functions of the position on
the surface. For the following formulation, however, we will
represent ie as an explicit function of field enhancement and
voltage only (see Appendix B).
If at is large compared with the time of avalanche forma-
tion (see Appendix C), then the probability that the gap breaks
down between t and t + at is
AtPt(at) = f ie(mv(t))PM(m)dm (2)
mt(v)
*. ~ *." .- ."

32
Let the random variable T represent the time elapsed before
breakdown of the gap. Then, from Eq. (2), the probability
density function for T is readily seen to be 1 8
PT(t) = f(t) exp f f(,r)dr (3)
where
f(t) = - f ie(m,v(t))pM(m)dm. (4)
e mt(v(t)) -
Since, by assumption, v(t) is a monotonic function of t, then the
probability density function for the breakdown voltage, V, is 1 9
PV(v) zPT(t(v)) IdI (5)
or 2 0
PV(v) = exp - ) (6) P
where v' is the derivative of the charging voltage with respect
to time (dv(t)/dt) and
X~vf ie(m,v)pM(m)dm. (7)e mt(v)
It is easy to see that
v p(_v X(-dn
Fv(v) f PV(&)d= 1 - exp- 75 ' (8)
where Fv(v) is the cumulative probability distribution for the
random variable, V. Equation (8) shows that the width of the
self-breakdown voltage distribution: 1) decreases with increasing I
ie, 2) increases with increasing mt caused by, for example, an
-6- S

33 6
increase in operating pressure, and 3) increases with increasing
vt, the charging rate. Note that v' is to be evaluated at v, and
hence can be considered as a function of v, namely, v' = v'(v).
If v(t) is a ramp, then vt = vol, a constant. If v(t) is an RC
charging waveform, then v1 = (vo-v)/RC where vo is the charging
voltage. If v(t) = A(l-coswt) for 0 < tat < -, then v'
Svv(2A-v).
From Equations (7) and (8), it is easy to show2 0 that
1O v'Pv(V)f ie(m,v)pM(m)dm = (9)
emt(v) IF~)[
Notice that all the terms on the right hand side of Eq. (9) can
be measured experimentally. This will hold true for the special
cases discussed below as well. This is an important result, for
even when ie depends on (implicit) variables other than m and v,
the function v'pv(V)/(l-Fv(v)) should still describe the results.
Special Cases
To proceed further, consider two special cases of the model.
First, suppose that ie(m,v) is constant so that field enhancement S
distribution effects from the cathode surface microstructure and
waiting-for-an-electron effects are the primary physical mechan-
isms included in the model. This circumstance is likely to hold,
for example, when the cathode is illuminated with sufficiently
intense ultraviolet radiation so that any field emission current
is dwarfed by photoelectric current, which should be independent
of H and V. If ie i eo' a constant, then Eq. (9) gives
S-.? 1 •
------------------------. ~ t.' t.

34 0
leo V'pv(V)- -FM(mtv))l =(10)
e 1-Fv(V) (
where FM(m) is the cumulative probability distribution for the
random variable, M. If we know mt(v), we can determine FM(m) by
plotting FM(mt(v)) versus mt(v). Therefore, for this special
case it is possible, in principle, to deduce FM(m) from pv(v)
(self-breakdown voltage histogram) under a given set of condi-
tions and thus predict pV(v) (or FV(v)) for a different v' or gas
pressure (which affects mt(v)), for example. For this special
case, Eq. (8) becomes
PV(V) l-exp ieo v (l-FM(mt(n)d) /(1Fv(V) = l-exp f' (V)e 0
Consider now a second special case in which PM(m) =
(m- io), where S(.) is the Dirac delta function and mo is a
constant. In this case the field enhancement is assumed to be
uniform (that is, sufficiently characterized by its mean value
rather than its distribution) so that the primary effects in-
cluded are the voltage dependence of the primary electron cur-
rent, ie, and waiting-for-an-electron. In this case Eq. (8)
becomes
1 v ie((mo,n)drn-Fv(v) = l-exp - , (12) 0
where vt is the threshold voltage, and mt(vt) = mo, while Eq. (9)
becomesv' PV( v)
ie(mo,v) = • (13)l-Fv(v)
S -8-

35
Exverimental Arrangement .
The experimental arrangement and the system diagnostics used
to test the theoretical results are shown in Fig's. 3 and 4. The
construction of this facility and the development of the modeling S
software is described elsewhere 9 , 2 1 . The test circuit shown in
Fig. 4 consists of a high energy (2 kJ) pulse forming network9(PFN) and a low energy (<1 mJ) RC probing circuit. The PFN
delivers a unipolar, 25 uIsec pulse into a 0.6 9, matched load in
order to generate an electrode surface which is characteristic of
a high energy switch. The RC probing circuit is used to generate
the voltage distributions with a low energy, low current pulse so
that the equilibrium temperature is reached prior to each shot.
This low energy circuit is also used so that the surface micro-
structure produced by the high energy shots will not be altered
significantly from shot to shot. The criteria for determining
that no alteration in surface features had occurred was the
comparison of the voltage distributions before and after a given
experiment. The pressure in the spark gap could be raised to 3.5
atmospheres and the voltage ramp rate could be varied from 3 to
60 kV/s by changing Rc. A 5 Watt UV lamp was used to generate
additional electrons at the cathode surface when needed.
A testing sequence consisted of firing 2000 - 7000 shots at 5
high energy, waiting approximately one hour for the electrode to
cool, and proceeding with several series of 500 low energy shots
with different ie, v', and pressure. The Kolmogorov - Smirnoff 2 2 5
test indicates that this number of shots should determine Fv(v),
* ~-9-. . .. . .- °. .

36
within a confidence level of 99%, to an accuracy of 7%. Figure
5 shows a typical electrode surface generated by the high energy
pulses for the case of 304 stainless steel run in one atmosphere
of nitrogen gas at a gap separation of 5 mm. Examination of the
electrode surface after application of the low energy pulses
indicates that no significant changes had occurred which might
alter the breakdown statistics.7
Experimental Results
Several experiments were performed to verify the model's
predictions for the effect of ie, v', and pressure on the proba-
bility density function pv(v). In the first experiment, an UV
source was used to generate a continuous supply of photoelec-
trons at the surface of a stainless steel electrode in air. Fig-
ure 6 shows that, without UV, the density function is very broad;
indicating that the cathode surface is a very poor emitter of
electrons. However, with the UV source on, the density function
is reduced and shifts to the lowest value of breakdown voltage.
Nitta, et al. 2 3 , observed the same effect in SF6 at pressures up
to 2 atm. This result is significant for at least two reasons.
First, it supports the waiting-for-an-electron concept as one
mechanism responsible for statistical variation in the self-
breakdown voltage; and second, it provides an externally
controllable experimental "switch" where the effect of waiting-
for-an-electron can be turned on or off. The behavior observed
is consistent with Eq. (8).
A second experiment consisted of varying the voltage ramp
-10-
• . ,-.-....-..,... ,,.--,- -..-,...,.-.,....-..-,.-.-,.-.-..-..........................................,.,..,.,......-,..,......'. . .. .-.

.. I -. . . -
37 0
rate v' from 3 kV/s ("slow" ramp) to 30 kV/s ("fast" ramp). Ac-
cording to the model (Eq. (8)), if you are waiting for an elec-.
tron to appear, then the faster the ramp rate, the higher the
breakdown voltage will be when the electron appears and thus the
greater the scatter in the density function, pV(v). Figure 7 .
shows that this effect was indeed observed. Also, from Eq. (8),
the density function for the slower ramp rate could be theoretic-
ally calculated from the data for the fast ramp rate. Figure 7 -
shows this result for the assumption ie = ieo, a constant. The
result is fair, indicating that for better agreement a more
realistic expression for ie, perhaps ie(m,v), would have to be 6
used. Hodges 1 0, 1 I has modeled this effect using ie(m,V,O,T) and
was able to achieve good agreement between experimental and
theoretical values.
Previous work 1 3 , 2 4 - 2 6 has shown that with the presence of
cathode microstructure, an increase in pressure can lead to sig-
nificant deviations from the Paschen curve breakdown voltage if
the product of the protrusion height and the pressure is greater
than a gas dependent threshold. For example, Berger 1 3 calcu-
lated that pressure-height products of 30 umnatm for SF6 and 200
um-atm for air would be required for the onset of breakdown vol-.
tage modifications due to enhanced ionization occurring near the
microprotrusions. Avrutskii 8 stated that an increase in pressure P
should lead to an increase in scatter in the breakdown voltage,
but no data were given. Thus, in order to understand the effect
of pressure on the breakdown voltage statistics for a surface
with large protrusions, the brass sample shown in Fig. 8 was
*-il- S.
. . . .-. .,.•
... ,- .. .. .' t -' -' - ,. ', . - . .- .- .. ,. -,. ., %, • , ', '. " . - , .. .- . .. - . " - ,. .. '- ".\ .*...-. .. , . -

38 0
generated and the breakdown voltages were recorded for pressures
up to 3.5 atmospheres. (Earlier work in electrode erosion showed
that brass electrodes in high energy operation can form protru-
sions up to 500 um2l.) Figure 9 clearly shows an increase in
scatter, especially at the low end, in the density function pv(v)
for higher pressures. If the effect is due to field enhance-
ments, then the calculated range of m's at any pressure should be
the same since the distribution of surface field enhancements is
not changing from shot to shot. For p = 1.7 atm, the range of
m's, calculated using the model in Appendix A, was 1 - 2.93; for
p = 2.5 atm, the range was 1 - 3.63.
Increased scatter with increased pressure has also been
observed for electrode surfaces with microstructures much smal-
ler than the size required to affect the breakdown voltage.
Figure 10 shows the breakdown voltage distribution as a function
of pressure for graphite electrodes in air. The entire elec-
trode surface was examined with a high power optical microscope . .
and no protrusions greater than 10 um were discovered. Although
the pressure-height product is an order of magnitude less than
the amount required to affect the breakdown voltage by enhanced
ionization1 3 , there is still a significant spreading of the
distribution at higher pressures. Unlike the results for the
brass electrodes, the spreading occurs at the high end of the
distributions, i.e., for voltages larger than those calculated
from the Townsend breakdown criteria for a gap without protru-
sions, and M = 1. Whereas the results for brass indicated a
lowering of the Townsend breakdown criteria due to enhanced
* -12-
.• - - , •• . - ° - ' . ' . ' .° . " -• ° ° . -, ° .b• " ,- ' ° ..• ° . • ° " - " . , °° . ,-.- - ° . . - -., ' .' '

39 0
ionization, the results for graphite indicate that a different
mechanism is producing the scatter at high pressures; seemingly,
by altering the effective generation rate of electrons. Levinson
and Kunhardt 2 7 have reported a reduction in the effectiveao
electron generation rate at the cathode for higher pressures,
although no specific mechanism was described.
The pressure data were also found to be of importance for
analyzing the different ie cases which were studied theoreti- 0
cally. Figure 11 shows theoretical plots of the quantity
v'pV(v)/(l-Fv(v)) for the three physical cases discussed ear-
lier: a) ie = ie(mo,v), mo is a constant over the entire surface
(Eq. (13)); b) ie ieo is a constant (Eq. (10)); and c) the most
general case, ie = ie(m,v) which assumes a distribution of sur-
face field enhancements (Eq. (9)). A Gaussian distribution in
field enhancements was used for cases b) and c). The function
mt(v) was calculated using the model described in Appendix A and
a Schottky emission current was used for ie(m,v). Case a) illus-
trates that if there is no spread in the distribution for M (Eq.
(13)), then an increase in pressure will correspond simply to a
higher emission current because of the higher breakdown voltage
occurring at that pressure, which is typical for a field
dependent Schottky or Fowler-Nordheim emission mechanism1 0 . A
higher emission current at higher pressure would imply narrower
statistics, but experimental results indicate just the opposite;
namely, broader statistics at higher pressures. However, in4
case b) for a fixed voltage, the increase in pressure has the
effect of raising the threshold, mt, required for breakdown,
4 -13-

40
which raises FM(mt(v)), and thus the function v'pV(v)/(1-Fv(v))
is multivalued and decreases with increasing pressure (Eq.
(10)). For case c) v'pv(v)/(l-Fv(v)) is also multivalued and de-
creases with increasing pressure, but in a different way (Eq.
(9)). For a fixed voltage, and assuming that the surface
features do not change with pressure, the integrand is constant
with increasing pressure. However, the lower limit on the inte-
gral, namely mt(v), increases with increasing pressure which has
the effect of reducing the value of the function.
Figure 12 is a plot of the function v'pV(V)/(l-Fv(v)) from
experimental data for the pressure data of Figure 9. From this
plot it is clearly seen that the experimental data are inconsis-
tent with the theoretical results for case a) (a constant M sur-
face). Thus, the effect of a distribution in field enhancements
should be considered in the analysis of the breakdown statis-
tics. In addition, the function v'pv(v)/((l-Fv(v)) increases
very rapidly with voltage and only very extreme values for the
work function, 0 < 0.5 ev, and field enhancement, M 5 50, could
give reasonable agreement between the experimental data and the
Fowler-Nordheim or Schottky field emission mechanisms. - -
ConclusionS
A model has been described which correctly accounts for the
influence of pressure, v', ie, and surface microstructure on the
self-breakdown voltage statistics. The model's importance in the
area of pulse-charged and triggered switches stems from the fact
that the statistics for these systems have been recently shown 2 8
-14- AL

41 0
to be heavily dependent on the self-breakdown statistics dis-9
cussed in this paper.
Using this model, theoretical and experimental results show:
1) The spread in self-breakdown voltages in a spark gap is 2a function of the charging rate (v') and the cathode surface
properties which determine the electron emission current ie and
the distribution of field enhancement sites FM(m).
2) Increasing ie provides a practical method for reducing
the width of the self-breakdown voltage density function. This
can be accomplished with an external UV source, by sandblasting
the electrodes to supply a large number of low work function
emitting sites 2 8 , or perhaps with an electron emission agent
introduced into the cathode material 2 9 .
3) The spread in self-breakdown voltages increases with
increasing pressure, and/or increasing charging rate.
4) Increasing pressure had two distinctive effects on the
breakdown voltage distributions. For large microstructures (>200
um) on brass electrodes, increasing pressure led to increased
scatter at the lower end of the distributions as a result of
enhanced ionization near the microprotrusions. For small micro-
structures (<10 um) on graphite electrodes, an increase in pres-
sure led to increased scatter at the high end of the distribu-
tions which presumably was due to a lowering of the effective
electron emission current, ie.
5) The f unction v'Ipv(v)/(l-Fv(v)l which can be computed
directly from self-breakdown voltage data, is useful for deter-
mining the nature of ie for a given set of conditions.
4-15- I

b 42
Acknowledgments
The authors are indebted to B. Conover, P. Krothapalli,
K. Rathbun and A. Shaukat for their work an the construction of.-
the experiment and the implementation of the data acquisition
system. In addition, a special thanks goes to M. Byrd,e
J. Clare, R. Davis, L. Heck, R. Higgenbotham, M. Katsaras, and
M. C. McNeil for their work on the manuscript.
This work was supported by the Air Force Office of Scien-
tific Research.
-16-

43 0
Appendix A
The Townsend breakdown criterion for a spark gap with micro-
structure is given by
d fS dz = K (A-1)
where 7 is the effective ionization coefficient of the gas
which is equal to a-n; where a is the Townsend first ionization
coefficient, n is the attachment coefficient, h is the protrusion -
height, d is the gap spacing, and K is a function of E/p which is
obtained from empirical data. The microstructure modifies the
voltage which satisfies Eq. (A-i) by altering the electric field
and thus W in the region near the protrusion. One can model the
protrusion several waysl2, 3 0 , but the semi-ellipsoidal model
shown in Fig. Al was chosen because the electric field along the
z axis was known analytically and could be expressed in terms of
the field enhancement M. The axial field for this configuration
is given by 1 2
E(z) = Eo +(M-) (A-2)
where Eo is the electric field with no protrusions.
The field enhancement factor M is related to b, the radius
of the base of the protrusion, and h. the protrusion height, by
the equation
M =n- - ) (A-3)1_c2 2c 1-c
where
c 1 b 2 /h 2 .
-17-

44 -
The coefficients i and K were obtained from the litera-
ture1 3 , 3 1 . Thus, Eq. (A-1) was solved for a variety of condi-
tions and plotted in Fig's. A2-A4. It should be remembered that
these graphs are useful only for showing trends since actual
surface structure effects are not as simple as a single ellip-
soid. Also, it was assumed that 7 takes on its equilibrium
value instantly, when in reality it would gradually approach its
equilibrium value within a few collision paths 3 2 . This effect is
depicted in Fig. A5 and the calculated results in Fig. A6 show
that if one takes this into account the effect would be to smooth
the surface out or to reduce protrusion effects. The actual -
transition was calculated using an a which reached equilibrium in
a linear manner. Any monotonic transition function, however,
would have a similar effect.
Thus, the values obtained for the breakdown voltage using0S
equilibrium values of & are lower limits for a given set of
conditions.
1
. ".
-18- g
S.-.t... . .. .... *.-.*.. . . . . . . . . . . . ..'.,..-.

45 S
APPENDIX B
Suppose that the primary electron current, ie, depends on
the random variables, 8, the temperature over the cathode
surface, and 0, the work function over the cathode surface, in
addition to the random variable M and the applied voltage, v(t).
Then Eq. (2) becomes
AtPt (At) -- f d.b f do f ie (O,Om,mv(t))P 48M (0,0, m) dm
0 o a t (v)
where P4 0 M(o,e,m) is the joint probability density function for S
0, e, and M. Since 3 3
poeM(O,9,M) - •(M)pO(*1M)p6(91M,4)j-_
where p$(,(m) and p0(e0m,O) are conditional probability densi-
ties, then
A~tPt(At) - -f i(IDv(t))PM( W)dm"
"M t(v)
where
e fis(a~v(t)) U dO dO ie(*,o,m,v(t))p4 (*Iin)po(Ojm.O) i
0 0
Clearly, the form of pt(at) does not change when the
dependence of the current on the additional random variables, 0
and 6, is included. The dependence of the current on the random
variable, M, is important, on the otherhand, because the limits
of the integral over m are not fixed, but depend on mt(v), a
-19-

46
quantity that depends on the breakdown criterion, Townsend or
streamer. The work function over the surface, 0, and the
temperature over the surface, e, do not enter into the breakdown
criterion, however, and hence are important only in an average
sense in this formulation. 0
Note that the various probability densities are assumed
constant in time. This assumption seems implausible for the
temperature, e, until we realize that it is the temperature 0
probability density at the time of breakdown that matters, and
that the time between breakdowns is nearly constant so that the
temperature probability density should be essentially the same
for each shot.
It is instructive to consider M, -, and B, as random
processes 3 4 , not in time, but in the spatial variables that P
describe the cathode surface. The sample functions of these
processes are the spatial distributions of field enhancement,
surface work function, and surface temperature after each shot,
just before the next breakdown. Particularly for other than
planar electrodes, we expect each process to be spatially
non-stationary 3 5 . In that case, the probability densities, the 0
primary current density, Je, and the field enhancement threshold,
mt, become functions of the spatial variables, a, that describe
the cathode surface. Let the primary electron current density be
Je(4,6,m,v(t);0) where we set off the spatial dependence with a
semicolon; then Eq. (2) becomes
atP (1~t) - fca f dm f do iel~l~ p;rpe(...~r
M (V; a) 0
I-20-

I I
47 S
where £ is the cathode surface. Or,
At
•IM ma(v;a)
where 0
je(Mv(t):U) d f do je( .J ,v(t);O)p,(Olm:G)pe(SI.4;a)
0 0
The corresponding value of X(v) is
X (V) - fdo fJ,(m,v;G)pM(m;d)duif f-/ .
Consider, as an example, a spark gap with hemispherical
electrodes and let a = •o correspond to the point on the surface-
at the center of the gap where the distance between the elec-
trodes is a minimum. As we move further away from the center of
the cathode, Je tends to remain constant (if it results from
photoemission) or decrease (if it results from Schottky or
Fowler-Nordheim emission) because the electric field at the
cathode surface decreases as we move away from the electrode
center. For a given relatively high value of m, pM(m;a) should
decrease sufficiently far away from electrode center as the
cathode surface becomes smoother. The threshold field enhance-
ment, mt(v;a), on the other hand, will increase rapidly as we
move away from cathode center because mt increases rapidly with . . -
the increasing distance between electrodes. Thus, the integral
- .74-21- ''""

48
over m decreases rapidly as we move away from co. That is, the
contributions to X(v) come primarily from a small area, 6A, near
the electrode center, ao. Thus,
I(v) -f / e(m,V;o0 )p(m;ao) d•
mt(v•o)
where
1e(M.V;a) a je( v(ao) 5 A" -S
This result is the same as Eq. (7) if we, in Eq. (7), use
ie pM and mt corresponding to conditions near the cathode .
center. The use of these quantities appropriate to the central
region is consistent with empirical observations that almost all
breakdowns occur in this region.
-22-
.................................

49
Appendix C
In the main body of the paper, it was assumed that the time0
for avalanche formation (formative time) is sufficiently short so
that the applied voltage changes only negligibly (<100 V) during
this time. For SF6 and air at 1 atm, the maximum formative times
are approximately 100 us36,37 and thus, for charging rates less
than 1000 kV/s, this assumption is valid.
If the formative time is not negligible, then it is consi-
dered to be a random variable, Tt, with a probability density
pTt(t). The increase in applied voltage during Tt is a randcm
variable, Vt. Because the voltage and time are monotonically
related1 8
pvt(v) = PTt(t/) dv j (C-1)
Under these circumstances, the gap breakdown voltage is not
simply V, the applied voltage when the first electron is born at
a site at the cathode surface where M > mt, but rather the sum of
V and Vt, which will be called U.
U V + Vt (C-2)
Thus, U is the sum of two random variables. Its probability
density is therefore given by 3 8
Pu(v) f pvVt(v-uu)du (C-3)
where pvVVt ) is the Joint probability density for V and Vt. 9
-23-.•.--...-.•..-.....[ -..••..•..-.. .. •.. `-..`.......•.•.....`....`.....`5`•.........•..`` ........... ... . .,. .- • .

50 0
If V and Vt are statistically independent, then this result
simplifies to 3 9 0
pU(v) = pv(v)*pvt(v) (C-4)
where the asterisk denotes convolution in v, pv(v) is given by
Eq. (6) and pvt(v) is found using Eq. (C-l). The random variables
V and Vt are simply transformations of T and Tt. Therefore 4 0 , V
and Vt will be statistically independent if the formative time,
Tt, does not depend on the time, T, required for an electron to
be born at a site on the cathode surface where M>mt.
Notice that if the formative time is negligible, then pvt(v)
becomes S(v), a Dirac delta function, so that
pU(v) = Pv(v)*a(v) = pv(v) (c-5
This case is the one assumed in the body of the paper.
-24-
....... .. ..........

r. - -:"-.- "o- - -
51
References
1) R. A. White, Proc. of 3rd IEEE International Pulsed Power
Conf., Albuquerque, N.M., 359, (June 1981).
2) L. B. Gordon, M. Kristiansen, M. 0. Hagler, H. C. Kirbie,
R. M. Ness, L. L. Hatfield, and J. N. Marx , IEEE Trans. on
Plasma Science, PS-10, 286 (1982).
3) E. I. Zolotarev, V. Mukhin, L. E. Polyanskii, and 0
V. N. Trapeznikov, Soy. Phys. Tech. Phys., 21, 340 (1978).
4) Physics International Report PISR-127-4, Physics Interna-
tional Co., 2700 Merced Street, San Leandro CA 94577 (July
1969).
5) M. T. Buttram, Sandia National Lab Report, Sand 81-1552(1981). roL
6) T. H. Martin, Air Force Pulsed Power Lecture Note #11, --
Plasma and Switching Laboratory, Department of Elec. Eng.
Texas Tech University (1983).
7) V. A. Avrutskii, Soy. Phys. Tech. Phys., 18, 389 (1973).
8) V. A. Avrutskii, G. M. Goncharenko, and E. N. Prokharov,
Soy. Phys. Tech. Phys., 18, 386 (1973). 0
9) R. M. Ness, Masters Thesis, Texas Tech University. (August
1983).
10) R. V. Hodges, R. C. McCalley, and J. F. Riley, Lockheed 0
Missiles and Space Company Report, LMSC-0811978 (1982).
11) R. V. Hodges and J. F. Riley, Lockheed Missiles and Space
Company Report, LMSC-0877208 (1983).
-25- ......................................................

52
12) A. Pedersen, IEEE Trans. on Power Apparatus and Systems,
PAS-94, 1749 (1975). .
13) S. Berger, IEEE Trans. on Power Apparatus and Systems,
PAS-95, 1073 (1976).
14) W. S. Boyle and P. Kisliuk, Phys. Rev. 97, 255 (1955). 0
15) F. V. Hodges, R. N. Varney, and J. F. Riley, "The Probabil-
ity of Electrical Breakdown: Evidence for a Transition
Between the Townsend and Streamer Breakdown Mechanisms," to
be published.
This paper calculates P*, the probability of electrical
breakdown as a function of the applied voltage, v, to
the probability of an infinite avalanche sequence plus
the probability of a finite sequence that achieves a
ro critical size. This result can be incorporated into
the present paper by letting X(v) X X(v) = P*(v)X(v)
beginning with Eq. (8) below.
16) M. W. Watts, 5th Int. Conf. on Gas Discharge, University of P -
Liverpool, 11-14 Sept. 1978, 297, (lEE London 1978).
17) R. H. Fowler and L. Nordheim, Proc. Roy. Soc. 199, 173-181
(1928). S
18) W. B. Davenport, Jr. and W. L. Root, An Introduction to the
Theory of Random Signals and Noise (McGraw-Hill, New York,
b 1958) 113-117. .
19) W. B. Davenport, Jr. and W. L. Root, An Introduction to the
Theory of Random Signals and Noise (McGraw-Hill, New York,
1958) 32-34.
-26-
•. '."-"o " ." -"' .- .- .- -" -" . .-" ". .: ."-""".". "- .- ..". ."/ , . '-".o .- ."." . . •' •. . "'-.". " .. ." .".".":" ." -" -- -

53 0
20) agler, A. L. Donaldson, and R. M. Ness, Texas Tech
ity Pulsed Power Lab Notes, TTU-EEPP-83-1 (1983).
21) •naldson, M. 0. Hagler, M. Kristiansen, G. Jackson,
Ratfield, IEEE Trans. on Plasma Science, PS-12, 28* 0
22) faffenberger and J. H. Patterson, Statistical Methods
ihess and Economics, R. D. Irwin, Inc., Homewood, IL,
685.
23) 1, N. Yamada, and Y. Fujiwara, IEEE Trans. on Power
as and Systems, PAS-93, 623 (1974).
24) er, IEEE Trans. on Power Apparatus and Systems,
1179 (1977).
25) ooke, IEEE Trans. on Power Apparatus and Systems,
1518 (1975).
26) cAllister, Elektrotechnische Zeitschrift-A, 99, 283
27) evinson and E. E. Kunhardt, IEEE Trans. on Plasma
PS-10, 266 (1982).
28) in, Sandia National Labs, private communication,
1983.
29) rizhanovskii, A. I. Kuz'michev, G. V. Levchenko,
uban, and A. I. Shendakov, Soy. Phys. Tech. Phys.,
4 (1981).
30) ewis, J. of Appl. Phys., 26 1405 (1955).
31) s, J. Phys. D., 1, 769 (1968).
4 -27-
. . . . ....

54 0
32) Y. Tzeng and E. E. Kunhardt, 36th Gaseous Electronics
Converence (Abstracts), State University of New York,
11-14 Oct. 1983, 42.
33) J. M. Wozencraft and I. M. Jacobs, Principles of Communica-
tion Engineering, Wiley, New York, (1965), 76.
34) J. M. Wozencraft and I. M. Jacobs, Principles of Communica-
tion Engineering, Wiley, New York, (1965), 129-132.
35) J. M. Wozencraft and I. M. Jacobs, Principles of Communica-
tion Engineering, Wiley, New York, (1965), 135-143.
36) L. H. Fisher, Phys. Rev. 72, 423 (1947).ra0
37) P. Narbut, E. Berg, C.N. Workes, and T. W. Dakin, AIEE
Trans., 78, 545 (1959).
38) J. M. Wozencraft and I. M. Jacobs, Principles of Communica-
tion Engineering, Wiley, New York, (1965), 68-69.
39) R. C. Pfaffenberger and J. H. Patterson, Statistical Methods
for Business and Economics, R. D. Irwin, Inc., Homewood, IL,
(1977), 72.
40) R. C. Pfaffenberger and J. H. Patterson, Statistical Methods
for Business and Economics, R. D. Irwin, Inc., Homewood, IL,
(1977), 77.
--28-
........... ~ ~ ~~~~~~~~~~~ ...................... .... . . . . . . . . .--

55
C~~~4 W4141 C' C V40 .41. u14
41 1 44 VAo~~ 4' 04* 0LI0
go 0 Q)VC41Uv 41 41 .
to0 0 Co* . C C 0L~> .)4 0 4
o 0~t7 0 41 * 0 U 454.
~4 1 0 41 v- ) 4 41V> C. 0 044
4 I.Q C 41 C .14 (D1rz 3 Z w' 4 41
0 0 04 4) x 41 J4
005.4 > 4 4j
4'" "1 41 14 V
C 1 C 41 410- 0 ) -4 m t ) '41
4' 14C 4 .g 0 -p w44 41 03 41 to a 41
S.0 41C
PI 4. 5. 0L 00 ~ 41 0 w144 4) 4 41 >
f-4 04 4 CD4 w 41 )4) Aj 4) 9: t* 5. 0) '0 '-4 r- 043 O
C$41 m) 4 04 k 0
14~~~4 .4r.-4 V ~ ~ US * 44
40 C) IV 4 4 to U0 C 4) C 5 .4 4
. 'H .40 $4 PC: V- .4CE- ON EC-4 0 H 04 . 3 E4
54 0 41 JC 0'W)4 1 4 4 ~ 4 1 5 i 4 C '
4) C .4 .54 .C . 0 . 54 .C ~ .C 4.C.4 54 A. Aj j4 01.C . 4 ) 1 . 1
mLIefte eoC 5-4,%%Do %NNW
E" > 6,el m S Rmco E-4

r~r . . rrr -r-r- .
56 0
List of Figures
Fig. 1. The Self-Breakdown Voltage Probability Density Function.
pv(v), and its Distribution Function, FV(v) for:
a) Ideal Spark Gap; b) Actual Spark Gap, c) Actual Spark
Gap with Prefires.
Fig. 2. mr(v) vs. V for Two Different Pressures in Nitrogen.
Fig. 3. Experimental Arrangement and System Diagnostics.
Fig. 4. Test Circuits.
Fig. 5. Stainless Steel Electrode After 2200 High Energy
Discharges in Nitrogen: a) Cathode Surface-Top View
(Marker is 4 mm); b) Cathode Surface-Side view (Marker
is 1 mm).
Fig. 6. Self-Breakdown Voltage Probability Density Function for
Stainless Steel in Air, With and Without UV.
Fig. 7. Self-Breakdown Voltage Probability Density Function for
Different Charging Rates.
Fig. 8. Surface of Brass Cathode used for Pressure Studies
(Marker is 4 mm).
Fig. 9. Self-Breakdown Voltage Probability Density Function for
Brass Electrodes in Air at Different Pressures.
Fig. 10. Self-Breakdown Voltage Probability Density Function for
Graphite Electrodes in Air at Different Pressures.
Fig. 11. Theoretical Plots of V'pv(v)/(l-FV(v)) for: a) ie =
ie(mo,V); b) ie = ieo; and c) ie = ie(m,v). A
Fig. 12. Experimental Plots of v'pv(v)/(l-FV(v)).
Fig. Al Elipsoidal Surface Protrusion Model.S•".3 . .

57
S Fig. A2 mt(v) vs. V as a Function of Pressure in Nitrogen.
Fig. A3 mt(v) vs. V as a Function of Pressure in SFe.
Fig. A4 mt(v) vs. V as a Function of Protrusion Height for two
Different Pressures in Nitrogen.
Fig. A5 a) Electric Field Across the Gap; b) a With and Without
Correction Factor for Nonequilibrium Values Over a
Distance S.
Fig. A6 mt(v) vs. V With and Without Equilibrium a Correction in
Nitrogen.
S
4 -- -
4m
. ,.
'--

I S
* Py(v) Fy(v) 0
S 0
S I (a)V V
I.
p
(b)
S
V V
j
A (c)V V
. . -.....

59
El C F
lii 0
C4l
cm0
C4
CL
b

60
> U
<a00
CLS~c Cc, CO
-U.
000>1>
cu m c 0C
0 a) 00
cad 0 h
~0..2
0)>00
u)0
CM 0~C'
a..

IM 0
J9
00CD--
VI
* >
C= > •, ..00 • .
c (
00w
C4 0 In
fau
fa1
fa-'
o .. .. ..

62
* 0
A**#
* 0A
ILS

- -. - -. -.
63 0
S
* 0
* S
0
(4 - S
0 1;:*
-C
S
I 0 S0
o
0.
S
- -. - -� -. -� - - - -� - -a a - -& �fl n teAs � Uk .A 5

64 9
0
0
0 0o 0CE�'I
*
*0
*
(hU)
�II Scm)C,,
'I� Ca)om>� 0
0i
0
Q p
0
...............................................*.� . . . .

65 0
0
S
-S
S
S
9
*9

7. 777
66
CLC
Ad0
CLS
* 1 L

67
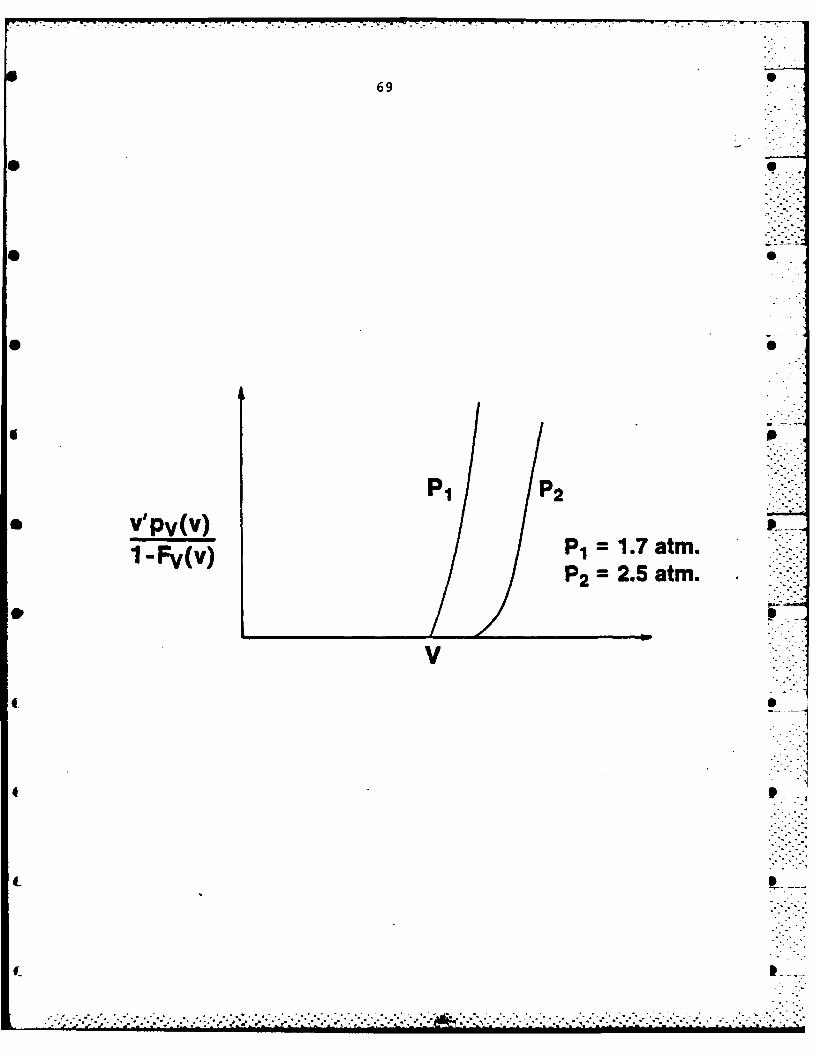
060
.. . . . . . . . .

680
e
V ~(a) -
PI P2
'eo [1Fm(mt(v))]P 2 1
PI P2
SI~n~)Upm(m)dm P2 > P
f e
mt L
....................... . .. .. .... ...
. . . . . . . . . .. . . . .... ....... ..... * . -. .
69
* V~1 pFv(v)P 1 2 .
=2.5 atm.
4

*70 0
,0 .
S I,° . ". "
". "°"S'
i -S>
S'i~ * - , ° - , ' • - - - . ' ' " " ' ° - ' ' ° -a SS-*' - -A
N'" " ' " - ' " o ' " • ' • o = ' - o - ' . . - ° • . " .' ' ' - ' ' - - * • * •

71
N2d 0.2 cm
h 0.02 cm
02
V(kV)
10 P3.0Oatm2.5 atm
* 2.0 atm1.5 atm1.0 atm
0-
* mt(v)

72
SF6 0
d0.2 cmh= 0.02 cm
30-
20-
V(kV)
10-P P2.0Oatm
P= 1.0Oatm
016 1 ~mt(v) I

73 0
.9 .
C E E".
II II S
*: Co .m0 0 ,-
. .. .. -0 I4

74
•0.2• -2
•
I t.I _ _
I ."
I _I . ,2 .S• .
I I. _:
-' . "'. I I
I I: -.'
\ I_.4
S•_ € •• • _ , • , • • . • ._ • ; • • ,-, .• .. .• - .. . ,. .... . ... ;. . -"- - -". , -. - ..- ' -. ':'2- . - . .. :::1: 0

750
* N2
d0.2 cmh 0.02cm
10-
...............
V(kV) P 1.0Oatm
with correction-without correction
mt(v)

Being submitted to JAP
76
Appendix !I
Surface Analysis of Gas FilledSpark Gap Electrodes
Authors:G.L. Jackson L.L. Hatfield and G.R. LeikerThe BDM Corporation Dept. of Physics & Engr. Physics 0Huntsville, AL 35805
A. Donaldson, M.O. Hagler, M. Kristiansen & R.M. NessDept. of Electrical Engineering
J. Marx Paul K. Predecki SDept. of Chemistry University of DenverTexas Tech University Denver, CO 80208Lubbock, TX 79409
Abstract
The surfaces of electrodes used in a gas filled spark gap
have been analyzed using Auger Electron Spectroscopy (AES) and
Scanning Electron Microscopy (SEM). The electrodes were machined
from stainless steel, a copper-tungsten composite, and brass.
They were analyzed after operation for 2000 shots in a spark gap
filled to one atmosphere with air or nitrogen gas. The spark gap
switched a 25 Us long, unipolar pulse, delivering 0.1 to 0.6
Coul/shot to a resistive load at a repetition rate of up to 5
pps. The SEM was used to determine the density and size of pro-
trusions formed on the electrodes. Energy Dispersive Spectros-
copy (EDS) and AES were used to determine surface composition and
bulk composition using cross sections. The results of this anal-
ysis are applied to produce qualitative explanations of previ-
ously reported self-breakdown voltage distributions for the spark
gap operated with these electrodes.
4 5

77 •
2
INTRODUCTION -
The surface structure and composition of electrodes used in
high energy, gas filled spark gaps changes during operation of
the gap. Chemical and physical processes enhanced by high tem- S
peratures and large electromagnetic forces produce craters, pro-
trusions, and coatings of various compounds on the surface. Pro-
trusions on the surfaces of electrodes lead to local field en- 0
hancements on the surface, which may lower the self-breakdown
voltage of the spark gap. The size, shape, and distribution of
S these protrusions will determine the distribution of local field 0
enhancements, and the chemical composition of these protrusions
will influence field emission and thermionic emission which pro-
2,3duce the initial electrons in the gap. If these initial elec-
trons are born in a region of large local field enhancement the
self-breakdown voltage of the gap may be very low. 4 ' 5
Stainless steel, copper-tungsten, and brass electrodes were
used in the course of a study of the performance of a gas filled
spark gap.6 The surface topography and composition of these
electrodes were studied with a Scanning Electron Microscope •
(SEM), an Auger Electron Spectrometer (AES), and an optical mic-
roscope. Stereo pair pictures of the protrusions were taken with
the SEM and examined with a stereo viewer in order to obtain in- 0
formation about their heights and base diameters. The AES was
used to determine the composition of these protrusions and the
composition of the substrate material on which these protrusions
are located.
L•L~~~~~~.-...LJ..%••-'-;.z'[.........?...m.. ..i` ....<.,..~.....i..2. _'£._..?i'. ..... :..'g.'L •.2-.).-2.'.'.2.'.-•2.

78 .Al
3
EXPERIMENTAL SETUP
The spark gap shown schematically in Figure 1 was used to 0
test the electrode materials in different gases. The electrode
materials tested were 304 stainless steel, brass, and a tungsten-
copper composite (K-33). Air and nitrogen were the two gases S
used in these studies. This spark gap is designed for frequent
electrode and insulator replacement and to allow for accurate
control of the electrode alignment and gap spacing. The elec- '
trodes are 2.5 cm diameter hemispherical inserts in a brass
holder. The Lucite inserts provide protection for the main gap
housing and studies of the surfaces of these insulator inserts S
give information about the debris deposited on them as well as
information about the effects of the byproducts of the discharges
on the insulators. P
A detailed description of the spark gap assembly and
8diagnostic system has been published elsewhere. The operating
parameters of the gap, pertinent to this study, are summarized in _
Table I.
.- :.- .-.-- ...

79 0
TABLE I -
Operating ConditionsGap spacing <.75 cmVoltage <30 kVCurrent <25 kATotal Capacitance 21 UF 0Charge/shot <.6 CoulEnergy/shot <9 kJPulse width 25 usRep-rate <5 ppsPressure 1 atm (absolute)Flow rate 1 gap vol. every 5 see. -
S
. .. . . .
. . .

80 e
5
RESULTS
Virgin electrodes (machined, polished, and cleaned in ethyl alco-
hol) of 304 stainless steel, K-33, and brass were analyzed using AES
in order to make a comparison between unused electrodes and electrodes
used in this gap. Initial analysis of all these electrodes showed
that they were covered with a thin layer of carbon and oxygen. Figure .
2 is an SEM micrograph of a virgin, stainless steel electrode at a
magnification of 200. The surface was composed of carbon (67%),
oxygen (22%), and iron (11%). Figure 3 is an SEM micrograph of a vir-
gin K-33 electrode at a magnification of 200. This sample exhibited a
surface composed of carbon (30%), oxygen (7%), copper (13%), and tung-
sten (505). A virgin brass sample was composed of carbon (22.9%),
oxygen (34.9%), copper (36.4%) and tin (2.1%). These samples were
then etched with a 5 kV Argon ion beam in order to remove the top sur-
face layer. After sputtering for 120 seconds the surface of the
stainless steel electrode changed to carbon (2%), oxygen (2%), iron
(67%), chromium (21%), and nickel (7%). The known bulk concentration
of this alloy is iron (70.2%), chromuim (22%), and nickel (9.3%).
After sputtering the K-33 electrode for 30 seconds the surface compo-
sition was copper (28%) and tungsten (72%), compared with the known
bulk concentration of cop-er (33%) and tungsten (66%). After sput-
tering the brass electrode for 30 seconds the surface composition was
copper (83%), tin (7%) and trace amounts of carbon, oxygen and zinc,
whereas the specified bulk composition of this alloy is copper (86$), 0
tin (6%), and zinc (6%).
t..:-:-: i

-. I . "C W P..
81 0
6
The surface layer of carbon and oxygen which was removed by the
Argon ion beam etching is typical and is assumed to be the result of
exposure of the electrode, after it has been machined, polished and
cleaned, to the ambient laboratory atmosphere. Hydrocarbons, which .
produce such a layer, are always present in the air.
Figure 4 is an optical micrograph (10x) of a stainless steel
cathode used for 2000 shots in this spark gap, with 1 atmosphere abso-
lute pressure of flowing air. There are three distinct, circular re-
gions on this electrode. The middle region (region 1) is about
10 mm in diameter, the first ring (region 2) is about 6 mm in width P
and the outer ring (region 3) is about 3 -m in width. SEM micrographs
of region I indicate that there is approximately I large particle per
* 2mm imbedded in the surface. The sizes of these particles range from .
30 Pm to 40 4m in height and 70 um to 80 jm in base diameter. Figure
5 is an SEM micrograph, at a magnification of 240, which shows a typi-
cal particle imbedded in the surface. This micrograph also shows that
the surface is considerably different from the virgin surface, having
a matrix structure on the surface, which resembles a dried-up river
bed. AES. analysis of this region after 60 seconds of etching shows
the surface to be composed of oxygen (57%), iron (32%), chromium (6%)
and nickel (0). The relative percentages of iron, chromium and
nickel to oxygen indicate that these metals may all be present on the
surface as oxides. If they are all oxidized the surface is composed
of 62% Fe2 0y3 23% CrO, and 15% NiO, however, this is only a specula-
tion based on the measured relative elemental composition.
* j '%
* *~ *.." .o o

82 6
7
Figure 6 is.an SEM micrograph at a magnification of 300 of a
cross section of this same electrode after it was electrolyticly
etched with a solution of oxalic acid and distilled water until the
grain structure was exposed. The view shown here is a cross section
perpendicular to the electrode surface. The electrode surface is at
the top of the micrograph and the three dark regions extending down ' -"
into the material are the cracks forming the "river bed" effect S
in Figure 5. This micrograph shows that the grains are approximately
20 Pm in size and that there are a large number of inclusions in the -
stainless steel. Using x-ray fluorescence it was determined that the
inclusions are magnesium sulfide stringers. The cracks occur by con-
necting pits formed in places where stringers are located. These
cracks are formed as the result of biaxial tensile stresses in the
material during the arcing process. The temperature of the surface
cycles vary rapidly between shots, leading to thermal expansion and
contraction of the surface. Calculations of the temperature differen-
tial between the heating and cooling cycles necessary to cause this
type of structural change indicate that only about a 200°C change in
temperature is required.
Figure 7 shows the upper edge of this same cross-section at a
magnification of 2500. Four distinct layers can be seen in this
micrograph. Analysis of these layers with an energy dispersive x-ray
attachment 4nowed that the top layer (layer 1) contains a substantial
amount of carbon and oxygen and is greatly enriched in chromium com-
pared to virgin stainless steel. The presence of oxygen In this layer
confirms the results obtained with AES. The amount of carbon in this
I__
-,~~~~~~~~~~. . . ...... +,.o. °..-.. ....... +...-.-..+..•......-.p...........+...............,.. •-......-...-...-..- ..-...-. ,. ..

i.*
83 6
838
0.
layer. is too large to be the result of contamination by exposure to
air after removal from the spark gap. However, the insulator used in
this spark gap is Lucite and during operation of the spark gap it is
exposed to the byproducts of the discharge, which leads to deteriora-
tion of the insulator and the subsequent release of large amounts of
carbon and oxygen into the spark gap. Therefore, the carbon seen in*O
layer 1 probably results from the deterioration of the insulator. The
second layer (layer 2) is composed of only the three metals: iron,
chromium and nickel. However, there is an enrichment of nickel and a
depletion of chromium in this layer compared to a virgin stainless
steel sample. The relative vapor pressures of these three metals from
9highest to lowest is chromium, iron and nickel, respectively. Conse-
quently, the depletion of chromium in this layer and the enrichment of
nickel can be the result of the higher evaporation rate of chromium
compared to nickel. Once the chromium has evaporated from layer 2 it
could be retained in layer I and oxidized during the arcing process.
The third and fourth layers have essentially the same composition as
the virgin material.
Figure 8 is an optical micrograph of a stainless steel cathode at
a magnification of 10, used for 2000 shots in the spark gap, with 1
atmosphere absolute pressure of flowing nitrogen gas. There are three
distinct circular regions on the surface of the electrode, which are
similar in appearance and shape to the areas seen on the stainless
steel electrode used in air.
Figure 9 is an SEM micrograph of the central region of this elec-
trode at a magnification of 400. Analysis of the two areas in this
a- .,• -°°* •

84 0
9
* micrograph (marked 7 and 8) were performed using AES. The area marked
7 is composed of oxygen (30%), nitrogen (17%), chromium (26%), nickel
(5%) and iron (22%). The presence of large amounts of oxygen and ni-
trogen on the surface after sputtering indicates that these elements
are probably chemically bonded to the surface; however, with AES it is
usually not possible to determine the chemical bonds. The oxygen pro-S
bably comes from the disassociation of water in the system. The Lu-
cite insulator will absorb 4% by volume of water in a humid environ-
ment. The spark gap is not baked out before the experiments are per-
formed and during the experiment the temperature of the insulator in- - -
creases so that water absorbed by the insulator could be released and
available to react chemically with the electrodes.
The area marked 8 in this micrograph is a protrusion on the sur-
face with a height of about 62 um and a base diameter of about 100 um.
The composition of this protrusion, after etching, is carbon (7%),
oxygen (21%), nitrogen (12%), chromium (20%), nickel (6%) and iron
(35%). It is difficult to determine how this protrusion formed; one
possibility is that the material surrounding the protrusion was eroded
away by the discharge, leaving the protrusion on the surface.
Figure 10 is an SEM micrograph of region 2 at a magnifioation of
1000. This region appears to be very smooth in comparison to region 1;
however, there are a large number of cracks in the surface and many
small holes. Analysis of this region, using AES, shows the surface to
be composed of carbon (34%), oxygen (43%), nitrogen (2%), and iron
(21%). After sputtering for 30 seconds the composition changed to
carbon (6%), oxygen (46%), nitrogen (9%), iron (31%), chromium (4%),
.' ..'''..'''..''" -J '...''...% .•""... "''..-'•""...'•. """. • "'.."" -" .,' ,'" ,.'• o ," "-. '" . %'%"• ."," , .. .. " -. ' h.af-'t-.

85 0
10
and nickel (5%). The relative percentages of oxygen to iron (3 to 2) 0
indicates that the oxygen is chemically bonded with the iron to form
the compound Fe 2 03; however, since AES does not give chemical bonding
information this is only a speculation. 0
Region 3 of this electrode was impossible to analyze with AES
because of surface charging. Surface charging occurs in AES when the
surface being analyzed is highly insulating. Probably the surface is 0
coated with an insulating layer of hydrocarbon material. This ma-
terial could be the result of contamination by exposure of the elec-
trode to the laboratory atmosphere after the experiment although such
material is usually removed by the Argon ion beam or it could be the
result of deterioration of the Lucite insulator insert in the spark
gap. Micropartioles from the electrodes cause a considerable amount
of damage to this insulator resulting in the ejection of insulator
material in either solid or vapor form, which can then be deposited
7onto the electrodes. Region 3 does not actively participate in the
discharge, consequently this insulator material can build up in this
region. In regions 1 and 2 this material would be vaporized by the
discharge and not remain on the surface.
Figure 11 is an SEM micrograph at a magnification of 300 of a
cross-section of this electrode. This electrode exhibits the same
type of structural damage as the stainless steel electrode used In
air; however, the damage is much less severe. Obviously, the combined
effects of thermal stresses and oxidation promote propagation of the
cracks in the stainless steel electrode when used in air. Using en-
ergy dispersive analysis it was not possible to find evidence of metal
4-ji.i

86
11
nitrides or oxides on the surface of the electrode used in pure nitro- .
gen, however, AES analysis definitely indicated large amounts of both " "• "
elements present on the surface. The analysis depth of AES is approx- -.
imately 50 2 and the analysis depth of EDS is approximately 0
5 iim. Therefore, the analysis of this electrode, using AES, is more
indicative of the surface layer on the electrode than the analysis
using EDS.
Examination with an optical microscope at a magnification of 10
of a K-33, tungsten-copper, electrode used for 2000 shots with I at-
mosphere absolute pressure of flowing nitrogen showed that the surface
of this electrode is very smooth and similar in appearance to the pol-
ished virgin electrode. There- is only a very small region on this
electrode where damage can be seen. Figure 12 is an SEM micrograph of ...
the damaged region at a magnification of 200. The surface is pitted
and cracked in some areas, however, stereoscopic analysis of this
electrode with the SEM indicates that there are no protrusions on the .
surface greater than 10 um in height. Analysis of the electrode with
AES shows that this region is mainly composed of carbon (23S), oxygen
(15%), nitrogen (5%), copper (34%), and tungsten (23%). After sput-
tering the surface for 30 seconds, the composition changes to tungsten
(62%) and- copper (38%), which is very nearly the known bulk concentra-
tion of the virgin K-33. The copper on the top of the electrode be-
fore sputtering is probably copper that has redeposited onto the elec-
trode from the vapor state, leaving a very thin layer of copper on the
surface. The melting point of coppe., is 1339 K and the boiling point
is 2823 K, whereas tungsten melts at 3660 K and boils at 6186 K. Thus,
t__
..- ° -... _:..... . . . . . . . . .. .-.-.-.. - ....- o -... .. -.. ..-......-... -. ...... .-..-. ... .-.-. .... o...-.;.-. -,-,.

87 S
12
copper boils at a temperature which is 1000 K less than the melting
point of tungsten. It is likely that the cathode spot temperature
exceeds the boiling point of copper but not that of tungsten and -
therefore the copper may be selectively boiled out of the electrode
and then recondense on the electrode between arcs. Analysis of areas
of this electrode outside of this damaged area shows a surface com-
posed of carbon (13%), oxygen (11%), copper (42%), tungsten (29%), and
nitrogen (6%). After sputtering for 30 seconds the composition
changes to that of the virgin K-33 electrode. The large amount of
copper compared to tungsten in this area therefore supports the hy-
pothesis presented above.
Figure 13 is an optical micrograph at a magnification of 10 of a
K-33 electrode used for 2000 shots, with 1 atmosphere absolute pres-
sure of flowing air. There are 3 distinct circular regions visible on
this electrode. The inner region (region 1) is approximately 12 mm in
diameter and very smooth in appearance. The first ring (region 2) is
about 3 mm in width and very pitted and rough. The second ring (re-
gion 3) is approximately 5 mm in width and appears to be very smooth. S
Figure 14 is an SEM micrograph of region 1 of this electrode at a
magnification of 200. On this scale the surface is rough and pitted
with some cracks that are as wide as 5 um (this surface is similar in
appearance to the damaged area of the K-33 electrode in nitrogen gas).
Analysis of region 1, with AES, shows the surface to be composed of
carbon (40%), oxygen (19%), copper (36%), with :race amounts of nitro-
gen and chlorine. The chlorine is probably an Lmpurity in the gas
used. After this region was sputtered for 60 seconds the composition

88 .
13
changed to oxygen (31%), copper (23%),-and tungsten (46%). Probably
the tungsten and copper are present on the surface as oxides as well.
as pure metal particles. Again the presence of copper in a large
ratio to tungsten on the surface supports the hypothesis that the
copper has been selectively boiled out of the matrix due to the dis-
charge process and then redeposited on the electrode between arcs.
Figure 15 is an SEN micrograph at a magnification of 240 of re-
gion 2 of this electrode. This region is completely different in ap-
pearance to region 1. There is a large concentration of irregularly
shaped "globs" resting on a relatively smooth surface. Figure 16 is
an SEM micrograph at a magnification of 1000 of this same region.
Analysis at the point marked 1 in thi* micrograph with AES shows
carbon (49%), oxygen (16%) and copper (35%), and analysis of the
square area marked 2 shows a similar composition. Sputtering this
surface for 30 seconds shows that point 1 is composed of oxygen (44%)
and tungsten (56%), whereas area 2 is composed of carbon (5%), oxygen
(35%), copper (24%) and tungsten (36%). Apparently, this entire
middle ring is covered with a very thin layer of copper and copperI
oxide, which may have condensed onto the surface from the vapor state.
"The "globs" appear to be tungsten and a tungsten oxide. These "globs"
could be molten tungsten that has spilled over from the middle region
of the electrode or has been physically ejected from the middle region
and then resolidified onto region 2. This would imply that the
I°%=
4 l

89
14
temperature of the cathode spot on a K-33 cathode is higher in an air
environment, than in a nitrogen environment, since these "globs" were
not seen on the K-33 electrode used in nitrogen.
Figure 17 is an SEM micrograph at a magnification of 1000 of re-
gion 3 of this electrode. The "globs" in this region are much larger
than those in region 2 but they are similar in shape to the "globs" in
region 2. Auger analysis of the area enclosed by the square shows the
surface to be composed of copper (26%), oxygen (30%) and carbon (44%).
Sputtering this surface for 30 seconds shows this "glob" to be com-
posed of copper (24%), oxygen (24%) and tungsten (52%). Analysis of
the material, on which these "globs" rest, was impossible to perform
with AES because of surface charging.
A brass electrode used in this gap, with 1 atmosphere absolute
pressure of flowing nitrogen gas, was removed after 2000 shots and
visually inspected with the naked eye. The surface of this electrode
was very rough and SEM micrographs of this surface show that the en-
tire electrode surface is covered with very large irregularly shaped
protrusions. The base diameters of these protrusions range in size
from 100-500 Um, with heights of up to 200 u m. Analysis of this sur-
face with AES is very difficult to perform because of this topography;
however, analysis of the tips of some of the protrusions shows that
they are composed of carbon (23%), oxygen (35%), tin (2.1%), and
copper (36%). Sputtering for 5 minutes produces very little change in
the composition readout which implies that this is a thick layer, per-
haps 50 • or more deep. No further analysis of the brass was
attempted.
. . . . . . . .. . . . . . . . . . . . . ..

90 S
15
Conclusions
The results on all the virgin electrodes show that hydrocarbons
accumulate on the surfaces due to exposure to the atmosphere. How-
ever, these are merely adsorbed on the surface and are removed almost
immediately by sputtering in the AES machine. This implies they are
Salso removed during the first few arcs in a spark gap. These hydro-
carbon layers are, therefore, of no consequence in spark gap opera-
tion. The virgin electrode studies also show that, after sputtering,
the surface composition is the specified bulk composition of the ma-
terial except for the brass in which the specified amount of zinc was
not seen.
The studies on stainless steel used in air and pure nitrogen gas
show that the oxygen promotes corrosion which occurs most efficiently
along the magnesium sulfide stringers. The use of nitrogen gas re-
tards the corrosion and surface cracking and, therefore, probably also
retards the rate of erosion of the electrode. The implication is that
higher purity of the stainless steel would also lead to less surface
damage during spark gap operation.
The :-33 electrode used in air also exhibited more visible sur-
face damage than the one used in nitrogen. In addition, the globs of0 pmaterial thrown out from the center region of the electrode used in
air appear to be pure tungsten covered by a thin layer of copper
oxide. The copper oxide coating is no surprise because the copper
layer deposited from vapor is seen on all K-33 electrodes after
arcing. The question is, why are pure tungsten particles ejected from
"S.
91 0
16
the are region when air is used and not when nitrogen is used? Per-
haps, when air is used, the temperature at the arc attachment point on
the cathode is higher, boiling out a larger fraction of the copper,* 0
leaving the sintered tungsten structure behind. This structure would
have a lower thermal conductivity and thermal capacity than the orig-
inal composite and therefore be more vulnerable to melting or frac-
turing during the next arc.
The brass electrode studies show that this particular brass is
unsuitable in this operating regime. The large protrusions formed
cause large fluctuations in the self-breakdown voltage of the gap.
in fact, the self-breakdown voltage dropped to such a low value after
a few shots that data collection was discontinued on the basis that
such low energy shots would not be comparable to the tests on other
materials. AES data on the tips of the large protrusions indicated
very thick layers of carbon and oxygen which were not removed by argon
ion sputtering. Such thick layers were not observed on the stainless
steel or K-33 electrodes.
Figures 18 and 19 show the self-breakdown voltage distributions
for the stainless steel and K-33 electrodes from which the samples
reported on here were taken. (These figures are reproduced from ref-
erence 10.) Figure 18 b shows a much broader distribution occurs for
the stainless steel-air combination which, as we have shown, results
in more electrode surface damage than the stainless steel N2 combina-
tion. The self-breakdown voltage distribution has been modelled in
terms of the electric field enhancement due to protrusions on the
cathode surface and the electron emissivity of the cathode surface.1

92
17
At one atmosphere gas pressure with a one centimeter gap (the condi-
tions of these experiments) the model predicts no effects due to pro-
trusions less than 500 microns in height. No protrusions greater than - -J
70 microns have been observed on the stainless steel electrodes. How-
ever, the electrode used in N exhibits nitrogen on the surface which2
is not removed by argon ion etching and may, therefore, be chemically
bonded to the iron. If this nitrogen compound has a higher electron
emissivity than the oxides found on the surface of the electrode used
in air, then the model would predict a narrower self-breakdown voltage
distribution for the electrode used in N 2
Figure 19 shows no significant difference in the width of the
self-breakdown voltage distribution for K-33 used in air and N2. Our
surface analysis showed no nitrides on the K-33 surfaces, and both
exhibited oxides. In other words, the surface analysis gives no
reason to expect a difference in the self-breakdown voltage distribu-
tions, in agreement with the data in Figure 19. -
. . . . . . .. . . . . . . .- .. • . -
. . . . . . . . .. . . . . . .- .. . .
o -.0
* .

930
18
Acknowledgments
We thank the Center for Research in Surface Science and Submicron
Analysis (CRISS) at Montana State University for the use of their
facilities and for their technical assistance. This work was
supported by the Air Force Office of Scientific Research.

7. e - ,. I . .. . ..
94 0
19
References
1. V.A. Avrutskii, Soy. Phys. Tech. Phys., 18, 389 (1973).
2. R.V. Hodges, R.C. McCalley, and J.F. Riley, Lockheed Missiles and - --
Space Company Report, LMSC-0811978 (1982). 0
3. .R.V. Hodges and J.F. Riley, Lockheed Missiles and Space CompanyReport, LMSC-0877208 (1983).
4. A. Pedersen, IEEE Trans. on Power Apparatus and Systems, PAS-94,1749 (1975). S
5. S. Berger, IEEE Trans. on Power Apparatus and Systems, PAS-95,1073 (1976).
6. A.L. Donaldson, M.O. Hagler, M. Kristiansen, G. Jackson, and L.Hatfield, IEEE Trans. Plasma Sci. PS-12, 28 (1984). O
7. G. Jackson, L. Hatfield, G. Leiker, M. Kristiansen, M. Hagler, A.Donaldson, R. Curry, R. Ness, and J. Marx, Paper No. 31.3, Proc.4th IEEE Pulsed Power Conf. Albuquerque, NM, June, 1983.
8. A.L. Donaldson, Masters Thesis, Texas Tech University (August,1982).
9. Handbook of Chemistry and Physics 53rd Ed. B.C. Weast, Ed., TheChemical Rubber Co., Cleveland, Ohio, (1972) pp. D180.
10. G. Jackson, L. Hatfield, M. Kristiansen, M. Hagler, A.L. 5Donaldson, R. Ness, and J. Marx, paper No. 25.3, Proc. 4th IEEE - "Pulsed Power Conf. Albuquerque, NM (June, 1983).
0 p
-.-.

95 S
20
Figure Captions
1. Cross sectional view of the spark gap in which the electrodeswere subjected to high voltage sparks. Nitrogen gas or dry airwere introduced through the air inlet.
0
2. Virgin, stainless steel electrode surface X200 (SEM). Thegrooves left by the polishing compound are about 5 um wide.
3. Virgin, K-33 electrode surface X200 (SEM). In addition to thepolishing marks, the surface is typical of a composite, in thiscase, copper-tungsten. S
4. Axial view of the top of a stainless steel electrode used in airX10 (optical). The three regions discussed in the text areclearly visible.
5. Typical particle embedded in region I of the surface of thestainless steel electrode shown in Figure 4, X240 (SEM). Thisparticle is about 70 TO in diameter at the base.
6. Cross sectional view taken from the central region of thestainless steel electrode of Figure 5, X300 (SEM). The electrodewas sectioned perpendicular to the top surface, polished, andetched to expose the grain structure. The cracks extendingdownward into the surface are discussed in the text.
7. Magnified view of the cross section of Figure 6, X2500 (SEM).The viewing angle is such that the electrode top surface can beseen in the upper left quarter of the micrograph, while the bulkmaterial is seen in the lower right quarter.
8. Axial view of the top of a stainless steel electrode used innitrogen, X10 (optical). As in Figure 4, three distinct regionsare visible.
9. A typical protrusion in the central region of the electrode shownin Figure 8, X400 (SEM). The regions marked 7 and 8 wereanalyzed using AES.
10. 4agnified view of region 2 of the electrode shown in Figure 8,XI000 (SEM). There are a large number of small holes in thesurface, but compared with Figure 9, this is a very smoothsurface.
11. Cross section from the central region of the electrode shown infFigure 8, X300 (SEM). This cross section was prepared by thesame procedure used to produce Figure 6. However, this electrodewas operated in nitrogen gas instead of air. Note the lack ofdeep cracks in the surface.
o . • o ,°~~~~~. ...*. .. ...... . .o.... ..... °....... . . . ... . o- .. .

96
21
12. Small damaged region in the center of the K-33 electrode used in 0nitrogen, X200 (SEM). There are no protrusions greater than10 um in height.
13. Axial view of the top of a K-33 electrode used in air, X10(optical). In contrast to the K-33 electrode used in nitrogen,three distinct regions are visible.
14. Central region of the electrode shown in Figure 13, X200 (SEM).This surface is similar to that shown in Figure 12 even thoughthe two electrodes were used in different gases.
15. Region 12 of the electrode shown in Figure 13, X240 (SEM).Comparison with Figure 14 shows that the central region andregion 2 have quite different surface structures.
16. Magnified view of the surface shown in Figure 15, X1000 (SEM).AES was used to analyze the surface composition at the pointmarked 1 and the square area marked 2.
17. View of the surface in region 3 of the electrode shown in Figure13, X1000 (SEM). The area marked with a square was analyzedusing AES but the substrate on which this "glob" rests could notbe analyzed due to surface charging.
18. a. Self-breakdown voltage distribution for a stainless steelelectrode used in nitrogen gas. The mean breakdown voltage is13 kV with a standard deviation of 0.5 kV.
b. Self-breakdown voltage distribution for a stainless steelelectrode used in air. The mean breakdown voltage is 18 kV witha standard deviation of 2 kV.
19. a. Self-breakdown voltage distribution for a K-33 electrode usedin nitrogen gas. The mean breakdown voltage is 14 kV with astandard deviation of 2 kV.
b. Self-breakdown voltage distribution for a K-33 electrode usedin air. The mean breakdown voltage is 16 kV with a standarddeviation of 2 kV.
I .
.... -°.............. o,-:o - .- .. q................................. . ..- o . .•

970
E-<--4V CONNECTIONFROM P714
AIR INLET-
ELECTRODE
HOLDER INET
ELECTRODE
PORTS
u-HV- CONNECTION
* OLA
AI S~LT -- 1a

98
S
S
S
0
*S
.*- -..
Ji- -
'I- �
,
�E / *�2�1I�� 01' *�
/ IL�1,-
*�-i'.
4' 4I�I'. I
�¶i ,vh�u (*vAVe 1' *�
-. *., 9 *
''. , * I * -B � I�I 9 ,' *". �I
� -.*;�**lK* - - �7f p
0
b
0
F�.z S
� - - *

b 99 0
S 0
a 0
B 0
S S
S
0 0
0 0
0 S
F43S S
q
� C. C . � . ______....................................................

100
0 S
S S•
S--- : ., - .

1010
*I
I It

102
, rv0
400
4'4

61030
CS
or0
roS
Alp

* - - - - .. *-.--*. - .* -' -. -fl
- -4
104 S
* j*
SS
0S
S
S0
0
aS
t IaV.,.. S44c
a
I

105 S
S 0
0
0
S
S
6
0 S
0 S
* S
S S
*
............. ............................... .- ...... t.........*.*

S ~106
00
ZrS
FA i

107 6
S
S
S
. . = �
'. *qA-r - t . 0*� �
I - I �' �-; �
� \. *� b 1 S.B " .i-I.
-, - \.. I,t I'. LI
-. .. �. ..
S **1.I - -.. , -
* * * �0C
-. * . I 1 .* *. . . I
L - * * Itk .' *I' . . I
SF�. ii
* S
* 9

* p
.".. ,.-

1090
.7 j

b ~110
S TO
k N~kS
-- jib S
7cS
4W0
'Ni
OKV", 1314S
41L

* 111
0
0
S
S
* S
S
* S
* S
S S
* I

p ~1120
LI 0 -%

113 -6
.6
IB
F~. 1-
. . -

114 0
0.37
0
b0
0 30VOLTAGE (kV)
0.11
C "
00 9
0 30VOLTAGE (kV)
. .
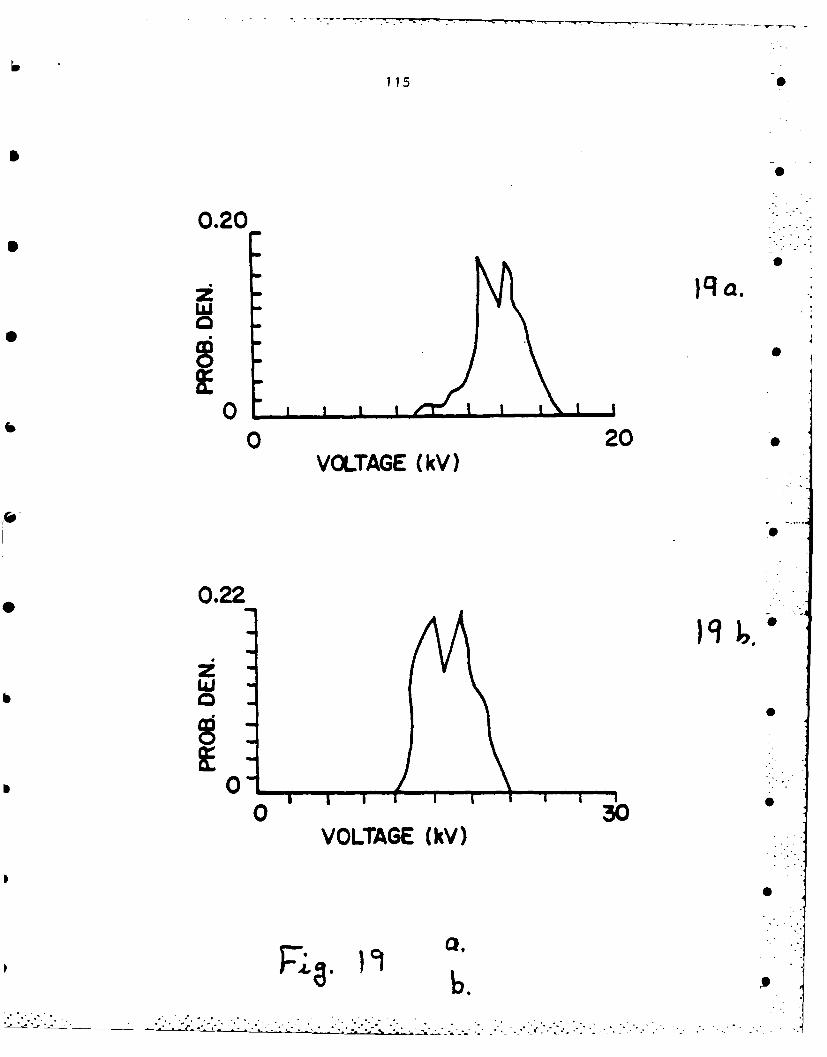
115 S
0.20
zi )q0Iw0IL
0 20
VOLTAGE (kV)
irle
0.2
0 0 30VOLTAGE (kV)
R8.2 F7L. ).
/.". .•i-. . • - -.-•:. 2 ?1,: L L _L .- ii221-21•.-i:.._ . ... _. :. . . ..- G - I. -" .: •-.'i -. .- .. -. ' ,. - -

1984 IEEE 16th PowerAppend~IVcIII Modulator Sym.
KECUVLtKY KLASUREMENTS IN A SPARK GAPC.H. Yeh, H. Krompnolz, H, Hagler, and M. Kriscianson
Texas Tech University
--Lubbock, Toexas .79409 USA
Abstract TO LOAD
The voltage recovery for a high energy #park gap GA A&CWS *O.IUSrt~E ..
(up to .00 J/ahot) has been measured in*F, , and T!n a 20% SF61801 N-) gas mixture by applying two LCTidentical pulses with a variable delay time betweenthe pulses. Parameter, determining the voltage re- VACUUM AL CYLINKMcovery are charging rate, energy deposited in theUspark gap, statistical delay time, and attachment "t .- LCRO OLDERcoafficlent of the gas. The most important Influence Ion the recovery behavior is the temperature /dens ityvariations of the gas during recovery, which have been UVa- xmmeasured using A k~iach-Zehnder interferometer.
Thermal expansion velocities of the gas heated byHthe initi~i SPark and by subsequent heat transfer from GA IjTa-_ASOTCthe electrodes are in the range of 102 to 10 cm/s. 65ILTrO~iThe initial gas density 1 ms after breakdown is re-duced b,- 53.. Restrike position and breakdown voltage LUCITEo.- the ;econd pulse are determined by these gas den-sity variations and Paschen's law.
CAPACITOR
IntroductionPI
* The recovery behavior of spark gaps characterizesthe prcptrzies whici cire relevant for rep-rLtee opera-t ýon . The most important quantity characterizing the
* recov.er: behavior is the magnitude of the voltagewhich can be applied to the device after breakdown, PULuSE 9MAT7
witho!ýt lea~ding to a restrike, as a function of time.The usual method to determine this voltage magnitudeis to apply a probing voltage pulse after the break-down with a variable delay time. With respect to am-repetitive operation, it is essential that the pulseproducing the initial breakdown, and the probing pulseare identical in shape and amplitude. The aim of thepresent experiment was to find the recovery behavior aa. Atfor repe:!:ion rates in the kliz range, curresponding ?58 aNti delay timnes in the millisecond regime. It Is ex- Ic A3 rsappicted that rocovery In this time domain is mainly 0: -.~ctermined by thermal eq~tilibrization proccesses, e.g. ro 3af acooling of the gas by heat transfer to the electrodesand the surroundints. In order to obtain quantitativeinforcition on these processes, the breakdown voltagerdistribution and the gas density have been measured as MAfWS
~. .,ntc~ f the time after the first bru k down. camUHAh
Experimental Set-Up
The test gap assembl [IFIII with interchangeable Fig. 1 Experimental set-up.elcctr.ides ana the pressure chamber is shown in a) spark gap assemblyFt,-. !a. ine charging system consists of two over- b) double pulsed circuitcricicilly damped C-L-C ctrcuit4 providing Identical
SPJIdses with a duration of 2 us and variable~ira delay between pulse 's (Fig. tb). A low pressure mob Irnercury lsdmp i-s used for UV preionizat ion in ord-er tj see Sofo 'roo C~vberr-ýuce stttikttcal tins. lags. Breakdown voltage andAl mf. i IMtcurrent have b-:un mecasured with standard methods.. The L_
e ~en..l:: aý a, function of position -and time, hasbndet-ýridned usinog a ?Mccn-Zehnder interferov-eter
i ) The light iource was a 2 mWHe'; Laser.Ter~poral resolution Its provided h! using a rotatingS_ru:t rcriilg camera (flynafax 326) with an exposure Ltln4 .,f n i~s and a time between frame% of U.5 =-j. I n.,.hitton, tho breakdowii positions have been tegis-
BES . .Fig. 2 Mtach-Zahnder Interferometer Set-Lip
AVAILBLE COPY ... . . . . .
CH20&0/4,(PW004S0I(10't, 984IEE
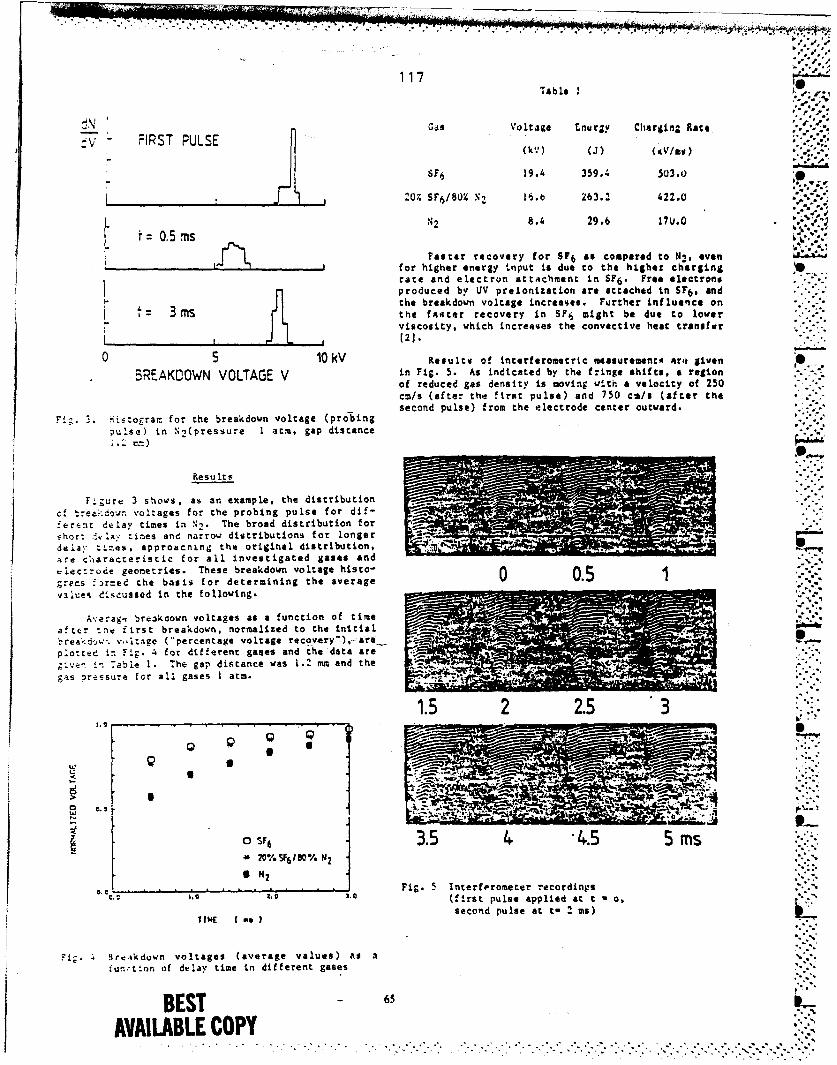
117Table 1 ~ .
ci otae Eu'ycuin' Rated
FIRST PULSE o.aG .njg ir~l *.-ik (V) WJ) Wi/011)-
SF.6 19.4 359.4 503.0
12104 SF6/80% N,7 16~.b 263.2 422.0
N2 8.4 29.6 17U.0 -0.5 O.ns
Faster recovery for SF6 as compared to N2, evenI for higher energy input is due to the higher charging
rate and electron attAchment in SF6* Free electronsproduced by UIV preionizetion are attached in SF6 andthe breakdown voltage increases. Further influence on
I3 t 3ms the fstster recovery in SFs6 might be due to lowerl i l y ,viscosity, which increases the convective heat transfor
0 5 10OkV Results of interferometric measurementos are givenin Fig. 5. As indicated by the fringe shifts. a regionERE.AOOWNVOLTGE Vof reduced gas density is moving with a velocity of 250
cz/s (after the first pulse) and 750 cm/s (after thesecond pulse) from the electrode center outward.
Fig. ... oga for the breakdown voltage (probingpul.se) in Ni~pressure 1 atm, gap distance
nm)
ResulIts
T4;ure 3 shows, as an example, the distributionof tea:,o-jr, voltages for the probing pulse for dif-ferenit dt~lay times in N-). The broad distribution forThor: tf-.a imes and narrow distributions for longer
tei:n ies , approaching the original distri tonare cliaracteristic for all investigated gases ande~ec-rode geometries. These breakdown voltage histo-
grams f. rmed the basis for determining the average 51viiiues discoussed in the following.
Avearag.. bre.akoown voltages as a function of timeaf tcr thv f irst breakdown, normalized to the initial .-
braý-6- voltage ("percentage voltage recovery!'),- re,plotted in. Fig. 4 for different gases and the-data are
;"e...able 1. The gap distance was 1.2 mm and the.gas pressure for all gases Iatm..
1.5 2 2.5 3
0 SF 6 3.4 455M2Q%SF6 150% N2
CA ___________________________Fig. 5 Interferometiar recordinpsC..20 . (first pulse applied at It a o
TIME I me second pulse at t- 2 ma)
i.4 !Br.:,kdown voltages (average values) .1s a'u-t~on of dellv time in different gases
BEST - 65
AVAILBLE COPY

7 I7
1 p~mtee in the$& model zurves is the unktwnI~ nficial
electrode temperature, gi~ving a closest fit to theexpertsental data (or
Telectrodea 9 00:
6..J0.0
000 0.511.-
RADIUS I cm I0~.... 0,. . o. ,C.
'iZ. Gas Density vs Radius for t 1 ms a.
TIME I m-
"%.-:1 vapor, which is assumed to move with simi- O..ar ve'.:t:ies [3j, has a density too low to produce:ni* 4::i-ge shift. The gas density inferred from the Fig. 7 Model curve* and Experimental values (dots)
i.:er.'erogram by Abel inversion Is shown in Fig. b. for N2 . The parameter for these curves (fromThe -i;n densit/ region in the center is probably top to bottom) is the initial electrode
cause_ý :.v rapid cooling in the vicinity of the elec- temperature of 500, 900, 1300 and 3000 K.t • -,.r this case (hemtspherical electrodes) thepoct:!- , of the Aecond breakdown is at the electrodecenrer, as 'reeicted by Paschen's law, I.e. not influ- Conclusionsenc,.c :he reduced gas density outside the center.i. a pl.-e electrode geometry, however, the positionof :.e second breakdown is influenced by. _hOit.ime Recoveryotimesefor theeusualoexperimental situa-
tion of atmospheric pressure and voltages of several 10vearLo grst d rensity, iteathe averages u sth e froms kV are in the order of milliseconds and determinedieo. :o.a:. stbrve agroement winth Patshen's ia applied mainly by heat conduction. Scaling laws for the design
' ~th-:.urved ~grsedens with Paseheton's laappied of rep-rated spark gap switches can be formulated on
this basis, requiring 'fast heat transfer from the gap LO
region to the outside as the essential design criterionIH.eat Conduction Model for rep-rated gaps operated in the kHz regime.
For a *Jar-:.tative description of the voltage recovery References
for :he central region of hemispherical electrodes, aone dý'zeniional model [41 based on heat conduction and 1. C.H. Yeh, et.al., "Voltage Recovery Measurements?ascý!e-'s law', was used. Thiq model accounts for the in a High Energy Spark Gap", Proc. of the 4th IEEEsiu:t-.ecus axial and radial heat transfer in the arc Pulsed Power Conference, Albuquerque, NM, June ..oluz:-, tne electrode, the hot gas surrounding the arc 1983, p. 159.ar~d the cold ambient gas. The mutual heat transferprocesses between these regions are imaged to a lumped 2. 'V.N. Meller, M.S. Naidu, "Advances in High Voltageparh-e:er model. For large values of pd (pressure Insulation and Arc Interruption", Pergamon Press..±ze. c-.:ance), according to raschen's law, a linear New Yurk, IN, 1981, p. 9.-e*a-'c--.. . b.eteen brea*kdown voltage and gas density t Eso f hd ar"" .-*,--.. 3. Y. Udris, "On the Emission of Cathode Material In
Low Pressure Gas Discharges", Proc. Int. Conf. on
7;uru 7 shows che measured relative recovery Gas bischarges, London, England, 1970, p. 108.vcr.t (dnrs) ' nd three calculated model curves.!=-_ ,r constants for hea: transfer have been 4. H. Edels, et.al., "Experiments and Theory on Arc
,'!:.: rrom the nctlual geometry and the initial Reignition by Spark Breakdown", Proc. IEE, 112,
arc :ezperat-r. was a~ssumed to be 12,000 K. The :34 (1965).
%
66.,
66'

28 IEE RANSACTIONS ON PLASM A SCIENC E. VOL. PS-I 2. NO. 1, MARCH 1984
119
APPENDIX IV
Electrode Erosion Phenomena in a High-EnergyPulsed Discharge
A. L. DONALDSON, M. 0. HAGLER. It LLOW. IFI-.I. M. KRISTIANSEN,II- ELLOW. lil. G. JACKSON. %Ni) L. HATFIELD
Abstract-The ero)sion rates for hemispherical electrodes. 2.5 cm in The purpose of this study was to measure the erosion rate ofdiameter. made or graphite, copper-graphite, brass. two types Of cop- different electrode materials as a function of current I.. orderper-tungsten, and three types of stainless steel, have been examinedin a spark gap filled with air or nitrogen at one atmosphere. The elec- to generate a data base from which theoreticali models de-trodes were subjected to 50 000 unipolar pulses (2
5gs. 4-25 kA. 5-30 scribing thle complex erosion processes could be developed andkV'. 0. 1-0.6 C/shot) at repetition rates ranging from 0.5 toS5 pulses per verified. In addition, the electrode and insulator surfaces weresecond tpps). Severe surface conditioning occurred, resulting in thve examined ill anl effort to define the electrode erosion charac-formation of several spectacular surface patterns (craters up to 0.6 cm teristics and to reduce thle material parameter space used Inlin diameter and nipples and dendrites up to 0.2 cm in hseight). Surface furth 1e r studies.damage was limited to approximately 80 iMm in depth and was con-siderably less in nitrogen gas thtan in air. Anode erosion rates variedfrom a slight gain (a negative erosion rate), for several materials in ni- xpRIETiAt'sr tstrogen. to 5 ucm 3/C for graphite in air. Cathode erosion rates of0.4,ucm 3 C for copper-tungsten in nitrogen to 25 Mcm 3!1C for graphite Spark Gal)in air were also measured. The spark gap shown in Fig. I was designed ito tacilitate fre-
40 quent electrode and insulator replacement arid to alloss for ic-INTtODU)I~t ION curate control over electrode alignment and gap ),pacing. ThleHIGII-ENLRGY spark gaps w~ith lifetimes ot 108~ shots are electrode. are coitposed of' three parts: the hrass support
seln as one ot thle critical components in pulsed power (which also serves as a channel for gas flo%% ). the brlass adapter.systemns used for particle heats systems, lasers, nuclear isotope and the electrode tip. The hemiisphericallý shaped electrodeseparation. elect romiagnletic pulse simulation, aind thermonou- tips are 2.5 cm in diameter and aire made from thle various ila-
11111clear fusion reactors. The performance of a pressurized spark terials studied. The Lucite inserts proside protection for thegap as a high-energy rep-rated switching device is typically main gap housing anid also provide a surface which gives a per-characterized byits hl-fvotg.recovery time. ea manent hitryo the discharge dchris sliich is deposited on
time. anid jitter ~IJi . Thle switch lifetime is determined by the the walls.electrode erosi')n. gas decomposition ;,nd disaissociation. andinsulator damnage that occur as energy is dissipated in thle Tes5t Circ~uil 11d Comitfiliomsswitch [21. Numerous experimentors have measured erosion rates for
highm-currenm ( 10-S00 kA) oscillator\ discharges 131 -171 . AMinus,:hist rcceived Mtay 18, 1983: revised December 14, 1983. lew have studied erosion rates Iin high-currenit (<10 kA) uni-
This uork was supported by the ASir Force Otfice of Scientific Re-poadicrgsun rssndopeeltoesny(I.
A. L. tDonaldso~n. M. 0. ttavcl. and Mt. Kristiansen arc with *he 191.- A test circuit capable of delivering a unipolar pulse wasPlasmia and Switching Laboratory. Department of 1-tectrical t neineer- chosen for this stud\. - oth to simtplify separate investigationsS
inc. T~a' Tec tnivesit~ -Lubboc. TX ~of tlte erosion processes at the anode andthca oendoG. Jackqon i s \%th the BDSI ( orpor.itmfln. Itutumsvilt. At, 3580m3.t..I liattield is A itti the Department oft pth\ sines. 1 e\I5 Tech University. simulate certain applicationis more closelN . Thle circuit.- shown
Lu hhdck. 1X 94 , 19. Iin he. 2 . consists )f a six-section Raý leigh pulse forming net---
0093-3813,84 O3OO4)OY'SSOl.00OO 10l84 1 LI.

DONALDSON er aL: ELECTRODE EROSION PHENOMENA 1 20 29
'-44HV CONNECTION Rc L, Le L, L. Le L,
FROM PFN
AIR INLET 17--- ' $• GA
ELECTRODE t*SSEPERATION t L.-2OOnHADJUSTMENT"• ""
---'-LUCITE C-3.5,F esch v.. 3OhVL-i2S•0t each I. - 25kA
Fig. 2. Test circuit for erosion studies.-- INSULATOR
BRASS INSERTSELECTRODE
S•1- AIR FLOW! ;! PORTS
ELECTRODE - YLON"TIP HOUSING
10
K0 is/div
Fig. 3. Current pulse.
(DFP-IC) [141. This combination of materials allowed for:-" --- CONNECTION 1) a comparision with existing data for brass and stainless
TO LOAD steel [31, [41, [81, [151, -2) utilization of materials which experimentally have given
AIR On-L--- good spark gap performance [31, [61, [16],
Fig. 1. Spark gap for erosion studies. 3) the testing of several new materials, namely copper-graphite, and the stainless steels 2OCb-3 (previously usedin highly corrosive environments in MHD generators) and
work (PFN) which is resistively charged to the self-breakdown 440-C (a high strength stainless .teel). Svoltage of the spark gap by a 30-kV I-A constant voltage The thermophysical properties of these materials are given in
power supply. When the gap breaks down, the PFN is dis- Table I.charged into a matched 0.6-42 high-power load. Further de-tails of the test circuit and load design are discussed elsewhere EXPERIMENFtAL RESULTS
110 1. The waveform of the discharge current is shown in Fig. Erosion Characteristics3. The test conditions are summarized below: The change in mass of ihe spark gap electrodes after 50 000 0
voltage <30 kV shots was measured with an analytical balance with a precision
current <25 kA of ±5 mg. The individual test conditions and resulting erosion
total capacitance 21 MF rates are given in Table II. Although many authors report ero-
charge/shot <0.6 C sion rates in micrograms per coulomb, the actual factor deter-
energy/shot <9 kW mining lifetime is the volume eroded, hence the units micro-
pulse width 25 Js cubic centimeters per coulomb (pcm 3/C/). The results for brass
rep-rate 0.5-5 pps are discussed later because of the failure of the electrodes due
gas air or N2 to gross material extraction. %pressure I atm (absolute) Material: A ranking of the volume erosion rate for each ma-
flow rate I gap volume every 5 s terial investigated, from smallest to largest. is:
gap spacing <0.8 cm. Cathode: CT-3W3(N 2 ). CT-K-33(N 2 ), CT-3W3 (air), CT-K-33(air). SS-304(N2), SS-304(air), SS-440-C(air).
Materials Tested SS-2OCb-3(air), CG(air), CG(N 2 ), G(N 2 ), G(air);
The electrode materials tested were: brass (SAE 660), stain- Anode: CT-3W3(air). CT-K-33(air), SS-440-C(air),CG(N2), - "
less steel (304. 2OCb-3, 440-C) [I I I. copper-tungsten (K-33 SS-304(air), SS-20Cb-3(air). G(air). (The rest of
[121. 3W3 1131. graphite (ACF-IOQ). and copper-graphite the anodes showed no net erosion.)
-.- ""

121= 30 IEEE TRANSACTIONS ON PLASMA SCIENCE, VOL. PS-I 2, NO. I, MARCH 1984
TABLE IELECTRODE MATERIAL PROPERTIES
Material Composit ion Io d k C(ka/rn3) (n/, "K) tkJ/kg "gi (0-0ý0 .• "
brass Cu 83%, Fb 7% 980 870U 120 U..$6 6.7Sn 7%, Zn 3%
Stainless steel (.53) Fe 69%, Cr 19% 1430 8000 16 0.56 72(304) Ni 9%, FMn 2%
Stainless steel (55) Fe 41%. Ui. 33% 1370 6100 13 3.50 1u8(20Ch-3) Cr 19%, Cu 3%
Stainless steel (SS) Fe 79%, Cr 17% 1370 7600 24 0.44 6u(440-C) C 1%, Mn 1%
Coppr-tunmsten (CT) W 679. Cu 33% Ci 1080 14000 270 0.25 3.4(K-33) W 3400
Coper-tunsten (CT) W 68%, Cu 32% 230 4A 3.4(3h3)
Graphite (ACIF-10) (G) C 100% 4200- 1830 87 0.80 270(1
Cqppr-graphite ICG) C 84%, Cu 16% Cu 1080 2970 175 0.84 17s(L2F•-IC)
Tmp: melting temperature, d: density, k: thermal conductivity, c: specific heat p; resistivity, : graphitesublimes.
TABLE 11 work reported here, is a poor anode material. Previous studies
ELECTRODE EROSION RATES [61, [151, which indicated that graphite was highly resistant,i•1enaE AEs V 0 to erosion were done at a much slower repetition rate (0.03
pps) and, therefore, gave a significantly lower erosion rateStnless•stei (304) Air 10.3 0.21 1.8 1.2 (<1 1Acm
3IC). More recent results by Bickford [161 at 1000
stainmMst, .. Air ,0.6 0.22 ,.5 ,.0 pps gave an erosion rate of 41 jtcm3/C which is reasonablyStainls .steel • (1, Air 2.0 0.37 %.6 1. close to the value of 25 Mcm 3 '/C measured in this experiment.Stanless steel 2I4.-C) Air 12.4 0.26 1.8 0.s A summary of the erosion rates found by other investigatorsita,•nlistee (2o2J-3) Air 20.0 0.21 2.5 0.9 is given in Table Ill. If one takes into account the lower val-Stanle-. ste (304) (2,31 N2 .8 0.16 2.7 +0.0 ues of current used in this study, then the results obtained inC4Pmr-tunwqt, (-33) Air 9.5 0.20 1.2 0.4 this experiment are in generally good agreement with the inea-Caeer-tt,.esn Air 11.5 0.24 1., U.3 surements of other investigators.*C0PPr-ten1;etW Air 18.0 0.37 1.2 0.5 Polarity: Unlike previous experiments, where oscillatory,:Q.r-tuw.ten O2,3) Air 25.4 0.32 0.8 0.2 current conditions masked any polarity effect, a distinct dif-C.opr-tuntetm (-33) (3) 12 14.8 0.31 0.4 0.4 ference in the cathode and anode erosion rate and, most likelyco•,r-trsten 2w33 -42 26.4 0.34 0.4 + 0.0 the erosion mechanisms themselves were observed using a uni-Coippm-qr•,ite Air S.3 0.17 8.5 0.4 polar pulse. The ratio of cathode to anode erosion, for thoseCoer-aate , Air 16.2 0.34 6.6 - 0.0 materials which had significant anode erosion, varied from 1.5G C,•r-aeite " (31 Air 22.4 0.24 7.2 0.0 in stainless steel (304) to 16 in copper-graphite. Carder [8]Cxs,-q•r ,ite 13) 42 14.8 0.31 13.5 0.8 reported ratios of 2.5 to 5 for brass under similar conditions.Gr-a~ite IAU•-t0Q) Air 9.2 0.19 24.2 3.5 Previous experiments, which gave cathode to anode erosion
*,, Air 20.6 .. 22 24.6 3.6 ratios less than one, were done at much higher pulse repetition, Air 28.0 0.31 23.5 S.0 rates (10-1000 pps) 1151-1181. In addition, the results ob-
•,hite 13) N2 12.9 0.27 15.7 0.0 tained by Petr 118] were done with smaller anode diameters
V. average voltage, kV; Q: charge/shot, coulombs; CE: cathode ero- and gap spacings (both <2.5 mm).sion. gcm 3 /C; AE: anode erosion, mcm'/C; 11 1-32 000 shots, [21 - In general, anode erosion rates were somewhat scattered, and22 000 shots, [31-experiment performed at approximately 85 percent thus general trends were hard to obtain, given the limited dataof maximum power, + indicates that an increase in mass was measured. berbase. However, some agreement with an anode erosion rate -.-
proportional to Q..S was observed for graphite. A similar de-As expected, the copper-tungsten composites gave the lowest pendence has been found experimentally and derived theoret-
* volume erosion rate. Somewhat surprising, however, was the ically by numerous other investigators [191 -1211.excellent performance of the stainless steels (304 and 440-C) Some anodes actually gained mass. which indicated that ma-and the poor performances of the graphite materials as cath- terial was being transferred from the cathode to the anodeodes. From the results obtained for stainless steel in a pulsed and/or chemical reactions were forming compounds on thedischarge, it is seen that the high erosion rate reported by anode. The material transfer was demonstrated experimen.Gruber and Suess 131, for an oscillatory discharge, was possi- tally when a stainless steel cathode was found to deposit mol-bly a result of using a stainless steel which, according to the ten material on a graphite anode. Gray and Pharney [221
z..........,,-.

DONALDSON er aL: ELECTRODE EROSION PHENOMENA 122 31 0
TABLE IlISUMMARY OF COMPARABLE EROSION RESULTS
Investwator Lrosion Rate Material Gas Current Waveform(WOcR
3/coul) (kA)
Atfinito [15] 1 Graoite N2 (2 at-) 100 Oscillatory
(0.03 pps)
delkin [171 0.7-1.4 Brass iieliu (I atm) 40 Oscillatory
BicCford [f1i 5 Copper-tunqsten CO ( I ab) 1.5 Unipolar
6 Stainless-steel * (1000 pp
41 Graphite
Burden and Jases [41 5 Brass Air (1.25 atm) 400 )scillatory
Carder [81 3-5 Brass N;2 (2 itli) 10-22 .nipolar(I pps)
...ruber aid Suess (3] 2-10 Cop.er-tunasten Air (1 atm) 40-170 Oscillatory5-40 Brass *
20-40 Stainless-steel •
Kawakit3 (7) 80 Copper-turwsten SF6 (4 ati) 100
, - . :;-For a given cathode material these results indicate a linear de-- :C~e-~ t~t~(0FP-C)
e- r e (C4-• pendence of the erosion rate on the quantity Q=f i dt over(20Cn-3) the entire range of currents. Since the energy in the arc is
S. -•:_ = '_,• equal to f Pa, i dt, this seemed to indicate that the main" -3w3• source of energy producing molten material and subsequent
vaporization and droplet ejection is in the cathode fall regionof the arc (ion impact heating) and not the localized i2R losses
* A.._. - (Joule heating) in the material. (A similar statement by Bel-
kin [51 touched off a heated debate in the literature (231,[241.) Although both experimental [251 and theoretical re-
-, suits [261 exist which support this conclusion it will be shownthat you can obtain erosion rates proportional to any reason-
- ** " ~-- able function of current, even f i dr, with Joule heating. Also,46+ it should be mentioned that cathode and anode fall voltages are .
.- not known for short-pulse high-current arcs which make ithard to check the erosion dependence on f V'=x idt.
OCrrent: In order to understand the erosion dependenceon current one should consider the following: the high-currentarc in both vacuum and pressirized gaps is known [91. 1271to consist of many individual filaments, each of which is at-
; ' •20 tached to the electrode and forms a microscopic crater. Even
if the erosion at each crater site is due to Joule heating [21]
"" I *[281 the total erosion is a function of the filament currentand the temporal history of each attachment site. For exam-
Iig. 4. Total cathode erosion versus total charge transfer for different pese welectrode materials in air. pie, under certain circumstances it has been shown [91, [271
that the current per filament and the attachment lifetime areapproximately constant. Thus regardless of the erosion de-
proposed a reasonable model for this effect at low currents. pendence on current at each individual attachment site, thewhich is based upon the reduction of the ion bombardment total erosion would be a function of f i dt since the total num-force on the molten Lathode material during the fall of the ber of sites would be a linear function of current. This alsocurrent pulse. explains why no clear dependence of erosion on the thermo-
Cathode erosion rates are plotted in Fig. 4 as a function of physical properties IT,np. d. k. c. pi has been consistentlythe total charge transferred in 50000 shots (f idt)' . The ac- measured in experiments. Thus to understand the erosion -tual experimental variable used to change the current was the process correctly, one not only has to model the erosion mech-lgap spacing. Thus. from these data. there is no way to isolate anism occurring at each filament attachment site correctly.
the effect of increasing gap spacing and increasing current. which will certainly depend on Tm,. d. k. c. and p [211. butalso a model must exist which specifies the filament current
* Note that the constant slope showvn implies constant erosion rate per and the temporal history of its attachment site. Excellent
Coulomb. models exist for filament motion in low-current low-pressure

.t r I.-I- iA AC- ONS0N Pl.AS NIA SC I NC I-, VO0L. I'S.12, No, .I, MARCI 19 84 0
4 4
liL. 5. Crois wectionf of stainless steel 0034) cathode in air.
(b)
i 400
Fig. 7. Surface of brass electrodes in air; (a) anode. (b) cathode.
50 'IM 1Fie. 6. Cross section of stainless steel (304) cathode in nitrogen. SURFACE CON DI FIONS
The surface of the electrode tips and the insulator inserts,jrs [S ad hghcurcti ars n vcuu 121 bu itis otwe re examined after 50 000 shots. The analysis techniques
anticipated that uny one model will suffice for the wide rangee uiie eeAgreeto setocp A ,sannOf confditions encountered in high-energy swths electron microscopy (SEM). and optical microscopy.
La:Teeoinrt o cpe-rpie sihl Brass: The surfaces of the brass electrodes are shown inhigher in nitrogen than in air, whereas the rates for most of the Fg.7ad8 ag-cl etr seiet ihdnrtso
othe maerils eresmaler;.i nitooe bva fcto of2-3 In metallic protrusions up to 0.2 em long existing on the surface.othr mteralswer smlle innitoge bya atorof -S.In The self-breakdown voltage for these electrodes dropped fromadijttion, the cross ,ections of the electrodes, shown in Figs. 20 to 3 kV in approximately 2000 shots as a result of mnacro-and 6. show a significant reduction in the depth and amount cpcfednhcmnt.nadiontevlagsl-bekofpi dfiald enacmnswnadto, h otg efbeofdmage whfen tl i~e gas is nitrogen rather than afir.-The gas down distribution was characterized by a series of lmsMa ffc teerosion in one. or more of' the following ways: thoughit to be due to large particles being "blown" off the0
Il by forming chemical compounds on the electrode surface ends of the protrusions. Originally it was thoughlt that the mia-which alter: terial being *'pulled out" of the builk electrode was lead. butai the thermal stalhility [291 , the resuilts of the .\ES analysis shown fin Fig. 1) indicate theh) thL, current density ait individual attachment sites in surface consists primarily of' car bon.,coppe r, o'nd oxygen, with
the artc [301. a notable absence of' zinc and lead. From these results andc) the lifetime of eac:h attachment 1P01 those found by Marchiesi arid Nlaschio [6] . it is obvious that
2 by pa ,duciau, ac;%eleratod Jhemical reactions at the elee- brass has only limited use in repeltitive operation at higher 1ev.tiode surtace [11 I . part icuilarly at impurity site!s or at the eis of charge transfer.1na.ne1siut.11 Snil id;1 st linger locations ini stain less steel Althoughm the mechanismn for the material extract ion is not -
'I and completely understood. lBelkin [331 showed that the eloct ro-3bya!ltering~ the cathodeC an1d amnode fall voltages, particu- magnetic J Y Bi force resulting from the discharge can play an1imrly at higher pressures. important role at large currents, In addition.ý Fitchi and Me-
............................................. -

124
DONA LDSON' ca.j/ LEC"IROD1. ERoSION PHENOMENA 33
6~ (a) b)
Fig. 8. Surtact! or brass electrodes in nitrogen. (a) anode. (b) cathode.
(a)
I idi~ ~A: ~ 9 ýc::jn )petfroscop' 'I! qart. inilysis of brass clectrodes;lit 'ittod". bit) luL Pectrumf.
Cowlitck 1 .7-1 )hserved alross miaterta'l e xtraction from stain. I .1 raipllitt ando 11' co flpr-.:raptlik jii odc ~urta,,,, in ort
les Nleel vlec: rode is a re-sult ot as%,miniettical current coin-nlec nll' and coprtnsLncahdsso wdec tivr elt.
Culhd<k The .ithudes br() must of the remrain.inlg materials Ing . AIlthough it IS lk,( eas% t0 Wee in thle phll'LtorapWI. ill :atlt-ire Ow%%n in F-igs. 10-i-'. Considerable erosion Itas taken odes Nhowed a di-,: mct tcndenc\ý to ftotl I lai se-'cile Cjlra1
* place. espicclia~ on the graphite materials. The stainless steel whose diameter n:inclass wxtlm itncreasing zan ýpacina and,1ur-

12534 IEEE TRANSACTIONS ON PLASMA SCIENCE, VOL. PS-1 2, NO. 1, MARCH 1984
S "
(a) (b)
Fie. 11. (a) Stainless steel (304) and (b) copper-tungsten (K-33) cathode surfaces in air.
* 0.
(a) (b)
Fig. 12. (a) Stainless steel (304) and (b) copper-tungsten (K-33) cathode surfaces in nitrogen.
rent. Similar macroscopic cratering was observed by Watson over the entire surface. Like the pattern at the cathode, the S[35] who explained the results with the use of a hydromag- diameter of the anode erosion region increases with increasingnetic flow model. The idea of using a cathode cup in spark current.gaps is not new [361 . [37J 1 but it is interesting that the elec- Insulator: A typical insulator insert, for eight of the possi-trode erosion produces this shape. The location of the cur- ble combinations of electrode material and gas, is shown inrent attachment at the cathode should depend on the mini- Figs. 16 and 17. The insulator surfaces are covered by a coat-mum electrical path length seen by the electron avalanche ing of recondensed electrode material. The one notable ex- 0prior to breakdown. Thus the erosion pattern and the corre- ception was graphite electrodes in air, in which case no coatingsponding erosion rate may be highly geometry dependent. was found on the insulator surface. A dramatic difference is .
An,,de: The anodes, corresponding to the cathodes shown seen in Fig. 16, in the case of a graphite electrode run in nitro-in Figs. 10-12. are shown in Figs. 13-15. The graphite and gen. The entire insulator surface is covered with a thick coat-copper-graphite anode erosion occurs primarily in a band. 0.8 ing of fluffy black material which is thought to consist ofcm wide. with the inner radius located 0.3 cm from the cen- monoatomic layers of amorphous carbon [311.ter of the electrode. This pattern is consistent with the re- All insulators were covered with solid particles. 10-100 pumsuits of Johnson and Pfender [381 which showed that an an- in size, distributed within a 5-cm band centered on a planenular-shaped attachment region of high current density can passing through the center of the gap and parallel to the elec.exist at the anode. The copper-tungsten and stainless steel trode surfaces. This indicates that a considerable portion ofanodes indicate that melting and vaporization have taken place the solid or molten material is ejected parallel to the electrode
2.3

DONALDSON et aL: ELECTRODE EROSION PHENOMENA 126 35
(a) (b)
Fig. 13: (a) Graphite and (b) copper-graphite anode surfaces in air.
(a) (b)
Fig. 14. (a) Stainless steel (304) and (b) copper-tungsten iK-33) anode surfaces in air.
(a) (b)
Fig. 15. (a) Stainless steel (304) and (b) copper-tungsten iK-33) anode surfaces in nitrogen

12736 IEEE TRANSACTIONS ON PLASMA SCIENCE. VOL. PS-I 2, NO. 1. MARCH 1984 S
Air : 2t Lr o ,"r.
(a)
(a)
(b)
Fig. 16. Insulator inserts exposed to (a) graphite and (b) copper-graph- ,,i.e electrodes in air and nitrogen.
,•, i•
w (b)Fig. 18. Scanning electron microscope picture of stainless steel (304)
electrode surface; (aI outer edge. (b) outer edge enlarged.
surfaces. Daalder [391 has reported similar results for vacuumAi Nitrogen arcs and McClure [40] has developed a model which shows
tat that the ion recoil pressure of a vacuum arc plasma is sufficientto remove molten material from a cathode spot crater with
velocities of 2 X 10³ to 2 X 104 cm/s parallel to the electrode
surface. The values of velocity from McClure's model are ingood agreement with the experimental findings of lidris [411.
Recent studies in vacuum arcs by Farrall [421 and Shalev[431, which have characterized the size and flux of the ejectedparticles as a function of current. indicate that the maximumnumber of particles are released at. or just following, the cur.rent maximum. Since the arc attachment region will reach itsmaximum diameter at the current maximum, then one would
" expect droplets of material to separate from the electrode at
the crest or edge of the macroscopic crater. An SEM examrna-¢r Nitro�l*'t tion of the surface of the stainless steel (304) electrodes shows
(b) considerable agreement between the size and shape of the elec-I ih I" Insulator inserts exposed to (a) stainless steel (304) and (b) trode surface features existing at the edge of the macroscopic S
copper-tungsten (K-33) electrodes in air and nitrogen, crater, which is shown in Fig. 18. and a 50-mm stainless steel
........................... ........................... ..... -. •.._

DONALDSON er aL: ELECTRODE EROSION IPHI-NOMENA 1 28 37
l, ." ]owing objectives are being considered for future work.1) Measure the erosion rate as a function 01 piessure (10-2
Sto 4 atml. rep-rate (1-1000 pps,. and as flow rate ,Or a fewof the more promising electrode-gas-insulator combinations.
2) Study the attachment of the arc to the electrode surface 0
for a single shot as a function of pulse shape and peak current.3) Compare the relative erosion rates for oscillatory and uni-
polar pulses which have different peak currents but transferthe same net charge.
4) Measure the voltage drop in the arc for pulsed currentsin order to calculate the energy dissipated in tile gap iegion. 0
5) Measure energy delivered to electrodes as a function ofpulse shape, previously done by Carder [81. and comparethese results with those computed from the arc voltage mea-
surements in 4).
ACKNOWLEI)GMENT
The authors wish to express their sincere appreciation to thes a following people for their various contributions to this work
and its preparation: A. Bowling, M. Byrd. J. Clare, B. Con-Fig. 19. 50-gm stainless steel (304) particle on Lucite insulator, over, J. Davis, B. Maas, C. Mueller, R. Ness. S. Prien, K. Rath-
bun, A. Shaukat, and A. Williams.
(304) particle found on the insulator and shown in Fig. 19. Athorough characterization of the particles found on the insu- RE:ERENCES
lators used in this experiment is given by Jackson et al. [441. I1] T. R. Burkes et al., "'A critical analysis and assessment of highThe presence of similar particles has been shown to have serf- power switches," NSWC Dahlgren Lab.. Rep. NP 30/78, pp.
189-202, 1978.ous effects on the flashover potential of the insulator at high [21 L. B. Gordon et al., "Material studies in a high energy spark 'gap,"
pressures for particles bigger than 35 gim and densities of 20 IEEE Trans. Plasma Sci.. vol. PS-10. pp. 286-293. 1982.particles/mm 1451. Thus the electrode erosion mechanism [31 J. E. Gruber and R. Suess. "Investigation of the erosion phenom-
enon in high current, high pressure gas discharges." Max Planckaffects the switch lifetime, not only as a result of the erosion Inst. fur Plasmaphysik, Garching bei Munchen, IPP 4/72. Dec.itself, but also by coating the insulating materials with conduc- 1969.tive particles. 141 R. A. Burden and T. E. James, "Statistical performance datafor a high current 60 kV spark gap switch," in Proc. 7th S 'emp.
Fusion Technology (Grenoble, F-rance), Oct. 1972. pp. 24-27.SCONCLUSIONS 151 G. S. Belkin, and V. Ya. Kiselev, "Electrode erosion in pulsed
The erosion rate and surface damage of the electrodes was high-current discharges," Soy. Phys. Tech. Phys., vol. II, pp.
determined for several materials utilized in a high-energy spark 280-283, 1966.gap.Ther esu f ro m seealmtherase prlimdinary sdieshavenledy s k [61 G. Marchesi and A. Maschio, "Influence of electrode materialsgap. The results from these preliminary studies have led to on arc voltage waveforms in pressurized field distortion sparkthe following conclusions. gaps," in Proc. 5th Int. Conf on Gas Discharges. Sept. 1978,
1) The electrode erosion rates and mechanisms are highly pp. 145-148.polarity dependent and thus results for oscillatory and uni- [71 Y. Kawakita eg al., "A 150-kV. 100-kA spark gap switch for
Marx generators," in Proc. 3rd IEE'kE ilt. Pulsed Power Conr.ypolar discharges can he considerably different. (Albuquerque, NM), June 1981, pp. 444-447.
2) A large amount of the erosion is in the form of solid and 181 B. Carder, "Gas spark gap electrode heating and erosion," Phvs-
molten material removed parallel to the electrode surface and ics Int. Rep., PIIR, pp. 12-74, Dec. 1974.191 R. Basharov er al., "'Erosion of cathode material in a pulsed dis-
apparently, from the edge of the macroscopic craters found on charge between parallel electrodes," Sop. Phys. Tech. Phy-s., vol.the cathode. 12, pp. 1383-1390, 1966.
3) Cathode erosion rates are proportional to the total 1101 A. L. Donaldson, "Electrode erosion measurements in a highenergy spark gap," M.S. thesis, Texas Tech University. Lubbock.
amount of charge transferred for a fixed repetition rate and TX, Aug. 1982.pulse width. 1111 Carpenter Technology Corp. Reading, PA.
[121 Schwarzkopf Development Corp.. Holliston. MA.4) Stainless steel (304) may be an economical replacement 1131 Contacts Metals Welding, Indianapolis, IN.
for copper-tungsten composites as a cathode material for tile [141 Poco Graphite, Decatur. TX.conditions studied. 1151 D. Affinito et al.. "Design and structure of.an exmended life hich
5) Anode erosion rates were quite scattered, but, in general, current spark gap." ILEE Trans. Plasma Sc. vol. PS-, pp. 162-
were considerably less than the cathode erosion rates for all [161 K. J. Bickford ct al., "Spark erosion characteristics of i'raphilematerials tested except stainless steel. and CO gas," in Proc. IEEE Con) 15tih Power Modulator Sy'np.
(Baltimore. MD). June 1982, pp. 89-92.6) No distinct correlation was found between the thermo- 1171 G. S. Belkin, "Vaporization of metal electrodes by pulsed cur-
physical properties of the electrode materials and the amount rents,"Sov. Phys. Tech. Ph vs., vol. 13. pp. 1256-1260. 1969.
of erosion. 1181 R. A. Petr, "Erision phenomena of arching electrodes,'* %I.S.thesis, Texas Tech University. May 1980.
In order to develop a more precise understanding of the 1191 H. W. Turner and C. Turner, "Choosing contact materials," 'kc-effects of electrode erosion on switch performance, the fol- tron. Power. vol. 14, pp. 437-439, 1968.
1291)ILt I HANS AC If NS ON I'l ASM AS If UNfl. VOL. PS. 2. NO. 1. \1.*\R(II 1484~
1201 1 M \. Munfi\ti and R. i S111111. ''~pt.1a *1.,1ipan) Ing Iran- Readmine PA. 198f0. p). 9.oetI s-,%V')tltas dischatc' : in litjuid Llfh ris"1.I rans. 1331 Gi. S. lBelktn and 'ý. aj. Kiselev, -I tect of the niedwin on theL
part 1. iil. 74. pp. 1u)4-I1n9, 1,14, clectrical cfoshtfl electrodes it hu-0h current,"' Sot' Iht's Feth/.
1211 1 . l~i .nd S. V I ds'lDc 'turiaon .,f,:lect r,,Ls hy dc Phv. vol. 23. pp. 24-27, 1978.tric d ScIares of ithh- currenit .iit 'S,), t' .; P les ch. phI'. 1341 R. A. ;itch and N. R. Mc ormick. "[.,)%&-inductance s%%. itching'ol. 7. pp 717-721. 1-463. uisina parallel spark -jps.- ProcI. md. 1:/cc. Elot. výol. 1046A.V pp.
P122-1 . %. 61',s andt 1. R PI-11,rc --I1 locitode erosion b\ particle I1 '-'13ff. 19"9.el'Vci.lo in Io'S .ciirrctlt arcI.. ' J pi Pin.. vol. 45. pp. 667- [351 A. Watson. lIast risingm heavy tu r~ent sp.:rk diautrr to leke't671. 1974. trodes.'' in Proc. 2ndc liii: Mri. Power Pulsed Copif Lubhock.
12 3 K. K. N\ainiokos. "'I lv. trode erosion in high-turrent pulsed dis- T X). J une 19 79. pp. 4 7 1 -474.charg-es.'' S,)I. Ph/ 1 ij A kYhv 5.. vol. 12. pp 714-7 16. 196 7. 16 1 1 . S. fGouelter vt al.. ''Spark --ap \%ittches or radar.' Bell SY.f.
1:41 G. S. Belkin and \ s. t,'e. '*I cafures of electrode erosion Tochi. J., volI. 25. pp. 563-6o)2. 1 946.due to huth culrrent pulses.," Sot'. P/it-s Tech. Phi v.. vol. 1I?. pp. 1371 A. F. Bish~op and G. 1). lFdsards. ''Lots -inductance 100) k V- !9-7201. 1967. N%%itcI (spark gap)4 tor startting. divertliny. atnd claitnpint! capacitor0
1251 S.Ls "Spa'k-ezap ero',ion studies.'' USAI L.RD11. Rep. No. diseharees." Pro~c. 11151 I/cc ling . %ol). 113. pp. 1549-1556,2454. L.S. Arrnr licctrontes Researcft anu Developinent Lit,%. 1966.1 ott Monmouth.il. NJ. Apir. 1964. 1381 D. Johnsoni nO L:. l'fcndet. ''Modeling, and metasuremtent of the
[261 14. 1 ottrier. .'Ci.th ,tc teat tnu bek 'acuumtti-s. .It surves.I/mei. intit al anode heat titI\e\ in pstlsvd htgh-curt-ent trcs."' mu:E Frait'rupe a j:C Jr Plaroa Phvuk. Kitml 12-f lef' 5. 1pp 45-3-462. S/aot / ,e %ol P.7, p,1. 44-48. 1979.
1X 3QI J. I. Daider. " at hode spots and vacuum arc-,." l/nioi. vol._27.j I C. Sl.,rtt1':tt. et al., 'rthe 'po)ntaneous formattimn of4 cath' 1114c. pp, 91-1046. 1981l.
s)c ots itt high-currenit triecered :acuumn switchies and an 1401 (". W . McClure. "P'lasna e'spamtsion as a cause of metal displace-:stittnate of the atfi ýde spot current densit% on copper," in ientt in vicuumt-arc cathode spots." 1 I-vle. Phi's. vol. 45. pp.Po),- 4th e.ý Contr. on (;as Iischaritcs Swvanswa. U.K.), 1976. 2047S-2084, 1974.;,p 94-97. [4i I Y. Idris. "On the emisson of cajthode material particles in low
I-S~I A. F'. G;utle, "Joule hicating in emittint! sites on various nonretrac- pressure arc diseharites." in Proc. lnt. 'u/ti,. on Gas Dischargestcr': ,,c cathodes," Proc. Inst. Plec. Eng.. Nol. 127. pp. 452-457. 1 London, England), 1970, pp. 108-112.1984). 142! G. A. I arrall et al., -The time-resolved characterization of cr0-
1291 lV. 1. Zolotarc'v. cC !."radonvttt stability of gas-filled sion products frcm high'current. copper vacuum ares," MAY.'switches for voltage pulse gwricr'atur," Sot' Phvs. Tech. Phvs.. Trains. Plasma Sci.. vtol. PS-i 1. pp. 132-138. 1983.vol. 2 1, pp. 340-344. 1976. 1431 S. Shalev et al., "In situ determination of macroparticle veloc-
1301 A. F. Claile and A. H1. Ilitchcoek. "Are-cathode era ters (on copper ities in a copper vacuum arc," IL'kEk Trants. Plasina Set., - Alat high currents and s';ith reduced -a~s pres~sures," Proc. Inst. Elec. PS-Il., pp. 146-IS 1. Sept. 1983.Eite.. vol. 125. pp. 25 1 -256. 1978. 1441 G. Jackson ei al.. "Surface studies of' dielectric materials used
J31 1 L. B. Goirdttn, "Material studies in a high energ~y spark gap," in spark -.aps." J. .- ppl. P/iis., vol. 55, pp. 262-268. 1984.Ph.D. dissertatton, Texas Tech University, Lubbock. TX.' May [45 1 B. 1'. Hatmpton and S. P. Fleming, "Impulse flashover tof particle1983. contaminated spacers in compressed sulf'ur hiesafluoride," Proc.
[3 21 '.Ca rpenter 2ffCb-3 stainless steel." Carpenter Technology Corp.. inst. Elec. Eig., vol. 120, pp. 5 [4-522. [973.
0093381384/300403901.0 Oc1984IFE

130
Journal Papers and Conference Proceedings Papers
Published with AFOSR Suppoct
(*M4arks publication supported by this grant)
* A.L. Donaldson, M.O. Hagler, M. Kristiansen, G. Jackson, and
L. Hatfield, IEEE Trans. on PLasma Science, PS-12, 28 (1984).
* A.L. Donaldson, M.O. Hagler, M. Kristiansen, L.L. Hatfield,
and R.M. Ness, "Modeling of Self-Breakdown Voltage Statistic
in High Energy Spark Gaps", accepted for publication in
J. Appl. Phys.
SG.L. Jackson, L.L. Hatfield, G.R. Leiker, A. Donaldson, M.O.
Hagler, M. Kristiansen, R.M. Ness, J. Marx, and P. Predecki,
"Surface Analysis of Gas Filled Spark Gap Electrodes" to be
submitted to J. Appl. Phys.
* C.H. Yeh, H. Krompholz, H. Hagler, and M. Kristiansen,
"Recovery Measurements in a Spark Gap", Proc. 16th Power Modu-
lator Symp. Arlington, VA, 1984 IEEE, p. 64.
* C.H. Yeh, H. Krompholz, M. Hagler, M. Kristiansen, "Recovery
Studies for a High Energy Spark Gap", to be published.
0 2
-•-:-'..-.:- ,.-. .-- <- •.•-....•< -•. -< -...--. . . .. < •- - .- <. . .- *.- . .. . . . . . . . . . . .. - •

131 0
H. Krompholz, J. Doggett, K.H. Schoenbach, J. Gahl, C. Harjes,
G. Schaefer, and M. Kristiansen, "Nanosecond Current Probe for
High Voltage Experiments", Rev. Sci. Instr., 55, 127 (1984).
G. Schaefer, K.H. Schoenbach, H. Krompholz, M. Kristiansen,
and A.H. Guenther, "The Use of Attachers in Electron beam
Sustained Discharge Switches - Theoretical Consideration,"
Laser and Particle Beams, 2, 273 (1984).
K.H. Schoenbach, M. Kristiansen, and G. Schaefer, "A Review of
Opening Switch Technology for Inductive Energy Storage", Proc.
IEEE, 72, 1019, (1934).
G. Schaefer, P. Husoy, K.H. Schoenbach, H. Krompholz, "Pulsed
Hollow-Cathode Discharge with Nanosecond Risetime", IEEE
Trans. Plasma Sci., accepted for publication in 1934.
, o . -4
C.3. Harjes, K.H. Schoenbach, G. Schaefer, M. Kristiansen, H.
Krompholz, and D. Skaggs, "An Electron Beam Tetrode for Multi-
ple, Submicrosecond Pulse Operation", Rev. Sci. Instr., 55,
1684, (1984).
K. H. Schoenbach, G. Schaefer, M. Kristiansen, H. Kroinpholz,p
H. Harjes, and D. Skaggs, "Investigations of E-Beam Controlled
Diffuse Discharges", Gaseous Dielectrics IV, ed., L.
Christophorou, Pergamon Press, p. 246, 1984.
o.............. * . .

132
G. Schaefer, B. Pashaie, P.F. Williams, K.H. Schoenbach, and
H. Krompholz, "A New Design Concept for Field Distortion
Trigger Spark Gaps", J. Appl. Phys., accepted for publica-
tion.
K.H. Schoenbach, G. Schaefer, M. Kristiansen, H. Krompholz,
H.C. Harjes, and D. Skaggs, "An Electron-Beam Controlled
Diffuse Discharge Switch", J. Appl. Phys., accepted for publi-
cation.
K. Schoenbach, G. Schaefer, M. Kristiansen, H. Krompholz, H.C.
Harjes, and D. Skaggs, "A Rep-Rated E-Beam Controlled Diffuse
Discharge Switch", IEEE 1984 16th Modulator Symposium, p. 152,
Arlington, VA, June 1984. .
M. Kristiansen, K. Schoenbach, and (3. Schaefer, "Opening
Switches", Proc. 3rd All-Union Conf. on Engineering Problems
of Fusion Research, Leningrad, USSR, June 1984. - Invited
S i
."
-- I
S
...................................