sparse multi -tone complex response spectrum
TRANSCRIPT
Multi-Tone Distortion Measurement
AN16
Application Note for the KLIPPEL R&D and QC SYSTEM
(Document Revision 2.1)
DESCRIPTION
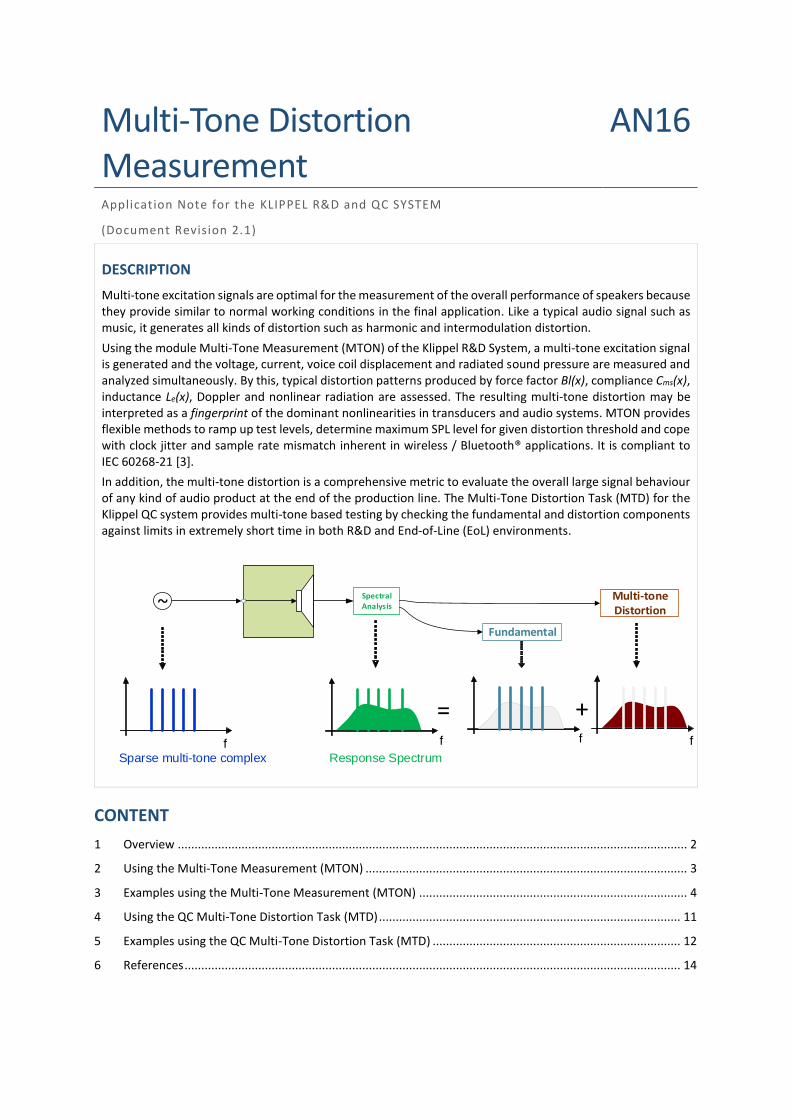
Multi-tone excitation signals are optimal for the measurement of the overall performance of speakers because they provide similar to normal working conditions in the final application. Like a typical audio signal such as music, it generates all kinds of distortion such as harmonic and intermodulation distortion.
Using the module Multi-Tone Measurement (MTON) of the Klippel R&D System, a multi-tone excitation signal is generated and the voltage, current, voice coil displacement and radiated sound pressure are measured and analyzed simultaneously. By this, typical distortion patterns produced by force factor Bl(x), compliance Cms(x), inductance Le(x), Doppler and nonlinear radiation are assessed. The resulting multi-tone distortion may be interpreted as a fingerprint of the dominant nonlinearities in transducers and audio systems. MTON provides flexible methods to ramp up test levels, determine maximum SPL level for given distortion threshold and cope with clock jitter and sample rate mismatch inherent in wireless / Bluetooth® applications. It is compliant to IEC 60268-21 [3].
In addition, the multi-tone distortion is a comprehensive metric to evaluate the overall large signal behaviour of any kind of audio product at the end of the production line. The Multi-Tone Distortion Task (MTD) for the Klippel QC system provides multi-tone based testing by checking the fundamental and distortion components against limits in extremely short time in both R&D and End-of-Line (EoL) environments.
SpectralAnalysis
Multi-toneDistortion
Fundamental
fSparse multi-tone complex
f
~
f f
= +
Response Spectrum
CONTENT
1 Overview ........................................................................................................................................................ 2
2 Using the Multi-Tone Measurement (MTON) ................................................................................................ 3
3 Examples using the Multi-Tone Measurement (MTON) ................................................................................ 4
4 Using the QC Multi-Tone Distortion Task (MTD) .......................................................................................... 11
5 Examples using the QC Multi-Tone Distortion Task (MTD) .......................................................................... 12
6 References .................................................................................................................................................... 14

Multi-Tone Distortion Measurement AN16
KLIPPEL Analyzer System Page 2 of 14
1 Overview
1.1 Measurement Principle
Stimulus signal A multi-tone signal is a steady-state signal comprising a multitude of tones generated at known frequencies. A logarithmic spacing of the tones is used typically. The number is usually limited to 3 – 12 tones per octave to ensure a sufficiently sparse excitation spec-trum for distortion analysis. The amplitude of the tones can be adjusted over frequency to represent a normal audio signal.
Measured signals For transducers and passive audio systems, it is very useful to measure not only the sound pressure output but also the voltage and current at the input terminals and the voice coil displacement, if accessible. The inspection of the voltage signal shows the distortion of the power amplifier used. The dominant nonlinearities such as Bl(x), Cms(x) and Le(x), Dop-pler Effect are directly related with the voice coil displacement. The comparison between the current and sound pressure spectrum allows identifying the root cause of distortion [1].
Spectral analysis The measured signals are subject to a FFT analysis. Since the multi-tone excitation signal has a sparse spectrum, the nonlinear distortion can be accessed at non-excited frequen-cies of the FFT spectrum.
Noise floor It is useful to perform an additional measurement without excitation to determine the magnitude of noise floor caused by external or internal sources. This helps to separate distortion and noise symptoms.
Working range The maximal peak to peak displacement of the voice coil indicates the mechanical work-ing range as the most important measurement condition. It is recommended to measure the rms value of the voltage and current at the terminals.
1.2 Multi-tone Measurement Results
Multi-tone funda-mental
The amplitude of the reproduced signal at the excited frequencies represents the funda-mental of the multi-tone spectrum.
Multi-tone distor-tion spectrum
The multi-tone distortion spectrum is represented by the spectral components which are not excited by the multi-tone stimulus.
Absolute multi-tone distortion
The multi-tone distortion spectrum can be reduced to band levels by integrating the en-ergy of the unexcited neighbouring frequency bands around the fundamental frequen-cies. This yields the absolute multi-tone distortion.
Relative multi-tone distortion
The relative multi-tone distortion is defined as the energy ratio of the integrated multi-tone distortion bands (absolute multi-tone distortion) and the fundamental components (multi-tone fundamental). It can be expressed in dB or %.
Total multi-tone distortion ratio
The total multi-tone distortion ratio is defined as a ratio of RMS value of the total multi-tone distortion spectrum and the RMS value of the total multi-tone fundamental. Con-trary to the previous results, the total multi-tone distortion ratio is a single value. It can be expressed in dB or %.
1.3 Interpretation
In broad-band signals like the multi-tone stimulus, the nonlinear distortion is generated by complicated inter-actions between all present fundamental components. Therefore, it is hardly possible to separate harmonic and intermodulation distortion. However, they are more like a nonlinear fingerprint of the speaker showing the real-life amplitude of the distortion in an audio-like signal.
The table below gives a summary of typical distortion root causes and their contribution in sound pressure and electrical input current for a common woofer system.

Multi-Tone Distortion Measurement AN16
KLIPPEL Analyzer System Page 3 of 14
DISTORTION OF A WOOFER SYSTEM
Current Spectrum Sound Pressure Spectrum
Nonlinearity f = fs fs < f < 10 fs f > 10 fs f = fs fs < f < 10 fs f > 10 fs
Force factor High Falling with f Small High High High
Compliance High Small Negligible High Small Negligible
Inductance Small High High Small High High
Doppler No No No Negligible Small High
Radiation No No No Negligible Small High
2 Using the Multi-Tone Measurement (MTON)
Test object Any transducer (woofer, tweeter, compression driver, micro-speaker) or audio system (powered, passive, Bluetooth®) may be measured
Setup An optional laser sensor can be directed to the vibrating diaphragm. A dot of white ink may be used to increase the signal to noise ratio of the measured displacement signal. For distortion measurement, the microphone should be in the near field to obtain high signal to noise ratio.
Put the test object in an approved test environment and connect the terminals with SP1. Switch the power amplifier between OUT1 and connector AMP. If KA3 device is used, configure the signal settings.
Requirements • Klippel Analyzer (KA3) or Distortion Analyzer (DA2)
• Software module Multi-Tone Measurements (MTON)
• Power amplifier or self-powered speaker
• Microphone
• Optional: laser sensor
• Optional: Pro Driver Stand or Micro speaker Clamping
Preparation • Open any database with dB-Lab or create a new one.
• Create a new MTON operation with default settings.
Measurement 1. Check the input configuration in parameter page Input / Processing. 2. Adjust the excitation level in the parameter page Stimulus, make sure the test
object is operated in the nonlinear domain generating noticeable distortion. 3. Start the measurement, take care to protect your ears. 4. Check acoustic distortion in result window In (f) Spectrum. Significant distortion
should be at least 10dB above measured noise floor. 5. When using laser sensor, read the working range (maximal displacement value
in the result window Table Results + Settings). 6. Evaluate the distortion of the amplifier in the result window U (f) Voltage Spec-
trum. For typical results see example below. 7. Evaluate the distortion from voice coil inductance Le(x) produced at high fre-
quencies in the result window I (f) Current Spectrum. For details, check refer-ence [1].
8. Compare the distortion in sound pressure and current at different frequencies to identify clues for the sources of distortion.

Multi-Tone Distortion Measurement AN16
KLIPPEL Analyzer System Page 4 of 14
3 Examples Using the Multi-Tone Measurement (MTON)
3.1 Single Measurement of a Woofer
Measurement Con-ditions
This example was measured in free air using the Pro Stand to obtain the multi-tone dis-tortion produced in voltage, current, pressure and displacement measurements.
Setup Multi-tone stimulus is defined as follows:
• Minimal Frequency: 20 Hz
• Maximal Frequency: 20 kHz
• Relative resolution: 10 lines per octave
• Signal duration: 1 second
• 5 V rms at speaker terminals
Results: U(f) Volt-age Spectrum
Open the result window U(f) Voltage Spectrum to assess the distortion produced by the power amplifier.
In this example the amplifier shows distortion at -60dB below fundamental which cor-responds to about 0.1%. This indicates a reliable, clean excitation signal.
The distortion is separated well from the noise floor which is even 20 dB lower over the full frequency band.
Results: IN(f) Input Spectrum
Open the result window IN(f) Spectrum to assess the spectrum in the radiated sound pressure signal.
The distance between fundamental component and distortion is almost constant. The distortion is around 20dB below the fundamental (10%), indicating strong nonlinear op-eration. The distortion is also well above noise floor, indicating reliable distortion meas-urement. For detailed interpretation and analysis of causes see reference [1].
KLIPPEL
-120
-110
-100
-90
-80
-70
-60
-50
-40
-30
-20
-10
0
20 50 100 200 500 1k 2k 5k 10k 20k
U(f) Spectrum
Vo
lta
ge
Le
vel / d
B (
re 1
V)
Frequency / Hz
Noise floor Fundamental, u = 5 V * Noise + Distortion, u = 5 V
KLIPPEL
-10
0
10
20
30
40
50
60
70
80
90
100
20 50 100 200 500 1k 2k 5k 10k 20k
IN(f) SpectrumMicrophone signal
So
un
d P
ressu
re L
eve
l / d
B (re
20
µP
a)
Frequency / Hz
Noise floor Fundamental, u = 5 V * Noise + Distortion, u = 5 V

Multi-Tone Distortion Measurement AN16
KLIPPEL Analyzer System Page 5 of 14
Results: X(f) Dis-placement Spec-trum
Open the result window X(f) Displacement Spectrum to assess the spectrum of the voice coil displacement.
Above the resonance frequency fs at 120 Hz the amplitude of the fundamental compo-nent decreases by 12 dB per octave typical for any electrodynamic loudspeaker. The resonance at 1 kHz may be a parasitic vibration such as a rocking mode.
Compared to In(f) Spectrum the fundamental to distortion ratio is similar. This indicates nonlinear mechanisms occurring already in the mechanical domain, typically Bl(x), Cms(x).
KLIPPEL
-110
-100
-90
-80
-70
-60
-50
-40
-30
-20
20 50 100 200 500 1k 2k 5k 10k 20k
X(f) Spectrumdisplacement
Dis
pla
ce
me
nt L
eve
l / d
B (re
1 m
m)
Frequency / Hz
Noise floor Fundamental, u = 5 V * Noise + Distortion, u = 5 V

Multi-Tone Distortion Measurement AN16
KLIPPEL Analyzer System Page 6 of 14
Results: I(f) Cur-rent Spectrum
Open the result window I(f) Current Spectrum to assess the spectrum of the input cur-rent.
The distortion close to the resonance frequency is mainly caused by the Bl(x) and Cms(x) nonlinearities. Off the resonance the fundamental to distortion ratio is about 40 dB. This indicates a minor contribution by the electrically relevant non-linearities such as Le(x) in this example.
Detailed analysis at high frequencies:
At high frequencies f > 10 kHz we see intermodulation distortion centred around the fundamental components. These are typical distortion from nonlinear inductance Le(x) caused by the interaction of the low-frequency components of the displacement signal x(t) and the high-frequency components in the current signal i(t). All distortion already generated and visible in input current will also show up in the sound pressure output signal.
KLIPPEL
-120
-110
-100
-90
-80
-70
-60
-50
-40
-30
-20
10 2 10 3 10 4
Spectrum of I (f)
[dB
] (0
dB
≡ 1
A)
Frequency [Hz]
Noise floor Fundamental, u = 5 V Noise + Distortion, u = 5 V
KLIPPEL
-120
-110
-100
-90
-80
-70
-60
-50
-40
-30
-20
16k 18k 20k
I(f) Spectrum
Cu
rre
nt L
eve
l / d
B (re
1 A
)
Frequency / Hz
Noise floor Fundamental, u = 5 V * Noise + Distortion, u = 5 V

Multi-Tone Distortion Measurement AN16
KLIPPEL Analyzer System Page 7 of 14
3.2 Multiple Measurements of a Passive System: Increase Voltage Protected by Multi-tone Distortion Limit
Measurement Con-ditions
A passive midrange speaker system is measured multiple times with iteratively in-creased stimulus voltage to obtain the maximum SPL limited by a certain, user defined multi-tone distortion. This measurement is useful to find the operation limits of a device under test and protecting it during the measurement sequence.
Setup Multi-tone stimulus is defined as follows:
• Minimal Frequency: 100 Hz
• Maximal Frequency: 20 kHz
• Relative resolution: 12 lines per octave
• Signal duration: 1 second
Measurement sequence:
• Minimum (start) Voltage: 0.5 V
• Maximum Voltage: 5 V
• Voltage step size: 0.25 V
• Pause between measurements: 10 s (for cooling)
Multi-tone distortion limit:
• Applied at microphone signal
• Max relative MD limit: -20 dB in the frequency band [100, 10k] Hz
• Max total MD ratio limit: -20 dB
Results: Multi-Tone Fundamental and Absolute Dis-tortion
Open the result window Multi-Tone Response where the fundamental and absolute dis-tortion multi-tone curves are displayed.
The difference between the fundamental and the distortion curves decreases at higher voltages, where the speaker nonlinearities produce more distortion.
KLIPPEL
20
30
40
50
60
70
80
90
100
110
100 200 500 1k 2k 5k 10k 20k
Multi-Tone Responseref: IN(f)
So
un
d P
ressu
re L
eve
l / d
B (re
20
µP
a)
Frequency / Hz
Fund 0.5 V MD 0.5 V Noise Floor Fund 1.5 V MD 1.5 V
Fund 2.5 V MD 2.5 V Fund 3.5 V MD 3.5 V Fund 4.5 V
MD 4.5 V Fund 4.75 V MD 4.75 V

Multi-Tone Distortion Measurement AN16
KLIPPEL Analyzer System Page 8 of 14
Results: Relative Multi-Tone Distor-tion
Open the result window Multi-Tone Distortion, where the multi-tone distortion curves relative to the multi-tone fundamentals are displayed.
The sequence is stopped at 4.75 V, since the multi-tone distortion limit set at -20 dB is reached at 550 Hz and 6 kHz (red curve). The distortion results are valid at all frequen-cies since the noise floor is exceeded significantly by more than 20 dB.
Results: Max. rela-tive Multi-Tone Distortion
Open the result window Max Relative MD vs Step to track the peak multi-tone distortion progression.
The peak distortion measured at each step is displayed versus the stimulus voltage. This curve provides a simple tracking of the relative multi-tone distortion across the meas-urement sequence.
KLIPPEL
-80
-70
-60
-50
-40
-30
-20
100 200 500 1k 2k 5k 10k 20k
MD relative to Fundamentalref: IN(f)
Mu
lti-
To
ne
Dis
tort
ion
/ d
B
Frequency / Hz
RMD limit 0.5 V Noise Floor 1.5 V 2.5 V
3.5 V 4.5 V 4.75 V
KLIPPEL
-34
-32
-30
-28
-26
-24
-22
-20
0,5 1,0 1,5 2,0 2,5 3,0 3,5 4,0 4,5
Max Relative MD vs Stepref: IN(f)
Re
lative
MD
/ d
B
Voltage / V
Max Relative MD

Multi-Tone Distortion Measurement AN16
KLIPPEL Analyzer System Page 9 of 14
Results: Total Multi-tone Distor-tion Ratio
Open the result window Total MD Ratio vs Step to track the total multi-tone distortion ratio develop.
The total multi-tone distortion ratio is the ratio between the fundamental energy and the energy measured in the non-excited residual spectrum. As expected, the TMDR in-creases at higher excitation voltage, since more distortion is generated. However, an unexpected peak is measured at U = 2 V, which is produced by an external noise centred in the low frequency band (around 40 Hz). This noise does not affect the relative multi-tone distortion, since it was produced out of the frequency range of stimulus (100 Hz, 20 kHz).
Results: Table of Single Values
Open the window Table Detailed Results, where all the result values of every measure-ment step are summarized in a table.
This table collects the peak values of the absolute and relative multi-tone distortion as well as the total multi-tone distortion ratio among others.
KLIPPEL
-38
-36
-34
-32
-30
-28
-26
-24
0,5 1,0 1,5 2,0 2,5 3,0 3,5 4,0 4,5
Total MD Ratio vs Stepref: IN(f)
To
tal M
D R
atio
/ d
B
Voltage / V
Total MD Ratio
Multi-Tone Distortion Measurement AN16
KLIPPEL Analyzer System Page 10 of 14
3.3 Wireless Speaker Measurement
Measurement Con-ditions
Bluetooth® or digital audio devices require a special measurement configuration, since the particularities of wireless and digital audio transmission such as long delays and clock mismatch or drift cause several problems in the measurement. A complete de-scription of the measurements with Bluetooth® devices is available in the application note AN72 “Testing Wireless Audio Devices”.
A Bluetooth® device is measured with and without clock drift tolerance to reveal the differences between both processing modes.
Setup Multi-tone stimulus is defined as follows:
• Minimal Frequency: 20 Hz
• Maximal Frequency: 20 kHz
• Relative resolution: 10 lines per octave
• Signal duration: 1 second
• 0.1 V rms at Bluetooth® speaker input
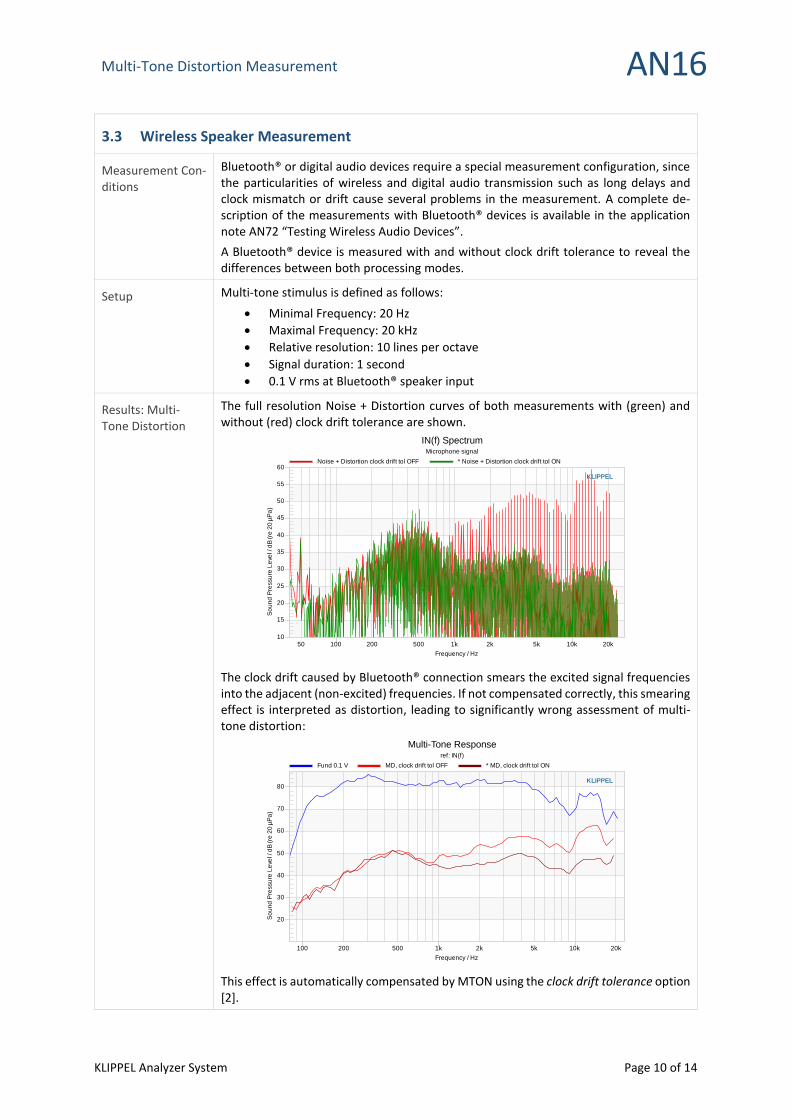
Results: Multi-Tone Distortion
The full resolution Noise + Distortion curves of both measurements with (green) and without (red) clock drift tolerance are shown.
The clock drift caused by Bluetooth® connection smears the excited signal frequencies into the adjacent (non-excited) frequencies. If not compensated correctly, this smearing effect is interpreted as distortion, leading to significantly wrong assessment of multi-tone distortion:
This effect is automatically compensated by MTON using the clock drift tolerance option [2].
KLIPPEL
10
15
20
25
30
35
40
45
50
55
60
50 100 200 500 1k 2k 5k 10k 20k
IN(f) SpectrumMicrophone signal
So
un
d P
ressu
re L
eve
l / d
B (re
20
µP
a)
Frequency / Hz
Noise + Distortion clock drift tol OFF * Noise + Distortion clock drift tol ON
KLIPPEL
20
30
40
50
60
70
80
100 200 500 1k 2k 5k 10k 20k
Multi-Tone Responseref: IN(f)
So
un
d P
ressu
re L
eve
l / d
B (re
20
µP
a)
Frequency / Hz
Fund 0.1 V MD, clock drift tol OFF * MD, clock drift tol ON

Multi-Tone Distortion Measurement AN16
KLIPPEL Analyzer System Page 11 of 14
4 Using the QC Multi-Tone Distortion Task (MTD)
Target Any transducer (woofer, tweeter, compression driver, micro-speaker) or audio system (powered, passive) may be measured
Requirements • Analyzer device o Klippel Analyzer (KA3) o Production Analyzer (PA) o 3rd party audio interface sound card)
• Multi-Tone Distortion (MTD) task license
• Power amplifier (opt.)
• Microphone
• Test enclosure (recommended)
Preparation • KLIPPEL QC Software distribution: o Open Klippel QC Start – Engineer. o Create a new empty test or select a suitable test template that includes MTD
(System category). o Open the new test by clicking on Measure.
• KLIPPEL RnD Software distribution: o Create a new QC operation based on the template QC Multi-tone Distortion
(MTD). o Start the QC Operation (Login).
Measurement 1. Check the excitation level, frequency range, resolution and duration of stimulus. 2. Check the routing configuration. 3. Run the test (Start button), take care to protect your ears. 4. Check the multi-tone fundamental in the result window Multi-Tone Response
and the relative multi-tone distortion in the result window Distortion. 5. Check the signal characteristics in the result window Summary.

Multi-Tone Distortion Measurement AN16
KLIPPEL Analyzer System Page 12 of 14
5 Examples Using the QC Multi-Tone Distortion Task (MTD)
5.1 Passive Midrange Speaker
Measurement Con-ditions
A passive midrange speaker is measured at the end of the assembly line to test if its multi-tone spectrum and distortion are within the limits defined previously by measur-ing approved reference units.
This example is using identical conditions and test object as the MTON example de-scribed in chapter 3.2. For typical EoL test applications, a test enclosure is highly recom-mended to shield ambient nosie disturbance.
Setup The multi-tone stimulus is defined according the single measurement example de-scribed in chapter 3.2:
• Minimal Frequency: 100 Hz
• Maximal Frequency: 20 kHz
• Relative resolution: 12 lines per octave
• Signal duration: 1 second
• 4.5 V rms at speaker terminals (max. voltage determined by MTON before reaching distortion limit)
Results: Multi-tone fundamental and distortion curves
The multi-tone fundamental spectrum is displayed in the result window Multi-tone Re-sponse.
The spectrum of the relative multi-tone distortion is displayed together with the relative noise floor in the result window Distortion.
KLIPPEL
70
75
80
85
90
95
100
105
110
100 200 500 1k 2k 5k 10k 20k
Multi-Tone Response
So
un
d P
ressu
re L
eve
l / d
B (
re 2
0 u
Pa
)
Frequency / Hz
Fundamental Spectrum
KLIPPEL
-80
-70
-60
-50
-40
-30
-20
100 200 500 1k 2k 5k 10k 20k
Dis
tort
ion
Le
vel / d
B
Frequency / Hz
Relative Multi-Tone Distortion Relative Noise Floor (MTD)

Multi-Tone Distortion Measurement AN16
KLIPPEL Analyzer System Page 13 of 14
The multi-tone spectrum (blue) and distortion (brown) re-sults are displayed together with the defined limits (dotted lines). Since both metrics are within the boundaries of the valid range, the DUT has passed the test.
Comparison MTON vs. MTD
The results of the MTD measurement and the last passed measurement in MTON oper-ation described in chapter 3.2 are displayed together to be compared.
Since both measurements are configured using the same setup, the multi-tone funda-mental spectrums (green curve: MTON, blue dashed line: MTD) and relative distortion curves (green curve: MTON, brown dashed line: MTD) are identical.
KLIPPEL
10
20
30
40
50
60
70
80
90
100
110
100 200 500 1k 2k 5k 10k 20k
Multi-Tone Responseref: IN(f)
So
un
d P
ressu
re L
eve
l / d
B (re
20
µP
a)
Frequency / Hz
MTON Fund 4.5 V MTON MD 4.5 V Noise Floor
* QC MTD - Fundamental Spectrum
KLIPPEL
-80
-70
-60
-50
-40
-30
-20
100 200 500 1k 2k 5k 10k 20k
MD relative to Fundamentalref: IN(f)
Mu
lti-
To
ne
Dis
tort
ion
/ d
B
Frequency / Hz
MTON RMD limit MTON Relative Multi-tone Distortion Noise Floor
* QC MTD - Relative Multi-Tone Distortion

Multi-Tone Distortion Measurement AN16
KLIPPEL Analyzer System Page 14 of 14
6 References
6.1 Related Modules Multi-Tone Measurement (MTON)
Multi-Tone Distortion Task (MTD)
6.2 Application notes AN72: Testing wireless audio devices with Klippel R&D System
6.3 Specifications A5: Professional Driver Stand
A10: Micro Speaker Clamping
S64: MTON Multi-Tone Measurement
S68: QC – Multi-Tone Distortion Task
6.4 Publications [1] W. Klippel: Physical and Perceptual Evaluation of Electric Guitar Loud-speakers
[2] A. Taylor, “Mastering Wireless Multi-Tone Testing”
6.5 Standards [3] IEC 60268-21 – Sound System Equipment – Acoustical (output-based) measurements
6.6 Web-Seminars Series 1, #7: Amplitude Compression – Less Output at Higher Amplitudes
Series 1, #11: Pitfalls in Testing Wireless Audio Devices
Find explanations for symbols at:
http://www.klippel.de/know-how/literature.html
Last updated: November 09, 2021
Designs and specifications are subject to change without notice due to modifications or improvements.