spatial analysis of indian railways - geospatial...
TRANSCRIPT

Spatial Analysis of Indian Railways
Rajesh Chaturvedi Kshitij Mishra K S Rajan P Rama Chandra Prasad

Railway is the biggest public sector of India.
We need a platform for analyzing rapid advancements.
Some tool that can affect our policy making.
Moreover
Country growth is a direct consequence of transport development.
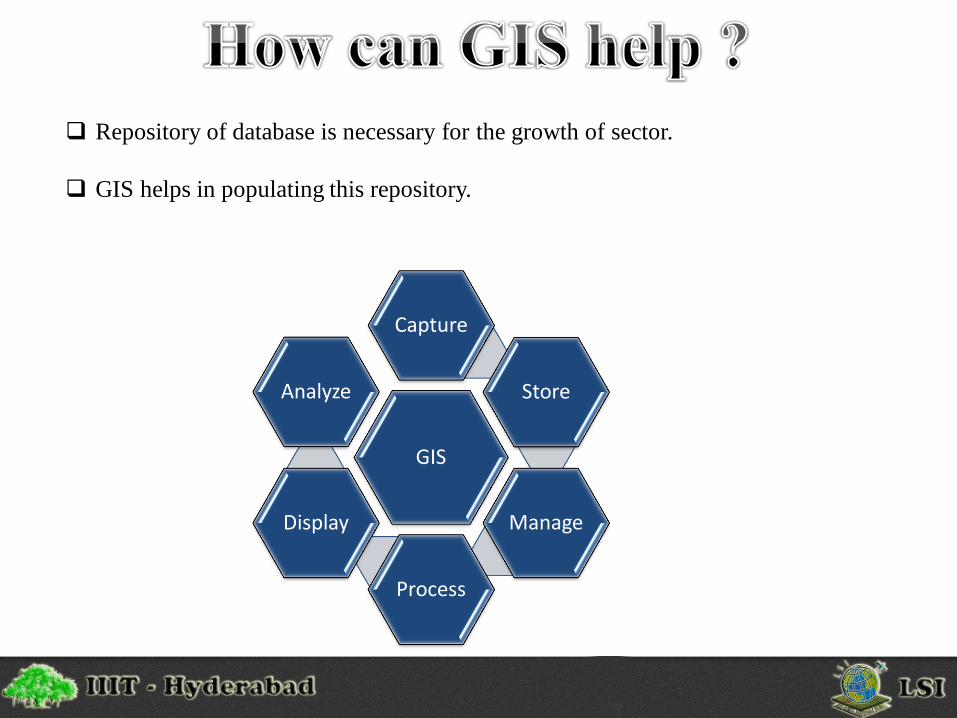
Repository of database is necessary for the growth of sector.
GIS helps in populating this repository.
GIS
Capture
Store
Manage
Process
Display
Analyze
Our Objectives
Budget analysis of an entire decade.
Creation of open access repositories for conducting the
spatial analysis.
Major disasters analysis : Places and patterns.
Data
Railway budgets for financial years 2000 to 2009.
Official Data
Height variations data for various districts of the states.
List of the major rail accidents over last decade

Workflow

Development of Repository
Using open source library GDAL and its OGR toolkit
Over a district-wise geo-referenced map of India in form of Shape (.shp) files.
District -> Polygon
Railway lines -> Lines
Railway Station -> Point
Centroid of Polygon : int OGRGeometry::Centroid (OGRPoint * poPoint ) const [virtual]
Lines : OGRLineString ()
Vertex point : Void setPoint (int, OGRPoint *)

Electrified Routes

Work in Progress
Limitation:
This only looks at the district level
information and overlooks the sub district
stations that come in the network.
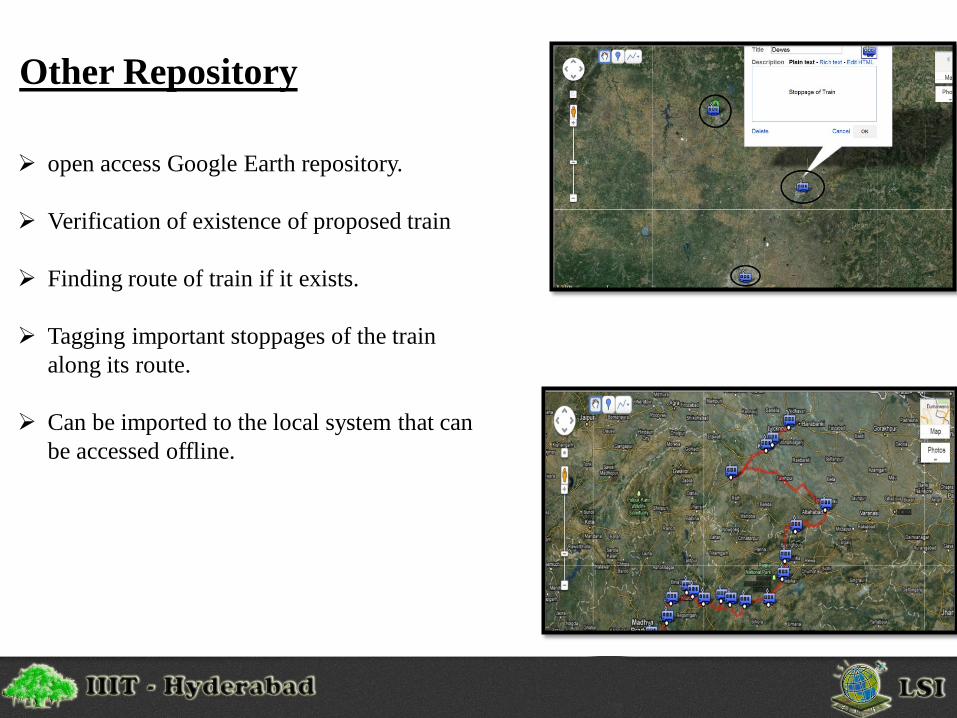
Other Repository
open access Google Earth repository.
Verification of existence of proposed train
Finding route of train if it exists.
Tagging important stoppages of the train
along its route.
Can be imported to the local system that can
be accessed offline.
Limitation:
It does not follow the actual railroads rather the road transit system which is assumed to be parallel to the rail network and thus solving the purpose.
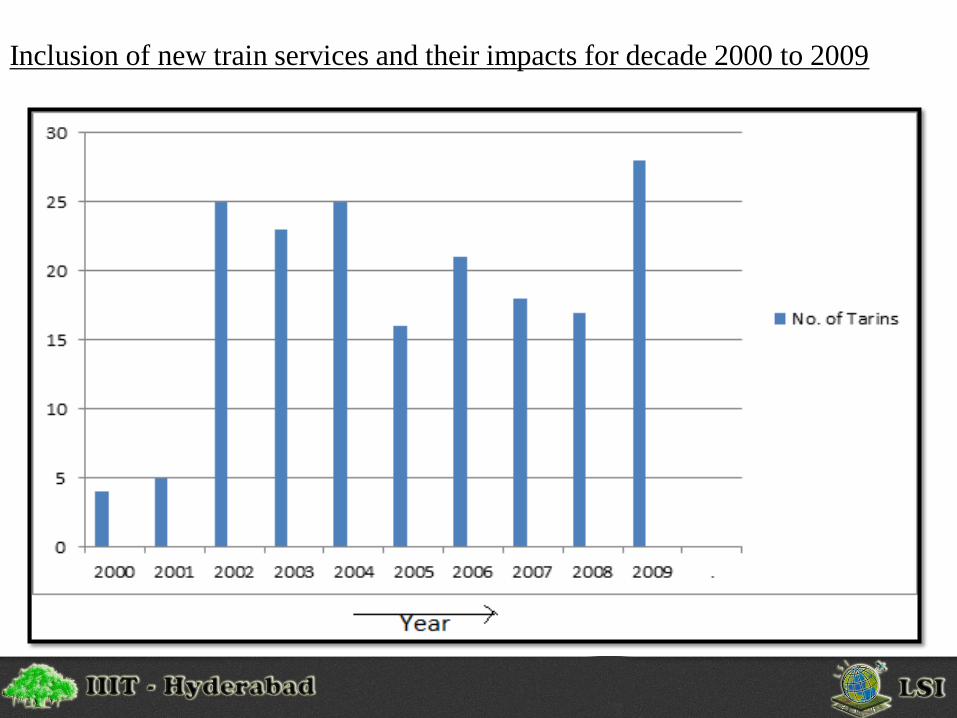
Inclusion of new train services and their impacts for decade 2000 to 2009

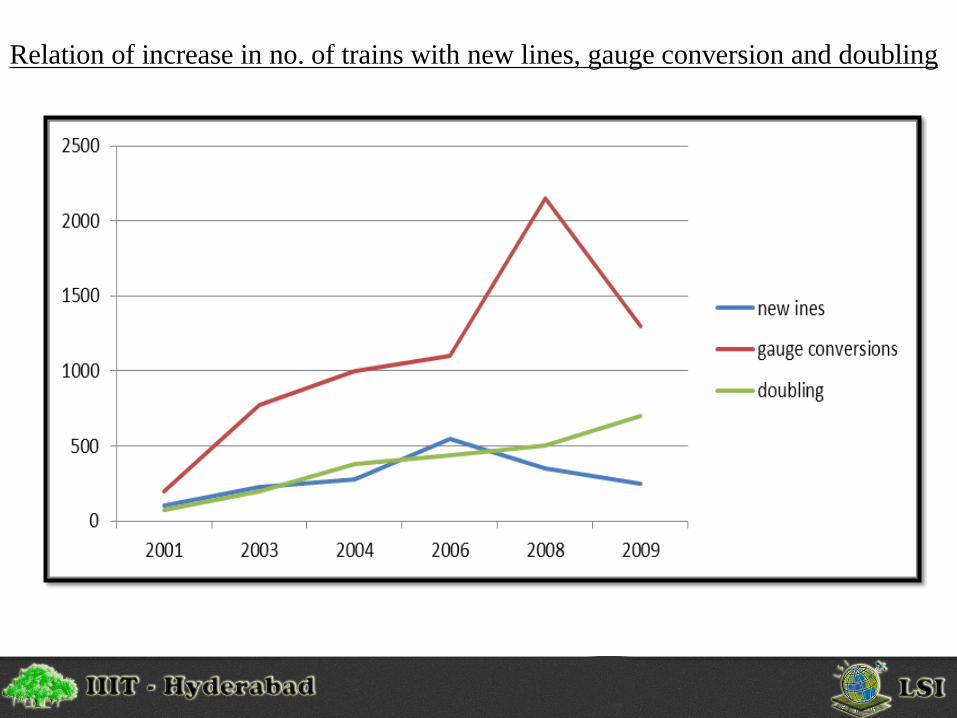
Relation of increase in no. of trains with new lines, gauge conversion and doubling

State wise distribution of electrified network
0
10
20
30
40
50
60
70
80
90
100
Percentage of Electrified Route
Length(Km)/100
States
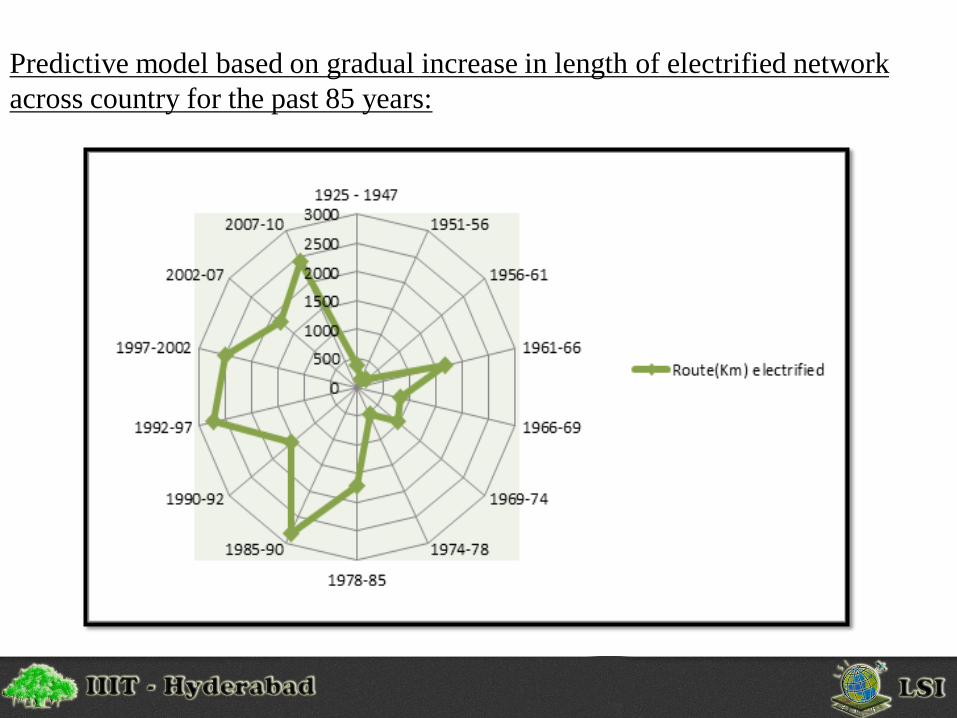
Predictive model based on gradual increase in length of electrified network
across country for the past 85 years:

Topographic limitations in specific regions of India:

Limitations of railways in Jammu and Kashmir due to variation of heights:
• Rajouri 1000 m to 2000 m
• Poonch 1000 m to 2000 m
• Udhampur 600 m to 3000 m (Only One Line)
• Kulgam 1000 m to 1700 m
• Budgam 2400 m to 4000 m (Only One Line)
• Ganderbal 1600 m to 3000 m
• Baramulla 3500 m to 5000 m
• Kupwara 4000 m to 5300 m
• Kargil 4500 m to 5500 m

o Variation in height = 2000m
o Distance = 100km
o Slope = Height/Distance
o Slope =1/50
In the extreme cases the value of tangent of angle reaches 1/20 and it is not only
difficult but impossible to grant a permit to establish rail network in such regions.

Repository of Rail accidents :
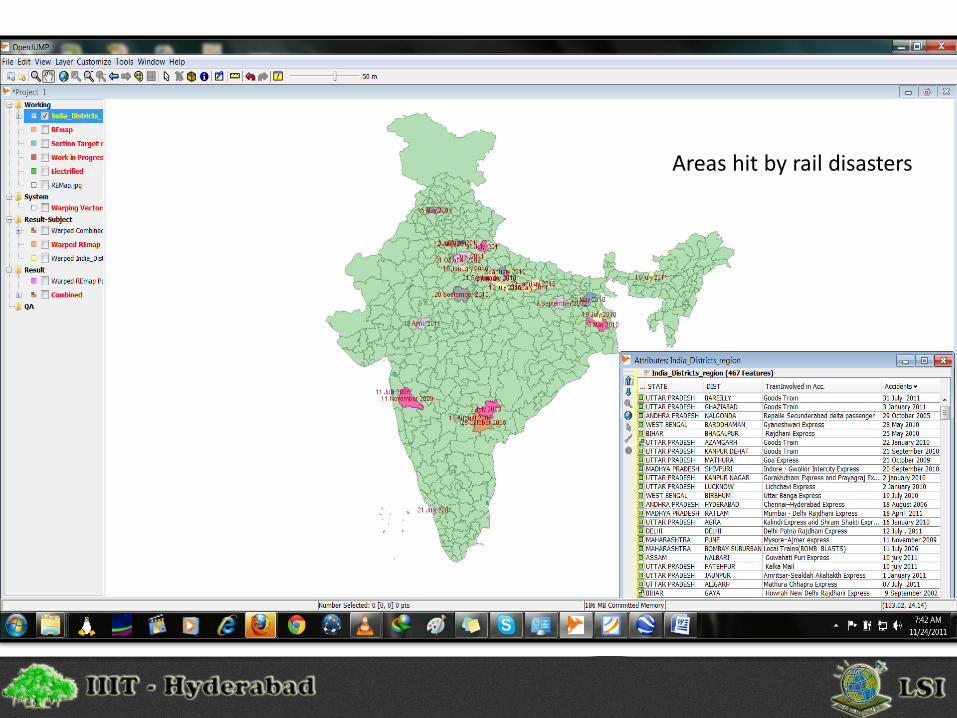
Areas hit by rail disasters

Reasons for the sudden shoot might be:
• introduction of large number of trains in year 2002
• heavy traffic on nearly the same length of route length

Climatic Analysis on major accidents:
Frequency of rail disasters is more in the months of winter or monsoon the
reasons cited are :
o Dense fogs in the northern parts of the country.
o Heavy rainfall causing damage to machinery and flooding of tracks
Both of these cause mismanagement and difficulty in operations of signals and
instructions to the rail drivers.

Conclusions:
Visualization of Indian Railways has been made very effective through the integration of geospatial technology in data storage
Existing schematic view of Indian railways that displays just the network without any
coordinates attached to the nodes and edges.
The Budget Viewer gives the user a better insight of the works done during the year.
GIS has brought a transparency in the management and functioning of works in the sector.
For Government it serves for Policy making and for end user Decision making.

Future Work
Sharing of the repository information through the development of a web
portal assisted with a feedback system
A query based applications for users to fetch information of their use from
the large pool of data. The essence of feedback systems is from usability perspective of the stakeholder, this feedback
information may be anything – the type of data that user frequently visits, the design of elements,
the query result format and what not.

Thanks