spatial analysis of solar potential in sydney -...
TRANSCRIPT
1|Page
SpatialAnalysisofSolarPotentialinSydneyPreparedfortheAustralianPVInstitutebyJessieCopper,MikeRobertsandAnnaBruce,UNSWSydney-April2017
Summary
There is significant potential for rooftop solar PV in Australia. Rooftop solar PV is a key energytechnology because it is leading the transition to consumer uptake of low-carbon demand-sideenergy technologies, which are providing new opportunities for consumer engagement and newcleanenergybusinessmodelstoemerge.However,thereisalackofgoodinformationinthepublicdomainabout thepotential for rooftop solar to contribute to low-carbonelectricity generation inAustralia’s cities. This type of information is important for policymakers and planners, and toencouragepublicsupportforrooftopsolar.
This research uses the data and methodologies behind the APVI Solar Potential Tool http://pv-map.apvi.org.au/potential,developedbyresearchersatUNSW,toestimatetheSolarPotentialintheSydneyCBD.Thereportincludes:
1. AnassessmentofPVPotentialinSydneyCBD(boundedbytheCityofSydneyLGA)2. AnestimateofthepotentialimpactofrooftopPVonlocalelectricityconsumptionandemissions3. IdentificationofrooftopswiththelargestPVpotential(areaavailable)intheCBD4. ThreecasestudiesofPVPotentialonlandmarkbuildingsinSydney
The useable area suitable for PV deployment across Sydney’s CBD (City of Sydney LGA) wascalculatedusing twodifferentmethods.Themost conservativeestimateof the twosuggests theuseablearea suitable for rooftopPVdeployment (the ratiobetween theareaofPVpanels thatcouldbeaccommodatedandthetotalroofarea)is25%correspondingto393MWofPVpotentialwithanexpectedannual yieldof507GWh.TheequivalentCO2emission savingsare403ktperyear.
Theaverageofthetwomethodsindicatedthatanareaequalto40%oftheavailableroofsurfacescould be used to accommodate PV, corresponding to 619 MW of potential PV capacity with anexpectedannualyieldof777GWh.Thisequatesto22%ofthe3,588GWhof loadintheCBD.Thepotential CO2-equivalent emission savings from PV based on the average of the two PV potentialestimationmethods are 618 kt per year. There is an estimated 6.7MWof existing PV capacityinstalledonrooftopsintheCityofSydneyLGA,around1%ofthepotentialcapacity.Almostalloftheelectricitygenerationandemissionssavingscalculatedwouldthereforebeadditional.
ThebreakdownacrossdifferentsuburbsisshowninTable1below.

2|Page
Table1:Summaryofresultscategorisedbysuburb
SydneyCitySuburbsPVCapacity(MW) PVYield(GWh)
Average AverageAll 619.25 777.12Alexandria 109.57 143.39Annandale 6.40 8.01Barangaroo 0.27 0.34Beaconsfield 4.84 6.05Camperdown 20.59 25.53CentennialPark 3.64 4.45Chippendale 10.54 13.02Darlinghurst 19.55 23.85Darlington 8.15 10.22DawesPoint 1.21 1.45Eastlakes 3.15 3.99Edgecliff 0.02 0.03ElizabethBay 6.46 7.98Erskineville 18.21 22.89Eveleigh 9.23 11.46ForestLodge 7.92 9.79Glebe 24.50 30.08Haymarket 12.11 14.90Kensington 4.83 5.88Kingsford 0.03 0.04Mascot 11.01 14.29MillersPoint 3.52 4.24MoorePark 15.98 20.37Newtown 18.60 22.80Paddington 14.31 17.45PortJackson 1.58 1.91PottsPoint 12.96 16.00Pyrmont 21.54 26.69Redfern 25.94 31.82Rosebery 47.40 60.08RushcuttersBay 2.34 2.88StPeters 12.09 15.73SurryHills 30.65 37.67SydneyCBD 47.52 57.57TheRocks 3.41 4.19Ultimo 18.16 22.59Waterloo 33.10 42.10Woollahra 0.46 0.56Woolloomooloo 9.14 11.08Zetland 18.32 23.77

3|Page
The rooftops with the largest PV potential in Sydney have beenmapped (Figure 1 below).MoredetailedimagesappearinAppendixC.
large-med-smallFigure1:RooftopswithLargestPVPotentialinSydneyCBD

4|Page
Case studies of specific landmark buildings including the Art Gallery of New South Wales, theOverseasPassengerTerminal(OPT)atCircularQuayandCentralStationhavebeenconducted.
Table2basedonthedataandvisual imageryavailableshowsthatanareaequivalent to justoverhalfthebuildingfootprintofthe3buildingsissuitableforPVarrays. BothCentralStationandtheOverseas Passenger Terminal (OPT) have large areas of uncluttered and unshaded roof (althoughpartoftheOPT’sfootprintconsistsofroadway,reducingthe%usableforPV),whiletheArtGallery’sirregularroofprofilehasasmallerbutsignificantusableproportion.
Table2:Potentialproductiveroofarea
SiteBuildingFootprint
(m2)ArrayArea
(m2)ArrayArea/RoofArea
CentralStation 31403 19600 62%
ArtGalleryNSW 8456 3158.4 37%OPT 5760 2420.8 42%
Table3showsthearraycapacityandexpectedannualenergyproductionforthepotentialPVarraysillustratedinFigure2-Figure4.
Table3:PVCapacityandAnnualEnergyProduction
Site PVCapacity
AnnualEnergyProduction(w/o
shading)
AverageYieldperkWPVinstalled
AnnualEnergyProduction(adjusted)
(kWpeak) (MWh/year) (kWh/kW/day) (MWh/year)
CentralStation 3063 3902 3.49 3599ArtGalleryNSW 494 642 3.56 589OPT 378 476 3.45 461
Table4presentstheestimatedcarbonoffsetsforeachsystemandshowsthatthesethreebuildingscould save an estimated 3.7 kilotonnes of carbon emissions each year and could supply theequivalentof691households,basedontheaverage2014electricitydemandofaNewSouthWaleshousehold(in2014)being6730kWh[1].
Table4:Carbonoffsetandhouseholdenergyequivalents
Site ExpectedAnnualEnergyProduction EmissionsOffset AverageNSW
householdequivalent
(MWh/year) (TonnesCO2-e/year) CentralStation 3599 2861 535
ArtGalleryNSW 589 468 87
OPT 461 366 68
Totals 4648 3695 691
5|Page
ArrayIllustrations
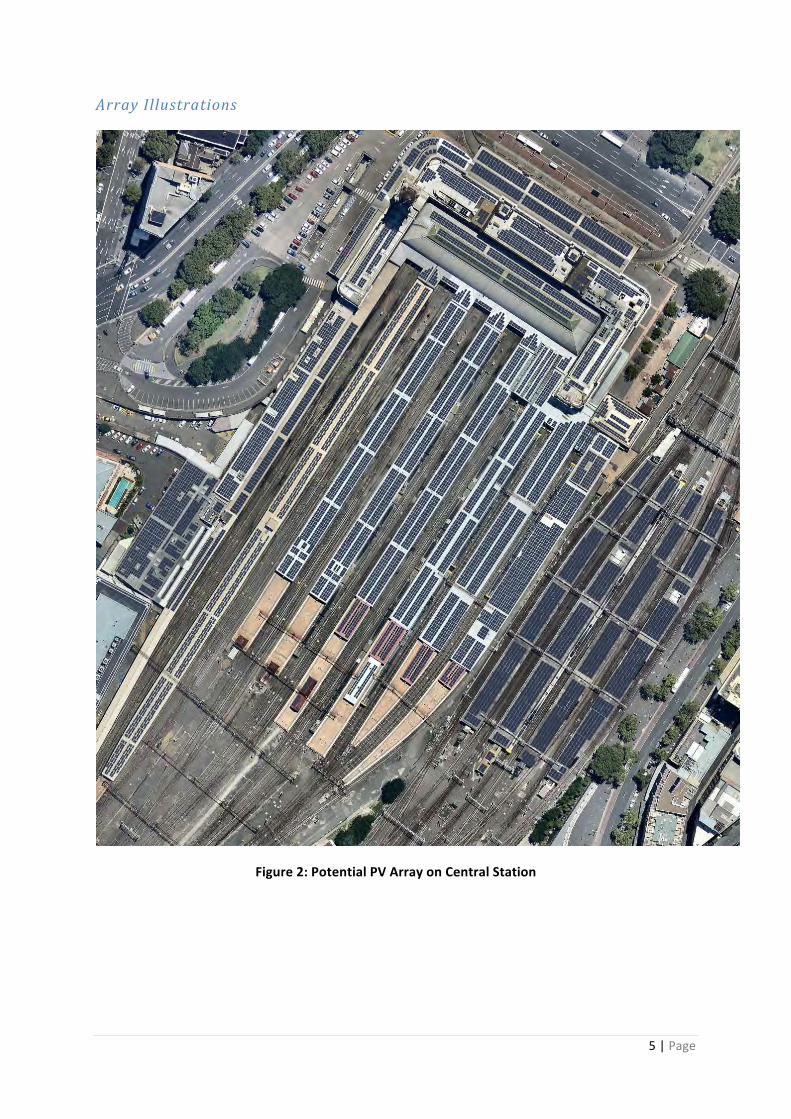
Figure2:PotentialPVArrayonCentralStation

6|Page
Figure3:PotentialPVArrayontheOverseasPassengerTerminal

7|Page
Figure4:PotentialPVArrayontheArtGalleryofNSW

8|Page
IntroductiontotheSolarPotentialTool
TheAPVISolarPotentialTool(SPT)isanonlinetooltoallowelectricityconsumers,solarbusinesses,plannersandpolicymakers toestimatethepotential forelectricitygeneration fromPVonbuildingroofs.Thetoolaccountsforsolarradiationandweatheratthesite;PVsystemarea,tilt,orientation;andshadingfromnearbybuildingsandvegetation.
ThedatabehindtheAPVISPTweregeneratedasfollows:
1. Three typesofdigital surfacesmodels (DSMs)1 (3Dbuildingmodels,XYZvegetationpointsand1mESRIGrids),suppliedbygeospatialcompanyAAM,wereusedtomodelthebuildingsandvegetationintheareascoveredbythemap.
2. TheseDSMswereusedasinputtoESRI’sArcGIStooltoevaluatesurfacetilt,orientationandtheannualandmonthlylevelsofsolarinsolationfallingoneach1m2unitofsurface.
3. Insolation values output by the ArcGIS model were calibrated2 to Typical MeteorologicalYear(TMY)weatherfilesforeachofthecapitalcitiesandagainstestimatesofinsolationatevery1degreetiltandorientationfromNREL’sSystemAdvisorModel(SAM).
Atacitylevel,aninsolationheatmaplayer(Figure5b)allowsidentificationofthebestroofs,whiletheshadowlayer(Figure5c)allowstheusertolocateanunshadedareaonarooftop.Onaspecificroofsurface,anestimateofannualelectricitygeneration,financialsavingsandemissionsoffsetfrominstallingsolarPVcanbeobtained.
Figure5:(a)Aerialphotograph(b)Insolationheatmap,(c)Wintershadowlayer
ThisprojectexpandedthedataandmethodologiesbehindtheSolarPotential inordertoestimatetheSolarPotentialintheSydneyCBDregion.
1 Digital surface models provide information about the earth’s surface and the height of objects. 3Dbuildingmodelsandvegetationsurfacemodelshavebeenusedinthiswork.TheESRIGridisaGISrasterfileformatdevelopedbyESRI,usedtodefinegeographicgridspace.2 Calibration was required in order to obtain good agreement NREL’s well-tested SAM model andmeasuredPVdata.
9|Page
AssessmentofthePVPotentialinSydneyCBD
Thissectionof thereportdetails themethodologyandtheresultsof thegeospatialanalysisofPVpotentialacrossSydneyCBD.
Methodology
TheassessmentofthePVpotentialinSydney’sCBD,expandedontheinitialworkundertakenfortheSydneyregionofAPVI’sSPT.Theanalysismadeuseofthefollowingdatasources:
1. ThethreesourcesofinputDSMsdatafromAAM;and2. NSW LPI LiDAR data for Sydney North – 2013 dataset sourced NSW Land and Property
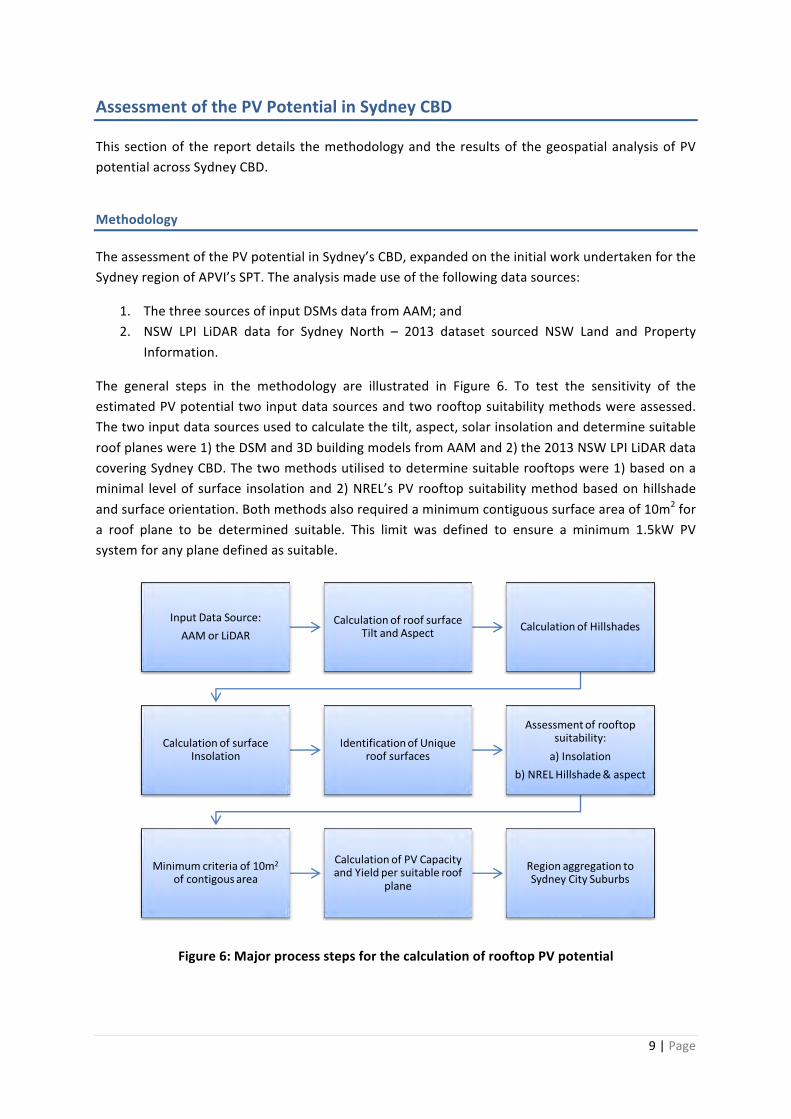
Information.
The general steps in the methodology are illustrated in Figure 6. To test the sensitivity of theestimatedPVpotentialtwoinputdatasourcesandtworooftopsuitabilitymethodswereassessed.Thetwoinputdatasourcesusedtocalculatethetilt,aspect,solarinsolationanddeterminesuitableroofplaneswere1)theDSMand3DbuildingmodelsfromAAMand2)the2013NSWLPILiDARdatacoveringSydneyCBD.Thetwomethodsutilisedtodeterminesuitablerooftopswere1)basedonaminimal levelof surface insolationand2)NREL’sPVrooftopsuitabilitymethodbasedonhillshadeandsurfaceorientation.Bothmethodsalsorequiredaminimumcontiguoussurfaceareaof10m2fora roof plane to be determined suitable. This limit was defined to ensure a minimum 1.5kW PVsystemforanyplanedefinedassuitable.
Figure6:MajorprocessstepsforthecalculationofrooftopPVpotential
InputDataSource:AAMorLiDAR
CalculationofroofsurfaceTiltandAspect CalculationofHillshades
CalculationofsurfaceInsolation
IdentificationofUniqueroofsurfaces
Assessmentofrooftopsuitability:a)Insolation
b)NRELHillshade&aspect
Minimumcriteriaof10m2
ofcontigousarea
CalculationofPVCapacityandYieldpersuitableroof
plane
RegionaggregationtoSydneyCitySuburbs

10|Page
The regions covered by the analysis and the relevant suburbs used to classify the PV potentialopportunitiesareshowninFigure7.
Figure7:SydneyCBDRegionsCoveredbyAnalysis

11|Page
AssessmentofRooftopSuitability-Methods
Method1:InsolationLimit
The first method utilised to determine suitable roof planes was based on a minimum level ofinsolation.Theminimumvaluewas setatanannualaverage insolationof3.62kWh/m2/day. Thislimit was calculated as 80% of the expected level of annual insolation for a horizontal surface inSydney, calculated as 4.53 kWh/m2/day, using the default TMYweather file for Sydney containedwithintheNationalRenewableEnergyLaboratories(NREL)SystemAdvisorModel(SAM).This limitwas applied to the Solar InsolationHeatMapwhichwas developed and calibrated as part of theAPVISPTmethodology[2,3].
Figure9presentsanexampleapplicationoftheinsolationlimitinpractice,displayinganaerialimage(left),theinsolationheatmap(centre)andtheclassifiedinsolationlayer(right);classifiedaseitherabove (white) or below (black) the insolation limit. As for each method in this report, a 10m2contiguousareawasrequiredforaroofplanetobedeterminedsuitable.Figure10presentstheroofplanes thatwere identified tomeetboth the insolationand10m2 contiguousarea criteria for theexamplepresentedinFigure9.
Figure8-Minimumdistancefromrooftopobstructionfor80%annualoutput
Figure9:ExampleapplicationoftheInsolationlimit.Arealimage(left);Insolationheatmap
(centre);andclassifiedInsolationlayer(right)
Figure10:Exampleapplicationofsuitableplanes(hatchedareas)bytheInsolationlimitmethod.

12|Page
Method2:NREL’sHillshadeandOrientation
ThesecondmethodutilisedtodeterminesuitableroofplaneswasthemethoddevelopedbyNRELtoassessthetechnicalpotentialforrooftopPVintheUnitedStates[4].NREL’smethodmakesuseofArcGIS’shillshade function todeterminethenumberofhoursof sunlight receivedoneach1m2ofroofsurface,across4representativedayswithinayeari.e.thewinterandsummersolsticesandthetwoequinoxes;similartotheshadowlayersofAPVI’sSPTasillustratedinFigure5.
Todeterminewhichareasmettheshadingcriteria,NREL’smethoddefinesthatroofsurfacesmustmeet a minimum number of hours of sunlight. The limit for any location can be determined bycalculating the number of hours a rooftop would need to be in sunlight to produce 80% of theenergyproducedbyanunshadedsystemofthesameorientation[4].ForthelocationofSydney,thevaluewas determined to be19.58 hours across the 4 representative days, i.e. aminimumof 4.9hrs/dayofsunlightacrosstheyear.
Inadditiontothehillshadelimit,NREL’smethodalsoexcludesroofplanesbasedonorientation.InNREL’s method all roof planes facing northwest through northeast (i.e. 292.5 - 67.5 degrees fornorthern hemisphere locations) were considered unsuitable for PV. For southern hemispherelocationstheequivalentexclusionwouldbeorientationssoutheastthroughsouthwest(i.e.112.5–247.5degrees)asperFigure11.Againasforeachmethodinthisreport,a10m2contiguousareaisalsorequiredbyNREL’smethodology.
Figure11:RooftopazimuthsincludedinfinalsuitableplanesfortheSouthernHemisphere
Figure12presentsanexampleapplicationofNREL’shillshadeandorientationlimit inpractice.ForthisparticularexamplethereisreasonableagreementbetweenthesurfacesdeterminedassuitableforPVdeploymentfromthetwomethodsi.e.Figure10vsFigure12.ThisisnotalwaysthecaseasevidentintheexamplepresentedinFigure13,whichillustrateshowtheinsolationlimitmethodcandefine roof planes orientated southeast through southwest as suitable planes if the annualinsolationmeetsthelimitrequirement.

13|Page
Figure12:Exampleapplicationofthehillshadelimit(left)withthesuitableplanesoverlayed(right)
Figure13:Comparisonbetweenroofplanesdefinedassuitablebytheinsolationmethod(both-yellow)andNREL’shillshadeandorientationmethod(Left–orange)
InputDataSource:AAM3DBuildingModelvs.LiDARdata
The other variable that affected the sensitivity of the estimated PV potential was the input datasource.Twoinputdatasourceswereavailableforuseinthisanalysis:
1. TheDSMsand3DbuildingmodelsfromAAM,whichwereutilisedtogeneratetheAPVISPT,2. NSW LPI LiDAR data for Sydney North – 2013 dataset sourced NSW Land and Property
Information.
TheapplicationofthePVpotentialanalysiswasappliedidenticallytobothinputdatasources.
Generally, Figure 14 demonstrates that there is general agreement between the roof planesidentified as suitable via the two input data sources. However the figure also illustrates how theanalysesundertakenwiththeLiDARdatasetexcludesagreaterproportionofroofsurfaces.

14|Page
Figure14:Exampleofgoodagreementbetweenthetwoinputdatasourceforlargebuildings.Aerialimage(Left),AAM3DbuildingswithNRELmethod(centre);NSWLPILiDARwithNREL
method(Right)
CalculationofPVCapacity,AnnualYieldandCO2-eEmissionReductions
After suitable roof planes have been identified, the PV capacity and annual yield for each roofsurfacecanbecalculated.TheDCPVcapacity (otherwiseknownassystemsize)wascalculatedasperAPVI’sSPTmethodology [2]using theDCsize factorandarrayspacingmethodologies [5].Therelevantequationsforthismethodcanbefoundhere.
Generally, themethod assumes a fixed DC size factor of 156.25W/m2 (i.e. a 250Wmodulewithdimensionsof1mx1.6m)forflushmountedarrays,andavariableDCsizefactorforrackmountedPV arrays. For rack mounted arrays, the DC size factor is a function of the PV array tilt andorientation and the tilt and orientation of the underlying roof surface. Figure 15 presents theequivalentuseableroofarea,whichisanalogoustotheDCsizefactor,fora15degreetiltednorthfacingPVarrayinSydney,asafunctionofthetiltandorientationoftheunderlyingroofsurface.Foranabsolutely flat roof,Figure15 indicatesauseableareaof70%,analogoustoaDCsize factorof110W/m2. Incomparison,NREL’smethodassumesafixedratioofmoduletoroofareaof70%forflatroofsurfaces.
As per NREL’s method to calculate the PV potential in the United States [4], this analysis hasassumed that rack mounted arrays will be installed on flat and relatively flat roof surfaces. ForconsistencywithNREL’smethod, flat roofs havebeendefined as roof surfaceswith a tilt <= 9.5degreesandthetiltangleoftherackmountedarraysweredefinedas15degrees.
Similarly,fortiltedroofsurfaces>9.5degrees,anadditionalmoduletoroofarearatioof0.98wasassumedintheNRELmethodtoreflect1.27cmofspacingbetweeneachmoduleforrackingclamps.Thisassumptionwasalsoappliedinthisstudy.

15|Page
Figure15:Percentageofuseableroofareaasafunctionofrooftiltandorientationfora15degreeNorthfacingarrayinSydney
ThePVyieldwascalculatedusingAPVI’sSPTmethodologyasdetailedhere.ThismethodmultipliesthecalculatedDCPVcapacitybytheaverageannuallevelofinsolationcalculatedontheroofsurfaceand by a derating factor of 0.77. The derating factor accounts for all the typical PV losses oftemperature,soiling,wiring,mismatch,manufacturingmoduletoleranceandinverterefficiency.Thissimplified method shows good agreement with detailed hourly PV performance simulationsundertakeninNREL’sSAMasillustratedinAppendixA.
ThepotentialcontributionofrooftopPVgenerationtoelectricity loadintheSydneyCBDareawasassessedby comparison to the annual energy consumption seen byAusgrid in theCity of SydneyLGA (Table 5), the same area over which rooftop PV potential was modelled. The total annualdemandfortheLGAin2015-16was3,588GWh.
Table5:LoadDatafortheCityofSydney
CustomerGroup Demand(MWh) Residential 408,669 Commercial 770,078 LargeCommercial 2,409,442 Total 3,588,189
Source:Ausgrid’s2015-16SummaryCommunityElectricityReport
In order to assess the potential for additional rooftop PV in the Sydney CBD, and associatedemissionsreductionsandelectricitysavings,dataonexistingPVcapacity intheCityofSydneyLGAarea from theAPVI SolarMapwas used (Figure 17). This data is sourced from the Clean EnergyRegulator’sdatabaseofPVsystemsregisteredundertheRenewableEnergyTargetscheme,whichisa near complete record of PV systems installed in Australia. The total existing PV capacity isestimatedtobearound6.7MW,madeupofaround1000PVsystems.ThisincludesseverallargePVsystems at the Sydney Theatre Company, Barangaroo, Australia Post Strawberry Hills, and theSydney Renewable Power Company, with a total of 1.7 MW capacity. These are shown as redpointersinFigure17.
0
5
10
15
0 30 60 90 120
150
180
210
240
270
300
330
359
RoofTiltAngle(°)
RoofOrientationfromNorth(°)
90%-100%
80%-90%
70%-80%
60%-70%
50%-60%
40%-50%
30%-40%
20%-30%
10%-20%
0%-10%

16|Page
Figure16:PVCapacityintheCityofSydneyLGA
Source:APVISolarMap
Finally, theannualCO2-equivalentemissionreductionsarecalculatedbymultiplying theestimatedannual yield by an appropriate emissions factor for New SouthWales as sourced from the 2016NationalGreenhouseAccount Factors. The relevant value forNew SouthWaleswas0.84 kg CO2-e/kWhwhich is reducedby0.045kgCO2-e/kWh toaccount for theembodied carbonemissionsfromthemanufacture,installation,operationanddecommissioningofthePVsystems.Thevalueof 45 g CO2-e/kWh of electricity produced was sourced from the PV LCA Harmonization Projectresults found in [6], which standardised the results from 13 life cycle assessment studies of PVsystemswithcrystallinePVmodules,assumingsystemlifetimesof30years.
Results
Table6presentsasummaryoftheresultsoftherooftopsuitabilityassessmentfortheSydneyCBD.Results are presented for the average and standard deviation (Std) of the sensitivity analysisundertaken by assessing the two input data sources and the two calculation methodologies. Acomprehensive breakdown of the results by method and input data source are presented inAppendixB.
TheconservativeestimatesuggeststheuseableareasuitableforrooftopPVdeployment(theratiobetween the area of PV panels that could be accommodated and the total roof area) is 25%corresponding to 393 MW of PV potential with an expected annual yield of 507 GWh. TheequivalentCO2emissionsavingsare403ktperyear.ThesevalueswerecalculatedusingtheLiDARdataastheinputdatasourceinconjunctionwithNREL’shillshadeandorientationmethod.

17|Page
Theaverageofthetwomethodsindicatedthatanareaequalto40%oftheavailableroofsurfacescould be used to accommodate PV, corresponding to 619MW of PV potential with an expectedannual yield of 777GWh,with correspondingpotential CO2-equivalent emission savings of 618 ktperyear.
TheaverageestimateofPVgeneration(777GWh)equatestoaround22%ofthe3,588GWhofloadin the CBD area. There is an estimated 6.7MW of existing PV capacity installed on Sydney CBDrooftops,around1%ofthepotentialcapacity.Almostalloftheelectricitygenerationandemissionssavingscalculatedwouldthereforebeadditional.
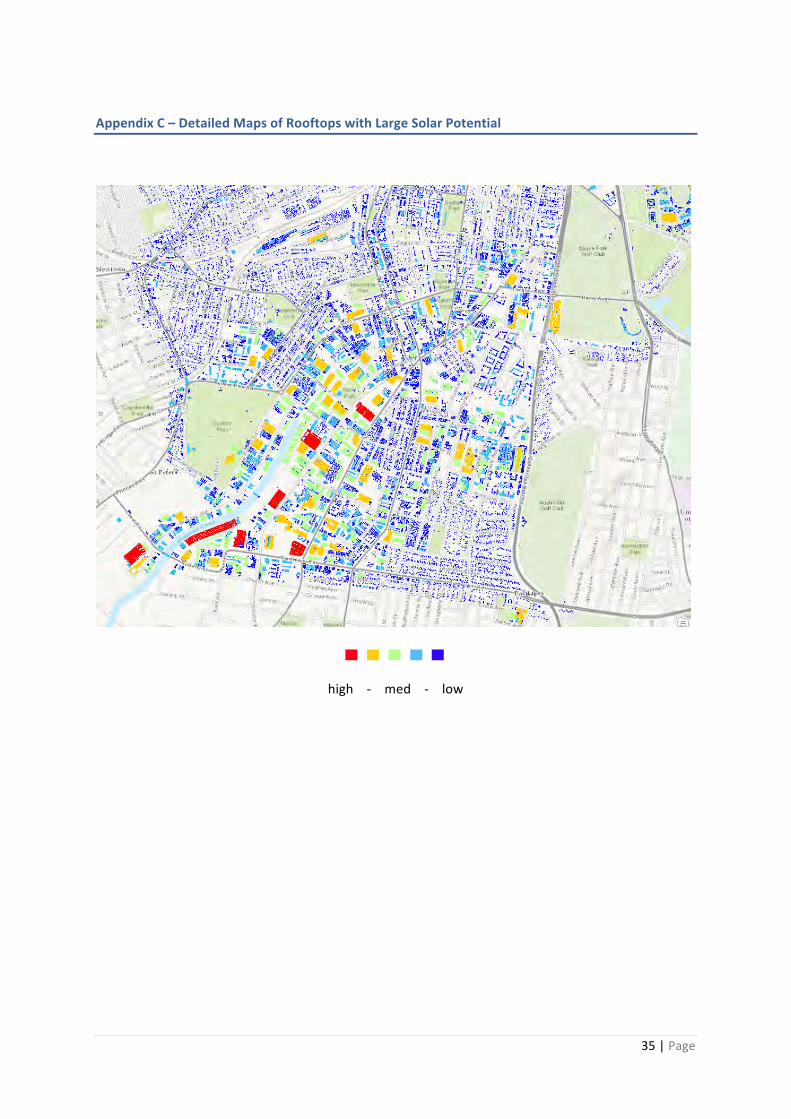
The rooftopswith the largest PVpotential in Sydneyhavebeenmapped (Figure 17below).Moredetailedimagesappearintheappendix.

18|Page
Table6:SummaryofresultscategorisedbytheSydneyCitySuburbs
SydneySuburbPercentageUseableArea Capacity(MW) Yield(GWh)Average Std Average Std Average Std
All 39.64% 14.39% 619.25 224.83 777.12 270.05Alexandria 49.57% 10.30% 109.57 22.77 143.39 27.95Annandale 35.94% 11.28% 6.40 2.01 8.01 2.36Barangaroo 53.72% 19.01% 0.27 0.10 0.34 0.12Beaconsfield 43.60% 15.18% 4.84 1.68 6.05 2.00Camperdown 37.92% 13.96% 20.59 7.58 25.53 9.09CentennialPark 30.48% 12.25% 3.64 1.46 4.45 1.75Chippendale 38.62% 16.52% 10.54 4.51 13.02 5.45Darlinghurst 32.44% 14.57% 19.55 8.78 23.85 10.43Darlington 38.40% 17.11% 8.15 3.63 10.22 4.38DawesPoint 31.38% 9.94% 1.21 0.38 1.45 0.45Eastlakes 53.64% 21.43% 3.15 1.26 3.99 1.52Edgecliff 44.87% 16.56% 0.02 0.01 0.03 0.01ElizabethBay 48.04% 31.79% 6.46 4.27 7.98 5.17Erskineville 40.56% 12.10% 18.21 5.43 22.89 6.50Eveleigh 40.96% 15.23% 9.23 3.43 11.46 4.02ForestLodge 35.43% 13.23% 7.92 2.96 9.79 3.55Glebe 30.52% 10.34% 24.50 8.30 30.08 9.82Haymarket 36.73% 17.11% 12.11 5.64 14.90 6.66Kensington 35.69% 11.36% 4.83 1.54 5.88 1.81Kingsford 36.93% 10.67% 0.03 0.01 0.04 0.01Mascot 59.19% 16.24% 11.01 3.02 14.29 3.75MillersPoint 34.49% 15.64% 3.52 1.60 4.24 1.85MoorePark 45.39% 10.74% 15.98 3.78 20.37 4.58Newtown 31.14% 15.19% 18.60 9.07 22.80 10.75Paddington 30.27% 11.82% 14.31 5.59 17.45 6.63PortJackson 45.62% 20.52% 1.58 0.71 1.91 0.83PottsPoint 39.30% 17.02% 12.96 5.61 16.00 6.72Pyrmont 40.59% 18.41% 21.54 9.77 26.69 11.71Redfern 38.74% 14.28% 25.94 9.56 31.82 11.37Rosebery 48.34% 12.53% 47.40 12.28 60.08 14.75RushcuttersBay 35.87% 19.36% 2.34 1.26 2.88 1.51StPeters 50.60% 12.04% 12.09 2.88 15.73 3.49SurryHills 34.79% 16.43% 30.65 14.47 37.67 17.41SydneyCBD 28.89% 17.95% 47.52 29.52 57.57 34.74TheRocks 27.14% 12.15% 3.41 1.53 4.19 1.81Ultimo 37.69% 15.24% 18.16 7.34 22.59 8.81Waterloo 49.98% 19.09% 33.10 12.64 42.10 15.50Woollahra 25.76% 11.65% 0.46 0.21 0.56 0.24Woolloomooloo 39.87% 18.85% 9.14 4.32 11.08 5.13Zetland 50.18% 17.57% 18.32 6.41 23.77 7.91

19|Page
large-med-smallFigure17:RooftopswithLargestPVPotentialinSydneyCBD
20|Page
CaseStudiesofLandmarkBuildings
ThissectionofthereportdetailsthemethodologyandtheresultsforadetailedassessmentofthePVpotentialfor3landmarkSydneybuildings:theArtGalleryofNewSouthWales,CentralStation,and the Overseas Passenger Terminal at Circular Quay. Apart from being well-known publicbuildings, these were selected for their varied roof profiles in order to demonstrate the solarpotentialofdisparatetypesofbuilding.
Methodology
ThecasestudieswereassessedbycombiningGISanalysiswithavisualassessmentofthebuildingroofprofilesusingaerial imagery, inorder toaccount for rooftopobstructionsandotherbuilding-specificanomaliesbelowtheresolutionoftheAAMandLidardata.Thesensitivityoftheresultswastestedagainstthebuildingleveloutputsofthe4methodologiesdescribedabove.
AssessmentofRoofArea
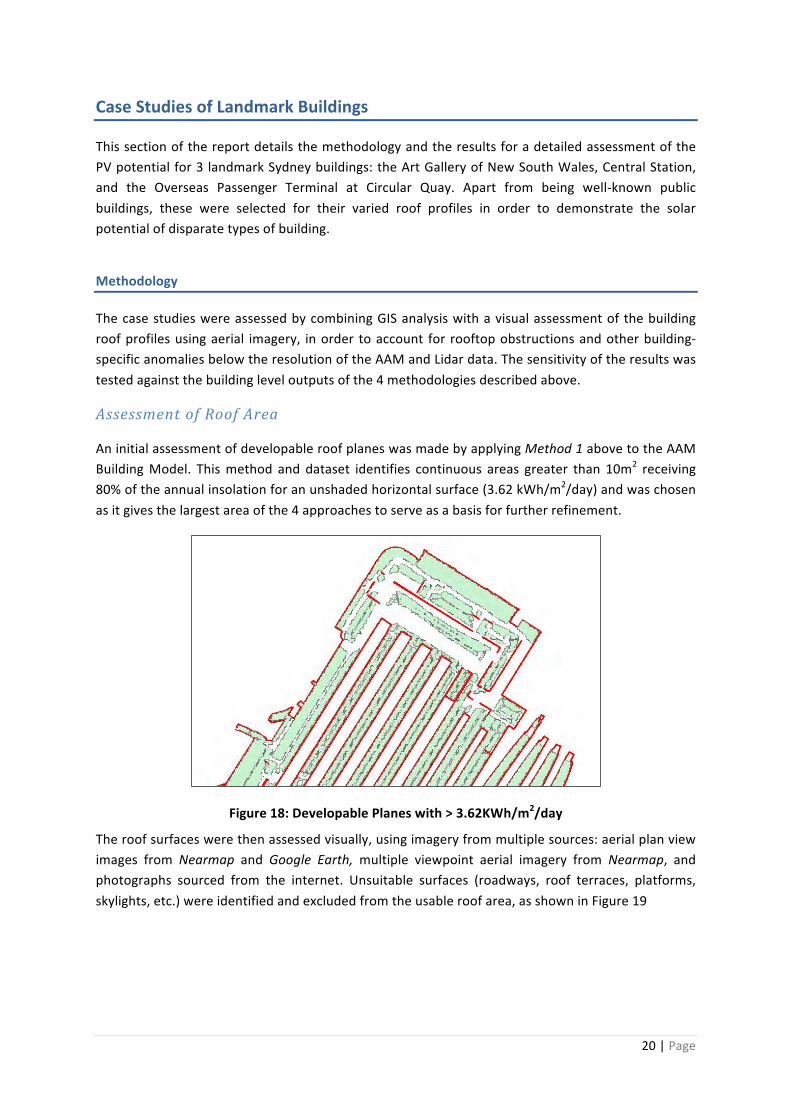
AninitialassessmentofdevelopableroofplaneswasmadebyapplyingMethod1abovetotheAAMBuildingModel. Thismethod and dataset identifies continuous areas greater than 10m2 receiving80%oftheannualinsolationforanunshadedhorizontalsurface(3.62kWh/m2/day)andwaschosenasitgivesthelargestareaofthe4approachestoserveasabasisforfurtherrefinement.
Figure18:DevelopablePlaneswith>3.62KWh/m2/day
Theroofsurfaceswerethenassessedvisually,usingimageryfrommultiplesources:aerialplanviewimages from Nearmap and Google Earth,multiple viewpoint aerial imagery from Nearmap, andphotographs sourced from the internet. Unsuitable surfaces (roadways, roof terraces, platforms,skylights,etc.)wereidentifiedandexcludedfromtheusableroofarea,asshowninFigure19

21|Page
Figure19:Examplesofunsuitablesurfaces(a)roadway,(b)publicterrace,(c)skylights
Smallrooftopobstructions,perimeterwalls,overheadgantries,etc.belowtheresolutionoftheGISdatawereidentifiedandtheirheightestimatedusingmultipleviewpointaerialimagery.(seeFigure20)
Figure20:Estimationofrooftopobstructions
The shading on a PV module at a range of distances from obstructions of different heights wasmodelledusingthe3DshadingcalculatorinNREL’sSystemAdvisorModel(SAM)andtheimpactonannualoutputforahorizontalPVpanelinSydney(usingtheSydneyRMYweatherfilefromEnergyPlus[7])wascalculated.Figure21showstheresultsforasmallrangeofdistancesandwallheights.Using this data, additional roof area proximate to rooftop obstructions was excluded if annualoutputwasestimatedtobelessthan80%ofanunshadedhorizontalpanel.
As Australia has no regulation for minimum access pathways through and around rooftop PVinstallations, the proportion of roofspace allocated for these will depend on the installer’srequirementsforinstallationandmaintenance.Forthisanalysis,a1mwideperimeterwasallowedaround arrays, except those on easily accessible low-level surfaces. For all the buildings, thearrangementofarraysaroundtheroofarchitecturecreatedadditional‘natural’accesspathways.

22|Page
Figure21:Nearestdistancetoobstructiontogive80%annualoutput
CalculationofArraySizeandPVCapacity
Nearmap’sSolarToolwasusedtoarrange1.6mx1.0mPVpanelsontheusableroofspace.TheslopeofeachroofplanewasdeterminedfromtheGISbuildingslope layer.Forslopingroofs,thepanelswerepositionedflushwiththeroofinordertoavoidself-shadingandmaximisegeneration.Forflatroofs, panels were orientated towards North (i.e. between 045°and 315°) at a tilt angle of 5°.Although this arrangement causes individual PV panels to operate at sub-optimal efficiency, itenablesPVinstallationoveragreaterproportionoftheroofthanarack-mountedarrangement,andsomaximisestotalgenerationcapacityfromagivenroofarea.Thepowercapacityofeacharraywascalculated using a nominal output of 250Wpermodule (equivalent to a DC size factor of 156.25W/m2).
CalculationofAnnualYieldandSensitivityAnalysis
An initial value for the predicted annual energy output of each sub-array was calculated forappropriateorientationandtiltusingSAM’sPVWattsmodelandaderatefactorof0.77,andthesewere summed to give the output for each building. Although roof planeswith significant shadinghave alreadybeenexcluded, this valuedoesnot take accountof shading (other than self-shadingduetoorientationandtilt).
ThePVcapacityandannualyieldwerecomparedwithvaluesgivenbythefourmethodologiesabove-hillshadeandinsolationlimitusingAAMandLidardatasets.
Thespecificyield(inkWh/kW/day)wascalculatedforeachofthearrays,andthesecomparedwiththespecificyieldgivenbythefourmethodologies.Aconservativeestimateoftheannualoutputofeacharray,accountingforshadinglosses,wascalculatedbyapplyingthelowestofthesevaluesforspecificyieldtoeacharraycapacity.

23|Page
CalculationofEmissionsOffset
ThepotentialCO2-eemissionsreductionsfromthemodelledPVsystemsonthe3landmarkbuildingswerecalculatedbymultiplyingtheindirect(Scope2)emissionsfactorforconsumptionofelectricitypurchasedfromthegridinNewSouthWales(0.84kgCO2-e/kWh[8])bytheexpectedannualenergygeneration from the system, and subtracting the estimated embodied carbon emissions from themanufacture,installation,operationanddecommissioningofthePVsystem(0.045kgCO2-e/kWh[6])
Results
Table7 shows thepotential roof area available for PV installationoneachbuilding, basedon thedataandvisual imageryavailable.Forcomparison, italsoshowstheareasof“developableplanes”calculatedbythe4methodologiesdiscussedabove.
The table shows that just over half the footprint area of the 3 buildings is suitable for PV arrays.BothCentralStationandtheOverseasPassengerTerminal(OPT)havelargeareasofunclutteredandunshadedroof(althoughpartoftheOPT’sfootprintconsistsofroadway,reducingthe%usableforPV),whiletheArtGallery’sirregularroofprofilehasasmallerproportionunshaded.
Table7:Availableroofareasbydifferentmethodologies
Site Build
ingFo
otprint(m2)
PotentialA
rrayArea
from
visua
lassessm
ent
(m2)
ArrayArea
/Foo
tprin
t
3DM
odel
Insolatio
nlim
it
3DM
odel
Hillsha
de
Lida
rInsolatio
nlim
it
Lida
rHillsha
de
Averageof4M
etho
ds
CentralStation 31403 19600 62% 24642 16796 18640 14665 18686
ArtGalleryNSW 8456 3158 37% 4442 4457 4082 3884 4216
OPT 5760 2421 42% 3011 3008 2367 2310 2674Totals 45619 25179 55% 32095 24260 25089 20859 25576
Thepotentialarrayareasdeterminedbyvisualanalysis sitwithin the rangeofdevelopableplanesdeterminedbythe4methodologiesabove.Figure22showsthedevelopableplanesontheOPTbyeach methodology. In general, for large flat roofs, the methods using the Lidar data appear toslightlyunderestimate theusableareabybreakingup largeareasofusable roof into smaller roofplanes.Conversely,the3Dmodelmethodologiesmayslightlyoverestimateusableareasastheydonot consider small obstructions, localised shading issues, access pathways and the physicalarrangement of rectangular panels on irregularly shaped roof planes. Overall, the visual analysisgivesgoodagreementwith theaveragevalueof the4methods, except for theArtGallerywhereadditionalroofareashavebeenexcludedbecauseofpotentialaccessandinstallationissuescausedbythecomplexrooftopgeometry.

24|Page
Figure22:DevelopablePlanesofOPTusing4methodologies. a) 3D-model& insolation limit, b)3D-model&hillshade,c)Lidar&insolationlimit,d)Lidar&hillshade
Table8showstheprojectedarraycapacityandexpectedannualenergyproductionforthepotentialPVarraysillustratedinFigure2–4aboveandFigure23–25below.
(As this assessment was carried out remotely, there may be additional physical, structural andaestheticconstraintsontheavailableroofareathathavenotbeenconsideredhere.ThePVarraysshownand the results in the tablesare indicativeof the solarpotentialof these roofsbutdonotconstituteaconcreteproposalorsystemdesign.)
Table8:PVCapacityandAnnualEnergyProduction
Site PVCapacity
AnnualEnergyProduction(w/o
shading)
AverageYieldacrossdevelopable
planes
AnnualEnergyProduction(adjusted)
(kWpeak) (MWh/year) (kWh/kW/day) (MWh/year)
CentralStation 3063 3902 3.49 3599ArtGalleryNSW 494 642 3.56 589OPT 378 476 3.45 461
Table9showsthepotentialPVcapacityandTable10showstheannualyieldcalculatedbyeachofthe4methodologiesabove,andusing2 installationapproaches for ‘flat’ (<9.5° slope) roofs: flushmounting (with minimum 5° tilt) and North-facing frame mounting at 15° tilt. Greater yield isobtainedonflatroofsbyflush-mountingbutatthecostofalargerPVarrayandloweryieldperkWof PV installed. Both the PV capacity and yield obtained by the visual assessment show goodagreement with the average values calculated by the 4 methodologies above for flush mountedpanels,exceptfortherestrictionsontheArtGallerymentionedabove.

25|Page
Table9:CaseStudyPVCapacity(kW)–comparisonofmethodologies
FlushMounted FrameMounted
Site VisualAssessm
ent
3DM
odel-Insolatio
n
3DM
odel-Hillsha
de
Lida
r-In
solatio
n
Lida
r-Hillshad
e
AverageFlush
3DM
odel-Insolatio
n
3DM
odel-Hillsha
de
Lida
r-In
solatio
n
Lida
r-Hillshad
e
AverageFram
eMou
nted
CentralStation
3063 3918 2658 2915 2285 2944 3565 2280 2324 1636 2451
ArtGalleryNSW
494 688 688 629 598 650 479 485 401 373 435
OPT 378 467 466 364 355 413 258 256 267 227 252
Totals 3935 5072 3811 3907 3237 4302 3022 2993 2236
Table10:CaseStudyAnnualYield(MWh)–comparisonofmethodologies
FlushMounted FrameMounted
Site
VisualAssessm
ent/
SAM
(w
/osh
ading)
VisualAssessm
ent/
SAM
(adjustedforsha
ding
)
3DM
odel-Insolatio
n
3DM
odel-Hillsha
de
Lida
r-In
solatio
n
Lida
r-Hillshad
e
AverageFlush
3DM
odel-Insolatio
n
3DM
odel-Hillsha
de
Lida
r-In
solatio
n
Lida
r-Hillshad
e
AverageFram
eMou
nted
CentralStation
3902 3599 4604 3188 3446 2733 3493 4267 2832 2852 2083 3008
ArtGalleryNSW
642 589 823 821 755 720 780 617 623 532 499 568
OPT 476 461 569 567 443 433 503 350 347 341 299 334
Totals 5019 4648 5996 4576 4644 3885 5234 3802 3725 2881
26|Page
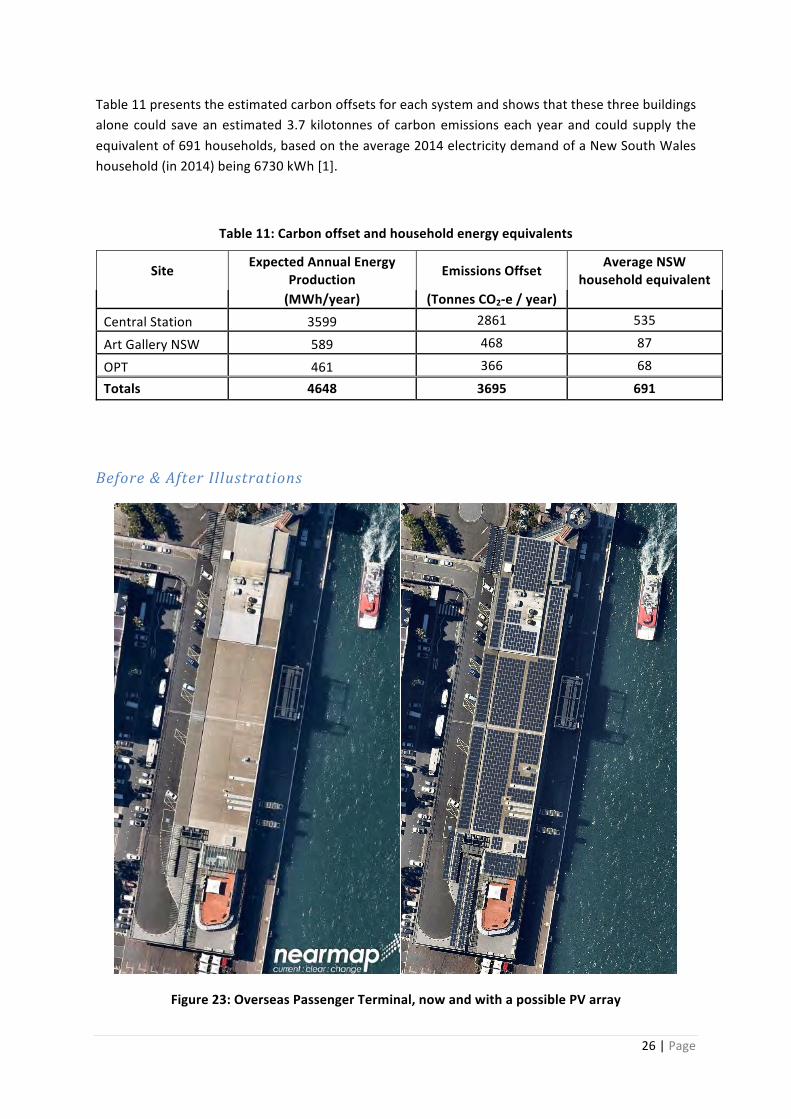
Table11presentstheestimatedcarbonoffsetsforeachsystemandshowsthatthesethreebuildingsalonecould saveanestimated3.7kilotonnesof carbonemissionseachyearandcould supply theequivalentof691households,basedontheaverage2014electricitydemandofaNewSouthWaleshousehold(in2014)being6730kWh[1].
Table11:Carbonoffsetandhouseholdenergyequivalents
Site ExpectedAnnualEnergyProduction EmissionsOffset AverageNSW
householdequivalent (MWh/year) (TonnesCO2-e/year) CentralStation 3599 2861 535
ArtGalleryNSW 589 468 87
OPT 461 366 68Totals 4648 3695 691
Before&AfterIllustrations
Figure23:OverseasPassengerTerminal,nowandwithapossiblePVarray

27|Page
Figure24:CentralStation,nowandwithapossiblePVarray

28|Page
Figure25:ArtGalleryofNSW,nowandwithapossiblePVarray

29|Page
References1. Acil Allen Consulting, Electricity Benchmarks final report v2 - Revised March 2015. 2015,
AustralianEnergyRegulator.2. Copper, J.K. and A.G. Bruce. APVI Solar Potential Tool - Data and Calculations. 2014;
Available from:http://d284f79vx7w9nf.cloudfront.net/assets/solar_potential_tool_data_and_calcs-2dc0ced2b70de268a29d5e90a63432d7.pdf.
3. Copper, J.K. and A.G. Bruce.Validation ofMethodsUsed in the APVI Solar Potential Tool.2014; Available from: http://apvi.org.au/solar-research-conference/wp-content/uploads/2015/04/1-Copper_APVI_PVSystems_PeerReviewed.pdf.
4. Gagnon, P., et al. Rootop Solar Photovoltaic Technical Potential in the United States: ADetailed Assessment. NREL/TP-6A20-65298 2016; Available from:http://www.nrel.gov/docs/fy16osti/65298.pdf.
5. Copper,J.K.,A.B.Sproul,andA.G.Bruce,Amethodtocalculatearrayspacingandpotentialsystemsizeofphotovoltaicarrays in theurbanenvironmentusing vectoranalysis. AppliedEnergy,2016.161:p.11-23.
6. Hsu, D.D., et al., Life Cycle Greenhouse Gas Emissions of Crystalline Silicon PhotovoltaicElectricityGeneration.JournalofIndustrialEcology,2012.16:p.S122-S135.
7. Energy Plus Weather Data - Southwest Pacific Region. Available from:https://energyplus.net/weather-region/southwest_pacific_wmo_region_5/AUS%20%20.
8. DepartmentofEnvironmentandEnergy,NationalGreenhouseAccountsFactors.2016.

30|Page
Appendix A – Comparison between APVI SPT Simple PV PerformanceMethod vs. Detail HourlySimulationofPVPerformanceinNREL’sSystemAdvisorModel
Figure 26 presents a comparison between the calculated annual yields using APVI SPT simplifiedmethodversusdetailedhourly simulationsofPVperformanceusingNREL’s SAMPVWattsmodulewithdefaultsettings.Theresultshighlight thesimilarity in thecalculatedvalues,anddemonstratehowtheannualyieldcanbecalculatedusingasimplifiedmethodology,whichrequiresasinputonlythe annual or monthly averages of surface insolation in kWh/m2/day. The simplified APVI SPTmethodologyenablesgeospatialcalculationofyieldforeachidentifiedroofsurface.
Figure26:CorrelationbetweenAPVISPTsimplifiedmethodtocalculateannualyieldfromannualaverageinsolationvs.detailedhourlysimulationsofPVperformancefromNREL’sSAM.Results
presentedforeach1degreecombinationoftilt(0-90°)andorientation(0-360°).
y=0.9965x+11.166R²=0.9997
0
200
400
600
800
1000
1200
1400
1600
1800
0 500 1000 1500 2000
APVISPTAnn
ualYeild(kWh/kW
p)
SAMDetailedHourlyAnnualYeild(kWh/kWp)

31|Page
Appe
ndixB–Assessm
ento
fRoo
ftop
Suitability–De
tailedRe
sults
Table12
:Detailedresultsofroo
ftop
suita
bilitycalculated
usin
gAA
MDSM
and
3Dbu
ildings
Sydn
eySub
urb
Metho
d1-InsolationLimit(3
.62kW
h/m2/da
y)-3D
Buildings
Metho
d2:NRELHillshad
eE/NE/N/N
W/W
(19.58
)-3D
Buildings
Total
Area(ha)
Develop
able
(ha)
%
Useab
le
Capa
city
(MW)
Yield
(GWh)
Develop
able
(ha)
%
Useab
le
Capa
city
(MW)
Yield
(GWh)
All
999.71
54
1.40
54
.16%
84
5.94
10
46.63
496.37
49
.65%
77
5.59
96
8.73
Alexand
ria
141.46
86
.07
60.84%
13
4.49
17
3.32
78
.34
55.38%
12
2.40
16
0.18
Ann
anda
le
11.40
5.59
49
.04%
8.74
10
.72
4.69
41
.09%
7.32
9.16
Baran
garoo
0.32
0.22
69
.36%
0.35
0.44
0.23
70
.84%
0.36
0.44
Beaconsfie
ld
7.10
4.36
61
.32%
6.81
8.34
3.59
50
.54%
5.61
7.05
Campe
rdow
n34
.75
18.02
51.87%
28
.16
34.52
16.58
47.72%
25
.91
32.04
Centen
nialPark
7.64
3.26
42
.65%
5.09
6.15
3.00
39
.19%
4.68
5.76
Chippe
ndale
17.47
9.44
54
.02%
14
.74
18.02
9.02
51
.62%
14
.09
17.40
Darlingh
urst
38.57
18.10
46.91%
28
.28
34.14
16.52
42.82%
25
.81
31.37
Darlington
13
.59
7.65
56
.31%
11
.96
14.74
6.74
49
.57%
10
.52
13.15
Daw
esPoint
2.47
1.07
43
.21%
1.67
1.98
0.87
35
.20%
1.36
1.64
Eastlakes
3.75
2.85
76
.00%
4.46
5.56
2.54
67
.76%
3.97
5.02
Edgecliff
0.03
0.02
59
.30%
0.03
0.04
0.02
59
.11%
0.03
0.04
Elizab
ethBay
8.60
6.44
74
.92%
10
.07
12.34
6.55
76
.15%
10
.23
12.56
Erskineville
28.74
15.39
53.55%
24
.04
29.79
13.69
47.63%
21
.39
26.82
Eveleigh
14
.42
8.83
61
.21%
13
.79
16.74
6.20
42
.98%
9.68
12
.20
ForestLod
ge
14.31
7.10
49
.58%
11
.09
13.53
6.23
43
.50%
9.73
12
.06
Glebe
51
.38
21.70
42.24%
33
.91
41.02
18.39
35.80%
28
.74
35.41
Haymarket
21.09
11.51
54.55%
17
.98
21.93
10.14
48.09%
15
.85
19.21
Kensington
8.66
4.14
47
.84%
6.47
7.77
3.66
42
.27%
5.72
7.01
King
sford
0.05
0.02
47
.90%
0.04
0.05
0.02
39
.21%
0.03
0.04
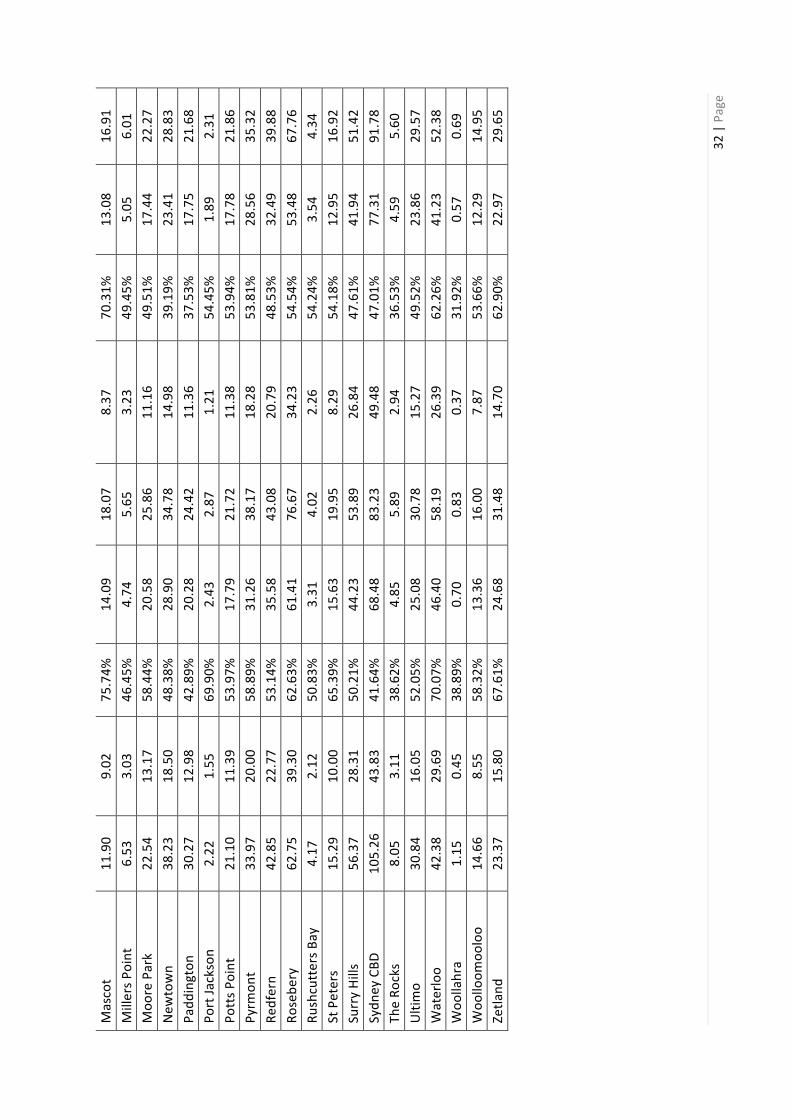
32|Page
Mascot
11.90
9.02
75
.74%
14
.09
18.07
8.37
70
.31%
13
.08
16.91
MillersPo
int
6.53
3.03
46
.45%
4.74
5.65
3.23
49
.45%
5.05
6.01
Moo
rePark
22.54
13.17
58.44%
20
.58
25.86
11.16
49.51%
17
.44
22.27
New
town
38.23
18.50
48.38%
28
.90
34.78
14.98
39.19%
23
.41
28.83
Padd
ington
30
.27
12.98
42.89%
20
.28
24.42
11.36
37.53%
17
.75
21.68
PortJackson
2.22
1.55
69
.90%
2.43
2.87
1.21
54
.45%
1.89
2.31
PottsPo
int
21.10
11.39
53.97%
17
.79
21.72
11.38
53.94%
17
.78
21.86
Pyrm
ont
33.97
20.00
58.89%
31
.26
38.17
18.28
53.81%
28
.56
35.32
Red
fern
42.85
22.77
53.14%
35
.58
43.08
20.79
48.53%
32
.49
39.88
Roseb
ery
62.75
39.30
62.63%
61
.41
76.67
34.23
54.54%
53
.48
67.76
RushcuttersBay
4.17
2.12
50
.83%
3.31
4.02
2.26
54
.24%
3.54
4.34
StPeters
15.29
10.00
65.39%
15
.63
19.95
8.29
54
.18%
12
.95
16.92
SurryHills
56.37
28.31
50.21%
44
.23
53.89
26.84
47.61%
41
.94
51.42
Sydn
eyCBD
105.26
43
.83
41.64%
68
.48
83.23
49.48
47.01%
77
.31
91.78
TheRocks
8.05
3.11
38
.62%
4.85
5.89
2.94
36
.53%
4.59
5.60
Ultim
o30
.84
16.05
52.05%
25
.08
30.78
15.27
49.52%
23
.86
29.57
Waterloo
42.38
29.69
70.07%
46
.40
58.19
26.39
62.26%
41
.23
52.38
Woo
llahra
1.15
0.45
38
.89%
0.70
0.83
0.37
31
.92%
0.57
0.69
Woo
lloom
ooloo
14.66
8.55
58
.32%
13
.36
16.00
7.87
53
.66%
12
.29
14.95
Zetlan
d23
.37
15.80
67.61%
24
.68
31.48
14.70
62.90%
22
.97
29.65

33|Page
Table13
:Detailedresultsofroo
ftop
suita
bilitycalculated
usin
gSydn
eyNorth201
3LiDA
Rda
tasetfromNSW
LPI
Sydn
eySub
urb
Metho
d1-InsolationLimit(3
.62kW
h/m2/da
y)-LiDAR
Metho
d2:NRELHillshad
eE/NE/N/N
W/W
(19.58
)-LiDAR
Develop
able(h
a)
%Useab
le
Capa
city(M
W)
Yield(GWh)
Develop
able(h
a)
%Useab
le
Capa
city(M
W)
Yield(GWh)
All
296.26
29
.64%
46
2.91
58
6.05
25
1.25
25
.13%
39
2.57
50
7.06
Alexand
ria
61.49
43.47%
96
.09
126.18
54
.60
38.60%
85
.31
113.90
Ann
anda
le
3.39
29
.76%
5.30
6.67
2.72
23
.87%
4.25
5.50
Baran
garoo
0.13
39
.58%
0.20
0.25
0.11
35
.09%
0.18
0.23
Beaconsfie
ld
2.47
34
.82%
3.87
4.86
1.97
27
.72%
3.08
3.96
Campe
rdow
n9.90
28
.49%
15
.47
19.27
8.20
23
.60%
12
.82
16.30
Centen
nialPark
1.69
22
.06%
2.63
3.22
1.38
18
.01%
2.15
2.69
Chippe
ndale
4.66
26
.66%
7.28
9.00
3.88
22
.20%
6.06
7.66
Darlingh
urst
8.63
22
.36%
13
.48
16.49
6.81
17
.65%
10
.64
13.39
Darlington
3.55
26
.10%
5.54
7.01
2.94
21
.63%
4.59
5.96
Daw
esPoint
0.66
26
.64%
1.03
1.23
0.50
20
.45%
0.79
0.97
Eastlakes
1.42
37
.94%
2.23
2.86
1.23
32
.87%
1.93
2.52
Edgecliff
0.01
31
.23%
0.02
0.02
0.01
29
.85%
0.02
0.02
Elizab
ethBay
1.92
22
.33%
3.00
3.76
1.61
18
.76%
2.52
3.24
Erskineville
9.67
33
.67%
15
.12
19.06
7.88
27
.41%
12
.31
15.89
Eveleigh
4.89
33
.91%
7.64
9.48
3.71
25
.73%
5.80
7.42
ForestLod
ge
3.83
26
.77%
5.99
7.40
3.13
21
.86%
4.89
6.18
Glebe
12
.52
24.38%
19
.57
24.04
10.10
19.66%
15
.78
19.85
Haymarket
5.04
23
.90%
7.88
9.87
4.30
20
.40%
6.72
8.58
Kensington
2.56
29
.59%
4.00
4.86
2.00
23
.08%
3.12
3.88
King
sford
0.02
38
.31%
0.03
0.04
0.01
22
.31%
0.02
0.02
Mascot
5.69
47
.76%
8.88
11
.59
5.11
42
.96%
7.99
10
.58
MillersPo
int
1.47
22
.51%
2.30
2.81
1.28
19
.55%
2.00
2.48
Moo
rePark
8.82
39
.12%
13
.78
17.60
7.77
34
.47%
12
.14
15.73
New
town
7.95
20
.80%
12
.42
15.32
6.19
16
.20%
9.67
12
.26
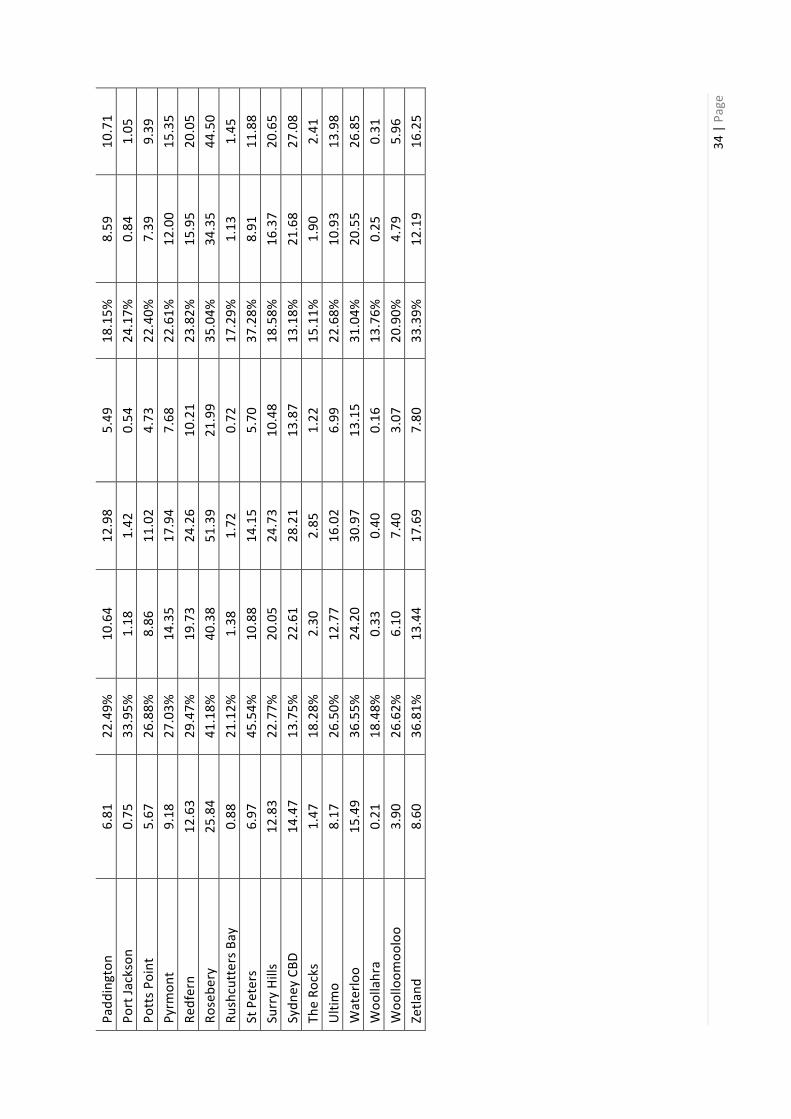
34|Page
Padd
ington
6.81
22
.49%
10
.64
12.98
5.49
18
.15%
8.59
10
.71
PortJackson
0.75
33
.95%
1.18
1.42
0.54
24
.17%
0.84
1.05
PottsPo
int
5.67
26
.88%
8.86
11
.02
4.73
22
.40%
7.39
9.39
Pyrm
ont
9.18
27
.03%
14
.35
17.94
7.68
22
.61%
12
.00
15.35
Red
fern
12.63
29.47%
19
.73
24.26
10.21
23.82%
15
.95
20.05
Roseb
ery
25.84
41.18%
40
.38
51.39
21.99
35.04%
34
.35
44.50
RushcuttersBay
0.88
21
.12%
1.38
1.72
0.72
17
.29%
1.13
1.45
StPeters
6.97
45
.54%
10
.88
14.15
5.70
37
.28%
8.91
11
.88
SurryHills
12.83
22.77%
20
.05
24.73
10.48
18.58%
16
.37
20.65
Sydn
eyCBD
14.47
13.75%
22
.61
28.21
13.87
13.18%
21
.68
27.08
TheRocks
1.47
18
.28%
2.30
2.85
1.22
15
.11%
1.90
2.41
Ultim
o8.17
26
.50%
12
.77
16.02
6.99
22
.68%
10
.93
13.98
Waterloo
15.49
36.55%
24
.20
30.97
13.15
31.04%
20
.55
26.85
Woo
llahra
0.21
18
.48%
0.33
0.40
0.16
13
.76%
0.25
0.31
Woo
lloom
ooloo
3.90
26
.62%
6.10
7.40
3.07
20
.90%
4.79
5.96
Zetlan
d8.60
36
.81%
13
.44
17.69
7.80
33
.39%
12
.19
16.25
35|Page
AppendixC–DetailedMapsofRooftopswithLargeSolarPotential
high-med-low

36|Page
high-med-low

37|Page
high-med-low