spatial competition and quality: family doctor market countries. the quality of care can have large,...
TRANSCRIPT

CHE Research Paper 151
Spatial Competition and Quality: Evidence from the English Family Doctor Market
Hugh Gravelle, Dan Liu, Carol Propper, Rita Santos

Spatial competition and quality: Evidence from the English family doctor market 1Hugh Gravelle 1Dan Liu 2Carol Propper 1Rita Santos
1Centre for Health Economics, University of York, UK 2 Imperial College London, UK February 2018

Background to series
CHE Discussion Papers (DPs) began publication in 1983 as a means of making current research material more widely available to health economists and other potential users. So as to speed up the dissemination process, papers were originally published by CHE and distributed by post to a worldwide readership. The CHE Research Paper series takes over that function and provides access to current research output via web-based publication, although hard copy will continue to be available (but subject to charge). Acknowledgements
The paper is based on independent research commissioned and partly funded by the NIHR Policy Research Programme (Policy Research Unit in the Economics of Health and Social Care Systems: Ref 103/0001). RS was part funded by an NIHR Doctoral Fellowship (DRF 2014-07-055. CP was funded by the Economic and Social Research Council under grant ES/J023108/1. We thank David Byrne and participants at seminars in York, Melbourne and the HESG conference for their comments. The views expressed are those of the authors and not necessarily those of the ESRC, the NHS, the NIHR, the Department of Health, arm’s length bodies or other government departments. Hospital Episode Statistics are Copyright 2002-2016, re-used with the permission of NHS Digital. All rights reserved. No ethical approval was needed. Further copies
Only the latest electronic copy of our reports should be cited. Copies of this paper are freely available to download from the CHE website www.york.ac.uk/che/publications/ Access to downloaded material is provided on the understanding that it is intended for personal use. Copies of downloaded papers may be distributed to third-parties subject to the proviso that the CHE publication source is properly acknowledged and that such distribution is not subject to any payment. Printed copies are available on request at a charge of £5.00 per copy. Please contact the CHE Publications Office, email [email protected], telephone 01904 321405 for further details. Centre for Health Economics Alcuin College University of York York, UK www.york.ac.uk/che © Hugh Gravelle, Dan Liu, Carol Propper, Rita Santos

Spatial competition and quality: Evidence from the English family doctor market i
Abstract
We examine whether family doctor firms in England respond to local competition by increasing their quality. We measure quality in terms of clinical performance and patient-reported satisfaction to capture its multi-dimensional nature. We use a panel covering 8 years for over 8000 English general practices, allowing us to control for unobserved local area effects. We measure competition by the number of rival doctors within a small distance. We find that increases in local competition are associated with increases in clinical quality and patient satisfaction, particularly for firms with lower quality. However, the magnitude of the effect is small. JEL Nos: I11, I18 Keywords: Quality, healthcare, choice, competition, family physicians.

ii CHE Research Paper 151

Spatial competition and quality: Evidence from the English family doctor market 1
1 Introduction
Quality competition is pervasive and important. Quality is a key component of service products such as, transport, telecoms, banking, education and healthcare. Competition on quality is a central component of industrial organisation (product differentiation, bundling and price discrimination). But the relationship between quality and competition is hard to study empirically. Quality is multi-dimensional and often difficult to measure, product prices and quality are typically set together and market structure and quality are jointly determined. Empirical studies on quality competition are still relatively scarce.1 One area where an understanding of the empirical relationship between quality and market structure is central is healthcare. Healthcare accounts for over 10 percent of the economy of most developed countries. The quality of care can have large, and long-lasting, effects on the health of the consumer. Injecting greater competition into heavily regulated healthcare markets is a popular reform model in many jurisdictions (Gaynor et al 2016; Glied and Altman 2017; OECD 2012). But this takes place against the backdrop of a long-term trend of provider consolidation in healthcare markets (Gaynor and Town 2012; Fulton 2017). Understanding the relationship between quality and market structure in healthcare is therefore important. Theoretically, the relationship between competition and quality is ambiguous (Gaynor and Town 2012). Empirically, the bulk of the literature on the relationship between competition and quality in the hospital sector points towards a positive relationship where price is regulated (Gaynor and Town 2012).2 In this paper we examine the relationship between quality of care and market structure in local physician markets. This has been much less researched and the empirical evidence is scarce (Gaynor and Town 2012). Yet, as in the hospital sector, physician markets are becoming more concentrated and much of this is below the radar of regulatory authorities (Capps et al 2017). If effort is to be spent promoting competition there is a need to know whether this will increase quality. We study family physicians (known as General Practitioners (GPs)) in the English National Health Service (NHS). These physicians provide primary care (healthcare outside the hospital or nursing home setting) and act as gatekeepers to almost all other services provided by the NHS. They are small businesses, typically composed of 4-5 family doctors who employ nursing and other staff. Almost all practices operate in a single, small, local market. In common with most European countries, care is free at the point of use. Payments to practices are determined nationally and the institutional set-up is such that practices have an incentive to compete for patients. Patients can only register with one practice and around 75% of practice revenue comes from the number of patients registered with the practice. As patients face zero prices, any competition has to be in terms of quality. Figure 1 shows the market structure (as measured by the Herfindahl-Hirschman Index (HHI) of concentration of practice registrations) across the small areas from which GP practices draw their potential patients for the whole of England. The figure shows considerable variation in market concentration. Some markets are very unconcentrated, others are highly concentrated. Markets in urban areas are, as expected, much less concentrated than those in rural areas, but even within urban and rural areas there is considerable variation. In this setting, patient choice of practice has been shown to be responsive to quality (Santos et al 2017). Thus, the pre-requisites for competition between providers to improve quality exists: the question is whether it does.
1 Examples include the media (Berry and Waldfogel 2001; Fan 2013), airlines (Mazzeo 2003), supermarkets (Matsa 2011). 2 For recent evidence from the UK see Cooper et al (2011), Gaynor et al (2013), Bloom et al (2015). Gravelle et al (2014) find more mixed results.

2 CHE Research Paper 151
Figure 1. Family doctor market structure, England 2008
Notes: HHI is the sum of squared shares of Lower Super Output Area (LSOA) population registered at each
general in England. LSOAs have mean populations of 1500. Colours are deciles of HHI distribution. Figure 1 uses
miles while our competition measure uses km.

Spatial competition and quality: Evidence from the English family doctor market 3
To answer this, we study the universe of all GP practices (over 8000) in England between 2005 and 2012.3 We use seven practice-specific measures of quality, some relating to the quality of medical care as judged by national clinical standards, and others relating to patient reported satisfaction with their chosen practice. Our empirical strategy is to exploit changes in market structure at the local level. We primarily focus on exploiting within-practice variation in the number of GPs in other local rival practices. Our within-practice design allows us to address potential endogeneity if areas with better amenities attract more general practices and also healthier patients for whom it is easier to achieve higher clinical quality. In addition to using practice fixed effects to control for time-invariant practice and local area unobservables, we also control for potential selection of practice by patients and selection of patients by practices. We also exploit a policy change that increased supply of physicians in some areas but not in others. We are also able to exploit our large sample to examine heterogeneity with respect to initial levels of potential competition and quality. Our results show that increases in the number of rivals are associated with increases in both clinical quality and patient reported quality. None of our results suggest that greater competition reduces quality. The effect of increased competition is larger for practices that are producing lower quality, but the impact of competition is similar across more or less concentrated markets. However, in common with results from studies of pay for performance and other policies to improve the quality of care provided by family doctors (Scott et al 2011), we find the magnitude of the effect of a change in rivals is not large. Our findings contribute directly to research on quality competition in physician markets and to the debate about whether policies to strengthen competition in these markets should be pursued. In the European setting where there is no price competition amongst providers (providing the ideal setting for examining pure quality competition), there are few studies of the physician market and quality. In the main, this literature lacks the exogenous variation needed for causal inference, uses a very limited number of outcomes measures which may have ambiguous relation to quality, or analyses small area, rather than firm (physician practice) variation. Schaumans (2015) and Pike (2010) exploit only cross–sectional variation. The former examines the effect of competition in the Belgian family doctor market on pharmaceutical prescriptions. Prescriptions have no direct effect on practice revenue or cost but may make the patient feel that the doctor is taking their health concerns seriously. The unit of analysis in Schaumans (2015) is the small area and she finds little effect. Pike (2010) undertakes analysis at the physician practice level and, as our study, uses a distance based measure of competition and examines a subset of the quality measures we examine here. He finds that practices with more nearby practices have higher quality. Brekke et al (2017) have rich data at the individual physician level but examine only one outcome: the dispensation of ‘sick notes’ (documents which allow individuals to take time off work with no financial penalty). This is not a measure of clinical quality and may be rather an ambiguous measure, at the societal level, of patient-rated quality. In addition, the definition of competition in their work is not spatial competition but that of physician behaviour under different contracting arrangements. The closest paper to ours is Dietrichson et al (2016). This exploits a reform in Swedish primary care which led to greater entry of providers in municipalities where there were more patients per provider before the reform. The authors study both clinical and patient satisfaction measures of quality at the municipal level. They find small improvements in subjective overall quality measures, but no change in avoidable hospitalisations or patient satisfaction with access to primary care. However, although their policy experiment provides a nice context, the unit of analysis is not the
3 All our data are for UK financial years which run from 1 April to 31 March.
4 CHE Research Paper 151
firm (the practice) but the municipality and so the possibility that quality was affected by other municipality level factors cannot be ruled out. Research on the relationship between market structure in physician markets where price and quality are set simultaneously (mainly from the USA) is similarly relatively small compared to the number of studies on hospital markets. It primarily focuses on the impact on prices rather than quality (see, inter alia, Baker et al 2014; Sun and Baker 2015). It also has to address the fact that prices are increasingly set by complex bargaining between insurers and hospital (see, for example, Clemens and Gottlieb 2017). The European setting, in which prices are set nationally and patients are generally fully insured, provides a cleaner setting for an examination of the (arguably less complex, but surprisingly under-researched) relationship between quality and market concentration in small localised physician markets. It is also particularly relevant to discussions about increasing the role for regulated prices as a way of promoting quality competition in the US healthcare market (Glied and Altman 2017). The next section provides a brief account of the institutional framework for English general practices and of policies potentially affecting the amount of effective competition that practices face. Section 3 sets out the estimation methods and strategies for identifying the effect of competition. Section 4 describes the data. Results are in Section 5. Section 6 concludes.

Spatial competition and quality: Evidence from the English family doctor market 5
2 Institutional background
The English NHS provides healthcare which is tax-financed and free at the point of demand.4 NHS primary care is provided by family doctors, known as General Practitioners, organised into small groups, known as a general practice. All individuals resident in England are entitled to register with a general practice, and have incentives to do so, as the practices provide both primary care and also act as the gatekeeper for elective (non-emergency) hospital care. There are over 8000 general practices with an average of just over 4 (4.2) GPs and 6,600 patients (HSCIC 2015). Most are located at a single site though around 15% have more than one. Larger groups and chains have been absent until recently and are still rare. The NHS contracts with the practice rather than the individual GPs. Practices are paid by a mix of lump sum payments, capitation, quality incentive payments, and items of service payments. Around 75% of practice revenue varies with the number of patients registered with the practice.5 Practices are reimbursed for the costs of their premises and information technology but fund all other expenses, such as hiring nurses and clerical staff, from their revenue. A very rough estimate, under the assumption that average revenue and cost per patient are constant, is that an additional patient registered with the practice produces revenue of £135, expenses of £80, and net income of £55 per practice partner.6 Thus practices have an incentive to attract patients. The operation of practices is overseen by area-based NHS administrative bodies known during the period of our study as Primary Care Trusts (PCTs). PCTs contained on average 350,000 patients and 55 practices. Practices are required to accept all patients who live within their agreed catchment area set by agreement with their PCT unless they notify the PCT that they are full and temporarily not accepting patients for between 3 and 12 months. Around 2% of practices have such closed lists at any one time.7,8 However, while some practices may be temporarily closed, this does not mean there is no choice for patients. On average, patients in small administrative areas that contain approximately 1500 people are registered with 13 practices.9 From the perspective of the GP practice, this means they potentially face a high degree of competition for patients. In section 3, we
4 A small charge is made for dispensed medicines, but because of exemptions on grounds of age or low income, this is only applied to around 10% of prescriptions. 5 Over 50% is from capitation payments determined by a national formula which takes account of the demographic mix of practice patients and local morbidity measures. Quality incentives from the national Quality and Outcomes Framework (QOF) (Roland, 2004) generate a further 15% of practice revenue and for a given quality level QOF revenue increases with the number of patients. Practice payments for providing specific services including vaccinating and screening target proportions of the relevant practice population also increase with the total number of patients registered with the practice. 6 In 2009/10 there were 26,420 GP contractors (i.e. joint owners rather than salaried employees) in England with average gross income £287,100l, expenses of £168,700 and net income of £109,400. There were 2066 registered patients per GP contractor. See: GP Earnings and Expenses 2009/10, http://www.hscic.gov.uk/pubs/gpearnex0910 (last accessed 10 March 2015); General and Personal Medical Services, England 2001-2011, http://www.hscic.gov.uk/catalogue/PUB05214 (last accessed 10 March 2015). 7 House of Commons, Hansard Written Answers for 28 April 2008. 8 Practices with closed lists are not eligible for certain types of payments for providing additional services. Consequently some practices designate themselves as ‘open but full’. Estimates suggest that in 2007 up to 10% of practices were ‘open but full’ at any time (National Audit Office, 2008) but, since the designation is unofficial and has no legal force, its extent and effect on patients signing up to the practice are unclear. GPs can deregister patients if there is a fundamental breakdown in the doctor-patient relationship. It has been estimated that each year 0.1% of patients are deregistered (Munro et al 2002). If a patient cannot find a practice prepared to accept them, they can ask their PCT to find them a practice, and PCTs can assign patients to practices. Around 0.5% of patients are assigned to practices (Audit Commission, 2004). 9 The administrative area is the Lower Super Output Area (LSOA), discussed in more detail in Section 3.

6 CHE Research Paper 151
show that over 65 percent of practices have more than 10 potential rival GPs located within 1km, with some having as many as 50 or 60. Government policy over a relatively long period has been to increase competition between practices. The national body which regulated the location of general practices was abolished in 2002 and the government introduced a nationwide tendering process, run by the local administrative bodies responsible for over-seeing healthcare delivery, to make it easier for new practices to be established. Restrictions on the type of organisation which could provide general practice services were also eased in 2004, so that general practices can be run by other NHS institutions such as hospitals, and by private companies, as well as traditional partnerships of GPs. Practices cannot advertise for patients. However, in a drive to increase choice by patients in all areas of English healthcare, the national government established a website in 2007 (known as NHS Choices) to make choice of practice (and other healthcare providers) easier for patients. It contains information on the characteristics of practices, including the specialist clinics they offer and results from patient satisfaction surveys. These data are published with the express aim of increasing choice and, through this, improving quality.10 During our sample period there was a major national policy initiative to increase the supply of family doctor care. Known as the Equitable Access to Primary Medical Care (EAPMC) policy, the aim was to increase supply in the 38 PCTs (out of a total of 151 PCTs) in which there was evidence of a shortage of GPs relative to patient need (Asaria et al 2015; Department of Health 2007). The policy, funded with £250 million from central government, operated from financial year 2008 to 2011 and had the effect of increasing the supply of GPs in the 38 EAPMC PCTs relative to other PCTs (Asaria et al 2015).
10 The NHS Choices website states: “The idea is to provide you with greater choice and to improve the quality of GP services over time, as GPs providing a good service are naturally more popular.” https://www.nhs.uk/NHSEngland/AboutNHSservices/doctors/Pages/patient-choice-GP-practices.aspx http://www.nhs.uk/choiceintheNHS/Yourchoices/GPchoice/Pages/ChoosingaGP.aspx. Detailed information on performance of practices in an area under the national pay for performance scheme is also available via http://www.qof.ic.nhs.uk/search/ and information from surveys of patient satisfaction is available at http://www.gp-patient.co.uk/info/.

Spatial competition and quality: Evidence from the English family doctor market 7
3 Empirical strategy
We need to deal with three issues when estimating the impact of market structure on quality in healthcare markets, including those in primary care. First, measured quality of care may depend on the mix of patient type (case-mix) as well as the effort of the practice. Second, practice location may not be exogenous to the patient or the GP. Patients can choose practices and they may sort on unobservables. Practice location is chosen by GPs. As practices are not allowed to refuse patients from within their agreed catchment areas and practices are rewarded on the basis of performance as well as number of patients, it is possible that practices choose to locate in areas in which patients are easier to treat (typically those areas in which patients are healthier and more affluent). In this case, the number of practices located in an area will be conflated with easy to treat patients. If GPs are more likely to locate where there are easy to treat patients this will upwardly bias estimates of the impact of competition. Alternatively, GPs are less likely to enter near a practice with good quality. This will downwardly bias the estimated effect of competition on quality.11 We have a detailed set of patient characteristics (discussed in Section 4) which we can use to control for case-mix. However, because of potential selection by either patient or GP, the characteristics of patients in a practice may be endogenous. To deal with this, we adopt a number of strategies. We first compare models with and without controls for the characteristics of patients on the practice list. If the results are robust to exclusion of these measures, it suggests that selection on observables is not a problem and hence, possibly there may be no bias from selection on unobservables. Second, we replace the actual practice case-mix with measures of the same characteristics for the local population from which the practice could potentially draw its patients. Third, as our data is a panel we control for practice fixed effects, which controls for non-time varying attributes of the local population and other attributes of the local area that may attract or deter GPs from locating there. Although a fixed effects specification removes omitted variable bias due to the correlation of unobserved time invariant practice characteristics with quality and competition, it does not allow for the possibility that competition is endogenous in that, for example, practices with lower quality are more likely to face new local rivals. We allow for this in two ways. First, we undertake analyses using only those practices located in areas with homogeneous socio-economic characteristics. We argue that GP location and patient selection of practices in these homogenous areas is exogenous to amenities and unobserved population type, because the amenities and population type does not differ within these areas. Hence in such areas we can identify the effect of market structure by its within area variation (e.g. Gravelle et al 2016). We therefore carry out a sub-set of analyses only for practices in small geographical areas characterised by low variance in their population type as measured by small area social and economic deprivation of the population (more details are provided in Section 4). Second, we exploit the EAPMC policy. Under the assumption that EAPMC led to an increase in the number of GPs which was exogenous at the PCT level, we use the policy initiative to test for an effect of increasing competition. We estimate a difference-in-difference model comparing the changes in quality in practices before and after the introduction of the EAPMC in the 18 EAPMC PCTs with the changes in quality in practices in non-EAPMC PCTs. However, the PCTs selected to receive extra EAPMC funds were not selected randomly. They differ from other PCTs in terms of competition, clinical performance, patient satisfaction and demographics (see Appendix Table A8). They are poorer, have higher levels of morbidity and poorer clinical outcomes. This is as expected
11 This is similar to the problems encountered in estimating the effects of hospital competition (see for example, Kessler and McLellan (2000) for the USA and Gaynor, Moreno-Serra and Propper (2013) for the UK).
8 CHE Research Paper 151
since the scheme was specifically targeted to those PCTs in which access to GP services was perceived to be poorer. To deal with this we exploit the fact that the treated PCTs are scattered across England (shown in Figure 2) and share geographical boundaries with non-treated PCTs. The populations in areas along these boundaries are likely to be similar in their socio-economic status and their healthcare need. The secondary care (hospital) facilities available to both practices and patients are also likely to be similar as patients cross PCT boundaries to access hospital care. As a refinement of our difference-in-difference model, we therefore restrict the sample to treated and non-treated practices located within a small distance of the shared boundaries.12 Our baseline model is
jt t jt jt x j jty m x β (1)
where yjt is the quality of practice j in year t, t is a year effect common to all practices, mjt is the measure of competition facing practice j in year t, xjt is a vector of case-mix controls measured either for the practice list population or for the local population, and αj is the time invariant practice fixed effect. The data period is financial years 2005-2012. We estimate this model for all practices in
England and also for practices located in homogeneous area. The coefficient of interest is To exploit the EAPMC policy, we estimate intention to treat difference-in-difference models:
0 1
A E A
jt t j t jt x j jty D D D x β (2)
where E
jD is a dummy for the practice being in one of the EAPMC PCTs, A
tD is a dummy for a year
after the introduction of EAPMC (2009 onwards). To isolate the effect of the policy, we estimate the model for a shorter period than model (1). We use the three years before the policy and three years after and drop the year of the policy introduction, so the data covers financial years 2005 to 2011,
omitting 2008. Standard errors are clustered at the PCT level. The coefficient of interest is
12 See Gibbon and Machin (2003) for this approach in the context of school quality.

Spatial competition and quality: Evidence from the English family doctor market 9
4 Data
4.1 Quality
To capture the multi-dimensional nature of healthcare quality we use a variety of measures of both clinical quality and patient reported experience. Clinical quality. We measure the clinical quality of care in the practice with data from the national Quality and Outcomes Framework (QOF). Almost all practices take part in the QOF, which rewards practices for achievement on a large number of quality indicators. Better achievement increases the number of QOF points (up to a maximum of 1050 in 2004-2005 and 1000 thereafter) and practices are paid an average of £125 per point. We use the percentage of total available points which the practice achieved as a measure of quality (QOF points). It has the merit of being simple and readily observable. However, total QOF points has a number of drawbacks as a measure of clinical quality. First, only around two thirds of the points are for indicators of clinical quality for specific conditions. Second, for most clinical indicators achieving the indicator for an additional patient does not affect the number of points awarded if the percentage of relevant patients for whom the indicator is achieved is less than a lower threshold (usually 40%) or above an upper threshold (which ranged from 60% to 90%). Hence we also measure reported achievement (RA clinical) which is the weighted average of the percentage of patients reported eligible for the indicator for whom the indicator is achieved, taken over the 42 clinical indicators which were consistently defined between 2005 and 2012. The weights are the maximum points available for the indicators. Third, there may be selective exception reporting of patients as ineligible for an indicator (Doran et al 2006; Gravelle et al 2010). We therefore also measure performance on an indicator as the percentage of patients with the relevant condition, rather than the percentage of those declared eligible by the practice, for whom the indicator has been achieved.13 PA clinical is the maximum points weighted average percentage of population achievement for the 42 indicators used in RA clinical. As a further measure of clinical care quality, we use the number of emergency room (hospital) admissions of practice patients for Ambulatory Care Sensitive Conditions (ACSCs). These are conditions for which emergency admissions could be reduced by good quality primary care.14 We use the definition provided by Harrison et al (2014) to count the number of emergency admissions for ACSCs per 1000 patients (ACSC rate) for each practice in each year from 2005 to 2012.15 Patient reported quality. We construct patient reported measures of quality using responses to three questions in the national General Practice Patient Survey (GPPS) administered to a random 5% sample of patients in each practice from 2006 onwards. Open hrs sat is the percentage of respondents satisfied with their GP surgery opening hours (available for 2006-2012); Care sat is the proportion of patients satisfied with overall care in their practice (available for 2008-2012);
13 Population achievement is 100*N/(D+E) where N is the number for whom the indicator is achieved, D is number declared eligible by the practice and E is the number exception reported for the indicator. Reported achievement is 100*N/D 14 Some ACSCs are incentivised by the QOF (e.g. diabetes, asthma) whereas others are not (e.g. anaemia, cellulitis and perforated ulcer). 15 We count both incentivised and non-incentivised ASCS emergency admissions using the admission method and diagnostic fields in the Hospital Episode Statistics (HES) dataset.

10 CHE Research Paper 151
Recommend is the proportion of patients who would or might recommend their practice (available for 2009-2012).16
4.2 Competition
As noted above, competition in GP care is geographically defined as patients primarily seek care by going to their GP in person (or, more rarely, their GP coming to their home). As a result, the probability that a patient is registered with a practice declines rapidly with the distance of the practice from their home. Around 40% of patients register with the nearest practice. A study of a large English region found that the median distance to the nearest practice was 0.84km (mean = 1.2km) and the median distance to the chosen practice was 1.48km (mean =1.88km). The same study also found that the cross-practice elasticity of demand with respect to quality declined rapidly with distance (Santos et al 2017). Based on this, we use 1km as the size of the GP practice market. In defining the number of rivals within this market, we had two choices. The first was the number of rival practices with a branch surgery within 1km of any branch of the target practice. However, over the period we study the number of practices fell from 8451 in 2005 to 8088 in 2012 as small practices have closed. But the total number of GPs increased from 32,738 to 35,415, resulting in an increase in the number of GPs in each practice and a fall in the ratio of patients to GP (from 1613 to 1574). Thus, changes in the number of practices within a given distance from a given practice are a poor measure of the change in the capacity of rival practices to enrol its patients. The second choice was the number of full-time equivalent (FTE) GPs in rival practices within 1km and we use this.17 In robustness checks we examine different definitions of the market.
4.3 Covariates
Practice quality may be influenced by the number and type of patients, so we control for a number of measures of patient volume and type. We have measures of practice demographics (list size, proportion of patients in 12 age and gender groups) and patient morbidity (prevalence of 10 conditions included in the QOF, and the proportion of patients resident in nursing homes). In addition, we attribute two small area measures of socio-economic status (SES) of the practice population. These are (a) the proportion on invalidity and disability social security benefits and (b) a measure of overall deprivation (the Index of Multiple Deprivation (IMD)).18 Both these measures are recorded for small areas (Lower Super Output Areas, LSOA) with mean populations of 1500.19 For each practice, we attribute the weighted mean of the LSOA data where the weights are the proportion of individuals registered with the practice and living in each LSOA. To allow for endogeneity in practice populations we construct case-mix measures for the potential population rather than those on the practice list. For the demographic variables, we use the total population and age/gender proportions for a larger (administrative) area than the immediate neighbourhood. We use the Median Super Output Area (MSOA) in which the practice is located.
16 The wording of the questions changed somewhat over the sample period but we assume that including year dummies in the regression models will allow for this. In other work on the determinants of ACSC admission rates using these variables, we also interacted them with year dummies and found that the interactions were small and rarely significant (available from the authors on request). 17 For replication purposes we also estimated cross sectional model using the same measure of competition as Pike (2010), in which competition was measured as vector of the number of practices within 500m bands from 0-500m to 4500-5000m. We obtained broadly similar results (available from the authors). 18 The IMD combines measures of social and economic deprivation covering seven domains and is used by central government to allocate funding for public services. 19 We use LSOAs defined according to 2001 census boundaries. There were 32,482 LSOAs in England.
Spatial competition and quality: Evidence from the English family doctor market 11
These have an average population of around 7200.20 We include the MSOA population to allow for the possibility that a practice may perceive itself as facing less competition from a given number of GPs in rival practices if the local population is greater. For the morbidity measures, we replace practice prevalence of QOF conditions and the proportion of its patients in nursing homes with the practice list size weighted mean of these variables taken over the practice and its five nearest rivals. We replace the two LSOA based measures of SES with the corresponding MSOA level variables.21 Summary statistics for all covariates are in Appendix Table A1.
4.4 Sample selection
Our main estimates include all practices in England. To examine the impact of potential endogenous selection of location by practices we re-estimate our baseline model (1) on a sample of areas which are homogeneous in terms of SES. Our assumption is that within these areas the lower variation in SES of the population will mean that practices have little incentive to locate at one address versus another. In choosing homogenous areas we face a trade-off. Using a larger geographical unit will provide more within-area variation in practice competition and hence increase precision in estimating the effect of competition. But it will make it less plausible that there is little within-area variation in unobserved factors that might affect practice location. PCTs contain around 50 practices and have populations of over 300,000 on average, so are too large. We, therefore, use the smaller areas defined by Parliamentary Constituencies, which contain on average 15 GP practices and a population of just under 100,000. We select a sub-set of Parliamentary Constituencies which are homogeneous in terms of SES. To do this, we compute the coefficient of variation in SES (as measured by the overall IMD score) across the LSOAs contained within each Parliamentary Constituency.22 As our homogenous sample we select all practices in Parliamentary Constituencies in the bottom quintile of the distribution of the coefficient of variation of the IMD.
4.5 Summary statistics
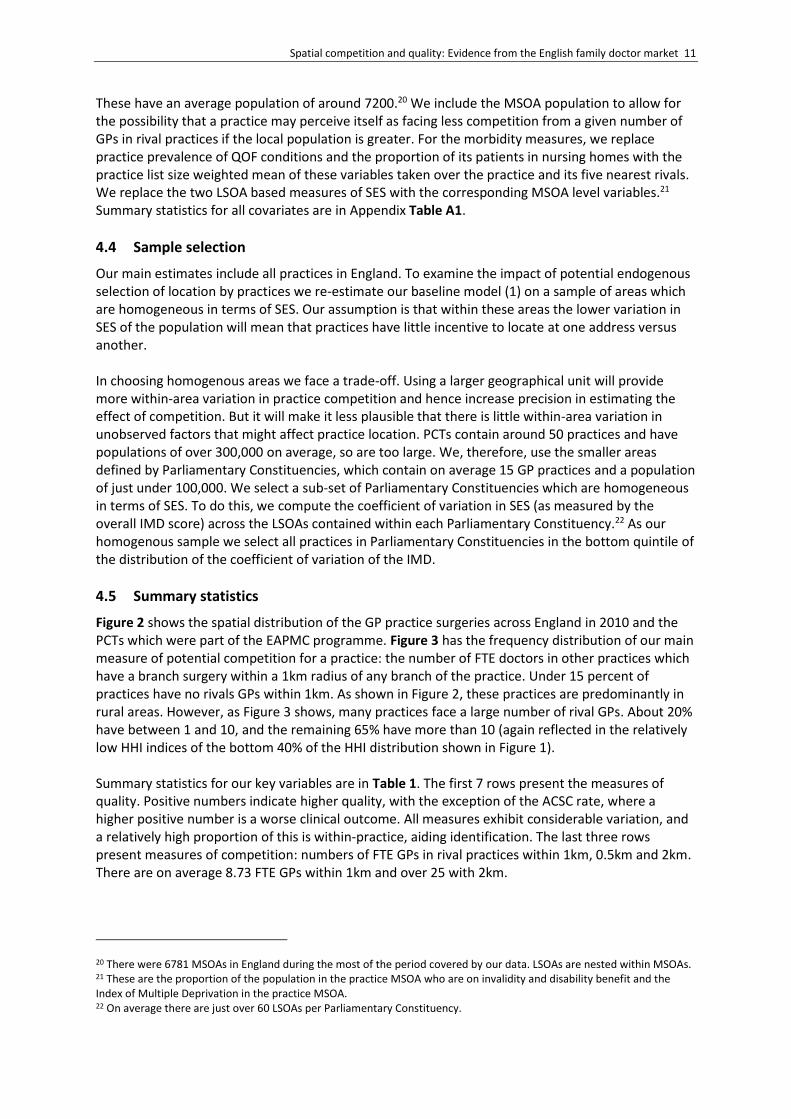
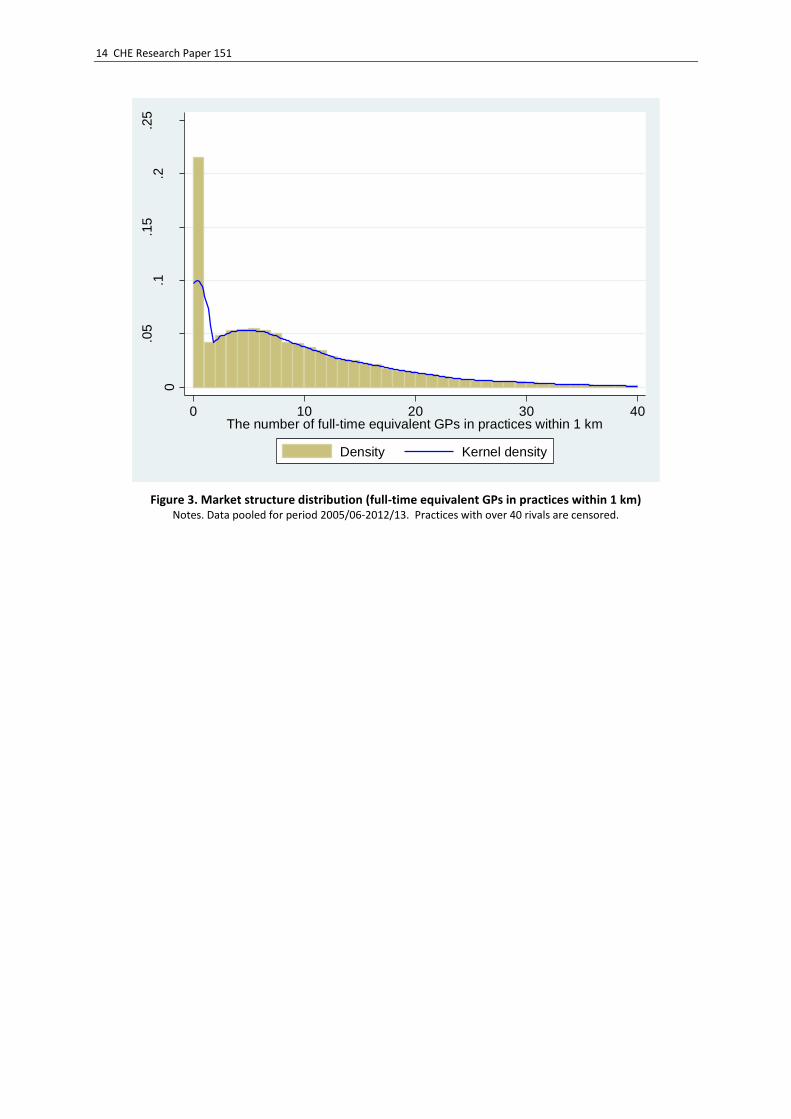
Figure 2 shows the spatial distribution of the GP practice surgeries across England in 2010 and the PCTs which were part of the EAPMC programme. Figure 3 has the frequency distribution of our main measure of potential competition for a practice: the number of FTE doctors in other practices which have a branch surgery within a 1km radius of any branch of the practice. Under 15 percent of practices have no rivals GPs within 1km. As shown in Figure 2, these practices are predominantly in rural areas. However, as Figure 3 shows, many practices face a large number of rival GPs. About 20% have between 1 and 10, and the remaining 65% have more than 10 (again reflected in the relatively low HHI indices of the bottom 40% of the HHI distribution shown in Figure 1). Summary statistics for our key variables are in Table 1. The first 7 rows present the measures of quality. Positive numbers indicate higher quality, with the exception of the ACSC rate, where a higher positive number is a worse clinical outcome. All measures exhibit considerable variation, and a relatively high proportion of this is within-practice, aiding identification. The last three rows present measures of competition: numbers of FTE GPs in rival practices within 1km, 0.5km and 2km. There are on average 8.73 FTE GPs within 1km and over 25 with 2km.
20 There were 6781 MSOAs in England during the most of the period covered by our data. LSOAs are nested within MSOAs. 21 These are the proportion of the population in the practice MSOA who are on invalidity and disability benefit and the Index of Multiple Deprivation in the practice MSOA. 22 On average there are just over 60 LSOAs per Parliamentary Constituency.

12 CHE Research Paper 151
Table 1. Quality and competition measures: summary statistics
Years
Mean SD Min Max Obs
Quality
PA clinical 2005-12 Overall 79.13 4.93 5.90 97.33 63968 Between
4.52 6.06 95.80 8329
Within
2.81 25.75 107.54 T : 7.68
RA clinical 2005-12 Overall 85.21 4.79 5.90 100.00 63968 Between
4.31 6.17 97.55 8329
Within
2.99 28.29 116.57 T : 7.68
QOF points (% of maximum) 2005-12 Overall 95.90 5.39 11.84 100.00 63970 Between
4.91 11.84 100.00 8329
Within
3.52 32.64 127.80 T : 7.68
ACSC rate per 1000 patients 2005-12 Overall 12.43 4.97 0.00 69.54 64000 Between
4.32 0.00 35.88 8348
Within
2.57 -10.56 49.21 T : 7.67
% satisifed with opening hours 2006-12 Overall 82.48 6.72 0.00 100.00 55913 Between
5.80 47.96 98.89 8279
Within
3.51 24.62 108.89 T : 6.75
% satisfied with care 2008-12 Overall 90.14 6.60 40.16 100.00 39684 Between
6.02 57.33 100.00 8103
Within
2.79 66.56 107.59 T : 4.90
% would recommend practice 2009-12 Overall 82.77 10.62 23.00 100.00 31555 Between
10.01 34.28 100.00 8024
Within
3.76 50.66 104.69 T : 3.93
Competition
FTE GPs in practices within 1km 2005-12 Overall 8.73 8.79 0.00 67.45 64676 Between
8.84 0.00 57.46 8351
Within
1.24 -12.26 24.48 T : 7.74
FTE GPs in practices within 0.5km 2005-12 Overall 3.58 4.70 0.00 45.99 64676
Between 4.67 0.00 37.67 8351
Within 0.74 -4.49 17.42 T : 7.74
FTE GPs in practices within 2km 2005-12 Overall 25.46 24.52 0.00 153.43 64676
Between 24.46 0.00 146.49 8351
Within 2.61 -0.65 51.85 T : 7.74
Notes: T = average number of years of observations per practice
Appendix Table A2 presents the cross-section correlations across practices in 2009-12 of the quality and competition measures. The quality measures are generally positively correlated (note the ACSC rate is a negative quality measure) but the correlations suggest that they are picking up different aspects of practice quality. The three clinical measures based on the QOF are highly correlated with each other but are very weakly correlated with the ACSC rate. The three patient based measures are reasonably strongly correlated with each other, especially overall satisfaction and the percentage who would recommend the practice. The clinical and patient reported measures are poorly correlated. The numbers of rival practices and the numbers of GPs in nearby practices are highly correlated cross-sectionally. In cross-section both are negatively correlated with quality, but this may simply reflect differences in population characteristics between more and less densely populated areas.

Spatial competition and quality: Evidence from the English family doctor market 13
Figure 2. EAPMC PCTs and all GP surgeries, England 2010
14 CHE Research Paper 151
Figure 3. Market structure distribution (full-time equivalent GPs in practices within 1 km)
Notes. Data pooled for period 2005/06-2012/13. Practices with over 40 rivals are censored.
0
.05
.1.1
5.2
.25
Den
sity
0 10 20 30 40The number of full-time equivalent GPs in practices within 1 km
Density Kernel density

Spatial competition and quality: Evidence from the English family doctor market 15
5 Results
5.1 Baseline model
Table 2 reports the coefficients on competition and measures of goodness of fit from models estimated for the full sample of all practices over the full period for which the data are available. Panel A has the pooled OLS results with no controls for practice population or morbidity. There are significant negative relationships between the number of rival GPs faced by a practice and both clinical quality and patient satisfaction (essentially what is also shown in Table A2). Panel B includes controls for practice patient characteristics and shows that once these are allowed for the association between number of rivals and quality becomes positive, particularly for the patient satisfaction measures. Panel C allows for unobserved practice heterogeneity by adding in practice fixed effects and shows that controlling for this strengthens the positive relationship between rivals and quality and patient satisfaction. In Panel D we address the possibility that patient type and morbidity may be endogenous and replace the actual practice covariates with measures of the demographics and morbidity of the potential patient pool the practice could draw. The coefficients estimates are close to those of Panel C, indicating that patient selection may not be a large issue in our context.23 To further test this, we restrict the sample to practices in areas that are more homogeneous in population characteristics and re-estimate our preferred model (Table 2, Panel D) using the sample of practices in the most homogenous Parliamentary Constituencies. Results are in Table 3. The coefficient estimates on the number of rival GPs for the clinical quality measures are close to those for the full sample. The coefficient estimates for the patient ratings are larger for satisfaction with opening hours, but smaller and no longer statistically significant at the 5% level for the other two measures of patient satisfaction. But broadly, the results are similar to those using the full sample, again suggesting that selection may not be a major issue in this market. In Table 4, Panel A we exploit the EAPM policy intervention comparing all untreated and all treated practices. The set of outcome variables is smaller than for the baseline analysis as two of the patient reported outcomes are not available for the full period. Three of the five interaction terms (the intention to treat parameters) suggest that quality improved in EAPMC practices during the intervention period and the effects are statistically significant in two of the five cases. In Table 4, Panel B we repeat this analysis but impose the restriction that the practices must lie within 1km of the boundary of an EAPMC PCT to compare only practices which are alike in the populations from which they draw. The pattern of results is very similar to that in Panel A, though somewhat less precisely estimated, reflecting the smaller sample.
23 Full results for Panel D are in Appendix Table A3.

16 CHE Research Paper 151
Table 2. Competition and quality
Covariates Competition Quality measure
(1) (2) (3) (4) (5) (6) (7)
Practice Local PA clinical RA clinical QOF points ACSCs Open hrs sat
Care sat Recommend
FEs Demog Morbid Demog Morbid 2005-12 2005-12 2005-12 2005-12 2006-12 2008-12 2009-12
Panel A N N N N N N rival GPs -0.039*** -0.033*** -0.073*** -0.008 -0.059*** -0.143*** -0.243***
[0.005] [0.005] [0.005] [0.006] [0.007] [0.008] [0.013]
R2 0.022 0.026 0.045 0.002 0.028 0.050 0.054
Obs 63,968 63,968 63,970 64,000 55,913 39,684 31,555
Panel B N Y Y N N N rival GPs 0.006 0.011* 0.007 -0.015*** 0.031*** 0.047*** 0.053***
[0.006] [0.005] [0.005] [0.004] [0.007] [0.007] [0.011]
R2 0.103 0.084 0.172 0.458 0.185 0.358 0.377
Obs 63,623 63,623 63,625 63,467 55,241 39,225 31,248
Panel C Y Y Y N N N rival GPs 0.038** 0.015 0.000 -0.031** 0.096*** 0.071*** 0.058*
[0.015] [0.016] [0.018] [0.011] [0.017] [0.018] [0.028]
Within R2 0.0843 0.0885 0.110 0.0528 0.0847 0.0921 0.117
Obs 63,623 63,623 63,625 63,467 55,241 39,225 31,248
Panel D Y N N Y Y N rival GPs 0.053*** 0.028 0.011 -0.008 0.111*** 0.090*** 0.080** [0.015] [0.016] [0.019] [0.012] [0.017] [0.018] [0.028]
Within R2 0.0485 0.0542 0.0783 0.0101 0.0822 0.0791 0.104
Obs 63,968 63,968 63,970 64,000 55,913 39,684 31,555
Practices 8,329 8,329 8,329 8,348 8,279 8,103 8,024 Notes. Competition measures: N rival GPs: number of full-time equivalent GPs in other practices with at least one branch within 1km of a branch of the practice. All models include year dummies. Practice demography: list size, proportion of list in 12 age/gender bands. Practice morbidity: prevalence of QOF conditions, proportion of patients in nursing homes, attributed proportion of patients on invalidity/disability benefit, attributed income deprivation score. Local demography: total population and proportions of population in age/gender groups in the MSOA in which the practice is located. Local morbidity: prevalence of QOF conditions averaged across practice and its 5 nearest practices, proportion of patients in nursing homes averaged across practice and its five nearest practices, proportion of patients on invalidity or incapacity benefit in the MSOA in which the practice is located, income deprivation score in the MSOA in which the practice is located. Square brackets: robust SEs clustered at practice level. *** p<0.001, ** p<0.01, * p<0.05

Spatial competition and quality: Evidence from the English family doctor market 17
Table 3. Competition and quality within homogeneous Parliamentary Constituencies
(1) (2) (3) (4) (5) (6) (7)
PA clinical
RA clinical
QOF points ACSC Open hrs sat
Care sat Recommend
2005-12 2005-12 2005-12 2005-12 2006-12 2008-12 2009-12
N rival GPs 0.061* 0.035 -0.004 -0.069*** 0.146*** 0.062 0.048
[0.027] [0.030] [0.034] [0.021] [0.029] [0.032] [0.046]
Within R2 0.0813 0.0621 0.0680 0.0240 0.0622 0.0536 0.0723
Obs 15,769 15,769 15,771 15,810 13,842 9,773 7,754
Practices 2,081 2,081 2,081 2,087 2,072 2,013 1,985
Notes. Competition measure: number of FTE GPs in other practices with at least one branch within 1km of a branch of the practice. Sample: practices in 107 Parliamentary Constituencies in the bottom quintile of the coefficient of variation of the LSOA level Index of Multiple Deprivation. All models include practice fixed effects, year effects, local population (total population and proportions of population in age/gender groups in the MSOA in which the practice is located), local morbidity (prevalence of QOF conditions averaged across practice and its 5 nearest practices, proportion of patients in nursing homes averaged across practice and its five nearest practices, proportion of patients on invalidity or incapacity benefit in the MSOA in which the practice is located). Square brackets: robust SEs clustered at practice level. *** p<0.001, ** p<0.01, * p<0.05.
Table 4. Exploiting the EAPMC policy
(1) (2) (3) (4) (5)
PA clinical RA clinical QOF points ACSC Open hrs sat
Panel A: all English practices
After 0.133 -0.245* -2.223*** -0.039 -0.776***
[0.113] [0.111] [0.125] [0.153] [0.190]
After*EAPMC 0.749** 0.784*** 0.434 0.128 -0.400
[0.232] [0.225] [0.232] [0.361] [0.288]
Within R2 0.0313 0.0264 0.0825 0.00599 0.0698
Obs 47,838 47,838 47,839 47,879 39,773
Practices 8,214 8,214 8,214 8,216 8,203
Panel B: practices near EAPMC PCT boundary only
After 0.198 -0.059 -2.476*** -0.138 -0.051
[0.418] [0.327] [0.340] [0.293] [0.729]
After*EAPMC 0.947* 0.858* 0.425 -0.045 -0.466
[0.469] [0.385] [0.395] [0.444] [0.777]
Within R2 0.0691 0.0486 0.0759 0.0185 0.0729
Obs 3,867 3,867 3,867 3,866 3,218
Practices 674 674 674 674 672
Notes: Difference in difference estimates. Years: as in Table 2 except 2008/9 and 2012/13 dropped. After: 2009/10-2011/12. EAPMC: practice is in an EAPMC PCT. Sample for Panel A is all practices, sample for Panel B is all practices within 1km of boundary between EAPMC PCT and non-EAPMC PCT. All models include practice fixed effects, year effects, local population (total population and proportions of population in age/gender groups in the MSOA in which the practice is located), local morbidity (prevalence of QOF conditions averaged across practice and its 5 nearest practices, proportion of patients in nursing homes averaged across practice and its five nearest practices, proportion of patients on invalidity or incapacity benefit in the MSOA in which the practice is located). Square brackets: robust SEs clustered at practice level. *** p<0.001, ** p<0.01, * p<0.05

18 CHE Research Paper 151
5.2 Robustness tests
We now subject our estimates to a series of robustness tests with respect to the definition of the local market and measure of competition. In Table 5 we vary the spatial definition of the market. We decrease the radius to 0.5km (Panel A) and increase it to 2km (Panel B). The results show similar patterns for the satisfaction measures at both these distances. The coefficients are slightly smaller than for our baseline model (Table 2, Row D) for the smaller distance and the results for the larger market radius of 2km are similar (or perhaps a little stronger) than in the baseline model. For the larger radius, the results for the clinical quality measures are similar to those of the baseline model. The results for the smaller radius show no effect on clinical quality. However, this assumes a very small market relative to the average distance between patients and practices (1.2km) and 40% of practices have no rival GPs within this distance. Table 5. Alternative competition radii
(1) (2) (3) (4) (5) (6) (7)
PA clinical RA clinical QOF points
ACSC Open hrs sat
Care sat Recommend
2005-12 2005-12 2005-12 2005-12 2006-12 2008-12 2009-12
Panel A. Number GPs in rival practices within 0.5km
N rival GPs 0.013 -0.003 -0.011 0.022 0.071* 0.067* 0.094*
[0.024] [0.026] [0.029] [0.020] [0.029] [0.030] [0.046]
Within R2 0.0480 0.0541 0.0783 0.0101 0.0811 0.0782 0.104
Panel B. Number GPs in rival practices within 2km
N rival GPs 0.045*** 0.030*** 0.020* -0.005 0.068*** 0.057*** 0.057***
[0.008] [0.008] [0.009] [0.006] [0.009] [0.010] [0.015]
Within R2 0.0494 0.0546 0.0784 0.0101 0.0827 0.0796 0.105
Obs 63,968 63,968 63,970 64,000 55,913 39,684 31,555
Practices 8,329 8,329 8,329 8,348 8,279 8,103 8,024
Notes: Competition measures: N GPs: number of full-time equivalent GPs in other practices with at least one branch within 500 m (model A) or 2 km (model B) of a branch of the practice. All models include practice fixed effects, year effects, local population (total population and proportions of population in age/gender groups in the MSOA in which the practice is located), local morbidity (prevalence of QOF conditions averaged across practice and its 5 nearest practices, proportion of patients in nursing homes averaged across practice and its five nearest practices, proportion of patients on invalidity or incapacity benefit in the MSOA in which the practice is located). Square brackets: robust SEs clustered at practice level. *** p<0.001, ** p<0.01, * p<0.05. We test robustness to our assumption that it is the current innovation in number of rival GPs that matters by replacing the current number with the one-year lagged number of rival GPs. As this shortens our estimation period, we re-estimated our baseline model using the current number of GPs for the same shorter period. The results for lagged rival number of GPs (Appendix Table A4) are a little stronger for clinical quality, but weaker for the patient satisfaction measures. Both sets of estimates are, however, very similar to our baseline estimates. We have argued that the number of GPs in rival practices is a better measure of competition than a count of the number of practices because the latter takes no account of rival practices’ capacity to take on extra patients. But a counter argument is that a single rival practice with n GPs poses less of a competitive threat than two rival practices with n/2 GPs, since practices may be horizontally differentiated by location or other practice characteristics. To test this we added the number of rival practices to our baseline model of Table 2, Panel D. The estimated effects of our preferred measure (the number of GPs in rival practices) are unchanged (Appendix Table A5).
Spatial competition and quality: Evidence from the English family doctor market 19
One challenge to our analysis is that the apparent effect of our measure of competition – the
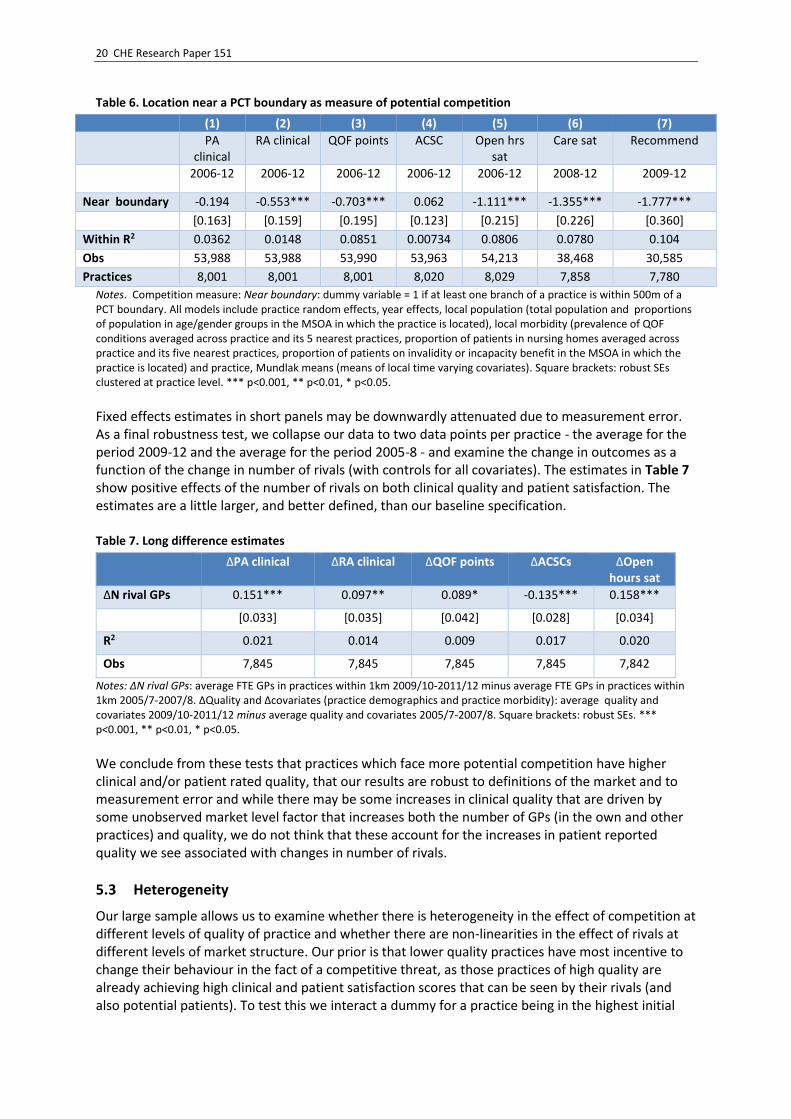
number of GPs in rival practices is due to omitted variable bias arising from the national trend increase in the total number of GPs. If the quality of a practice is affected by the number of its own GPs, then some of the association of the number of GPs in nearby practices with practice quality could be due to correlations in the number of GPs across practices. While our baseline model controls for common time shocks, such shocks may be local. To allow for this, we add the number of own GPs to our baseline model as an additional control. We find that the number of GPs in a practice is, as expected, positively associated with all three of the patient reported quality measures and with two of the four clinical measures. However, adding the number of own GPs to the model leads to only very small reductions (around 1/20th) in the estimated effects of our preferred competition measure (Appendix Table A6). One potential threat to our identification strategy is that what we are picking up are local market wide changes (for example, changes in funding at the PCT level) that lead to increases in both numbers of GPs in the local area, and so the number of rivals, and in own practice quality. To examine this, we add controls for PCT-year effects. This will control for local policies which may have increased quality and number of GPs in all practices, which we could incorrectly attribute to an increase in rival GPs. This is a tough test, as it means all identification comes from practice within-year-PCT variation in number of rivals, which is smaller than the practice within-year variation. The results are reported in Appendix Table A7. They show that the association with clinical measures becomes small and statistically insignificant, but the association with patient satisfaction remains positive and well-defined. As an increase in the number of rivals maybe driven by PCT-level policies, controlling for year*PCT effects maybe over-controlling. If, for example, the within-year PCT increase in number of rivals drives what practices respond to, then by adding year-PCT effects we wipe out this legitimate variation. As a final test of our measure of market structure, we exploit the fact that patients are less likely to choose practices located in a different PCT (Santos et al 2017). There is no legal or formal administrative reason why patients should not cross PCT boundaries. However, preference for practices within the same PCT may reflect the fact that PCT boundaries sometime follow geographical features such as rivers, railway lines or main roads which may make it harder for a patient to access a practice in a different PCT. The corollary is that practices located near boundaries will face less potential competition than would be suggested by a count of the number of GPs in nearby practices. Thus being near a boundary is a measure of a lower degree of rivalry. To examine this, we use being near a boundary as a measure of a practice facing less potential competition and regress quality on a dummy variable for the practice being within 0.5km of a boundary. As this variable is not time-varying we cannot control for practice fixed effects and so estimate a Mundlak (1978) random effects model, adding practice means of all covariates to deal with unobserved heterogeneity. The results in Table 6 show a well-defined negative effect of being near a boundary on quality on all measures except admissions for ambulatory sensitive conditions.24 As PCT boundaries are not co-terminous with travel to work areas, or with other local government administrative areas, there should be little reason why being close to a boundary should mean a practice is of lower quality other than the fact they face less rivals because patients tend to prefer practices within their PCTs.
24 The results in Table 6 exclude practices that are located near the coast to avoid conflating being near a land with being near a coastal boundary. The results are very similar if we include these practice (available from the authors).
20 CHE Research Paper 151
Table 6. Location near a PCT boundary as measure of potential competition
(1) (2) (3) (4) (5) (6) (7)
PA clinical
RA clinical QOF points ACSC Open hrs sat
Care sat Recommend
2006-12 2006-12 2006-12 2006-12 2006-12 2008-12 2009-12
Near boundary -0.194 -0.553*** -0.703*** 0.062 -1.111*** -1.355*** -1.777***
[0.163] [0.159] [0.195] [0.123] [0.215] [0.226] [0.360]
Within R2 0.0362 0.0148 0.0851 0.00734 0.0806 0.0780 0.104
Obs 53,988 53,988 53,990 53,963 54,213 38,468 30,585
Practices 8,001 8,001 8,001 8,020 8,029 7,858 7,780
Notes. Competition measure: Near boundary: dummy variable = 1 if at least one branch of a practice is within 500m of a PCT boundary. All models include practice random effects, year effects, local population (total population and proportions of population in age/gender groups in the MSOA in which the practice is located), local morbidity (prevalence of QOF conditions averaged across practice and its 5 nearest practices, proportion of patients in nursing homes averaged across practice and its five nearest practices, proportion of patients on invalidity or incapacity benefit in the MSOA in which the practice is located) and practice, Mundlak means (means of local time varying covariates). Square brackets: robust SEs clustered at practice level. *** p<0.001, ** p<0.01, * p<0.05.
Fixed effects estimates in short panels may be downwardly attenuated due to measurement error. As a final robustness test, we collapse our data to two data points per practice - the average for the period 2009-12 and the average for the period 2005-8 - and examine the change in outcomes as a function of the change in number of rivals (with controls for all covariates). The estimates in Table 7 show positive effects of the number of rivals on both clinical quality and patient satisfaction. The estimates are a little larger, and better defined, than our baseline specification. Table 7. Long difference estimates
ΔPA clinical ΔRA clinical ΔQOF points ΔACSCs ΔOpen hours sat
ΔN rival GPs 0.151*** 0.097** 0.089* -0.135*** 0.158***
[0.033] [0.035] [0.042] [0.028] [0.034]
R2 0.021 0.014 0.009 0.017 0.020
Obs 7,845 7,845 7,845 7,845 7,842
Notes: ΔN rival GPs: average FTE GPs in practices within 1km 2009/10-2011/12 minus average FTE GPs in practices within 1km 2005/7-2007/8. ΔQuality and Δcovariates (practice demographics and practice morbidity): average quality and covariates 2009/10-2011/12 minus average quality and covariates 2005/7-2007/8. Square brackets: robust SEs. *** p<0.001, ** p<0.01, * p<0.05.
We conclude from these tests that practices which face more potential competition have higher clinical and/or patient rated quality, that our results are robust to definitions of the market and to measurement error and while there may be some increases in clinical quality that are driven by some unobserved market level factor that increases both the number of GPs (in the own and other practices) and quality, we do not think that these account for the increases in patient reported quality we see associated with changes in number of rivals.
5.3 Heterogeneity
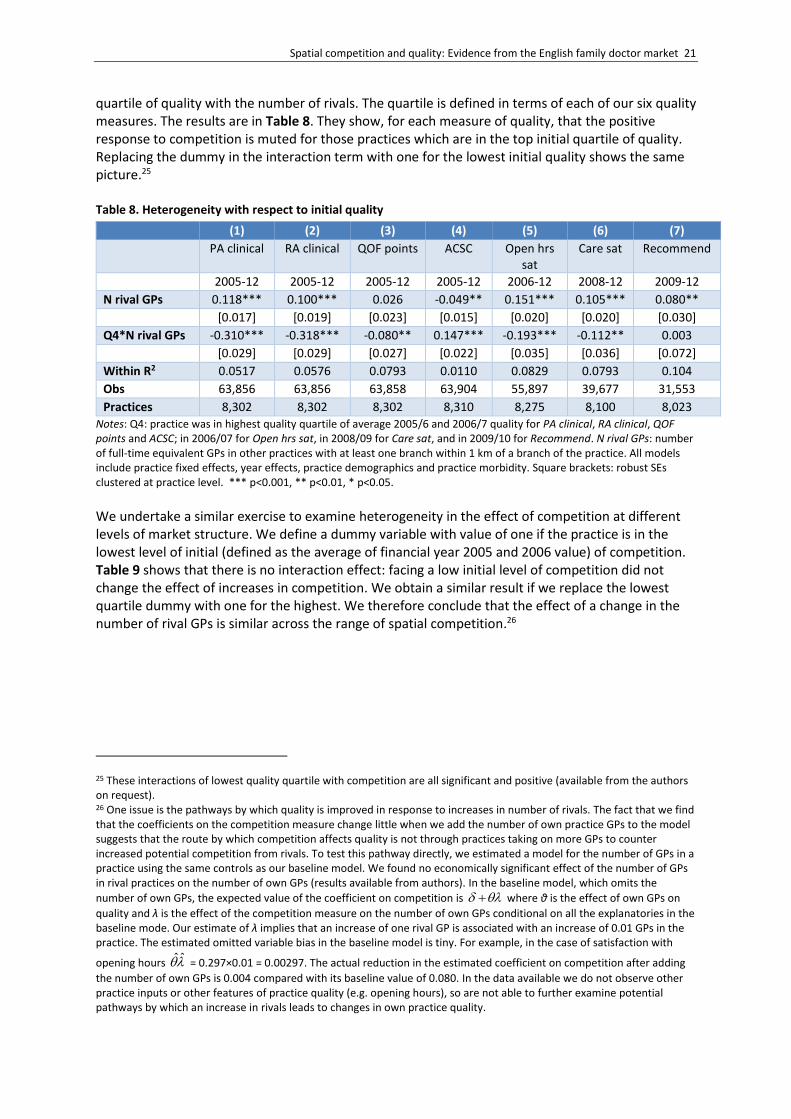
Our large sample allows us to examine whether there is heterogeneity in the effect of competition at different levels of quality of practice and whether there are non-linearities in the effect of rivals at different levels of market structure. Our prior is that lower quality practices have most incentive to change their behaviour in the fact of a competitive threat, as those practices of high quality are already achieving high clinical and patient satisfaction scores that can be seen by their rivals (and also potential patients). To test this we interact a dummy for a practice being in the highest initial
Spatial competition and quality: Evidence from the English family doctor market 21
quartile of quality with the number of rivals. The quartile is defined in terms of each of our six quality measures. The results are in Table 8. They show, for each measure of quality, that the positive response to competition is muted for those practices which are in the top initial quartile of quality. Replacing the dummy in the interaction term with one for the lowest initial quality shows the same picture.25 Table 8. Heterogeneity with respect to initial quality
(1) (2) (3) (4) (5) (6) (7) PA clinical RA clinical QOF points ACSC Open hrs
sat Care sat Recommend
2005-12 2005-12 2005-12 2005-12 2006-12 2008-12 2009-12
N rival GPs 0.118*** 0.100*** 0.026 -0.049** 0.151*** 0.105*** 0.080**
[0.017] [0.019] [0.023] [0.015] [0.020] [0.020] [0.030]
Q4*N rival GPs -0.310*** -0.318*** -0.080** 0.147*** -0.193*** -0.112** 0.003
[0.029] [0.029] [0.027] [0.022] [0.035] [0.036] [0.072]
Within R2 0.0517 0.0576 0.0793 0.0110 0.0829 0.0793 0.104
Obs 63,856 63,856 63,858 63,904 55,897 39,677 31,553
Practices 8,302 8,302 8,302 8,310 8,275 8,100 8,023
Notes: Q4: practice was in highest quality quartile of average 2005/6 and 2006/7 quality for PA clinical, RA clinical, QOF points and ACSC; in 2006/07 for Open hrs sat, in 2008/09 for Care sat, and in 2009/10 for Recommend. N rival GPs: number of full-time equivalent GPs in other practices with at least one branch within 1 km of a branch of the practice. All models include practice fixed effects, year effects, practice demographics and practice morbidity. Square brackets: robust SEs clustered at practice level. *** p<0.001, ** p<0.01, * p<0.05.
We undertake a similar exercise to examine heterogeneity in the effect of competition at different levels of market structure. We define a dummy variable with value of one if the practice is in the lowest level of initial (defined as the average of financial year 2005 and 2006 value) of competition. Table 9 shows that there is no interaction effect: facing a low initial level of competition did not change the effect of increases in competition. We obtain a similar result if we replace the lowest quartile dummy with one for the highest. We therefore conclude that the effect of a change in the number of rival GPs is similar across the range of spatial competition.26
25 These interactions of lowest quality quartile with competition are all significant and positive (available from the authors on request). 26 One issue is the pathways by which quality is improved in response to increases in number of rivals. The fact that we find that the coefficients on the competition measure change little when we add the number of own practice GPs to the model suggests that the route by which competition affects quality is not through practices taking on more GPs to counter increased potential competition from rivals. To test this pathway directly, we estimated a model for the number of GPs in a practice using the same controls as our baseline model. We found no economically significant effect of the number of GPs in rival practices on the number of own GPs (results available from authors). In the baseline model, which omits the
number of own GPs, the expected value of the coefficient on competition is where θ is the effect of own GPs on
quality and λ is the effect of the competition measure on the number of own GPs conditional on all the explanatories in the baseline mode. Our estimate of λ implies that an increase of one rival GP is associated with an increase of 0.01 GPs in the practice. The estimated omitted variable bias in the baseline model is tiny. For example, in the case of satisfaction with
opening hours ˆ ˆ = 0.297×0.01 = 0.00297. The actual reduction in the estimated coefficient on competition after adding
the number of own GPs is 0.004 compared with its baseline value of 0.080. In the data available we do not observe other practice inputs or other features of practice quality (e.g. opening hours), so are not able to further examine potential pathways by which an increase in rivals leads to changes in own practice quality.

22 CHE Research Paper 151
Table 9. Non-linear effects of competition
(1) (2) (3) (4) (5) (6) (7)
PA clinical RA clinical QOF points
ACSC Open hrs sat
Care sat Recommend
2005-12 2005-12 2005-12 2005-12 2006-12 2008-12 2009-12
N rival GPs 0.055*** 0.030 0.012 -0.009 0.113*** 0.089*** 0.079**
[0.015] [0.016] [0.019] [0.012] [0.017] [0.018] [0.028]
Q1*N rival GPs -0.214 -0.178 -0.109 0.042 -0.112 -0.005 -0.099
[0.147] [0.147] [0.153] [0.090] [0.108] [0.105] [0.219]
Within R2 0.0487 0.0545 0.0785 0.0100 0.0824 0.0790 0.105
Obs 63,879 63,879 63,881 63,906 55,822 39,622 31,508
Practices 8,307 8,307 8,307 8,312 8,261 8,087 8,009
Notes: N rival GPs: number of full-time equivalent GPs in other practices with at least one branch within 1 km of a branch of the practice. We use a balanced panel and divide the practice sample into quartiles of the distribution of average competition over the period 2005/6 to 2006/7. Q1: practice was in the bottom quartile of distribution of competition for 2005/6 to 2006/7. All models include practice fixed effects, year effects, practice demographics and practice morbidity. Square brackets: robust SEs clustered at practice level. *** p<0.001, ** p<0.01, * p<0.05.
5.4 Magnitude of the effects
The results broadly support the view that competition between GPs in geographical space increases either clinical quality or patient reported quality or both. However, the magnitude of the effect is small. For example, the coefficient of 0.053 in the fixed effects estimates of Table 2, Panel D, indicates that one extra GP in a rival practice increases clinical performance, as measured by population achievement (the percentage of the practice population for whom the QOF clinical indicators have been achieved) by 0.053%. This is only 0.01 of the standard deviation of the clinical quality measure. The effect of one additional GP in rival practices on the percentage satisfied with care is 0.14 of the standard deviation of this quality measure. The difference in difference estimates of the effect of EAPMC are also modest: the clinical measure of population achievement increased by 0.75% in EAPMC practices relative to practices in non-EAPMC PCTs. Although these are small effects, they need to be set in the context of production of clinical quality in general practices. In this setting, individual policy interventions do not have dramatic effects. For example, the UK QOF was the world’s most elaborate pay for clinical performance scheme paying practices around £1 billion per year. It had no detectable effect on overall population mortality, nor on mortality from ischaemic heart disease (one of the most strongly incentivised parts of the QOF, Ryan et al 2016), nor on premature mortality (Kontopanatelis et al 2015). It also had, at best, small effects in improving quality of care for chronic diseases which was its main rationale (Gillam et al 2012; Guthrie 2016; Langdown and Peckham 2014). Other incentive schemes policies for family physicians have had similarly modest effects (Scott et al 2011).

Spatial competition and quality: Evidence from the English family doctor market 23
6 Conclusions
In this paper we examine the relationship between market structure and quality in healthcare. We exploit the universe of all family physician practices in England to examine whether potential competition from rivals increases quality, the latter measured by both clinical quality of care and patient satisfaction. There is no price competition as patients are fully insured, so this is an ideal setting in which to examine the relationship between market structure and quality. In common with other literature on hospital and physician markets, we define potential competition spatially, basing the distance defining the local markets faced by providers on studies of patient choice in the English market. To get plausibly causal estimates we use within practice estimators with a large number of controls to deal with patient and practice selection of location and complement this by exploiting a policy shock which was intended to increase the availability of family physician care in selected areas. We, in contrast to most other studies of healthcare markets, use both clinical and patient assessed measures of quality. We subject our estimates to a number of robustness tests. In contrast to almost all studies in this area, we also examine heterogeneity in the effect of rivals, thanks to the fact we use the universe of all practices (firms) in the market as our sample. We find that the effect of increasing the number of rivals is positive and is larger for those practices which are located at the lower end of the quality spectrum. Our results do not appear to be driven by patient selection of practices or practice selection of patients or endogeneity of GP location. However, the effects are modest. This may reflect the fact that physicians’ efforts to improve quality are driven by considerations that are not purely financial, such as a concern for patient wellbeing (McGuire 2000). But it may also be due to the fact that entry into this market is still relatively heavily regulated, protecting practices from the impact of their new rivals. In this case, a policy prescription would be to push further and faster with policies to increase competition, building on the UK government’s recent policies to increase information and relax constraints on choice of family physician by individuals (Mays et al 2014). More generally, our results provide some support for policies that aim to increase healthcare productivity by promoting competition (including those of the governments of the U.S. and the Netherlands, Germany, the U.K., Sweden, and Norway). The
setting we examine fully covered patients and physicians reimbursed by centrally determined
prices or funding is common in many healthcare systems. The incentives facing family physicians in many healthcare systems are similar to those we examine here: to attract patients to earn revenues subject to convex effort costs. This all suggests that the results we find are likely to be generalisable to contexts outside the U.K. setting, although empirical testing of this is clearly required in any specific institutional context. Finally, although we have shown evidence of a positive effect of competition on quality of care, this does not answer the normative question of whether welfare is unambiguously increased by greater competition. What our results do suggest is that benefits from competition should enter into any social cost–benefit analysis. Policies that focus on increasing the demand elasticity facing physicians in local markets, for example through information, incentives and loosening of entry restrictions are likely to have positive effects on quality.

24 CHE Research Paper 151
References
Asaria M, Cookson R, Fleetcroft R, Ali S. 2015. Unequal socioeconomic distribution of the primary care workforce: whole-population small area longitudinal study. BMJ Open 2016;5e0088783. doi:10.1136/bmjopen-2015-008783. Baker L, Bundorf M, Royalty A, Levin Z. 2014. Physician practice competition and prices paid by private insurers for office visits. Journal of the American Medical Association;312(16):1653–62. Berry S, Waldfogel J. 2001. Do Mergers Increase Product Variety? Evidence from Radio Broadcasting. Quarterly Journal of Economics;116(3):1009–25. Bloom N, Propper C, Seiler S, Van Reenen J. 2015. The impact of competition on management quality: evidence from public hospitals. Review of Economic Studies;82(2):457–89. Brekke K, Holmas T, Monstad K, Straume O. 2017. Competition and physician behaviour: does the competitive environment affect the propensity to issue sickness certificates? Norwegian School of Economics, SAM 03, 2017. Capps C, Dranove D, Ody C. 2017. Physician practice consolidation driven by small acquisitions, antitrust agencies have few tools to intervene. Health Affairs;36(9):1556–64. Clemens J, Gottlieb JD. 2017. In the shadow of a giant: Medicare’s influence on private physician payments. Journal of Political Economy;125 (1):1–39. Cooper Z, Gibbons S, Jones S, McGuire A. 2011. Does hospital competition save lives? Evidence from the English patient choice reforms. Economic Journal;121:pp:F228–F260. Department of Health. Equitable Access to Primary Medical Care Services. 2007. http://webarchive.nationalarchives.gov.uk/+/www.dh.gov.uk/en/Aboutus/Procurementandproposals/Procurement/ProcurementatPCTs/index.htm. Dietrichson J, Ellegard L, Kjellsson G. 2016. Effects of increased competition on quality of primary care in Sweden. Lund Unversity Department of Economics Working Paper 2016:36. Doran T, Fullwood C, Gravelle H, Reeves D, Kontopantelis E, Hiroeh U, Roland M. 2006. Pay-for-performance programs in family practices in the United Kingdom. New England Journal of Medicine; 355: 375–384. Fan Y. 2013. Ownership consolidation and product characteristics: A study of the US daily newspaper market. American Economic Review 2013;103(5):1598–1628. Fulton B. 2017. Health care market concentration trends in the United States: evidence and policy responses. Health Affairs;36(9):1530-1538. Gaynor M, Town R. 2012. Competition in Health Care Markets. In Handbook of Health Economics, Vol. 2, ed. by MV Pauly, TG Mcguire, PP Barros. Amsterdam: Elsevier, 499–637. Gaynor M, Propper C, Seiler S. 2016. Free to choose: Reform, choice and consideration sets in the English National Health Service. American Economic Review;166(11):3521-57.

Spatial competition and quality: Evidence from the English family doctor market 25
Gaynor M, Moreno-Serra R, Propper C. 2013. Death by market power: reform, competition and patient outcomes in the National Health Service. American Economic Journal: Economic Policy; 5:134-166. Gibbons S, Machin S. 2003. Valuing English primary schools. Journal of Urban Economics;53:197-219. Gillam S, Siriwardena A, Steel N. 2012. Pay-for-performance in the United Kingdom: impact of the Quality and Outcomes Framework – a systematic review. Annals of Family Medicine;10:461-468. Glied S, Altman S. 2017. Beyond antitrust: Health care and health insurance market trends and the future of competition. Health Affairs;36:1572-1577. Gravelle H, Moscelli G, Santos R, Siciliani L. 2014. The effects of market structure and patient choice on mortality for AMI, hip fracture, and stroke patients. CHE Research Paper 106. Centre for Health Economics, University of York. Gravelle H, Scott A, Sivey P, Yong Y. Competition, prices and quality in the market for physician consultations. Journal of Industrial Economics 2016;65(1):135-169. Gravelle H, Sutton M, Ma A. 2010. Doctor behaviour under a pay for performance contract: treating, cheating and case finding? The Economic Journal;120(542):F129-F156. Guthrie B, Tang J. 2016. What did we learn from 12 years of QOF? Scottish School of Primary Care Literature Review. http://www.sspc.ac.uk/media/media_486342_en.pdf Harrison M, Dusheiko M, Sutton M, Gravelle H, Doran T, Roland M. 2014. Effect of a national primary care pay for performance scheme on emergency hospital admissions for ambulatory care sensitive conditions: controlled longitudinal study. British Medical Journal;349:6423. Kessler D, McClellan M. 2000. Is hospital competition socially wasteful? Quarterly Journal of Economics;115:577-615. Kontopantelis E, Springate D, Ashworth M, Webb R, Buchan I, Doran T. 2015. Investigating the relationship between quality of primary care and premature mortality in England: a spatial whole-population study. British Medical Journal;doi:10.1136/bmj.h904 350:h904. Langdown C, Peckham S. 2014. The use of financial incentives to help improve health outcomes: is the quality and outcomes framework fit for purpose? A systematic review. Journal of Public Health;36(2):251-258. Matsa D. 2011. Competition and product quality in the supermarket industry. The Quarterly Journal of Economics;126:1539–1591. Mays N, Tan S, Eastmure E, Erens B, Lagarde M, Wright M. 2014. Potential impact of removing general practice boundaries in England: a policy analysis. Health Policy;118:273-278. Mazzeo J. 2003. Product choice and oligopoly market structure. RAND Journal of Economics;33(2): 221–42.
26 CHE Research Paper 151
McGuire T. 2000. Physician Agency. In A. Culyer and J. Newhouse (eds). Handbook of Health Economics, Volume 1A. North-Holland. Amsterdam. Mundlak Y. 1978. On the pooling of time series and cross section data. Econometrica;461:69-85. doi:10.2307/1913646. Munro J, Sampson F, Pickin M, Nicholl J. 2002. Patient De-Registration from GP Lists: and Professional and Patient perspectives. Medical Care Research Unit, University of Sheffield. Final report to the Department of Health. http://www.shef.ac.uk/scharr/sections/hsr/mcru/pastreports. OECD. 2012. Competition in Hospital Services. OECD Policy Roundtables, Directorate for Financial and Enterprise Affairs Competition Committee; available at www.oecd.org/daf/competition/50527122.pdf Pike C. 2010. An empirical analysis of the effects of GP competition. Co-operation and Competition Panel, Working Paper Series, Volume 1, No. 2. Roland M. 2004. Linking physician pay to quality of care: a major experiment in the UK. New England Journal of Medicine;351:1448–1454. Ryan AM, Krinsky S, Kontopantelis E, Doran T. 2016. Long-term evidence for the effect of pay-for-performance in primary care on mortality in the UK: a population study. Lancet;388:268-274. Santos R, Gravelle H, Propper C. 2017. Does quality affect patients’ choice of doctor? Evidence from the UK. Economic Journal;127:445-494:DOI:10.1111/ecoj.12282. Schaumans C. 2015. Prescribing behaviour of general practitioners: competition matters. Health Policy;119(4):456–463. Scott A, Sivey P, Ait Ouakrim D, Willenberg L, Naccarella L, Furler J, Young D. 2011. The effect of financial incentives on the quality of health care provided by primary care physicians. Cochrane Library;Issue 9. Sun E, Baker LC. 2015. Concentration in orthopaedic markets was associated with a 7 percent increase in physician fees for total knee replacements. Health Affairs;34(6):916–21.

Spatial competition and quality: Evidence from the English family doctor market 27
Appendix
Table A1. Covariate summary statistics (2005/6-2012/13)
Mean SD Min Max Obs
Local (MSOA) covariates
Total population (‘000s) Overall 7.99 1.60 3.50 17.08 64676
Between
1.57 4.70 15.81 8351
Within
0.30 5.17 11.80 T : 7.74
% of males d 0-15 Overall 9.78 2.04 1.14 19.39 64676
Between 2.01 1.64 19.05 8351
Within 0.37 7.40 13.31 T : 7.74
% of males 16-24 Overall 6.20 2.82 2.45 35.61 64676
Between 2.78 2.73 34.35 8351
Within 0.44 0.88 11.82 T : 7.74
% of males 50-64 Overall 8.49 1.93 1.23 14.50 64676
Between 1.92 1.43 13.96 8351
Within 0.28 6.74 10.57 T : 7.74
% of males at least 65 Overall 6.78 2.37 0.80 20.79 64676
Between 2.33 1.07 18.80 8351
Within 0.41 4.38 9.06 T : 7.74
% of females 0-15 Overall 9.32 1.97 0.92 19.10 64676
Between 1.94 1.50 18.78 8351
Within 0.35 7.17 13.21 T : 7.74
% of females 16-24 Overall 6.15 2.89 2.12 42.59 64676
Between 2.85 2.27 39.24 8351
Within 0.43 -0.75 12.39 T : 7.74
% of females 25-49 Overall 17.82 2.75 4.53 32.62 64676
Between 2.73 5.02 31.09 8351
Within 0.43 13.37 20.95 T : 7.74
% of females 50-64 Overall 6.57 1.96 0.95 14.22 64676
Between 1.48 1.17 10.77 8351
Within 1.29 4.41 11.08 T : 7.74
% of females at least 65 Overall 10.91 3.86 0.69 33.16 64676
Between 3.68 1.35 31.52 8351
Within 1.19 6.22 13.94 T : 7.74
% of residents on benefits Overall 5.16 2.46 0.28 17.76 64676
Between 2.43 0.40 17.36 8351
Within 0.31 3.06 9.59 T : 7.74
Income IMD score Overall 17.52 11.04 0.73 66.91 64676
Between 10.98 1.01 60.41 8351
Practice plus 5 nearest rivals
Within 1.49 -0.38 32.04 T : 7.74
Nursing home patients (‘000s) Overall 5.21 3.40 0.00 73.44 64676
Between 1.84 0.00 14.79 8351
Within 2.87 -7.60 65.60 T : 7.74
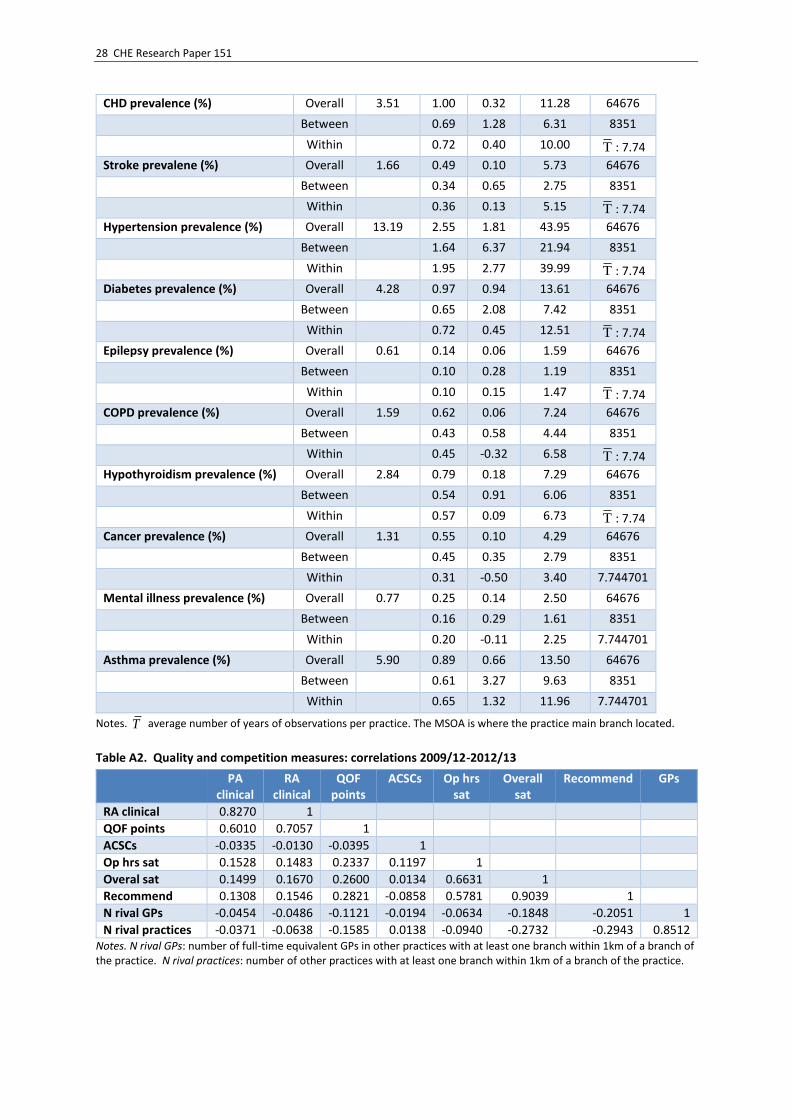
28 CHE Research Paper 151
CHD prevalence (%) Overall 3.51 1.00 0.32 11.28 64676
Between 0.69 1.28 6.31 8351
Within 0.72 0.40 10.00 T : 7.74
Stroke prevalene (%) Overall 1.66 0.49 0.10 5.73 64676
Between 0.34 0.65 2.75 8351
Within 0.36 0.13 5.15 T : 7.74
Hypertension prevalence (%) Overall 13.19 2.55 1.81 43.95 64676
Between 1.64 6.37 21.94 8351
Within 1.95 2.77 39.99 T : 7.74
Diabetes prevalence (%) Overall 4.28 0.97 0.94 13.61 64676
Between 0.65 2.08 7.42 8351
Within 0.72 0.45 12.51 T : 7.74
Epilepsy prevalence (%) Overall 0.61 0.14 0.06 1.59 64676
Between 0.10 0.28 1.19 8351
Within 0.10 0.15 1.47 T : 7.74
COPD prevalence (%) Overall 1.59 0.62 0.06 7.24 64676
Between 0.43 0.58 4.44 8351
Within 0.45 -0.32 6.58 T : 7.74
Hypothyroidism prevalence (%) Overall 2.84 0.79 0.18 7.29 64676
Between 0.54 0.91 6.06 8351
Within 0.57 0.09 6.73 T : 7.74
Cancer prevalence (%) Overall 1.31 0.55 0.10 4.29 64676
Between 0.45 0.35 2.79 8351
Within 0.31 -0.50 3.40 7.744701
Mental illness prevalence (%) Overall 0.77 0.25 0.14 2.50 64676
Between 0.16 0.29 1.61 8351
Within 0.20 -0.11 2.25 7.744701
Asthma prevalence (%) Overall 5.90 0.89 0.66 13.50 64676
Between 0.61 3.27 9.63 8351
Within 0.65 1.32 11.96 7.744701
Notes. T average number of years of observations per practice. The MSOA is where the practice main branch located.
Table A2. Quality and competition measures: correlations 2009/12-2012/13
PA clinical
RA clinical
QOF points
ACSCs Op hrs sat
Overall sat
Recommend GPs
RA clinical 0.8270 1
QOF points 0.6010 0.7057 1
ACSCs -0.0335 -0.0130 -0.0395 1
Op hrs sat 0.1528 0.1483 0.2337 0.1197 1
Overal sat 0.1499 0.1670 0.2600 0.0134 0.6631 1
Recommend 0.1308 0.1546 0.2821 -0.0858 0.5781 0.9039 1
N rival GPs -0.0454 -0.0486 -0.1121 -0.0194 -0.0634 -0.1848 -0.2051 1
N rival practices -0.0371 -0.0638 -0.1585 0.0138 -0.0940 -0.2732 -0.2943 0.8512 Notes. N rival GPs: number of full-time equivalent GPs in other practices with at least one branch within 1km of a branch of the practice. N rival practices: number of other practices with at least one branch within 1km of a branch of the practice.
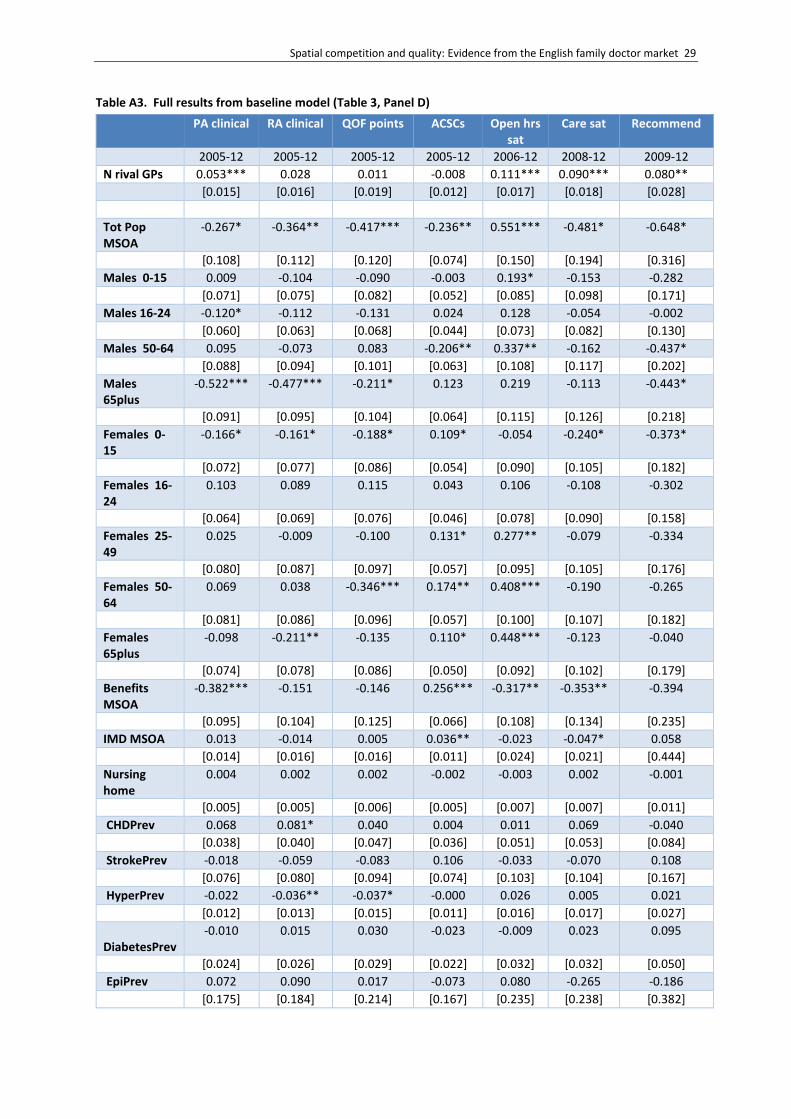
Spatial competition and quality: Evidence from the English family doctor market 29
Table A3. Full results from baseline model (Table 3, Panel D)
PA clinical RA clinical QOF points ACSCs Open hrs sat
Care sat Recommend
2005-12 2005-12 2005-12 2005-12 2006-12 2008-12 2009-12
N rival GPs 0.053*** 0.028 0.011 -0.008 0.111*** 0.090*** 0.080**
[0.015] [0.016] [0.019] [0.012] [0.017] [0.018] [0.028]
Tot Pop MSOA
-0.267* -0.364** -0.417*** -0.236** 0.551*** -0.481* -0.648*
[0.108] [0.112] [0.120] [0.074] [0.150] [0.194] [0.316]
Males 0-15 0.009 -0.104 -0.090 -0.003 0.193* -0.153 -0.282
[0.071] [0.075] [0.082] [0.052] [0.085] [0.098] [0.171]
Males 16-24 -0.120* -0.112 -0.131 0.024 0.128 -0.054 -0.002
[0.060] [0.063] [0.068] [0.044] [0.073] [0.082] [0.130]
Males 50-64 0.095 -0.073 0.083 -0.206** 0.337** -0.162 -0.437*
[0.088] [0.094] [0.101] [0.063] [0.108] [0.117] [0.202]
Males 65plus
-0.522*** -0.477*** -0.211* 0.123 0.219 -0.113 -0.443*
[0.091] [0.095] [0.104] [0.064] [0.115] [0.126] [0.218]
Females 0-15
-0.166* -0.161* -0.188* 0.109* -0.054 -0.240* -0.373*
[0.072] [0.077] [0.086] [0.054] [0.090] [0.105] [0.182]
Females 16-24
0.103 0.089 0.115 0.043 0.106 -0.108 -0.302
[0.064] [0.069] [0.076] [0.046] [0.078] [0.090] [0.158]
Females 25-49
0.025 -0.009 -0.100 0.131* 0.277** -0.079 -0.334
[0.080] [0.087] [0.097] [0.057] [0.095] [0.105] [0.176]
Females 50-64
0.069 0.038 -0.346*** 0.174** 0.408*** -0.190 -0.265
[0.081] [0.086] [0.096] [0.057] [0.100] [0.107] [0.182]
Females 65plus
-0.098 -0.211** -0.135 0.110* 0.448*** -0.123 -0.040
[0.074] [0.078] [0.086] [0.050] [0.092] [0.102] [0.179]
Benefits MSOA
-0.382*** -0.151 -0.146 0.256*** -0.317** -0.353** -0.394
[0.095] [0.104] [0.125] [0.066] [0.108] [0.134] [0.235]
IMD MSOA 0.013 -0.014 0.005 0.036** -0.023 -0.047* 0.058
[0.014] [0.016] [0.016] [0.011] [0.024] [0.021] [0.444]
Nursing home
0.004 0.002 0.002 -0.002 -0.003 0.002 -0.001
[0.005] [0.005] [0.006] [0.005] [0.007] [0.007] [0.011]
CHDPrev 0.068 0.081* 0.040 0.004 0.011 0.069 -0.040
[0.038] [0.040] [0.047] [0.036] [0.051] [0.053] [0.084]
StrokePrev -0.018 -0.059 -0.083 0.106 -0.033 -0.070 0.108
[0.076] [0.080] [0.094] [0.074] [0.103] [0.104] [0.167]
HyperPrev -0.022 -0.036** -0.037* -0.000 0.026 0.005 0.021
[0.012] [0.013] [0.015] [0.011] [0.016] [0.017] [0.027]
DiabetesPrev
-0.010 0.015 0.030 -0.023 -0.009 0.023 0.095
[0.024] [0.026] [0.029] [0.022] [0.032] [0.032] [0.050]
EpiPrev 0.072 0.090 0.017 -0.073 0.080 -0.265 -0.186
[0.175] [0.184] [0.214] [0.167] [0.235] [0.238] [0.382]

30 CHE Research Paper 151
COPDPrev -0.090* -0.073 -0.025 -0.010 -0.001 0.004 -0.005
[0.045] [0.047] [0.054] [0.040] [0.058] [0.057] [0.093]
HypoPrev 0.006 -0.014 -0.006 -0.006 -0.027 -0.011 -0.075
[0.033] [0.035] [0.041] [0.031] [0.044] [0.046] [0.071]
CancerPrev 0.032 0.109 0.140 -0.022 -0.069 -0.084 -0.029
[0.068] [0.072] [0.082] [0.061] [0.090] [0.092] [0.146]
MHPrev 0.041 0.057 -0.007 0.073 0.030 0.008 -0.032
[0.069] [0.074] [0.087] [0.063] [0.091] [0.089] [0.145]
AsthmaPrev 0.010 -0.005 0.010 -0.018 -0.017 0.021 -0.002
[0.022] [0.023] [0.026] [0.020] [0.028] [0.029] [0.046]
year2006 0.324*** 1.853*** -0.816*** -0.393***
[0.054] [0.058] [0.064] [0.045]
year2007 1.596*** 2.333*** 0.431*** -0.654*** -1.811***
[0.066] [0.072] [0.074] [0.051] [0.049]
year2008 1.747*** 2.229*** -0.999*** -0.442*** -2.641***
[0.078] [0.086] [0.089] [0.061] [0.071]
year2009 1.194*** 1.660*** -2.433*** -0.524*** -2.148***
-0.436***
[0.090] [0.098] [0.105] [0.067] [0.094] [0.048]
year2010 1.670*** 2.003*** -1.684*** -0.259*** -3.034***
-0.665*** -0.218**
[0.106] [0.115] [0.123] [0.078] [0.114] [0.073] [0.073]
year2011 1.750*** 1.855*** 1.184*** -0.670*** -0.551** -0.847*** -0.689**
[0.157] [0.164] [0.188] [0.124] [0.196] [0.181] [0.249]
year2012 1.297*** 1.607*** 0.411* -0.837*** -1.650***
-1.857*** -2.137***
[0.165] [0.174] [0.201] [0.131] [0.207] [0.192] [0.265]
Constant 85.91*** 96.13*** 109.45*** 7.82** 61.05*** 107.47*** 112.03***
[4.189] [4.527] [5.091] [2.922] [5.102] [5.807] [12.518]
Observations 63,968 63,968 63,970 64,000 55,913 39,684 31,555
Practices 8,329 8,329 8,329 8,348 8,279 8,103 8,024
Within R2 0.0485 0.0542 0.0783 0.0101 0.0822 0.0791 0.104 Notes. Competition measures: N rival GPs: number of full-time equivalent GPs in other practices with at least one branch within 1km of a branch of the practice. All models include practice fixed effects. Square brackets: robust SEs clustered at practice level. *** p<0.001, ** p<0.01, * p<0.05

Spatial competition and quality: Evidence from the English family doctor market 31
Table A4. Robustness test: lagged effect of competition
(1) (2) (3) (4) (5) (6) (7)
PA clinical
RA clinical
QOF points ACSC Open hrs sat
Care sat Recommend
2006-12 2006-12 2006-12 2006-12 2006-12 2008-12 2009-12
Panel A: lagged competition
N rival GPs lagged 0.048** 0.019 0.011 -0.003 0.041* 0.076*** 0.094***
[0.015] [0.016] [0.021] [0.013] [0.017] [0.020] [0.028]
Within R2 0.0362 0.0150 0.0869 0.00716 0.0812 0.0787 0.105
Obs 55,672 55,672 55,674 55,657 55,890 39,677 31,549
Practices 8,249 8,249 8,249 8,270 8,278 8,102 8,023
Panel B: current competition
N rival GPs 0.030* 0.014 0.011 -0.022 0.111*** 0.090*** 0.080**
[0.015] [0.017] [0.021] [0.013] [0.017] [0.018] [0.028]
Within R2 0.0359 0.0150 0.0869 0.00732 0.0822 0.0791 0.104
Obs 55,694 55,694 55,696 55,673 55,913 39,684 31,555
Practices 8,251 8,251 8,251 8,270 8,279 8,103 8,024
Notes: Competition measures: N rival GPs or N rival GPs lagged: number of full-time equivalent GPs in other practices with at least one branch within 1km of a branch of the practice in current or previous year. All models include practice fixed effects, year effects, local population (total population and proportions of population in age/gender groups in the MSOA in which the practice is located), local morbidity (prevalence of QOF conditions averaged across practice and its 5 nearest practices, proportion of patients in nursing homes averaged across practice and its five nearest practices, proportion of patients on invalidity or incapacity benefit in the MSOA in which the practice is located). Square brackets: robust SEs clustered at practice level. *** p<0.001, ** p<0.01, * p<0.05 Table A5. Robustness test: with numbers of rival and own GPs
(1) (2) (3) (4) (5) (6) (7)
PA clinical
RA clinical
QOF points ACSC Open hrs sat
Care sat Recommend
2006-12 2006-12 2006-12 2006-12 2006-12 2008-12 2009-12
N rival GPs 0.057*** 0.032 0.015 -0.016 0.114*** 0.086*** 0.080**
[0.015] [0.016] [0.019] [0.012] [0.017] [0.018] [0.028]
N rival practices -0.177* -0.170* -0.182* 0.307*** -0.110 0.119 0.005
[0.076] [0.082] [0.091] [0.062] [0.089] [0.096] [0.150]
Within R2 0.0487 0.0544 0.0785 0.0110 0.0822 0.0792 0.104
Obs 63,968 63,968 63,970 64,000 55,913 39,684 31,555
Practices 8,329 8,329 8,329 8,348 8,279 8,103 8,024
Notes: N rival GPs: number of full-time equivalent GPs in other practices with at least one branch within 1km of a branch of the practice. N rival practices: number of other practices with at least one branch within 1km of a branch of the practice. All models include practice fixed effects, year effects, local population (total population and proportions of population in age/gender groups in the MSOA in which the practice is located), local morbidity (prevalence of QOF conditions averaged across practice and its 5 nearest practices, proportion of patients in nursing homes averaged across practice and its five nearest practices, proportion of patients on invalidity or incapacity benefit in the MSOA in which the practice is located). Square brackets: robust SEs clustered at practice level. *** p<0.001, ** p<0.01, * p<0.05

32 CHE Research Paper 151
Table A6. Robustness test: numbers of rival and own GPs
(1) (2) (3) (4) (5) (6) (7)
PA clinical
RA clinical
QOF points ACSC Open hrs sat
Care sat Recommend
2006-12 2006-12 2006-12 2006-12 2006-12 2008-12 2009-12
N rival GPs 0.054*** 0.028 0.009 -0.006 0.109*** 0.090*** 0.076**
[0.015] [0.016] [0.019] [0.012] [0.017] [0.018] [0.028]
N own GPs -0.001 0.018 0.076** -0.091*** 0.073* 0.181*** 0.297***
[0.027] [0.028] [0.028] [0.020] [0.032] [0.036] [0.057]
Within R2 0.0478 0.0540 0.0816 0.0106 0.0824 0.0818 0.108
Obs 0.048 0.054 0.082 0.011 0.082 0.082 0.108
Practices 8,314 8,314 8,314 8,327 8,259 8,091 8,011
Notes: N rival GPs: number of full-time equivalent GPs in other practices with at least one branch within 1km of a branch of the practice. N own GPs: number of FTE GPs in own practice. All models include practice fixed effects, year effects, local population (total population and proportions of population in age/gender groups in the MSOA in which the practice is located), local morbidity (prevalence of QOF conditions averaged across practice and its 5 nearest practices, proportion of patients in nursing homes averaged across practice and its five nearest practices, proportion of patients on invalidity or incapacity benefit in the MSOA in which the practice is located). Square brackets: robust SEs clustered at practice level. *** p<0.001, ** p<0.01, * p<0.05 Table A7. Robustness test: allowing for year*PCT effects
(1) (2) (3) (4) (5) (6) (7)
PA clinical
RA clinical
QOF points ACSC Open hrs sat
Care sat Recommend
2005-12 2005-12 2005-12 2005-12 2006-12 2008-12 2009-12
N rival GPs 0.005 -0.008 -0.011 -0.007 0.071*** 0.055** 0.040
[0.016] [0.018] [0.020] [0.012] [0.018] [0.019] [0.030]
Within R2 0.109 0.102 0.132 0.166 0.140 0.111 0.131
Obs 63,438 63,438 63,440 63,556 55,475 39,390 31,325
Practices 8,215 8,215 8,215 8,216 8,203 8,039 7,962
Notes: Competition measures: N GPs: number of full-time equivalent GPs in other practices with at least one branch within 1km of a branch of the practice. All models include practice fixed effects, year*PCT dummies, local population (total population and proportions of population in age/gender groups in the MSOA in which the practice is located), local morbidity (prevalence of QOF conditions averaged across practice and its 5 nearest practices, proportion of patients in nursing homes averaged across practice and its five nearest practices, proportion of patients on invalidity or incapacity benefit in the MSOA in which the practice is located). . Square brackets: robust SEs clustered at practice level. *** p<0.001, ** p<0.01, * p<0.05
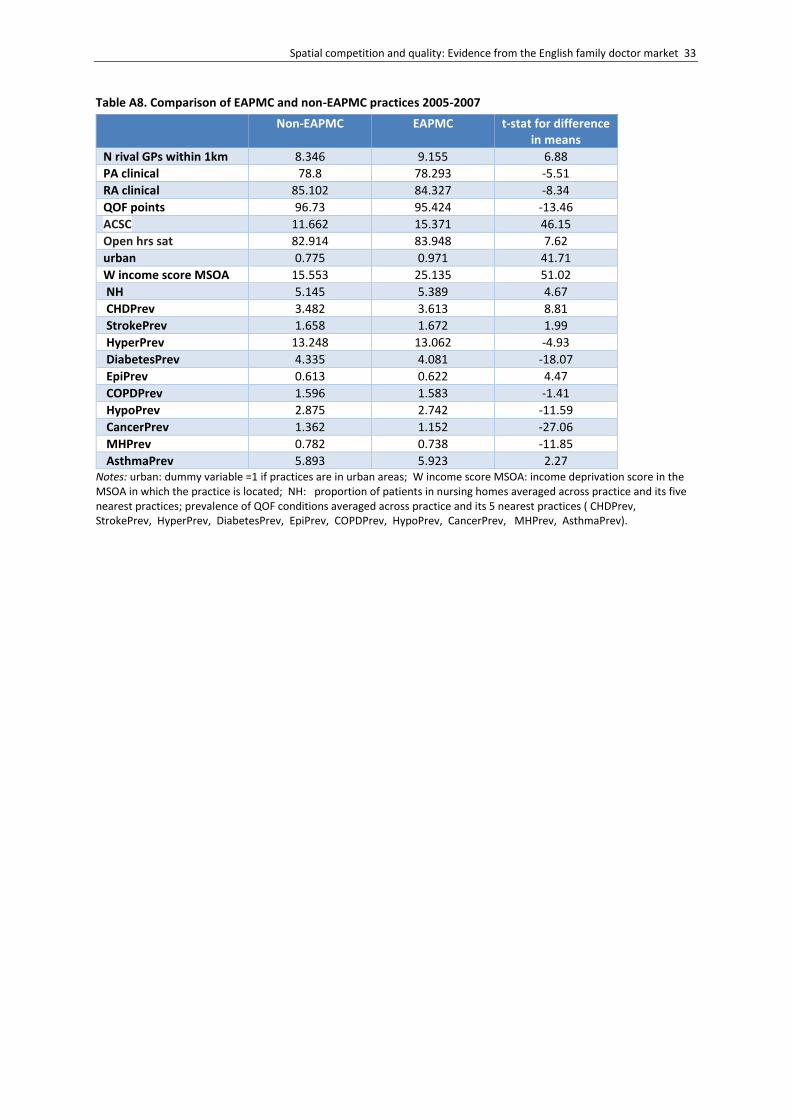
Spatial competition and quality: Evidence from the English family doctor market 33
Table A8. Comparison of EAPMC and non-EAPMC practices 2005-2007
Non-EAPMC EAPMC t-stat for difference in means
N rival GPs within 1km 8.346 9.155 6.88
PA clinical 78.8 78.293 -5.51
RA clinical 85.102 84.327 -8.34
QOF points 96.73 95.424 -13.46
ACSC 11.662 15.371 46.15
Open hrs sat 82.914 83.948 7.62
urban 0.775 0.971 41.71
W income score MSOA 15.553 25.135 51.02
NH 5.145 5.389 4.67
CHDPrev 3.482 3.613 8.81
StrokePrev 1.658 1.672 1.99
HyperPrev 13.248 13.062 -4.93
DiabetesPrev 4.335 4.081 -18.07
EpiPrev 0.613 0.622 4.47
COPDPrev 1.596 1.583 -1.41
HypoPrev 2.875 2.742 -11.59
CancerPrev 1.362 1.152 -27.06
MHPrev 0.782 0.738 -11.85
AsthmaPrev 5.893 5.923 2.27 Notes: urban: dummy variable =1 if practices are in urban areas; W income score MSOA: income deprivation score in the MSOA in which the practice is located; NH: proportion of patients in nursing homes averaged across practice and its five nearest practices; prevalence of QOF conditions averaged across practice and its 5 nearest practices ( CHDPrev, StrokePrev, HyperPrev, DiabetesPrev, EpiPrev, COPDPrev, HypoPrev, CancerPrev, MHPrev, AsthmaPrev).