spatial distribution of migratory salmo trutta in the ... · spatial distribution of brown trout...
TRANSCRIPT
BOREAL ENVIRONMENT RESEARCH 22: 431–444 © 2017ISSN 1797-2469 (online) Helsinki 6 November 2017
Editor in charge of this article: Outi Heikinheimo
Spatial distribution of migratory Salmo trutta in the northern Baltic Sea
Irma Kallio-Nyberg1), Lari Veneranta1), Irma Saloniemi2), Eero Jutila3)4) and Tapani Pakarinen3)
1) Natural Resources Institute Finland (Luke), Puuvillakuja 6, FI-65200 Vaasa, Finland (*corresponding author’s e-mail: [email protected])
2) Department of Biology, FI-20014 University of Turku, Finland3) Natural Resources Institute Finland, P.O. Box 2, FI-00791 Helsinki, Finland4) Current address: Sulkapolku 6 A 37, FI-00370 Helsinki, Finland
Received 10 Jan. 2017, final version received 13 Oct. 2017, accepted 19 Oct. 2017
Kallio-Nyberg I., Veneranta L., Saloniemi I., Jutila E. & Pakarinen T. 2017: Spatial distribution of migra-tory Salmo trutta in the northern Baltic Sea. Boreal Env. Res. 22: 431–444.
Spatial distribution of brown trout (Salmo trutta) was studied on the Finnish coast of the northern Baltic Sea in 1998–2010 based on smolt tagging. The studied trout stocks were hatchery reared, and smolts were tagged with Carlin tags before release into the rivers. The distance between the release and recapture sites as well as location of the recapture site in relation to the release site (north, south, west, east) were analysed, taking the stock and sea age of the trout into account. The most important tag recovery areas at sea were the estuaries of the spawning rivers and coastal areas surrounding them. The natural direction of movement was along the coast line, north or south on the western coast and east or west in the Gulf of Finland. The release site and age affected migration direction. The distance of recoveries from the release sites varied for the same genetic stock released at different sites. The longest median recapture distances were recorded during the second sea year. The stocked brown trout (80%–95%) were mainly caught during their first two years in the sea before they become mature. Knowledge of spatial dispersal of sea trout is important for the management of the stocks and fisheries.
Introduction
Anadromous or sea run brown trout (Salmo trutta) (also called sea trout in the Baltic sea) spawning in the rivers of the Baltic Sea mainly migrate close to their home river for feeding (Ikonen and Auvinen 1984, Jutila et al. 2006, Degerman et al. 2012), and return to the release site or native tributary within the river system (Östergren et al. 2011, 2012). However, longer migration distances of up to 800 km have been recorded (Kallio-Nyberg et al. 2002, 2010).
Due to reproductive isolation, homing behaviour and natural selection, the original wild stocks of sea trout are genetically differ-ent (Hansen and Mensberg 1998, Hansen et al. 2002, Koljonen et al. 2014, Östergren et al. 2012, 2015). Brown trout show stock-specific variation or variation in dispersal depending on the release site (Kallio-Nyberg et al. 2002, Jonsson and Jonsson 2012). Besides differences among river systems, differences in migration pattern among stocks can be detected in coastal areas (Hansen and Mensberg 1998, Östergren

432 Kallio-Nyberg et al. • BOREAL ENV. RES. Vol. 22
et al. 2011). A metapopulation structure of the brown trout that reflects strong drift and gene flow with occasional extinction–recolonization events has also been found in the southern Baltic Sea (Østergaard et al. 2003).
Brown trout stocks differ in life-history traits, such as migratory behaviour (Bartel et al. 2001, Svärdson and Fagerström 1982, Kallio-Nyberg et al. 2002) and longevity (Jonsson and L’Abée-Lund 1993). The tendency of populations to migrate and the direction and distance of the migration vary (Svärdson and Fagerström 1982, Kallio-Nyberg et al. 2002, del Villar-Guerra et al. 2013). Brown trout may spend their whole life in a freshwater stream or migrate to the sea to feed (Jonsson and Jonsson 2006).
Brown trout may migrate to feed and spawn several times in their life, but in the Finnish coastal waters, nearly all caught brown trout are in their first feeding migration, and they have not reached the legal minimum size to be caught (Kallio-Nyberg et al. 2015). Sea trout usually live in the northern Baltic Sea for at least three years before their first spawning migration (Järvi 1940). The legal catch length of the trout in the Finnish coastal waters had been raised from 40 to 50 cm during the period studied here, and further to 60 cm in 2014 (ICES 2013, Kallio-Nyberg et al. 2015).
The natural brown trout stocks in the Finnish coastal rivers are at present critically endan-gered, and most of approximately 40 original stocks have already been lost (Jutila et al. 1998, 2006, Urho et al. 2010, ICES 2013). Presently, most smolts migrating from the Finnish coastal rivers are hatchery-reared and produced by using brood stocks (Kallio-Nyberg et al. 2006, ICES 2013). The aim of hatchery releases has partly been to aid natural production that decreased partly due to the damming of rivers (Jutila et al. 2006, Lundqvist et al. 2006). The brood stocks have mainly been created from the remaining original stocks (Jutila et al. 2006), but the same genetic stocks are released into several rivers.
Both the stock-specific migration pattern (Kallio-Nyberg et al. 2002) and the spatial dis-tribution of fishing may affect the spatial dis-tribution of recaptures. According to the catch statistics of the Natural Resources Institute Fin-
land, whitefish (Coregonus lavaretus), pikeperch (Sander lucioperca) and perch (Perca fluviatilis) are the main targets for gill-net fishing in the coastal waters, where these fish species mainly live and reproduce (Lehtonen et al. 1996, Vene-ranta et al. 2013, Kallasvuo et al. 2015). Brown trout are mainly caught as by-catch of these spe-cies (Jutila et al. 2006).
The main focus of this study was to analyze location of the recapture site in relation to the river mouth or the distance between release and recapture sites in relation to the release site, stock and time at sea in the Finnish brown trout stocks. Our analysis was based on tag returns, which indicate the main feeding or migration area for brown trout of a certain age, assuming the homogeneous fishing intensity that covers the entire follow-up area. We were able to test the hypothesis that spatial dispersal is mainly affected by the release site, as the stocks with the same genetic origin had been released into sev-eral rivers (Kallio-Nyberg et al. 2010). The data sets did not include information on hatcheries for any stocks. This study included all the main Finnish rivers into which brown trout smolt were released in the years 1998–2010, and where the brown trout can spawn (Jutila et al. 2006).
Material and methods
Tag recovery data
This study was based on 3619 individual Carlin tag recoveries of brown trout smolts released in 1998–2010 into ten Finnish Baltic Sea rivers (Table 1 and Fig. 1). The recovery rate was 2.4% for 1998–2010 groups, but all recoveries do not include information on recovery site or time. The recoveries released after 2010 were not included, due to low number of tagged smolts (6527 fish in 2015 and 11 170 fish in 2010) and due to low return rate (below 1% for groups released in 2010–2015) (ICES 2011, 2016). In addition it takes at least five years after the tagging year for nearly all recoveries to return (for example release in 2010 and returns up to 2014). The mean length of the hatchery reared smolts in the recovery data was 24.0 cm (± 2.5 cm, n = 3619).

BOREAL ENV. RES. Vol. 22 • Spatial distribution of migratory Salmo trutta in the northern Baltic Sea 433
Table 1. Recoveries south or north of the mouth of the release river in the Bothnian Bay and in the Bothnian Sea, and west or east in the Archipelago Sea and in the Gulf of Finland according to the river. The origin of the released stock is presented (Stock). Tags recovered from predatory birds are included in the total, and also presented in parentheses. χ2-test statistics between some pairs (comparisons) are shown (recoveries from predatory birds were included).
Release area Stock Location north Location south Test n % n % n Comparisons χ2 p
Bothnian Bay (BB) Kemijoki (Ke) Ii 028 18.3 125(1) 81.7 153 Ke&Ii 0.5 ns Iijoki (Ii) Ii 012 14.8 069(5) 85.2 081 Ii&Ou 23.2 < 0.001 Oulujoki (Ou) Ii 183(27) 43.3 240 56.7 423 Ou&Le 123.8 < 0.001 Lestijoki (Le) Le 369 79.3 095 20.7 464 Le&Iso 0.9 nsBothnian Sea (BS) Isojoki (Iso) Iso 384 76.9 115 23.1 499 Iso&Me 1.6 ns Merikarvianjoki (Me) Iso 337 80.4 082 19.6 419
Release area Stock Location west Location east Test n % n % n Comparisons χ2 p
Archipelago Sea (AS) Aurajoki (Au) Mixed 281 76.6 086 23.4 367 Au&Ing 19.2 < 0.001Gulf of Finland (GF) Ingarskilanjoki (Ing) Ing 012 40.0 018 60.0 30 Ing&Va 17.1 < 0.001 Vantaanjoki (Va) Iso 063(1) 12.7 431(258) 87.3 494 Va&Au 357.4 < 0.001 Kymijoki (Ky) Iso 084(3) 41.2 120(39) 58.8 204 Va&Ky 70.2 < 0.001
Rearing, stocks and release sites
Brown trout smolts were reared using routine conditions and methods in hatcheries (Kallio-Nyberg et al. 2002), which were situated in central and northern Finland. Randomly selected smolts were tagged with individual Carlin tags in the hatcheries in late autumn or winter and released into the rivers after ice melt in April–May, when their mean size varied between 18 and 25 cm. The smolts were transported in aerated tanks and released some kilometres upstream from the river mouth. Because many of the rivers had lost their original brown trout popula-tions, reared brood stocks from other rivers were used in releases. Altogether, four hatchery trout stocks (Iijoki, Lestijoki, Isojoki, Ingarskilajoki) were used in stocking. Smolts originating from the Iijoki were used in stocking of the northern-most Kemijoki, Iijoki and Oulujoki (Table 1). The smolts released into the Lestijoki, Isojoki and Ingarskilajoki were offspring of brood stocks originating from the same rivers (original stocks). The smolts released into the Merikarvianjoki,
Vantaanjoki and Kymijoki were offspring of brood stocks of the Isojoki brown trout. The smolts released into the Aurajoki were offspring of ascending spawners caught in the Aurajoki and reared in the hatchery (Jutila et al. 2006).
The rivers are the most important release sites of brown trout in the Bothnian Bay (BB), Bothnian Sea (BS), Archipelago Sea (AS) and the Gulf of Finland (GF) (Table 1 and Fig. 1). The rivers range in size from the Kemijoki, with a mean discharge of 600 m3 s–1, to the Ingarski-lanjoki, with a mean discharge of 2 m3 s–1.
The annual mean air temperature in the north-ern BB (Kemijoki) is 2 °C and in the southern sea areas (Aurajoki, Ingarskilanjoki, Vantaanjoki and Kymijoki) 6 °C. During normal winters, by December all coastal sea areas are normally covered by ice, which melts in April in the GF, and in May–June in the BB. The mean salinity of the seawater on the Finnish coast is 0.1%–0.6%. The main surface marine currents are directed to the north along the coast of the Gulf of Bothnia and to the west along the coast of the GF (Fig. 1) (Voipio 1981).

434 Kallio-Nyberg et al. • BOREAL ENV. RES. Vol. 22
Maintaining and handling of tagging data
Information on tag recoveries was received from fishermen by the Natural Resources Institute Finland, which is responsible for the national tagging programme (tagged stocks, stocking places and quantities) and maintains a tagging database. The fishermen had been advised to report the fishing site and date, fishing gear and size of the fish (total length and weight), but quite often some of those elements were missing. In the database, the recovery site is recorded in the specific ICES 50 ¥ 50 km statistical rectangle and subdivision (ICES 2013), and with coordi-nates if catch site was given.
The data used in studying the recovery site and migration distance included those tags with exact coordinates or a precisely determined site (Table 1). The distance from the river mouth to
the recovery site was calculated as the Euclidean distance using the geographical coordinates of the release and recovery sites. The bearing, i.e. the angle between geographical north and a line drawn between the river mouth and recapture site, was indicated in degrees (0°–360°). A rough north–south classification was used in the Gulf of Bothnia and east–west in the AS and GF. The distance or location of the recapture site does not indicate the actual travel path of the recov-ered fish, but it provides stock- and site-specific information on the feeding and fishing areas of sea trout.
Tag recoveries from rivers were omitted (3.7%; 3147 recoveries from the sea, 119 recov-eries from rivers). Altogether, 334 tags were recovered from pellets or droppings of birds from colonies of the Caspian tern (Hydroprogne caspia) and gulls (Larus sp.) (Table 1). Six of the recovered tags were found from fish remnants and seven from animal faeces (mainly of grey seals, Halichoerus grypus).
Statistical analyses
The density of brown trout tag recoveries in coastal areas was determined by spatial density analysis for four key stocking sites, Kemijoki, Lestijoki (BB), Isojoki (BS) and Vantaanjoki (GF), and separately for sea age groups 1, 2 and 3 (96% of tags) (Fig. 2). The density of tag recoveries for tagged trout released into the four rivers was calculated as the number of tags per km2 within a circle with the radius of 10 km. The spatial analyses were performed in a raster grid (cell size 200 m) that covered the coastal water areas. The river observations were excluded from the analyses, as well as recoveries from birds, fish or of unknown origin. The individual outlying tag recoveries were removed by includ-ing only the uppermost quartile of point density cell values per stocking site and age group to the visualization. Thus, only areas with two or more tag returns were included in the visualiza-tion. All GIS analyses were performed using the ESRI ArcGIS (ArcMap 10.2 and Spatial Analyst extension) software package.
The analysis of spatial distribution of recap-tures and orientation of migration was based
Fig. 1. The northern Baltic Sea with ICES subdivisions 29–32 and the relevant ICES statistical rectangles (4, 6, 11, 15, …, 64) near the sea trout rivers, and annual average gill-net days of Finnish professional fisher-men. Rivers: 1 = Kemijoki, 2 = Iijoki, 3 = Oulujoki, 4 = Lestijoki, 5 = Isojoki, 6 = Merikarvianjoki, 7 = Aurajoki, 8 = Ingarskilanjoki, 9 = Vantaanjoki, 10 = Kymijoki. Rectangles are 50 ¥ 50 km areas within subdivisions. The weak main surface currents (arrows) are indicated. Data source: Official Statistics of Finland (OSF), Natu-ral Resources Institute Finland.

BOREAL ENV. RES. Vol. 22 • Spatial distribution of migratory Salmo trutta in the northern Baltic Sea 435
Fig. 2. Spatial distribution of recoveries at four release rivers based on the point density analysis showing the main tag recovery areas of brown trout in the first (1 yr = release year), second (2 yr) and third (3 yr) year after stocking. All ten release rivers are shown and four ICES sea areas (29, 30, 31, 32) in the northern Baltic Sea are presented. The Kemijoki, Iijoki, Oulujoki and Lestijoki flow into the Bothnian Bay (ICES 31), the Isojoki and Merikarvianjoki into the Bothnian Sea (ICES 30), the Aurajoki into the Archipelago Sea (ICES 29) and the Ingarskilanjoki, Vantaanjoki and Kymijoki into the Gulf of Finland (ICES 32). The colour intensity indicates recovery frequency per km2.
436 Kallio-Nyberg et al. • BOREAL ENV. RES. Vol. 22
on the release and recapture sites. The distance between those sites and their relative location depend on time, because fish move actively. The true movement of fish among sites is unknown, but by using the period (year or season) it is pos-sible to study distance or movement direction in relation to fish age or feeding time at sea.
The feeding area of brown trout was also studied by analysing the spatial distribution of recaptures in ICES rectangles (ICES 2013; rec-tangles in Fig. 1) and using the different proce-dures included in SAS® (SAS Institute 2012). The Baltic Sea is divided into 50 ¥ 50 km rec-tangles according to the northern latitudes and eastern longitudes. Differences in the orientation of recaptures were analysed using the χ2-test (SAS® FREQ). Differences in median distance among years within release sites (year) or among sites within the first and second sea year (sites, 1st year; sites, 2nd year) were tested using the Kruskal-Wallis test (SAS® NPAR1WAY). The median recapture distances between the same stock released into different rivers (for example, Iijoki stock into the Iijoki and Kemijoki) were also analysed using the Kruskal-Wallis test as they were not normally distributed.
Simultaneous effects of different variables on location of the recovery site at sea in rela-tion to the release site were examined by apply-ing SAS® GENMOD models with a binomial distribution and logit link. Location, north and south in the Gulf of Bothnia, or west and east in the GF, was used as the response variable. The release site, sea year (1st to 3rd), season and their interaction were used as predictors. The seasons were expressed as three-month periods (spring = March–May, summer = June–August, autumn = September–November, winter = December-Feb-ruary). In the model with season and site as pre-dictors, fish of first sea year were excluded since the first year does not include all seasons.
The simultaneous effect of release site (3: Kemijoki, Iijoki, Oulujoki) and sea year (first, second, third) on distance (straight distance between release and recovery site) was examined by applying SAS® MIXED model. To achieve normality, individual distance (response varia-ble) was log-transformed. The same stock, Iijoki brown trout, was released into rivers included in the model.
In all statistical analyses, p < 0.05 was con-sidered to indicate statistical significance.
Results
On average, about two-thirds (69.9%; from 61.5% in AS to 81.3% in BS) of all tag recover-ies came from the gill net fishery (1823 gill net recoveries/total sample 2608), even though the coastal fishery is targeted at other fish species. The second most common fishing method of cap-turing brown trout was coastal trap-net fishing, with a mean recovery of 16.7% (from 28.2% in BB to 7.8% in GF) (435 trap net recoveries/total 2608). Rod and line fishing was the third (11.9%; 311/2608), with the highest proportion in the AS (29.1%; 111 rod/382 all gears in the AS).
The dispersal of brown trout recoveries was mainly restricted to sea areas surrounding the release river (Fig. 2). Nearly all (96% in BB, n = 1125; 91% in BS, n = 927; 97% in GF, n = 729) recoveries of recaptured fish came from the sea area of the release river, except in the region-ally smaller and more open AS sea area, where this proportion was lowest (65%, n = 366). The recoveries of brown trout from four release sites, Kemijoki (BB), Lestjoki (BB), Isojoki (BS) and Vantaanjoki (GF), were studied by density analy-sis (tag recoveries/km2) (see Fig. 2). The number of the gill-net days in commercial fishing was higher in the coastal waters than in offshore areas (Fig. 1).
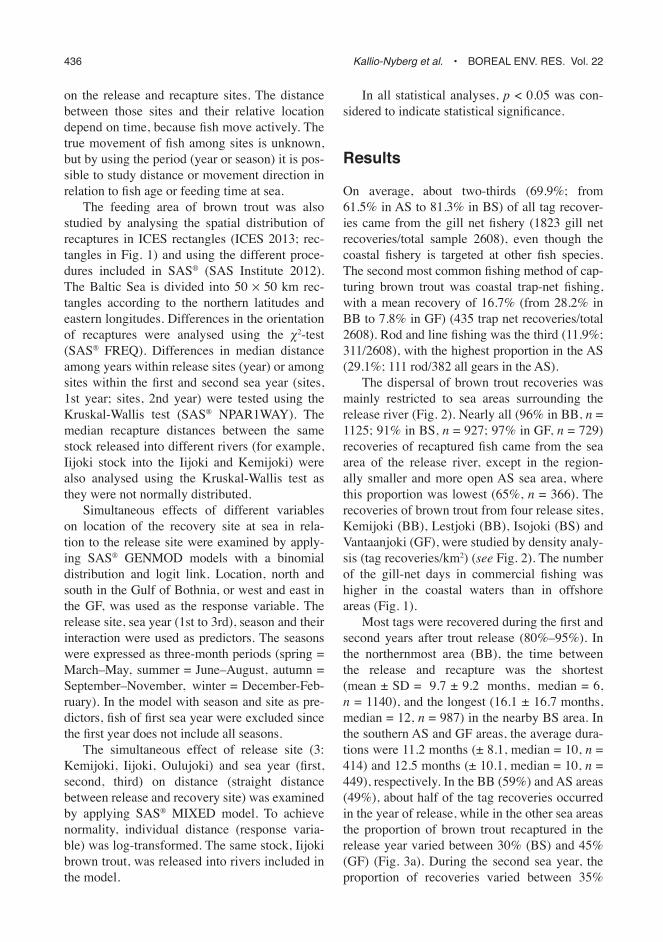
Most tags were recovered during the first and second years after trout release (80%–95%). In the northernmost area (BB), the time between the release and recapture was the shortest (mean ± SD = 9.7 ± 9.2 months, median = 6, n = 1140), and the longest (16.1 ± 16.7 months, median = 12, n = 987) in the nearby BS area. In the southern AS and GF areas, the average dura-tions were 11.2 months (± 8.1, median = 10, n = 414) and 12.5 months (± 10.1, median = 10, n = 449), respectively. In the BB (59%) and AS areas (49%), about half of the tag recoveries occurred in the year of release, while in the other sea areas the proportion of brown trout recaptured in the release year varied between 30% (BS) and 45% (GF) (Fig. 3a). During the second sea year, the proportion of recoveries varied between 35%
BOREAL ENV. RES. Vol. 22 • Spatial distribution of migratory Salmo trutta in the northern Baltic Sea 437
and 50%, and was around 10% in later sea years in all sea areas.
The caught brown trout were small (Fig. 3b). The total body length (mean ± SD) was the lowest in the BB [40.1 ± 9.7 cm)] and somewhat larger in the other sea areas (46.8 ± 12.3 cm, 48.1 ± 11.6 cm, and 48.5 ± 10.9 cm, in BS, AS and GF, respectively). In the BS, AS and GF, approximately 40%–45% of recaptured brown trout were longer than the minimum legal catch length of 50 cm, while in the BB the proportion was only 16% (Fig. 3b).
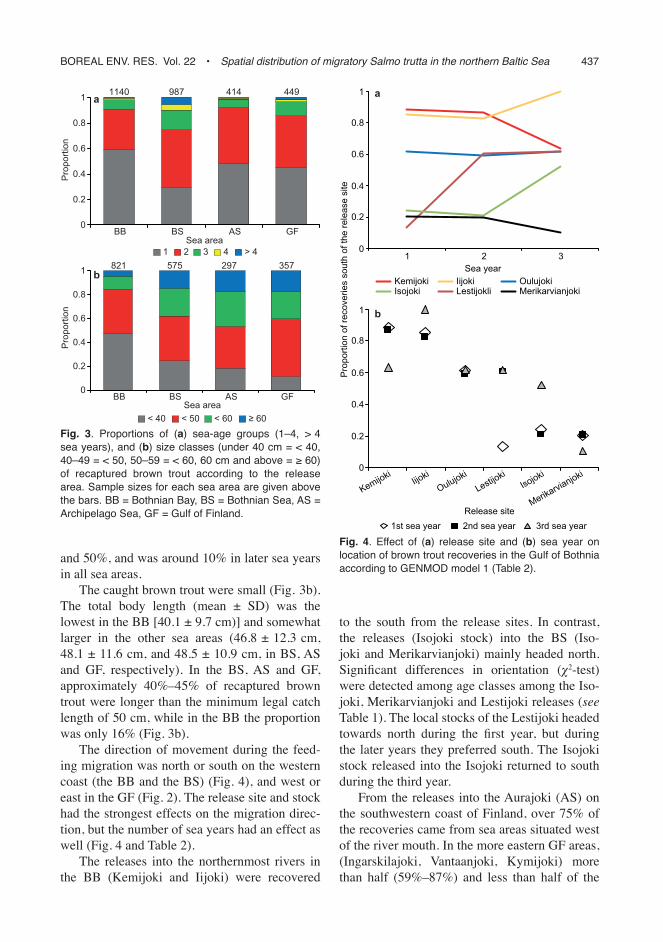
The direction of movement during the feed-ing migration was north or south on the western coast (the BB and the BS) (Fig. 4), and west or east in the GF (Fig. 2). The release site and stock had the strongest effects on the migration direc-tion, but the number of sea years had an effect as well (Fig. 4 and Table 2).
The releases into the northernmost rivers in the BB (Kemijoki and Iijoki) were recovered
to the south from the release sites. In contrast, the releases (Isojoki stock) into the BS (Iso-joki and Merikarvianjoki) mainly headed north. Significant differences in orientation (χ2-test) were detected among age classes among the Iso-joki, Merikarvianjoki and Lestijoki releases (see Table 1). The local stocks of the Lestijoki headed towards north during the first year, but during the later years they preferred south. The Isojoki stock released into the Isojoki returned to south during the third year.
From the releases into the Aurajoki (AS) on the southwestern coast of Finland, over 75% of the recoveries came from sea areas situated west of the river mouth. In the more eastern GF areas, (Ingarskilajoki, Vantaanjoki, Kymijoki) more than half (59%–87%) and less than half of the
0
0.2
0.4
0.6
0.8
1
BB BS AS GF
Pro
porti
on
Sea area≥ 60< 60< 50< 40
821 575 297 357
0
0.2
0.4
0.6
0.8
1 a
b
BB BS AS GF
Pro
porti
on
Sea area> 44321
1140 987 414 449
Fig. 3. Proportions of (a) sea-age groups (1–4, > 4 sea years), and (b) size classes (under 40 cm = < 40, 40–49 = < 50, 50–59 = < 60, 60 cm and above = ≥ 60) of recaptured brown trout according to the release area. Sample sizes for each sea area are given above the bars. BB = Bothnian Bay, BS = Bothnian Sea, AS = Archipelago Sea, GF = Gulf of Finland.
0
0.2
0.4
0.6
0.8
1
1 2 3
Pro
porti
on o
f rec
over
ies
sout
h of
the
rele
ase
site
Sea yearKemijoki Iijoki Oulujoki
LestijokliIsojoki Merikarvianjoki
0
0.2
0.4
0.6
0.8
1
KemijokiIijoki
Oulujoki
LestijokiIsojoki
Merikarvianjoki
Release site1st sea year 2nd sea year 3rd sea year
a
b
Fig. 4. Effect of (a) release site and (b) sea year on location of brown trout recoveries in the Gulf of Bothnia according to GENMOD model 1 (Table 2).

438 Kallio-Nyberg et al. • BOREAL ENV. RES. Vol. 22
within the second and third sea years (Oulujoki, Merikarvianjoki and Isojoki) (Table 2; model 2; Fig. 5). Direction of the brown trout migration varied depending on the release site (Table 2; Type 3 test: interaction between site and season: p < 0.001). Brown trout from the Merikarvi-anjoki and Isojoki releases migrated mainly towards the north, but those from the Oulujoki releases migrated both to the north and south (Table 2; Fig. 5; Type 3 test: Site: p < 0.001). In the second sea year, the Oulujoki trout were captured in the spring and autumn north of the release site, and in winter and summer south of the release site.
When all years were included, the median dis-tances between the river mouth and the recovery site at sea were 27.8, 26.6, 32.8 and 47.5 km in the BB, BS, Archipelago Sea and GF, respec-tively (Table 3). The greatest median distances were found for the northernmost rivers (Kemi-joki releases: 104.5 km (n = 152, all sea years) and Iijoki: 88.8 km (n = 76). The fish from the more southern Gulf of Bothnia rivers (Lestijoki: 17.5 km; n = 464 and Merikarvianjoki: 24.7 km; n = 419) were caught closer to their stocking rivers (Iijoki releases & Lestijoki releases: Kruskal-Wal-lis test: p < 0.001 and Iijoki releases & Merikarvi-anjoki releases: p < 0.001). The median distance for brown trout of the Iijoki stock released into the Oulujoki (35.9 km) was shorter than for the trout released into the Kemijoki (104.5 km) or Iijoki (88.8 km) (Kruskal-Wallis test: p < 0.001)
Table 2. Models (SAS GENMOD) for the spatial marine dispersal of brown trout. The response variable is the dominant location of recapture from the release site: north and south in the Gulf of Bothnia. Trout of the Iijoki stock were released into the estuaries of the Oulujoki, Iijoki and Kemijoki, trout of the Lestijoki stock were released into the estuary of the Lestijoki, and trout of the Isojoki stock were released into the estuaries of the Isojoki and Meri-karvianjoki in the Gulf of Bothnia. The seasons are spring, summer and autumn in the second sea year (Spring = March–May; Summer = June–August; Autumn = September–November) and winter in the second and third sea years (December–February). Model 1 is shown in Fig. 4 and model 2 in Fig. 5.
Model Stocks Response Predictors df F p AIC (location)
1 Iijoki, Lestijoki, North-south Release site (Merikarvianjoki, 5 252.92 < 0.001 2036.0 Isojoki Isojoki, Lestijoki, Oulujoki, Iijoki, Kemijoki) Year at sea (1, 2, 3) 2 0.82 0.663 Site ¥ year at sea 10 37. 60 < 0.0012 Isojoki, Iijoki North-south Site (Merikarvianjoki, Isojoki, Oulujoki) 2 38.32 < 0.001 488.1 Season 3 7.70 0.053 Site ¥ season 6 26.22 < 0.001
Fig. 5. Effects of (a) release site (river) and (b) season on location of brown trout recaptures in the Gulf of Bothnia according to GENMOD model 2 (Table 2) with 95% confidence limits. The seasons are three-month periods in the second sea year (spring = March–May, summer = June–August, autumn = September–Novem-ber) and in the second winter (winter = December–Feb-ruary).
0
0
0.5
1
1.5
0.10.20.30.40.50.60.70.80.9
Oulujoki
OulujokiIsojokiMerikarvianjoki
Spring Summer Autumn Winter
Isojoki MerikarvianjokiRelease site
spring summer autumn winter
Pro
porti
on o
f rec
over
ies
sout
h of
the
rele
ase
site
recoveries were east and west, respectively, of the release river (Table 1).
Location of the recapture site in relation to the release site was analysed according to season
BOREAL ENV. RES. Vol. 22 • Spatial distribution of migratory Salmo trutta in the northern Baltic Sea 439
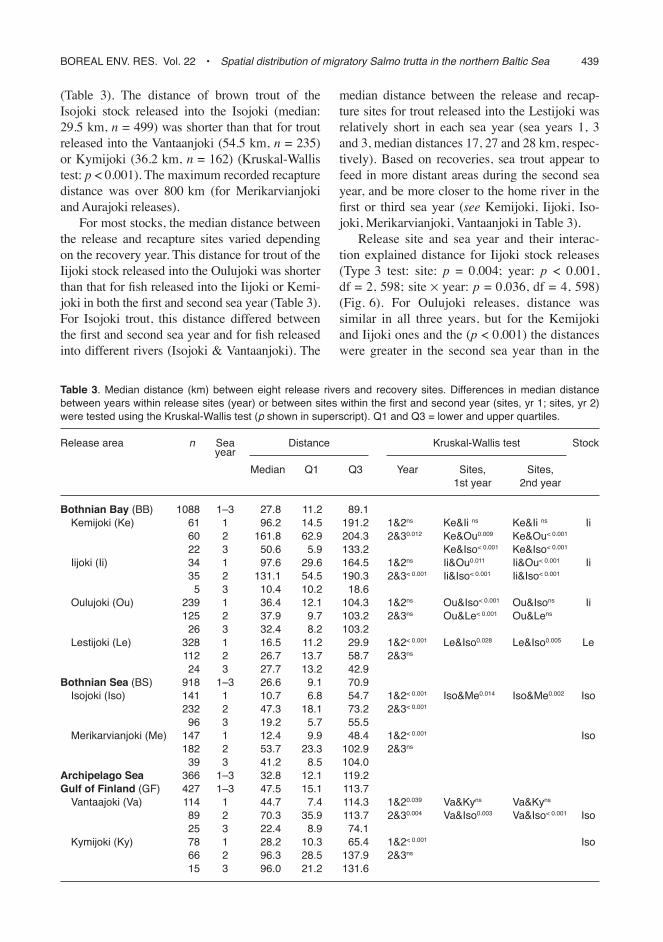
(Table 3). The distance of brown trout of the Isojoki stock released into the Isojoki (median: 29.5 km, n = 499) was shorter than that for trout released into the Vantaanjoki (54.5 km, n = 235) or Kymijoki (36.2 km, n = 162) (Kruskal-Wallis test: p < 0.001). The maximum recorded recapture distance was over 800 km (for Merikarvianjoki and Aurajoki releases).
For most stocks, the median distance between the release and recapture sites varied depending on the recovery year. This distance for trout of the Iijoki stock released into the Oulujoki was shorter than that for fish released into the Iijoki or Kemi-joki in both the first and second sea year (Table 3). For Isojoki trout, this distance differed between the first and second sea year and for fish released into different rivers (Isojoki & Vantaanjoki). The
median distance between the release and recap-ture sites for trout released into the Lestijoki was relatively short in each sea year (sea years 1, 3 and 3, median distances 17, 27 and 28 km, respec-tively). Based on recoveries, sea trout appear to feed in more distant areas during the second sea year, and be more closer to the home river in the first or third sea year (see Kemijoki, Iijoki, Iso-joki, Merikarvianjoki, Vantaanjoki in Table 3).
Release site and sea year and their interac-tion explained distance for Iijoki stock releases (Type 3 test: site: p = 0.004; year: p < 0.001, df = 2, 598; site ¥ year: p = 0.036, df = 4, 598) (Fig. 6). For Oulujoki releases, distance was similar in all three years, but for the Kemijoki and Iijoki ones and the (p < 0.001) the distances were greater in the second sea year than in the
Table 3. Median distance (km) between eight release rivers and recovery sites. Differences in median distance between years within release sites (year) or between sites within the first and second year (sites, yr 1; sites, yr 2) were tested using the Kruskal-Wallis test (p shown in superscript). Q1 and Q3 = lower and upper quartiles.
Release area n Sea Distance Kruskal-Wallis test Stock year Median Q1 Q3 Year Sites, Sites, 1st year 2nd year
Bothnian Bay (BB) 1088 1–3 27.8 11.2 89.1 Kemijoki (Ke) 61 1 96.2 14.5 191.2 1&2ns Ke&Ii ns Ke&Ii ns Ii 60 2 161.8 62.9 204.3 2&30.012 Ke&Ou0.009 Ke&Ou< 0.001
22 3 50.6 5.9 133.2 Ke&Iso< 0.001 Ke&Iso< 0.001
Iijoki (Ii) 34 1 97.6 29.6 164.5 1&2ns Ii&Ou0.011 Ii&Ou< 0.001 Ii 35 2 131.1 54.5 190.3 2&3< 0.001 Ii&Iso< 0.001 Ii&Iso< 0.001
5 3 10.4 10.2 18.6 Oulujoki (Ou) 239 1 36.4 12.1 104.3 1&2ns Ou&Iso< 0.001 Ou&Isons Ii 125 2 37.9 9.7 103.2 2&3ns Ou&Le< 0.001 Ou&Lens
26 3 32.4 8.2 103.2 Lestijoki (Le) 328 1 16.5 11.2 29.9 1&2< 0.001 Le&Iso0.028 Le&Iso0.005 Le 112 2 26.7 13.7 58.7 2&3ns
24 3 27.7 13.2 42.9Bothnian Sea (BS) 918 1–3 26.6 9.1 70.9 Isojoki (Iso) 141 1 10.7 6.8 54.7 1&2< 0.001 Iso&Me0.014 Iso&Me0.002 Iso 232 2 47.3 18.1 73.2 2&3< 0.001
96 3 19.2 5.7 55.5 Merikarvianjoki (Me) 147 1 12.4 9.9 48.4 1&2< 0.001 Iso 182 2 53.7 23.3 102.9 2&3ns
39 3 41.2 8.5 104.0Archipelago Sea 366 1–3 32.8 12.1 119.2Gulf of Finland (GF) 427 1–3 47.5 15.1 113.7 Vantaajoki (Va) 114 1 44.7 7.4 114.3 1&20.039 Va&Kyns Va&Kyns
89 2 70.3 35.9 113.7 2&30.004 Va&Iso0.003 Va&Iso< 0.001 Iso 25 3 22.4 8.9 74.1 Kymijoki (Ky) 78 1 28.2 10.3 65.4 1&2< 0.001 Iso 66 2 96.3 28.5 137.9 2&3ns
15 3 96.0 21.2 131.6

440 Kallio-Nyberg et al. • BOREAL ENV. RES. Vol. 22
third sea year (p = 0.012 and p < 0.001, respec-tively; see also Fig. 6).
Discussion
According to the recapture data analysed in this study, the released brown trout appeared to forage at a rather short distance from the release site (29–104 km) as compared with the salmon (Salmo salar) stocks in the Gulf of Bothnia (Kal-lio-Nyberg et al. 1999). The ranges are rather similar to those of brown trout released on the Swedish coast into the Gulf of Bothnia (Lund-qvist et al. 2006, Degerman et al. 2012). Earlier tagging studies in the Bothnian Bay also dem-onstrated that trout mainly migrate not far from the release site, but some may also continue their migration to the Bothnian Sea (about 500 km) or the main basin of the Baltic Sea (about 1000 km) (Svärdson and Fagerström 1982, Ikonen and Auvinen 1984, Kallio-Nyberg et al. 2010). In an earlier study on the spatial distribution of Isojoki and Ingarskilanjoki trout released into the Gulf of Finland (release years 1994–1996), about 50%–60% of the recoveries came from the rectangles (50 ¥ 50 km) into which the fish were released, and 89%–93% from the Gulf of Finland (Kallio-Nyberg et al. 2002). Migration distance of the brown trout in the Baltic Sea is, however, greater than in the coastal waters of northern Norway (Berg and Berg 1987).
Variation in the spatial distribution of brown trout groups released at the different sites was significant. After leaving the river, most trout appeared to remain in coastal waters, as rather few tag recoveries came from the open sea, as was also found in realier studies (Ikonen and Auvinen 1984, Kallio-Nyberg et al. 2002). When fish dispersal is studied based on tag recoveries from fishing, fishing intensity and its spatial distribution should, however, be considered. In fact, both may vary locally and annually during a long period, but here we assumed that fishing pattern and recovery rate would be similar in the entire coastal area during the studied period (1998–2010), even though numbers of gill net days varied (see Fig. 1).
The distance brown trout travel to the feed-ing grounds may be linked to size or density of prey species or seasonal variation of prey species (Hyvärinen and Huusko 2006, Richardsen et al. 2006). The results indicate that this distance was the greatest in the second sea year, in the growth season before maturation. According to recoveries, in the first sea year brown trout were mainly close to the estuary area of the river they were released to, and during the third sea year they likely began to return to the vicinity of the release river mouth before the spawning migra-tion. During the second sea year, trout from neighbouring rivers, or even more distant rivers, feed together in the same sea area, thus most effectively utilizing the available food resources.
0
20
40
60
80
100
120
140
160
180
Kemijoki Iijoki Oulujoki Kemijokimedian
Iijokimedian
Oulujokimedian
Dis
tanc
e (k
m)
Release sites
1st sea year2nd sea year3rd sea year Fig. 6. Effect of release
site and sea year on the distance of brown trout recoveries in the Gulf of Bothnia according to MIXED model. Iijoki trout were released at all three sites (Kemijoki, Iijoki, Oulujoki) considered in the model. The sample sizes in the 1st, 2nd and 3rd sea years were as follows: Kemijoki: 62, 60 and 22, respectively; Iijoki: 39, 35 and 6, respectively; Oulujoki: 262, 134 and 28, respectively.

BOREAL ENV. RES. Vol. 22 • Spatial distribution of migratory Salmo trutta in the northern Baltic Sea 441
The distance brown trout travel to the feeding grounds is short as compared with that of salmon (Kallio-Nyberg et al. 1999, 2010). The Both-nian Bay salmon migrate in their first sea year to their main feeding areas located in the main basin of the Baltic Sea (Kallio-Nyberg et al. 1999), while brown trout the estuary and coastal waters near the home river are the main feeding areas (Kallio-Nyberg et al. 2002, Degerman et al. 2012). One reason for the differences may be that sea trout may change food items seasonally and their diet is more diverse, while adult salmon depend on fewer prey species (Rikardsen et al. 2006, Karlsson et al. 1999). The overlapping spatial and temporal distribution of recoveries between near release sites or between recovery years indicated that the release site or sea age do not affect the migration routes or locations of feeding areas.
Location and distance of recoveries from the release site may be determined by both envi-ronmental and genetic or stock-specific factors (Kallio-Nyberg et al. 2002, 2010). According to Svärdson and Fagerström (1982) and Deger-man et al. (2012), migration in the BB region is probably governed by the existing water cur-rents: northwards along the Finnish coast and southwards along the Swedish coast. In our study, this explanation fits the case of the BS and the southern BB region, where both migra-tion and coastal currents have a pronounced northwards direction. In the AS region, both the migration and coastal currents are also in paral-lel. However, as earlier observed by Toivonen and Tuhkunen (1975), in the northern BB and in the GF, the migration of sea trout occurs against the prevailing coastal currents, or at least the trout shift southwards along the Finnish coast-line. Transplantation experiments with the same Isojoki trout carried out in the BS and GF dem-onstrated that the same stock can migrate along the prevailing current in the BS and against the current in the GF. This suggests that currents are not the most important factor affecting the spa-tial distribution of sea trout.
Another hypothesis presented by Svärdson and Fagerström (1982) and Degerman et al. (2012) is that the southward migration of young brown trout along the Swedish coast, which is more pronounced in northern stocks of the
Gulf of Bothnia, is an adaptation to migrate to a warmer and possibly more productive, and more saline feeding environment. This could be valid on the Finnish coast of the Baltic Sea only in the northern BB, but not in other sea areas, because in the AS and southern parts of the Gulf of Bothnia migrations are directed towards north or more exposed areas, and likely colder sea areas. In the northern Baltic Sea areas, the salinity gra-dient is weak, and in the GF, as in the southern Gulf of Bothnia, migration occurs towards lower salinity. Differences in salinity may not therefore explain this phenomenon, noticing the low over-all salinity of the northern Baltic Sea. Moreover, in the GF, the eastern parts are less saline. Con-sidering these ambivalent observations, there is no obvious explanation for this type of phenom-enon or adaptation.
Many studies have shown that various migra-tion patterns observed in the sea may at least partly be genetically determined (Kallio-Nyberg et al. 2002, Degerman et al. 2012). Earlier stud-ies have also demonstrated different spatial dis-tributions of different trout stocks transplanted to the same site in the Baltic Sea (Kallio-Nyberg et al. 2002) and in the northern North Sea (Jons-son and Jonsson 2012). The migration direction in the river has been shown to be a heritable trait for trout (Huusko et al. 1990, Jonsson et al. 1994). Trout released into their native river, such as the Isojoki, are likely to show the migration pattern typical to this stock, but the migration pattern of the Isojoki stock at other sites is differ-ent due to different environmental factors.
The differences in locations of tag recovery sites may also be due to differences in fish-ing intensity and type. The recovery data dem-onstrated that brown trout are mainly caught during their first two years in the sea before they become mature. Females in the northern Baltic Sea mostly attain maturity after three sea years (Järvi 1940, Huhmarniemi 2002). Releases have not succeeded in supporting the weak wild stocks and natural spawning, and the catch return is consequently low when compared with the potential catch (Saura 2002). Brown trout are mainly caught as a by-catch in the gill net fish-ing targeted at other species (Jokikokko 2002, Jutila et al. 2006), and gill net fishing or mesh size regulations do not take into account the poor
442 Kallio-Nyberg et al. • BOREAL ENV. RES. Vol. 22
state of the brown trout stocks. The mesh size in whitefish (Coregonus sp.) gill net fishing in the Gulf of Bothnia was 40–50 mm in the 1990s, and gill nets with a mesh size of 43 mm catch trout 430 mm in length (Veneranta et al. 2017), which is usually gained in the first or second summer. After three summers, during the typical first spawning migration, brown trout usually weigh over 4 kg (Huhmarniemi 2002, Kallio-Nyberg et al. 2015). In addition, the reporting of recaptures is voluntary and the reporting rate of tag recoveries from different areas or fish-ing methods is impossible to monitor. Thus, for instance, the actual reporting rate of undersized (< 40 cm) trout has been found to be lower than their estimated proportion among captured fish (Kallio-Nyberg et al. 2007).
The spatial distribution of recoveries indi-cated that the main feeding areas of brown trout are quite limited. Based on this, we can suppose that through the temporal closing of the gill net fishery or by banning gill nets with small mesh sizes in those main feeding areas, the number of young trout in gill net catches could be reduced. Because the location of the main feeding areas differs around different rivers, the areas with more restricted fishing should be determined on a case-by-case basis. For example, based on the median distance, half of the recoveries of trout in the BS came from the coastal zone, extending 27 km from the river mouth. GIS tools provide a more exact method to visualize the most important feeding areas of brown trout. In spatial analyses conducted with GIS, the direc-tion of migration can also be taken into account. The legal minimum catch length for trout is one way to protect young brown trout, but the legal landing size will not save trout if they die in gill nets. A change in the legal landing size is there-fore unlikely to increase the realized catch, as the majority of brown trout are caught as a by-catch.
Knowledge of the spatial dispersal of brown trout is important in the management of the stocks, in planning protection areas and in plan-ning spatial and temporal fishing regulation. In general, sea areas within 50 km from the river mouth are the most important feeding areas for brown trout, which display differing patterns of seasonal and annual movement at different release sites. The brown trout in this study were
young (Fig. 3). Due to the high fishing mortal-ity of young brown trout in the Gulf of Bothnia (Whitlock et al. 2017) the possibilities to attain maturity and ascend their release river were low. Here we investigated only the spatial marine distribution of young feeders, because older fish were lacking as a result of the excessively heavy fishing pressure on the Finnish coastal area. The recovery rate was decreasing in the study period. In the Gulf of Bothnia it was in the 1990s 3%–10% and in the 2000s 1%–3% (ICES 2012). The recoveries were likely underreported. In the future, management and fishing regulation plans should be separately prepared for each brown trout stock and for each release site and take into account information on the observed spatial marine dispersal.
References
Bartel R., Ikonen E. & Auvinen H. 2001. Differences in migration pattern and growth of Polish and Finnish sea trout (Salmo trutta L.) released in the same areas. Arch. Pol. Fish. 9: 105–122.
Berg O.K. & Berg M. 1987. Migrations of sea trout. Salmo trutta L., from the Vardenes river in the northern Norway. J. Fish Biol. 31: 113–121.
Degerman E., Leonardsson K. & Lundqvist H. 2012. Coastal migrations, temporary use of neighbouring rivers, and growth of sea trout (Salmo trutta) from nine northern Baltic Sea rivers. ICES J. Mar. Sci. 69: 971–980.
del Villar-Guerra D., Aarestrup K., Skov C. & Koed A. 2013. Marine migrations in anadromous brown trout (Salmo trutta). Fjord residency as a possible alternative in the continuum of migration to the open sea. Ecol. Freshw. Fish 23: 594–603.
Hansen M.M. & Mensberg K.-L.D. 1998. Genetic differenti-ation and relationship between genetic and geographical distance in Danish sea trout (Salmo trutta L.) popula-tions. Heredity 81: 493–504.
Hansen M. M. Ruzzante D.E., Nielsen E.E., Bekkevold D. & Menberg K.-L.D. 2002. Long-term effective popula-tion sizes, temporal stability of genetic composition and potential for local adaptation in anadromous brown trout (Salmo trutta) populations. Mol. Ecol. 11: 2523–2535.
Heinimaa P., Jutila E. & Pakarinen T. (eds.) 2007. Baltic Sea Trout Workshop. Kalatutkimuksia — Fiskundersök-ningar 410: 1–69.
Hindar K., Jonsson B., Ryman N. & Ståhl G. 1991. Genetic relationships among landlocked, resident, and anadro-mous brown trout, Salmo trutta L. Heredity 66: 83–91.
Huhmarniemi A. 2002. Meritaimenen kalastusta koskevat rajoitukset ja meritaimenen biologinen alamitta. Kalatut-kimuksia — Fiskundersökningar 182: 50–51.
Huusko A., van der Meer O. & Koljonen M.-L. 1990. Life-

BOREAL ENV. RES. Vol. 22 • Spatial distribution of migratory Salmo trutta in the northern Baltic Sea 443
history patterns and genetic differences in brown trout (Salmo trutta L.) in Koutajoki river system. Arch. Pol. Fish. 37: 63–77.
Hyvärinen P. & Huusko A. 2006. Diet of brown trout in rela-tion to variation in abundance and size of pelagic fish prey. J. Fish Biol. 68: 87–98.
ICES 2011. Report of the Baltic Salmon and Trout Assess-ment Working Group (WGBAST), 22–30 March 2011, Riga, Latvia. ICES 2011/ACOM:08.
ICES 2013. Report of the Baltic Salmon and Trout Assess-ment Working Group (WGBAST), 3–12 April 2013, Tal-linn, Estonia. ICES CM 2013/ACOM:08.
ICES 2016. Report of the Baltic Salmon and Trout Assess-ment Working Group (WGBAST), 30 March–6 April, Klaipeda, Lithuania. ICES CM 2016/ ACOM:09.
Ikonen E. & Auvinen H. 1984. Migration of sea trout stocks in the Baltic Sea on the basis of Finnish tagging experi-ments. ICES CM 1984/M:5.
Jokikokko E. 2002. Taimenen pyynti siian kalastuksen sivu-saaliina. Kalantutkimuksia — Fiskundersökningar 182: 47–49.
Jonsson B. & Jonsson N. 2006. Life history of the anad-romous trout Salmo trutta. In: Harris G. & Milner N. (eds.), Sea Trout: Biology, Conservation and Manage-ment Proceedings of the 1st International Sea Trout Symposium, July 2004, Cardiff, Wales, UK, Blackwell Publishing Oxford, pp. 196–223.
Jonsson B. & Jonsson N. 2012. Naturally and hatchery pro-duced European trout Salmo trutta: do their marine sur-vival and dispersal differ? J. Coast. Conserv. 18: 79–87.
Jonsson N., Jonsson B., Aass P. & Hansen L.P. 1995. Brown trout Salmo trutta released to support recreational fish-ing in a Norwegian fjord. J. Fish Biol. 46: 70–84.
Jonsson N., Jonsson B., Skurdal J. & Hansen L.P. 1994. Dif-ferential response to water current in offspring of inlet- and outlet-spawning brown trout Salmo trutta. J. Fish Biol. 45: 356–359.
Jonsson B. & L’Abée-Lund J.H. 1993. Latitudinal clines in life-history variables of anadromous brown trout in Europe. J. Fish Biol. 43 (suppl. A): 1–16.
Jutila E., Ahvonen A., Laamanen M. & Koskiniemi J. 1998. Adverse impact of forestry on fish and fisheries in stream environments of the Isojoki basin, western Fin-land. Boreal Env. Res. 3: 395–404.
Jutila E., Saura A., Kallio-Nyberg I., Huhmarniemi A. & Romakkaniemi A. 2006. The status of fishing of sea trout on the Finnish coast of the Gulf of Bothnia in the Baltic Sea. In: Harris G. & Milner N. (eds.), Sea Trout: Biology, Conservation and Management Proceedings of the 1st International Sea Trout Symposium, July 2004, Cardiff, Wales, UK, Blackwell Publishing Oxford, pp. 128–138.
Järvi T.H. 1940. Sea-trout in the Bothnian Bay (Salmo trutta). Acta Zool. Fennica 29: 1–29.
Kallasvuo M., Vanhatalo J. & Veneranta L. 2016. Modeling the spatial distribution of larval fish abundance provides essential information for management. Can. J. Fish. Aquat. Sci. 74: 636–649.
Kallio-Nyberg I., Saura A. & Ahlfors P. 2002. Sea migra-tion pattern of two sea trout (Salmo trutta) stocks
released into the Gulf of Finland. Ann. Zool. Fennici 39: 221–235.
Kallio-Nyberg I., Jutila E., Jokikokko E. & Saloniemi I. 2006. Survival of reared Atlantic salmon and sea trout in relation to marine conditions of smolt year in the Baltic Sea. Fish. Res. 80: 295–304.
Kallio-Nyberg I., Jutila E., Koljonen M.-L., Koskiniemi J. & Saloniemi I. 2010. Can the lost migratory Salmo trutta stocks be compensated with resident trout stocks in coastal rivers? Fish. Res. 102: 69–79.
Kallio-Nyberg I., Peltonen H. & Rita H. 1999. Effects of stock-specific and environmental factors on the feeding migration of Atlantic salmon (Salmo salar) in the Baltic Sea. Can. J. Fish. Aquat. Sci. 56: 853–861.
Kallio-Nyberg I., Saloniemi I., Jutila E. & Saura A. 2007. Effects of marine conditions, fishing, and smolt traits on the survival of tagged, hatchery-reared sea trout (Salmo trutta trutta) in the Baltic Sea. J. Fish. Aquat. Sci. 64: 1183–1198.
Kallio-Nyberg I., Saloniemi I. & Jutila E. 2015. Growth of hatchery-reared sea trout (Salmo trutta trutta) on the Finnish coast of the Baltic Sea. Boreal Env. Res. 20: 19–34.
Karlsson L., Ikonen E., Mitans A. & Hansson S. 1999. The diet of salmon (Salmo salar) in the Baltic Sea and con-nections with the M74 syndrome. Ambio 28: 37–42.
Koljonen M.-L., Gross R. & Koskiniemi J. 2014. Wild Estonian and Russian sea trout (Salmo trutta) in Finnish coastal sea trout catches: results of genetic mixed-stock analysis. Hereditas 151: 177–195.
Lundqvist H., McKinnell S.M., Jonsson S. & Östergren J. 2006. Is stocking with sea trout compatible with the conservation of wild trout (Salmo trutta)? In: Harris G. & Milner N. (eds.), Sea Trout: Biology, Conservation and Management Proceedings of the 1st International Sea Trout Symposium, July 2004, Cardiff, Wales, UK, Blackwell Publishing Oxford, pp. 356–371.
Lehtonen H., Hansson S. & Winkler H. 1996. Biology and exploration of pikeperch, Stizostedion lucioperca (L.) in the Baltic Sea. Ann. Zool. Fennici 33: 525–535.
Östergren J., Lundqvist H. & Nilsson J. 2011. High variability in spawning migration of sea trout, Salmo trutta, in two northern Swedish rivers. Fish. Manage. Ecol. 18: 72–82.
Östergren J., Nilsson J. & Lundqvist H. 2012. Linking genetic assignment test with telemetry enhances under-standing of spawning migration and homing in sea trout Salmo trutta L. Hydrobiologia 691: 123–134.
Östergren J., Nilsson J., Lundqvist H., Dannewitz J. & Palm S. 2015. Genetic baseline for conservation and manage-ment of the trout in the northern Baltic Sea. Conserv. Gen. 17: 177–191.
Østergaard S., Hansen M.M., Loeschcke V. & Nielsen E.E. 2003. Long-term temporal changes of genetic composi-tion in brown trout (Salmo trutta L.) populations inhabit-ing an unstable environment. Mol. Ecol. 12: 3123–3135.
Rikardsen A.H., Amundsen P.-A., Knudsen R. & Sandring S. 2006. Seasonal marine feeding and body condition of sea trout (Salmo trutta) at its northern distribution. ICES J. Mar. Sci. 3: 466–475.
SAS Institute 2012. SAS OnlineDoc® version 9.3. SAS Insti-

444 Kallio-Nyberg et al. • BOREAL ENV. RES. Vol. 22
tute Inc., Cary, NC.Saura A. 2002. Meritaimenen kalastus Pohjanlahdella.
Kalantutkimuksia — Fiskundersökningar 182: 29–43.Svärdson G. & Fagerström Å. 1982. Adaptive differences
in the long-distance migration of some trout (Salmo trutta L.) stocks. Report of the Institute of Freshwater Research, Drottningholm 60: 51–80.
Urho L., Pennanen J.T. & Koljonen M.-L. 2010. Fish. In: Rassi P., Hyvärinen E., Juslén A. & Mannerko-ski I. (eds.) The 2010 Red List of Finnish Species, Ympäristöministeriö & Suomen ympäristökeskus, Hel-sinki, pp. 336–343.
Toivonen J. & Tuhkunen A. 1975. Migration of the trout along the coastal waters of Finland on the basis of tag-ging experiments. ICES CM 1975/M:3.
Veneranta L., Hudd R. & Vanhatalo J. 2013. Reproduction areas of sea-spawning coregonids reflect the environ-ment in shallow coastal waters. Mar. Ecol. Prog. Ser. 477: 231–250.
Veneranta, L., Pakarinen, T., Jokikokko, E. Kallio-Nyberg, I. & Harjunpää, H. 2017. Mortality of Baltic Sea trout (Salmo trutta) after release from gillnets. J. Appl. Ichtyol. [In press; doi:10.1111/jai.13517].
Whitlock R.E., Kopra J., Pakarinen T., Jutila E., Leach A.W., Levonti P., Kuikka S. & Romakkaniemi A. 2017. Mark-recapture estimation of mortality and migration rates for sea trout (Salmo trutta) in the northern Baltic Sea. ICES J. Mar. Sci. 74: 286–300.
Voipio A. (ed.) 1981. The Baltic Sea. Elsevier Publishing Company, Amsterdam.