spatial ecology of black and turkey vultures in the
TRANSCRIPT

SPATIAL ECOLOGY OF BLACK AND TURKEY VULTURES IN THE
SOUTHEASTERN UNITED STATES
by
AMANDA E. HOLLAND
(Under the Direction of James C. Beasley and Robert J. Warren)
ABSTRACT
Knowledge of the spatial ecology of black (Coragyps atratus) and turkey vultures
(Cathartes aura) is surprisingly limited, despite these species’ importance in ecosystem function
and considering economic costs associated with human-vulture conflicts. To build upon our
understanding of the spatial ecology of sympatric black and turkey vultures in the southeastern
United States, I collected >2.8-million GPS locations from 9 black and 9 turkey vultures from
2013-2015 using solar-powered GSM/GPS transmitters. From these data, I developed monthly
home ranges and core areas using the dynamic Brownian Bridge Movement Model, and
quantified and compared space use, activity patterns, roost reuse frequency, roost site fidelity,
habitat characteristics of evening roosts, and aspects of resource selection based on utilization
distributions by species and sex across multiple spatio-temporal scales. My results build upon
understandings of vulture spatial ecology and provide insights into mechanisms underlying
facilitation of niche differentiation between these sympatric species.
INDEX WORDS: Black Vulture, Turkey Vulture, Spatial Ecology, Home Range,
Resource Selection, Habitat Characteristics, Utilization Distributions, GPS Tracking

SPATIAL ECOLOGY OF BLACK AND TURKEY VULTURES IN THE
SOUTHEASTERN UNITED STATES
by
AMANDA E. HOLLAND
B.S., Fisheries & Wildlife Science, Oregon State University, 2011
A Thesis Submitted to the Graduate Faculty of the University of Georgia in Partial Fulfillment of
the Requirements for the Degree
MASTER OF SCIENCE
ATHENS, GEORGIA
2015

© 2015
Amanda E. Holland
All Rights Reserved

SPATIAL ECOLOGY OF BLACK AND TURKEY VULTURES IN THE
SOUTHEASTERN UNITED STATES
by
AMANDA E. HOLLAND
Major Professors: James C. Beasley
Robert J. Warren
Committee: Jeffrey Hepinstall-Cymerman
Travis L. DeVault
Electronic Version Approved:
Suzanne Barbour
Dean of the Graduate School
The University of Georgia
December 2015

iv
DEDICATION
I dedicate this to my best friend, Keith Holland.

v
ACKNOWLEDGEMENTS
I would like to express my sincerest appreciation to Jim Beasley for providing me the
opportunity to participate in the study of my favorite group of animals and for his guidance and
professional support over the years. Thank you, Jim. Thanks also to Jeff Hepinstall-Cymerman
and Mike Byrne who each contributed enormously by sharing their comments, criticisms, and
invaluable expertise in spatial analysis. And special thanks to Travis DeVault for paving the way
for vulture research here at the Savannah River Site and for his thought-provoking discussion as
a committee-member. And my sincerest thanks to Bob Warren for his encouragement as co-
advisor and committee member, and for providing inspiration as a leader in wildlife research.
A sky full of thank-yous goes especially to Larry Bryan for his invaluable support at the
onset of this study. When the idea of trapping ~300 vultures seemed dubious at best, Larry’s
patience and tolerance to being snapped at by angry black vultures was astounding. Without your
help, Larry, this would not have been possible, and I thank you. Immense gratitude goes also to
Zak Smith for his unfettered enthusiasm in working with vultures (a characteristic I deeply
admire). And to the many volunteers who dropped everything to quickly assist in vulture-
handling during some of the larger trapping events including Bobby Kennamer, Sarah Webster,
Kelsey Turner, Erin Abernethy, Cara Love, Caitlin Rumrill, Chris Leapheart, Katherine
Worsley-Tonks, Lincoln Oliver, Rich Beimiller, and others. Thanks also to Shannon Curry and
Karen Christ for offering guidance and assistance in blood collection, to Liz Kierepka for
offering advice on statistics analyses, and to Rochelle Beasley, Jason O’Bryhim and others at the
Lance Lab at the Savannah River Site for their assistance in genetics analyses.

vi
This thesis would not have been possible without the support of many agencies,
organizations, and technical resources. This material is based upon work supported by the US
Department of Energy under Award No. DE-FC09-07SR22506 to the UGA Research
Foundation, US Department of Agriculture’s Animal and Plant Health Inspection
Service/Wildlife Services and National Wildlife Research Center, and the US Department of
Transportation/Federal Aviation Administration, and the Georgia Museum of Natural History.
Technical resources were provided in part by the Georgia Advanced Computing Resource
Center, a partnership between the UGA’s Office of the Vice President for Research and Office of
the Vice President for Information Technology.
To the many individuals at the Savannah River Ecology Lab who provided support,
friendship, encouragement, and a sense of community over the years, I thank you. Thanks also to
Gene Rhodes for his pivotal role in providing me this opportunity. A teaching assistantship
provided through the Warnell School of Forestry & Natural Resources made it possible for me to
be a graduate student bouncing between Athens, Georgia and Aiken, South Carolina.
Very special acknowledgement goes to my late Aunt Eleanor Knowles Laney. She
recognized my interest in animals and encouraged me to study wildlife at a very early age.
Through the legacy of her own remarkable achievements, Aunt Ellie taught me to travel
whenever possible, love the process of education, forever be a student, and always check for
grammatical errors. I believe she would have been proud of my accomplishments thus far. I must
also acknowledge my unwaveringly supportive mother, Kathryn Trulson. She inspired me to
believe that almost anything is possible with enough determination, drive, delicious meals, and
the right musical accompaniment. I thank you, mom, and love you more than you can ever know.

vii
And finally, thanks to my partner and best friend in life, Keith Holland. Were it not for
his constant support, adventurous spirit, sense of humor, and delicious breakfasts, I would not
have made it this far. Thank you, my love.

viii
TABLE OF CONTENTS
Page
ACKNOWLEDGEMENTS ............................................................................................................ v
LIST OF TABLES .......................................................................................................................... x
LIST OF FIGURES ..................................................................................................................... xiii
CHAPTER 1. INTRODUCTION AND LITERATURE REVIEW ............................................... 1
LITERATURE CITED ................................................................................................. 8
CHAPTER 2. FINE-SCALE ASSESSMENT OF MONTHLY HOME RANGES AND
ACTIVITY PATTERNS FOR RESIDENT BLACK AND TURKEY VULTURES IN THE
SOUTHEASTERN UNITED STATES SOUTHEASTERN UNITED STATES ........................ 13
ABSTRACT ................................................................................................................. 14
INTRODUCTION ....................................................................................................... 15
METHODS .................................................................................................................. 19
RESULTS ..................................................................................................................... 27
DISCUSSION .............................................................................................................. 29
LITERATURE CITED ............................................................................................... 50
CHAPTER 3. CHARACTERISTICS OF RESOURCE SELECTION FOR BLACK AND
TURKEY VULTURES IN THE SOUTHEASTERN UNITED STATES................................... 55
ABSTRACT ................................................................................................................. 56
INTRODUCTION........................................................................................................ 57

ix
METHODS .................................................................................................................. 60
RESULTS ..................................................................................................................... 67
DISCUSSION .............................................................................................................. 69
LITERATURE CITED ............................................................................................... 92
CHAPTER 4. CONCLUSION...................................................................................................... 99

x
LIST OF TABLES
Page
Table 2-1. Mean positional error (m) of GPS locations collected by 3 Microwave Telemetry
solar-powered GPS/GSM avian transmitters in the horizontal and vertical
dimensions across three test treatments; 1: transmitters on ground under open
canopy, 2: transmitters on ground under forest canopy, and 3: transmitters
suspended 11 m off the ground under open canopy. Number of GPS locations for
each treatment=672. ................................................................................................. 34
Table 2-2. Number of locations received and range of dates over which GPS transmitters were
carried for each adult vulture. Species: BLVU=black vulture (Coragyps atratus),
TUVU=turkey vulture (Cathartes aura); ID: patagial tag identification number;
Sex: F=female, M=male, U=unknown. Transmitter Deployment Start/End
Date/Time: year/month/day hour:minute:second, Greenwich Mean Time (GMT). 35
Table 2-3. Individual vultures included in monthly space use and activity pattern analyses.
Grey fields indicate inclusion in analyses; crossed grey fields indicate exclusion
from space use analysis due to migratory movements for that month; white fields
indicate exclusion due to partial data for that month; black fields indicate no data
and thus exclusion from space use analysis. BLVU=black vulture (Coragyps
atratus), TUVU=turkey vulture (Cathartes aura). ID: Patagial tag identification
number. Sex: F=female, M=male. Year 1=1 September 2013 – 31 August 2014;
Year 2=1 September 2014 – 31 August 2015. ......................................................... 37

xi
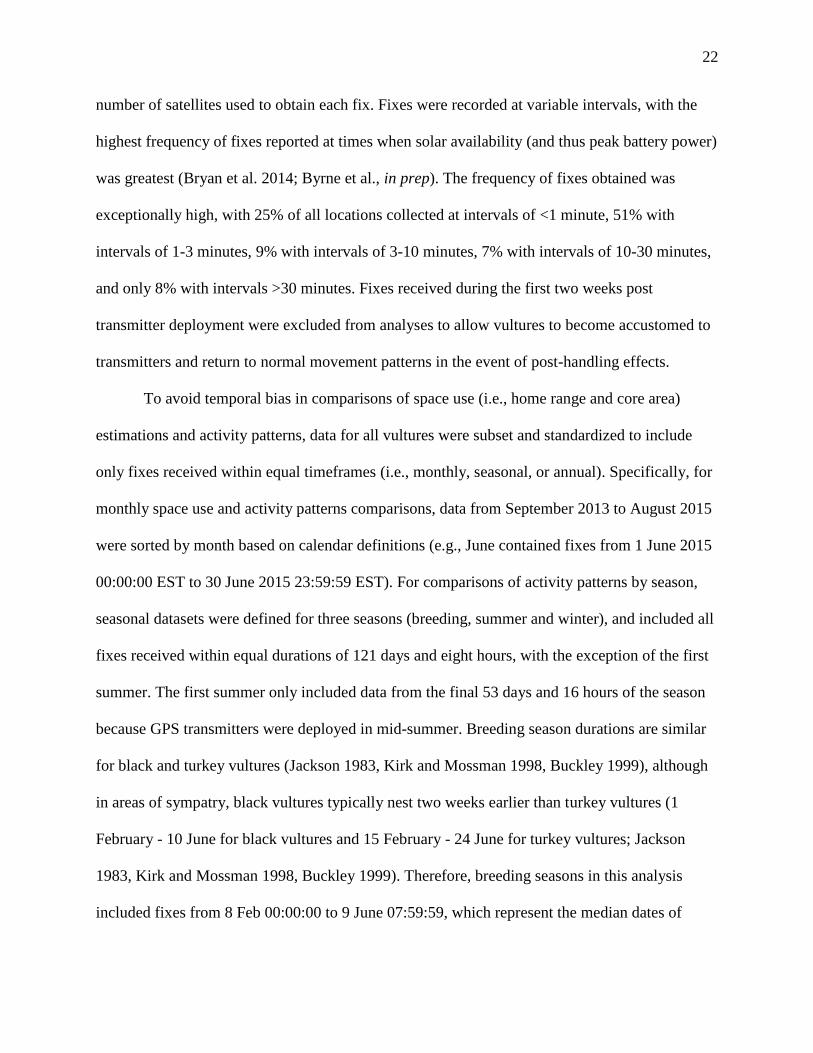
Table 2-4. Individual vultures included in seasonal activity pattern analyses. Grey fields
indicate inclusion in analyses; white fields indicate exclusion due to partial data for
that month. BLVU=black vulture (Coragyps atratus), TUVU=turkey vulture
(Cathartes aura). ID: Patagial tag identification number. Sex: F=female, M=male.
Year 1=16 August 2013 00:00:00 EST – 9 June 2014 07:59:59 EST; Year 2=9 June
2014 08:00:00 EST – 9 June 2015 07:59:59 EST.................................................... 38
Table 3-1. Habitat variables and associated descriptions for resource selection analyses
conducted for black and turkey vultures monitored with GPS transmitters in the
southeastern U.S. ..................................................................................................... 75
Table 3-2. Table of individual vultures (ID) included in seasonal roost habitat analyses and
number of nights (n) included per season. Species: BLVU=black vulture (Coragyps
atratus), TUVU=turkey vulture (Cathartes aura); ID#: Patagial Tag Identification
Number; Sex: F=female, M=male. : included; -: not included in analyses. ......... 76
Table 3-3. Model selection results for repeated measures mixed model analyses based on
selection ratios (sr) for individual habitat types by species (spp), month (mo) and
sex (sex) within 100% home ranges with individual animal (id) as random effect. 81

xiii
LIST OF FIGURES
Page
Figure 2-1. Net-squared displacement from evening roost locations for 2 female (purple) and 7
male (olive) turkey vultures (TUVU; Cathartes aura) derived from GPS location
data from 16 August 2013 – 9 June 2015. TUVU-ID#=Patagial tag identification
number. Migratory movements shown by elevated peaks within winter seasons (7
October – 8 February) bounded by blue-grey boxes. Migratory movements evident
for 2 female turkey vultures: TUVU-01 and TUVU-03. ......................................... 40
Figure 2-2. Net-squared displacement from evening roost locations for 4 female (purple) and 5
male (olive) black vultures (BLVU; Coragyps atratus) derived from GPS location
data from 16 August 2013 – 9 June 2015. BLVU-ID#=Patagial tag identification
number. Migratory movements would be shown by elevated peaks within winter
seasons (7 October – 8 February) bounded by blue-gray boxes. No migratory
movements evident for black vultures in this analysis. ........................................... 41
Figure 2-3. Median (±95% CIs) monthly 95% home range sizes (km2) for 9 black (Coragyps
atratus; total locations=804,470; mean locations/month=8,429, max=14,391,
min=895) and 9 turkey (Cathartes aura; total locations=1,372,194; mean
locations/month=9,026, max=16,566, min=531) vultures calculated from GPS
locations collected 1 September 2013 - 31 August 2015. BLVU=black vulture;
TUVU=turkey vulture. Home ranges developed using the dynamic Brownian
Bridge Movement Model. ........................................................................................ 42

xiv
Figure 2-4. Mean (±95% CIs) monthly 50% core area sizes (km2) for 9 black (Coragyps
atratus; total locations=804,470; mean locations/month=8,429, max=14,391,
min=895) and 9 turkey (Cathartes aura; total locations=1,372,194; mean
locations/month=9,026, max=16,566, min=531) vultures calculated from GPS
locations collected 1 September 2013 - 31 August 2015. BLVU=black vulture;
TUVU=turkey vulture. Core areas developed using the dynamic Brownian Bridge
Movement Model. .................................................................................................... 43
Figure 2-5. Mean (±95% CIs) monthly 95% home range sizes (km2) for 5 male (total
locations=437,629; mean locations/month=8,429, max=14,391, min=3,164) and 4
female (total locations=363,210; mean locations/month=7,753, max=13,340,
min=895) resident black vultures (Coragyps atratus) calculated from GPS locations
collected 1 September 2013 - 31 August 2015. Home ranges developed using the
dynamic Brownian Bridge Movement Model. ........................................................ 44
Figure 2-6. Mean (±95% CIs) monthly 50% core area sizes (km2) for 5 male (total
locations=437,629; mean locations/month=8,429, max=14,391, min=3,164) and 4
female (total locations=363,210; mean locations/month=7,753, max=13,340,
min=895) resident black vultures (Coragyps atratus) calculated from GPS locations
collected 1 September 2013 - 31 August 2015. Core areas developed using the
dynamic Brownian Bridge Movement Model. ........................................................ 45
Figure 2-7. Mean (±95% CIs) proportion of switch (i.e., transitions between movement and
stationary) state locations from among GPS locations collected for 9 black
(Coragyps atratus; total locations=990,289; mean=110,032; max=171,932;
min=29,808) and 9 turkey (Cathartes aura; total locations=1,595,225;

xv
mean=177,247; max=241,187; min=38,694) vultures from 1 September 2013 to 31
August 2015. BLVU=black vulture; TUVU=turkey vulture. .................................. 46
Figure 2-8. Mean (±95% CIs) proportion of locations characterized as transit (i.e., flight) state
by month from among GPS locations collected for 9 black (Coragyps atratus; total
locations=990,289; mean=110,032; max=171,932; min=29,808) and 9 turkey
(Cathartes aura; total locations=1,595,225; mean=177,247; max=241,187;
min=38,694) vultures from 1 September 2013 to 31 August 2015. BLVU=black
vulture; TUVU=turkey vulture. ............................................................................... 47
Figure 2-9. Mean (±95% CIs) proportion of locations characterized as transit (i.e., flight) state
by season from among GPS locations collected for 9 black (Coragyps atratus; total
locations=990,289; mean=110,032; max=171,932; min=29,808) and 9 turkey
(Cathartes aura; total locations=1,595,225; mean=177,247; max=241,187;
min=38,694) vultures from 1 September 2013 to 31 August 2015. BLVU=black
vulture; TUVU=turkey vulture. ............................................................................... 48
Figure 2-10. Mean (±95% CIs) proportion of locations characterized as transit (i.e., flight) state
by year from among GPS locations collected for 9 black (Coragyps atratus; total
locations=990,289; mean=110,032; max=171,932; min=29,808) and 9 turkey
(Cathartes aura; total locations=1,595,225; mean=177,247; max=241,187;
min=38,694) vultures from 1 September 2013 to 31 August 2015. BLVU=black
vulture; TUVU=turkey vulture. ............................................................................... 49
Figure 3-1. Extent of study area for resource selection analysis including major portions of
South Carolina, Georgia and Florida in the southeastern United States. ................ 74

xvi
Figure 3-2. Mean (±95% CI) proportions of (a) wetland, (b) developed/urban, (c) forest, and
(d) developed/open habitat types comprising evening roosts across breeding (B),
summer (S), and winter (W) seasons for 9 black (BLVU; Coragyps atratus), and 9
turkey (TUVU; Cathartes aura) vultures monitored with GPS transmitters in the
southeastern U.S. ..................................................................................................... 77
Figure 3-3. Mean (±95% CI) proportions of (a) undeveloped/open, (b) distances of 0-500m
from road (c) distances of 0-500m from landfill, and (d) distances of 500-1,000m
from landfill habitat types comprising evening roosts across breeding (B), summer
(S), and winter (W) seasons for 9 black (BLVU; Coragyps atratus), and 9 turkey
(TUVU; Cathartes aura) vultures monitored with GPS transmitters in the
southeastern U.S. ..................................................................................................... 78
Figure 3-4. Mean (±95% CI) proportions of (a) developed/urban, and (b) distances of 0-500m
from landfill habitat types comprising evening roosts across breeding (B), summer
(S), and winter (W) seasons for 9 black (BLVU; Coragyps atratus), and 9 turkey
(TUVU; Cathartes aura) vultures monitored with GPS transmitters in the
southeastern U.S. ..................................................................................................... 79
Figure 3-5. Mean (±95% CI) proportions of (a) developed/urban and (b) developed/open
habitat types comprising evening roosts across breeding (B), summer (S), and
winter (W) seasons of 5 male and 4 female black vultures (Coragyps atratus)
monitored with GPS transmitters in the southeastern U.S. ...................................... 79
Figure 3-6. (a) Roost reuse (±95% CI) and (b) site fidelity (±95% CI) across breeding, summer,
and winter seasons for 9 black (BLVU; Coragyps atratus), and 9 turkey (TUVU;

xvii
Cathartes aura) vultures monitored with GPS transmitters in the southeastern U.S.
.................................................................................................................................. 80
Figure 3-7. (a) Roost reuse (±95% CI) and (b) site fidelity (±95% CI) across breeding, summer,
and winter seasons for 5 male and 4 female black vultures (Coragyps atratus)
monitored with GPS transmitters in the southeastern U.S. ...................................... 80
Figure 3-8. Mean (±SE) selection ratios (ln(rf)) for wetland habitat within 100% home ranges
calculated from utilization distributions of 9 black (Coragyps atratus; BLVU;) and
9 turkey (Cathartes aura; TUVU) vultures tracked via GPS transmitters from
September 2013 to August 2015. ............................................................................. 84
Figure 3-9. Mean (±SE) selection ratios (ln(rf)) for forest habitat within 100% home ranges
calculated from utilization distributions of 9 black (Coragyps atratus; BLVU) and 9
turkey (Cathartes aura; TUVU) vultures tracked via GPS transmitters from
September 2013 to August 2015. ............................................................................. 85
Figure 3-10. Mean (±SE) selection ratios (ln(rf)) for developed habitat within 100% home
ranges calculated from utilization distributions of 9 black (Coragyps atratus;
BLVU) and 9 turkey (Cathartes aura; TUVU) vultures tracked via GPS
transmitters from September 2013 to August 2015. ................................................ 86
Figure 3-11. Mean (±SE) selection ratios (ln(rf)) for developed/open habitat within 100% home
ranges calculated from utilization distributions of 9 black (Coragyps atratus;
BLVU) and 9 turkey (Cathartes aura; TUVU) vultures tracked via GPS
transmitters from September 2013 to August 2015. ................................................ 87
Figure 3-12. Mean (±SE) selection ratios (ln(rf)) for undeveloped/open habitat within 100%
home ranges calculated from utilization distributions of 9 black (Coragyps atratus;

xviii
BLVU) and 9 turkey (Cathartes aura; TUVU) vultures tracked via GPS
transmitters from September 2013 to August 2015. ................................................ 88
Figure 3-13. Mean (±SE) selection ratios (ln(rf)) for habitat within distances of 0-500m from
landfill within 100% home ranges calculated from utilization distributions of 9
black (Coragyps atratus; BLVU) and 9 turkey (Cathartes aura; TUVU) vultures
tracked via GPS transmitters from September 2013 to August 2015. ..................... 89
Figure 3-14. Mean (±SE) selection ratios (ln(rf)) for habitat within distances of 500-1,000m
from landfill within 100% home ranges calculated from utilization distributions of 9
black (Coragyps atratus; BLVU) and 9 turkey (Cathartes aura; TUVU) vultures
tracked via GPS transmitters from September 2013 to August 2015. ..................... 90
Figure 3-15. Mean (±SE) selection ratios (ln(rf)) for habitat within distances of 0-500m from
road within 100% home ranges calculated from utilization distributions of 9 black
(Coragyps atratus; BLVU) and 9 turkey (Cathartes aura; TUVU) vultures tracked
via GPS transmitters from September 2013 to August 2015. .................................. 91

1
CHAPTER 1. INTRODUCTION AND LITERATURE REVIEW
Black (Coragyps atratus) and turkey vultures (Cathartes aura) are obligate scavengers
that forage almost exclusively on carrion (Kirk and Mossman 1998, Buckley 1999). These
broad-winged, large-bodied birds utilize both natural and anthropogenic thermals and wind
energy to soar long distances with minimal energy expenditure (Mandel and Bildstein 2007,
Mandel et al. 2008). Both species have adapted relatively well in the face of anthropogenic
changes to the landscape and populations have increased over the last several decades (Kirk and
Mossman 1998, Ogada et al. 2012a). Typically associated with road kill, agricultural areas, and
landfills, black and turkey vultures commonly use anthropogenic sources for forage and roost
sites (Kirk and Mossman 1998, Buckley 1999), often roosting on human-made structures
(Buckley 1998, Avery et al. 2002, Evans and Sordahl 2009) and occasionally nesting in
abandoned buildings (Kirk and Mossman 1998, Buckley 1999).
The regular association of vultures with human-dominated landscapes frequently results
in conflict. Collisions with human structures (commonly known as “bird-strikes”), including
airplanes, automobiles, wind turbines, buildings, communication towers, and electric
infrastructure, are major reasons for a better understanding of the movement patterns of vultures
and other birds (Marra et al. 2009, Avery et al. 2011, Dolbeer 2011, Martin et al. 2011, Loss et
al. 2012, Walter et al. 2012). Considering substantial body sizes averaging 2.2 kg and 2 kg,
respectively (Kirk and Mossman 1998, Buckley 1999) and propensity to kettling, or circling
flights in groups, (Kirk and Mossman 1998, Buckley 1999), black and turkey vultures are some
of the most hazardous species to aircraft (Blackwell and Wright 2006, DeVault et al. 2011,

2
Dolbeer et al. 2012). These species are a major cause of damaging bird-strikes at airfields (Avery
2004, Dolbeer et al. 2012, Dolbeer et al. 2014). Between 1990 and 2013, in the United States
alone, over 55% of reported civil aircraft strikes with vultures resulted in damages, the costs of
which exceeded US$28 million and over 48,000 hours of aircraft down-time, although these
reported costs are drastic underestimations (roughly 20%) of actual estimates because not all
wildlife strikes are adequately reported (Blackwell and Wright 2006, Dolbeer et al. 2014).
Adding to the hazards that vultures pose to aircraft is the observation that populations of black
and turkey vultures are increasing (Avery 2004, Sauer et al. 2012). However, this trend is in
dramatic contrast to the sudden and extreme declines that other vulture species have been
experiencing in recent years.
Globally, 61% of vulture species are currently threatened with extinction (Ogada et al.
2012a) due to a variety of causes including direct persecution by humans (i.e., shootings,
poisonings and harassment) and secondary effects resulting in unintentional harm. For example,
Asian populations of Gyps vultures have declined by more than 95% due to renal failure caused
by ingesting carcasses treated with the anti-inflammatory drug diclofenac (Ogada et al. 2012a).
In addition, efforts to recover the critically-endangered California condor (Gymnogyps
californianus) in western North America have been hampered by poisonings caused by
accidental ingestion of lead ammunition fragments in unretrieved carcasses and gut piles
(Walters et al. 2010). Moreover, vulture populations worldwide are detrimentally impacted when
they consume carnivore carcasses of animals deliberately poisoned by humans (Ogada et al.
2012a, DeVault et al. in press).
Vultures play a critical role in ecosystems and the impact of global vulture declines are
largely underestimated (Sekercioglu et al. 2004, Sekercioglu 2006, Moreno-Opo et al. 2012,

3
Ogada et al. 2012a, Ogada et al. 2012b). Vultures are highly adapted for carcass location and
consumption (Kirk and Mossman 1998, Buckley 1999) and are excellent competitors for carrion
resources (Sebastián-González et al. 2013, DeVault et al. in press). Vultures have highly acidic
stomachs effectively capable of removing pathogens within carcasses (Houston and Cooper
1975), thus, their presence in ecosystems help to reduce bacterial infection rates (Sekercioglu
2006, DeVault et al. in press). Undeniably, the detrimental effects of the ecological absence of
vultures are considerable. For example, following the ecological extinction of vultures in India
(Ogada et al. 2012b), competition at carrion resources declined and populations of rats and feral
dogs increased, causing a significant human health concern (Ogada et al. 2012b). Indeed, the
human health costs associated with the loss of vulture species in India were estimated to exceed
US$34 billion between 1993 and 2006 due to elevated risks of rabies from feral dog bites
(Markandya et al. 2008). The ecological implications of vulture declines in many other systems
have yet to be fully described but are likely to be considerable (Sebastián-González et al. 2013,
DeVault et al. in press).
Despite the ubiquity of vultures in the Americas and their association with human-
dominated landscapes, black and turkey vultures are surprisingly understudied. A few studies
have estimated home ranges using a variety of tracking techniques and home range estimator
methods (Coleman and Fraser 1989, Arrington 2003, DeVault et al. 2004, Avery et al. 2011,
Houston et al. 2011, Fischer et al. 2013, Hedlin et al. 2013). However, comparisons of vulture
home ranges calculated using similar estimator methods reveal substantial variation both within
and among species and across regions (DeVault et al. 2004, Fischer et al. 2013). For example,
estimations of mean annual 95% fixed-kernel density (KDE) home ranges were over 20 and 38
times larger for black and turkey vultures on the southern coast of South Carolina than the

4
heavily forested Savannah River Site in South Carolina (DeVault et al. 2004, Fischer et al.
2013). Variations may be explained in part by differences in sample size, accuracy of tracking
techniques, and estimator methods, but also may be due to differences in habitat quality and
resource availability between sites (DeVault et al. 2004, DeVault et al. 2005, Kelly et al. 2007,
Rolando 2002). Additionally, differences in physiological condition (López-López et al. 2013),
social status (Donázar et al. 1999, Wallace and Temple 1987), and competition (Buckley 1996,
Buckley 1998, DeVault et al. 2005, Donázar et al. 1999, Kirk and Houston 1995, Wallace and
Temple 1987) may result in home range size variation.
The need to assess underlying factors that influence patterns of vulture movement and
resource selection are underscored by the variations in prior home range estimates across
landscapes (Coleman and Fraser 1989, DeVault et al. 2005). A bird’s annual movement patterns
are influenced not only by external factors, such as weather, climate and habitat, but also
physiological factors (DeVault et al. 2005, Donázar et al. 1999, López-López et al. 2013, Mandel
et al. 2008, Ramenofsky et al. 2012, Rolando 2002). Sex is one biological factor that has been
found to play a role in explaining differences in movement and foraging patterns of Andean
condors (Vultur gryphus) (Donázar et al. 1999) and other animals (Austin et al. 2004, Tracey et
al. 2013). Because vultures are highly social, exhibiting hierarchical behavior between
individuals and groups that forage and roost together (Kirk and Houston 1995, Kirk and
Mossman 1998, Buckley 1999), sex may be an important factor to consider when determining
variations in movement patterns and resource selection among vultures (Donázar et al. 1999,
Evans and Sordahl 2009, Wallace and Temple 1987). Black and turkey vultures are sexually
monomorphic (Kirk and Mossman 1998, Buckley 1999) making it difficult, if not impossible, to
determine sex of individuals based on phenotype. For an assessment comparing home range sizes

5
in breeding (n=6; Houston et al. 2011) and wintering (n=4; Hedlin et al. 2013) seasons for
migratory turkey vultures, sex was determined in a single vulture based on observations of
copulation events and two other vultures based on DNA sex determination from feather samples
(Hedlin et al. 2013, Houston et al. 2011); no other studies have quantified movement behavior
patterns based on sex for these species. Moreover, vulture movement patterns change over the
course of an annual cycle (López-López et al. 2013). Coleman and Frasier (1989) found mean
summer (15 March – 14 September) home ranges to be more than double the size of winter (15
September – 14 March) home ranges for black and turkey vultures in southern Pennsylvania and
northern Maryland. Vulture movements are also expected to be centered on the nest location
during breeding season (Houston et al. 2011), but may be more ephemeral during the non-
breeding season. Home ranges have been estimated only once with consideration to breeding
(Houston et al. 2011) and winter seasons (Hedlin et al. 2013) but these were estimated for
migratory turkey vultures that breed and winter in entirely difference regions. No prior studies
have estimated home ranges with consideration to the effects of sex and seasons for non-
migratory black or turkey vultures.
Competition for and spatial arrangement of carrion resources can influence movement
and foraging patterns of scavenging birds (Kirk and Currall 1994, Donázar et al. 1999, Austin et
al. 2004, DeVault et al. 2004, Ramenofsky et al. 2012). Interspecific differences in resource
selection and movement patterns likely exist as turkey vultures locate carrion by enhanced
olfaction as well as vision, whereas black vultures locate carrion primarily by visual detection
alone (Kirk and Mossman 1998, Buckley 1999). Interestingly, Coleman and Fraser (1989) found
no evidence of territorial defense or differences in selection of roosting, nesting, and foraging
sites for sympatric black and turkey vultures tracked by VHF radio telemetry in the Mid-Atlantic

6
region. However, niche segregation by habitat was indeed evident in sympatric vultures
wintering in Venezuela (Kirk and Currall 1994). Spatial differences in resource selection by
species might be increasingly evident at finer scales.
Quantifying characteristics of spatial ecology and resource selection for roosting and
foraging habitats of sympatric black and turkey vultures in the southeastern United States will
provide benefits to vulture management and conservation. Prior assessments have described
substantial variation in individual vulture movements; therefore, a critical need remains to
elucidate potential factors contributing to such variations. Recent advancements in tracking
device technologies allow the collection of fine-scale spatial data, information that has been
unattainable in many previous studies of vulture spatial ecology. Utilization of GPS satellite
transmitters to monitor fine-scale vulture movements and the potential differences in resource
utilization among individuals and between species will enhance our understanding of spatial
ecology of sympatric black and turkey vultures in the southeastern United States. This research
seeks to fill these important gaps by quantifying the space use and resource selection patterns of
sympatric black and turkey vultures with greater resolution than previous studies conducted on
these species.
The goals of this research, therefore, are to improve understandings of vulture spatial
ecology and resource selection by sympatric species at multiple spatial and temporal scales to
help inform management and conservation of black and turkey vultures in the southeastern
United States. In Chapter 2, home ranges and core areas are delineated using the dynamic
Brownian Bridge Movement Model (Kranstauber et al. 2012), activity patterns quantified from
flight and stationary fixes, and measures of roost reuse and roost site fidelity are quantified and
compared among species, sexes, and seasons. In Chapter 3, habitat attributes associated with

7
vulture evening roost sites are assessed seasonally, differences in seasonal reuse frequency and
site fidelity of vultures to evening roost sites are quantified, and differences in monthly resource
selection within home ranges are elucidated with consideration to species and sex.
To accomplish this research, 295 vultures were trapped using an air-propelled net-cannon
at sites baited with wild pig (Sus scrofa) or similar carcasses at multiple sites interspersed
throughout the Savannah River Site, South Carolina, USA (33.24º N, 81.67º W). I affixed one of
20 solar-powered 70-g Groupe Spécial Mobile/Global Positioning System (GSM/GPS)
transmitters to a total of 27 adult vultures (13 black and 14 turkey) via backpack harness. Each of
the 27 vultures carried one of 20 GSM/GPS transmitters over a range of durations. Five
transmitters stopped reporting locations sometime after deployment and were never recovered
(lost). One lost transmitter was affixed to a black vulture for which no locations were ever
reported and was thus unrecoverable after the bird was released. The other four lost transmitters
were affixed to three turkey vultures and one black vulture for which locations were reported
over a range of durations before locations simply stopped reporting for no obvious reason. It is
presumed that these transmitters were dropped from the birds in areas without adequate GSM
cell coverage or the transmitters possibly failed due to mechanical issues. Transmitters dropped
from vultures six times due to harness failures but were recoverable and redeployed. Two
transmitters were removed from black vultures due to mortalities and redeployed. Of the 20
transmitters deployed, 11 were carried for over two years, five were carried for over one year,
two were carried for five and eight months, respectively, and two were carried for over two
months. The GSM/GPS transmitters recorded locations at variable intervals, with highest
frequency of reported locations at times when solar availability (and thus peak battery power)
was highest (Bryan et al. 2014). Vulture locations from the GSM/GPS transmitters were reported

8
by e-mails sent via GSM cell tower signals (Microwave Telemetry, Inc. 2013). When vultures
flew beyond range of a GSM cell tower, the transmitters stored locations for delivery at a later
time when the vulture returned to within GSM cell tower range (Microwave Telemetry, Inc.
2013). Location data were downloaded and compiled on a regular basis over the course of the
study.
Using these data, objectives of this research were to (1) estimate and compare monthly
home range and core area sizes for resident black and turkey vultures in the southeastern United
States using the dynamic Brownian Bridge Movement Model; (2) describe differences in
monthly, seasonal (breeding, summer, and winter), and annual activity rates by quantifying
proportions of time spent in transit (flying), stationary (roosting, resting, and foraging), and
switch (transitions between movement and stationary) states; (3) quantify and compare seasonal
(breeding, summer and winter) roost site fidelity and roost reuse frequency by species; and (4)
assess monthly resource selection within home ranges for habitat types including distances to
landfills (0-500m and 500-1000m), distances to roads (0-500m), wetland, forest,
developed/urban, developed/open, and undeveloped/open. This research seeks to fill important
gaps by quantifying the space use and resource selection patterns of sympatric black and turkey
vultures with greater spatial and temporal resolution than previous studies conducted on these
species.
LITERATURE CITED
Arrington, D. P. 2003. Flight Characteristics of Non-Migrating and Migrating Populations of
Turkey Vultures. Dissertation, Purdue University, West Lafayette, Indiana, USA.
Austin, D., W. D. Bowen, and J. I. McMillan. 2004. Intraspecific Variation in Movement
Patterns: Modeling Individual Behavior in a Large Marine Predator. Oikos 105:15–30.
Avery, M. L. 2004. Trends in North American Vulture Populations. Vertebrate Pest Conference
21:116-121.

9
Avery, M. L., J. S. Humphrey, T. S. Daughtery, J. W. Fischer, M. P. Milleson, and E. A.
Tillman. 2011. Vulture Flight Behavior and Implications for Aircraft Safety. Journal of
Wildlife Management 75:1581-1587.
Avery, M. L., J. S. Humphrey, E. A. Tillman, K. O. Phares, and J. E. Hatcher. 2002. Dispersing
Vulture Roosts on Communication Towers. Journal of Raptor Research 36:45-50.
Blackwell, B. F., and A. E. Wright. 2006. Collisions of Red-tailed Hawks (Buteo jamaicensis),
Turkey Vultures (Cathartes aura), and Black Vultures (Coragyps atratus) with Aircraft:
Implications for Bird Strike Reduction. Journal of Raptor Research 40(1):76-80.
Bryan, A. L., A. E. Holland, J. C. Beasley, and O. E. Rhodes. 2014. Examining Vulture
Movements and Behaviors with GSM/GPS Transmitters. Microwave Telemetry, Inc.,
Newsletter p 5.
Buckley, N. J. 1996. Food Finding and the Influence of Information, Local Enhancement, and
Communal Roosting on Foraging Success of North American Vultures. The Auk
113:473-488.
Buckley, N. J. 1998. Interspecific Competition Between Vultures for Preferred Roost Positions.
The Wilson Bulletin 110:122-125.
Buckley, N. J. 1999. Black Vulture (Coragyps atratus). Account 411 in A. Poole (editor). The
Birds of North America Online. Cornell Lab of Ornithology, Ithaca, New York.
<http://bna.birds.cornell.edu.proxy-remote.galib.uga.edu/bna/species/411>.
Coleman, J. S., and J. D. Fraser. 1989. Habitat Use and Home Ranges of Black and Turkey
Vultures. Journal of Wildlife Management 53:782-792.
DeVault, T. L., J. C. Beasley, Z. H. Olson, M. Moleón, M. Carrete, A. Margalida, and J. A.
Sánchez-Zapata (in press). Why Do Birds Matter? Birds’ Ecological Functions and
Ecosystem Services, University of Chicago Press, edited by Sekercioglu, Wenny, and
Whelan.
DeVault, T. L., B. D. Reinhart, I. L. Brisbin, Jr., and O. E. Rhodes. Jr. 2004. Home Ranges of
Sympatric Black and Turkey Vultures in South Carolina. Condor 106:706-711.
DeVault, T. L., B. D. Reinhart, I. L. Brisbin, Jr., and O. E. Rhodes. Jr. 2005. Flight Behavior of
Black and Turkey Vultures: Implications for Reducing Bird-Aircraft Collisions. Journal
of Wildlife Management 69:601-608.
DeVault, T. L., J. L. Belant, B. F. Blackwell, and T. W. Seamans. 2011. Interspecific Variation
in Wildlife Hazards to Aircraft: Implications for Airport Wildlife Management. Wildlife
Society Bulletin 35(4):394-402.
Dolbeer, R. A., 2011. Increasing Trend of Damaging Bird Strikes with Aircraft Outside the
Airport Boundary: Implications for Mitigation Measures. Human-Wildlife Interactions
5(2):235-248.

10
Dolbeer, R. A., S. E. Wright, J. Weller, and M. J. Begier. 2012. Wildlife Strikes to Civil Aircraft
in the United States. Federal Aviation Administration National Wildlife Strike Database
Serial Report Number 18, 89 pp.
Dolbeer, R. A., S. E. Wright, J. R. Weller, and M. J. Begier. 2014. Wildlife Strikes to Civil
Aircraft in the United States 1990-2013. Federal Aviation Administration National
Wildlife Strike Database Serial Report Number 20, 98 pp.
Donázar, J. A., A. Travaini, O. Ceballos, A. Rodriguez, M. Delibes, and F. Hiraldo. 1999.
Effects of Sex-Associated Competitive Asymmetries on Foraging Group Structure and
Despotic Distribution in Andean Condors. Behavioral Ecology and Sociobiology 45:55-
65.
Evans, B. A., and T. A. Sordahl. 2009. Factors Influencing Perch Selection by Communally
Roosting Turkey Vultures. Field Ornithology 80:364-372.
Fischer, J. W., W. D. Walter, and M. L. Avery. 2013. Brownian Bridge Movement Models to
Characterize Birds’ Home Ranges. The Condor 115:298-305.
Hedlin, E. M, C. S. Houston, P. D. McLoughlin, M. J. Bechard, M. J. Stoffel, D. R. Barber, and
K. L. Bildstein. 2013. Winter Ranges of Migratory Turkey Vultures in Venezuela.
Journal of Raptor Research 47:145-152.
Houston, D., and J. Cooper. 1975. The Digestive Tract of the Whiteback Griffon Vulture and its
Role in Disease Transmission Among Wild Ungulates. Journal of Wildlife Diseases
11:306–313.
Houston, C. S., P. D. McLoughlin, J. T. Mandel, M. J. Bechard, M. J. Stoffel, D. R. Barber, and
K. L. Bildstein. 2011. Breeding Home Ranges of Migratory Turkey Vultures Near Their
Northern Limit. The Wilson Journal of Ornithology 123:472-478.
Kelly, N. E., D. W. Sparks, T. L. DeVault, and O. E. Rhodes, Jr. 2007. Diet of Black and Turkey
Vultures in a Forested Landscape. The Wilson Journal of Ornithology 119:267-270.
Kirk, D. A., and J. E. P. Currall. 1994. Habitat Associations of Migrant and Resident Vultures in
Central Venezuela. Journal of Avian Biology 25:327-337.
Kirk, D. A., and D. C. Houston. 1995. Social Dominance in Migrant and Resident Turkey
Vultures at Carcasses: Evidence for a Despotic Distribution? Behavioral Ecology and
Sociobiology 36:323-332.
Kirk, D. A., and M. J. Mossman. 1998. Turkey Vulture (Cathartes aura). Account 339 in A.
Poole (editor). The Birds of North America Online. Cornell Lab of Ornithology, Ithaca,
New York. <http://bna.birds.cornell.edu.proxy-remote.galib.uga.edu/bna/species/339>
Kranstauber, B., R. Kays, S. D. LaPoint, M. Wikelski, and K. Safi. 2012. A Dynamic Brownian
Bridge Movement Model to Estimate Utilization Distributions for Heterogeneous Animal
Movement. Journal of Animal Ecology 81:738-746.

11
López-López, P., J. Benavent-Corai, C. Garcia-Ripolles, and V. Urios. 2013. Scavengers on the
Move: Behavioural Changes in Foraging Search Patterns during the Annual Cycle.
PLOS-One 8:1-9.
Loss, S. R., T. Will, and P. P. Marra. 2012. Direct Human-Caused Mortality of Birds: Improving
Quantification of Magnitude and Assessment of Population Impact. Frontiers in Ecology
and the Environment 10:357-364.
Mandel, J. T., and K. L. Bildstein. 2007. Turkey Vultures Use Anthropogenic Thermals to
Extend Their Daily Activity Period. The Wilson Journal of Ornithology 19:102-105.
Mandel, J. T., K. L. Bildstein, G. Bohrer, and D. W. Winkler. 2008. Movement Ecology of
Migration in Turkey Vultures. Proceedings of the National Academy of Sciences of the
United States 105:19102-19107.
Markandya, A., T. Taylor, A. Longo, M. N. Murty, S. Murty, and K. Dhavala. 2008. Counting
the Cost of Vulture Decline: An Appraisal of the Human Health and Other Benefits of
Vultures in India. Ecological Economics 67:194–204.
Marra, P. P., C. J. Dove, R. Dolbeer, N. F. Dahlan, M. Heacker, J. F. Whatton, N. E. Diggs, C.
France, and G. A. Henkes. 2009. Migratory Canada Geese Cause Crash of US Airways
Flight 1549. Frontiers in Ecology and the Environment 7:297-301.
Martin, J. A., J. L. Belant, T. L. DeVault, B. F. Blackwell, L. W. Burger Jr., S. K. Riffell, and G.
Wang. 2011. Wildlife Risk to Aviation: A Multi-Scale Issue Requires a Multi-Scale
Solution. Human-Wildlife Interactions 5:198-203.
Microwave Telemetry, Inc. 2013. Solar GSM/GOS Transmitters.
<http://www.microwavetelemetry.com/bird/GSM.cfm> Accessed 29 Oct 2013.
Moreno-Opo, R., A. Margalida, F. Garcia, A. Arrendondo, C. Rodriguez, and L. M. Gonzalez.
2012. Linking Sanitary and Ecological Requirements in the Management of Avian
Scavengers: Effectiveness of Fencing Against Mammals in Supplementary Feeding Sites.
Biodiversity Conservation 21:1673-1685.
Ogada, D. L., F. Keesing, and M. Z. Virani. 2012a. Dropping Dead: Causes and Consequences
of Vulture Population Declines Worldwide. Annals of the New York Academy of
Sciences 1249:57-71.
Ogada, D. L., M. E. Torchin, M. F. Kinnaird, and V. O. Ezenwa. 2012b. Effects of Vulture
Declines on Facultative Scavengers and Implications for Mammalian Disease
Transmission. Conservation Biology 23:453-460.
Ramenofsky, M., J. M. Cornelius, and B. Helm. 2012. Physiological and Behavioral Responses
of Migrants to Environmental Cues. Journal of Ornithology 153:181-191.
Rolando, A. 2002. On the Ecology of Home Range in Birds [ABSTRACT]. Revue d’ Ecologie la
Terre et la vie 57:53-73.

12
Sauer, J. R., J. E. Hines, J. E. Fallon, K. L. Pardieck, D. J. Ziolkowski, Jr., and W. A. Link. 2012.
North American Breeding Bird Survey, Results and Analysis 1966 - 2011. Version
07.03.2013. USGS Patuxent Wildlife Research Center, Laurel, MD.
Sebastián-González, E., J. A. Sánchez-Zapata, J. A. Donázar, N. Selva,
A. Cortés-Avizanda, F. Hiraldo, M. Blázquez, F. Botella & M. Moleón. 2013. Interactive
Effects of Obligate Scavengers and Scavenger Community Richness on Lagomorph
Carcass Consumption Patterns. IBIS 255:881-885.
Sekercioglu, C. H., G. C. Daily, and P. R. Ehrlich. 2004. Ecosystem Consequences of Bird
Declines. Proceedings of the National Academy of Sciences of the United States of
America 101:18042-18047.
Sekercioglu, C. H. 2006. Increasing Awareness of Avian Ecological Function. Trends in Ecology
& Evolution 21:464-471.
Tracey, J. A., J. Zhu, E. Boydston, L. Lyren, R. N. Fisher, and K. R. Crooks. 2013. Mapping
Behavioral Landscapes for Animal Movement: A Finite Mixture Modeling Approach.
Ecological Applications 23:654-669.
Wallace, M. P., and S. A. Temple. 1987. Competitive Interactions Within and Between Species
in a Guild of Avian Scavengers. The Auk 104:290-295.
Walter, W. D., J. W. Fischer, J. S. Humphrey, T. S. Daughtery, M. P. Milleson, E. A. Tillman,
and M. L. Avery. 2012. Using Three-dimensional Flight Patterns at Airfields to Identify
Hotspots for Avian-Aircraft Collisions. Applied Geography 35:53-59.
Walters, J. R., S. R. Derrickson, D. M. Fry, S. M. Haig, J. M. Marzluff, and J. M. Wunderle, Jr.
2010. Status of the California Condor (Gymnogyps californianus) and Efforts to Achieve
Its Recovery. The Auk 127:969-1001.

13
CHAPTER 2
FINE-SCALE ASSESSMENT OF MONTHLY HOME RANGES AND ACTIVITY
PATTERNS FOR RESIDENT BLACK AND TURKEY VULTURES IN THE
SOUTHEASTERN UNITED STATES1
CHAPTER 2. FINE-SCALE ASSESSMENT OF MONTHLY HOME RANGES AND
ACTIVITY PATTERNS FOR RESIDENT BLACK AND TURKEY VULTURES IN THE
SOUTHEASTERN UNITED STATES SOUTHEASTERN UNITED STATES
1 Holland, A. E., M. E. Byrne, A. L. Bryan, T. L. DeVault, O.E. Rhodes, and
J. C. Beasley. To be submitted to PLOS ONE.

14
ABSTRACT
Knowledge of the spatial ecology of black (Coragyps atratus) and turkey vultures
(Cathartes aura) is surprisingly limited despite the role of these species in ecosystem function
and considering the economic costs associated with human-vulture conflicts. Fine-scale
assessments of space use patterns and resource use are particularly lacking for vultures, although
development of new tracking technologies has allowed collection of data at finer temporal and
spatial resolution than ever before. The objectives of this study, therefore, were to conduct the
first assessment of monthly home range and core area sizes with consideration to sex, as well as
to elucidate differences monthly, seasonal, and annual activity patterns for resident vultures in
the southeastern United States based on analyses of fine-scale movement data. I gathered > 2.8-
million GPS locations from 9 black and 9 turkey vultures from June 2013 – August 2015 using
solar-powered GSM/GPS transmitters. From these data, I quantified home ranges and core areas
using the dynamic Brownian Bridge Movement Model and evaluated differences as a function of
species, sex, and month. Mean monthly home ranges for turkey vultures (60.94 ± 4.24 km2) were
significantly larger than those of black vultures (30.51 ± 2.57 km2; P=0.008), although mean core
area sizes did not differ between species (0.424 ± 0.027 km2, 0.45 ± 0.062 km2, respectively).
Comparisons of space use between male and female vultures were only possible for black
vultures, for which monthly space use differed nominally being larger for females in March-
April. Vulture activity patterns revealed turkey vultures spend more time in flight and switch
motion states (between flight and stationary) more frequently than black vultures across all
temporal scales (monthly, seasonally, and annually). This study reveals immense variability in
black and turkey vulture space use and activity rates across the annual cycle and provides a vital
component for habitat selection analyses.

15
INTRODUCTION
Vultures, as obligate scavengers, provide invaluable ecosystem services by enhancing the
flow of nutrients within food webs and reducing transmission of infectious disease rates through
the removal of carrion (DeVault et al. 2003, Markandya et al. 2008, Wilson and Wolkovich
2011, Ogada et al. 2012b, Beasley et al. 2015). Specializing in carcass consumption (Kirk and
Mossman 1998, Buckley 1999), vultures are adapted to detect and remove carcasses from
landscapes more efficiently than any other terrestrial scavenger (Houston 1979, Sebastián-
González et al. 2013). Because carrion is ephemeral and often randomly distributed (DeVault et
al. 2003), vultures have evolved unique adaptations to exploit this spatially unpredictable
resource (Kirk and Mossman 1998, Buckley 1999). Unfortunately, vulture populations have
experienced drastic declines over the last few decades (Ogada et al. 2012a), making them among
the most threatened groups of birds today, with 70% of species exhibiting population declines,
39% of which are considered either endangered or critically endangered, and 26% considered
near threatened or vulnerable by the IUCN (2015). Consequences of reduced vulture populations
are not trivial, as evidenced in India where populations of rats (Rattus spp.) and feral dogs (Canis
spp.) increased following the ecological extinction of vultures, causing significant human health
concerns and associated costs due to increased incidence of rabies (Ogada et al. 2012b).
Conversely, in North America, populations of black vultures (Coragyps atratus) and
turkey vultures (Cathartes aura) are abundant throughout their ranges (Avery 2004, Sauer et al.
2012). These species have increased over the last several decades following the ban of DDT in
the early 1970’s and continue to increase, likely due to many factors such as reductions in
pesticide use and human persecution, increases in deer populations and roadkill, a greater
number of landfills, and a warming climate (Kiff 2000). In addition, although timber practices

16
are generally considered a limiting factor on vulture reproductive output due to removal of large,
hollow trees (Kiff 2000), increases in abandoned buildings throughout North America may be
providing compensatory nesting sites. These increases in black and turkey vulture populations
have led to rises in conflicts between humans and vultures, including the substantial safety risk
vultures in flight pose to aircraft personnel due to potential for air collisions known as “bird-
strikes” (Blackwell and Wright 2006, DeVault et al. 2011, Dolbeer et al. 2012). Bird-strikes are a
major justification for a better understanding of the movement patterns of vultures and other
birds (Marra et al. 2009, Avery et al. 2011, Dolbeer 2011, Martin et al. 2011, Loss et al. 2012,
Walter et al. 2012).
Despite their relative ubiquity, importance in ecosystem function, and concerns
associated with increased populations, fine-scale analyses of the spatial ecology of black and
turkey vultures are surprisingly limited. Previous home range estimates for black and turkey
vultures have revealed considerable differences within and among species, as well as among
different regions within their respective ranges. Space use variation is likely due to differences in
individual physiology (López-López et al. 2013), social status (Donázar et al. 1999, Wallace and
Temple 1987), and competition (Buckley 1998, Donázar et al. 1999, Kirk and Houston 1995,
Wallace and Temple 1987). Differences in sample size and accuracy of tracking techniques also
have contributed to the substantive differences in home range size reported among studies
(Fischer et al. 2013). Fortunately, recent advancements in tracking technologies now allow
researchers to gather high-resolution location data on vultures and other wide-ranging organisms
in greater detail and with superior accuracy than ever before (Fischer et al. 2013). Fine-scale
analysis of movement behavior is essential to improve understandings of the mechanisms

17
underlying movement, interactions with environments, and other basic concepts of animal
ecology (Cagnacci et al. 2010).
Spatio-temporal variation in the distribution and availability of resources undoubtedly
plays an important role in home range size differences among studies (DeVault et al. 2004,
DeVault et al. 2005, Kelly et al. 2007, Rolando 2002). In southern Pennsylvania and northern
Maryland, mean winter home range sizes for black and turkey vultures were nearly half the size
of summer home ranges (Coleman and Frasier 1989). Fluctuations in home range sizes may be in
response to changes in spatial or temporal resource availability, but they may also demonstrate
changes in animal behavior due to physiological vicissitude. For example, home range sizes of
California condors (Gymnogyps californianus) were substantially smaller (5-6 times) during
breeding season in November-March as compared to July-October, presumably because
movements were limited and central to nest sites during nesting activities (Rivers et al. 2014).
An understanding of vulture movement activity patterns can lead to recognition of
mechanisms underlying habitat selection within a home range. For example, measurements of
activity patterns (i.e., time spent in flight vs. time spent roosting) can reveal the amount of search
effort required by an individual to obtain important resources within its home range. For
vultures, it is reasonable to assume that when a vulture is in flight, it is searching for some
resource, be it carrion, a nesting location, or roost site. Vultures have shown immense behavioral
plasticity in relation to local habitat structure and resource availability. For example, black and
turkey vultures spent substantially more time in flight, presumably in search of carrion, at the
heavily forested Savannah River Site than in areas where forage opportunities were more
predictable, such as the agriculturally-dominated landscapes of Pennsylvania and Maryland
(Coleman and Fraser 1989, DeVault et al. 2004). Additionally, vultures in coastal South Carolina

18
spent more time in flight during winter than summer, likely due to the need for increased
foraging efforts given reduced ability to detect carrion in colder months and reduced daylight
hours (Avery et al. 2011).
To date, few prior studies have quantified home range sizes and activity patterns for
resident, non-migratory black and turkey vultures, and none have examined variation in space
use by month or sex. Thus, use of global positioning system (GPS) satellite tracking devices and
fine-scale sampling regimes coupled with sex determination will greatly improve our
understanding of the factors that underlie variations in movement patterns and space use by black
and turkey vultures across an annual cycle, further developing our understandings of vulture
ecology, benefitting wildlife managers concerned with reducing vulture-related conflicts
(DeVault et al. 2005, Marra et al. 2009, Avery et al. 2011, Martin et al. 2011, Loss et al. 2012,
Walter et al. 2012) and conservation of these ecologically invaluable species.
The objectives of this study, therefore, are to strengthen inferences on the spatial ecology
of black and turkey vultures by comparing home range and core area size estimates between
species and sexes at a finer temporal scale (monthly) than previous studies for these species, and
to determine the proportion of time spent in transit (flying) versus stationary (roosting, resting,
and foraging) to elucidate differences in monthly, seasonal (breeding, summer, and winter), and
annual activity rates for resident black and turkey vultures in the southeastern United States. I
hypothesize turkey vultures will range across larger areas and spend a greater proportion of time
in flight than black vultures considering turkey vultures’ higher wing loading capacity, enhanced
sense of smell, and higher likelihood of avoiding competitive interactions (Kirk and Mossman
1998). I further expect that turkey vultures will switch between flight (movement states) and
roosting/resting (stationary states) more frequently than black vultures, considering turkey

19
vultures typically forage either in pairs or solitarily (Kirk and Mossman 1998) and are thus more
likely to flush from an area when disturbed or challenged at a feeding site. Both black and turkey
vultures are monomorphic and both sexes contribute similarly to parental care (Kirk and
Mossman 1998, Buckley 1999). Thus, I expect space use patterns will not differ as a function of
sex, although differences may be evident at finer temporal and spatial scales. Additionally, I
hypothesize monthly space use for each species will vary over an annual cycle with smaller
ranges in winter and breeding season months due to reductions in daylight hours and propensity
to restrict movements central to nesting locations in breeding seasons (Houston et al. 2011).
METHODS
Study Area
This research was conducted at the Savannah River Site (SRS) which is located along the
border of Georgia and South Carolina in the southeastern United States. The SRS is a 780-km2,
limited-access, nuclear research facility owned and operated by the U.S. Department of Energy
(DOE; White et al. 2000). Elevations range from <30 m to 115 m above sea level (White et al.
2000). Much of the SRS is relatively undisturbed by DOE activities and is primarily forested
(White et al. 2000). The SRS is composed of planted pine forests managed by the U.S. Forest
Service (DeVault et al. 2004), bottomland hardwood, wetland, and various industrial areas
including five decommissioned nuclear reactors, radioactive materials processing plants, and
landfills (White et al. 2000). The composition of largely undisturbed natural areas makes this site
an ideal location in which to study resident vulture space use. Black and turkey vultures are
abundant on the SRS as it provides important roosting, nesting, and foraging habitat for both
species (DeVault et al. 2004, DeVault et al. 2005).

20
Vulture Trapping & Handling
In summer 2013 and spring 2014, I captured a total of 295 vultures using an air-propelled
net-cannon at sites baited with wild pig (Sus scrofa) or similar carcasses at multiple sites
interspersed throughout the SRS. Of these, 27 adult vultures (13 black and 14 turkey) were
randomly selected to receive solar-powered 70-g Groupe Spécial Mobile/Global Positioning
System (GSM/GPS) transmitters (Microwave Telemetry, Inc. 2013) attached via backpack
harness. In an effort to target resident (i.e., non-migratory) individuals, trapping occurred outside
the migration seasons for each species (Kirk and Mossman 1998, Buckley 1999). However, after
all locations were collected, classification of each individual as either resident/non-migratory or
migratory was verified by assessing each vulture’s net squared displacement (NSD; see below)
from evening roost locations. All vultures were affixed with numbered patagial tags for
individual identification and handled in accordance with the University of Georgia Animal Care
and Use Protocol No. A2013 02-004-Y2-A2. For all captured vultures, I collected standard
morphological measurements and estimated age-class (adult or juvenile) based on coloration and
wrinkling of the head (Kirk and Mossman 1998, Buckley 1999). Given that black and turkey
vultures are sexually monomorphic (Kirk and Mossman 1998, Buckley 1999), it was not possible
to control for balanced ratios of male and female black and turkey vultures from among those
randomly selected to receive GPS tracking devices. However, I collected feather and blood
samples from captured individuals to aid in sex determination via molecular methods.
Sex Determination
Sex was determined for transmittered vultures via sex-specific DNA markers amplified
by polymerase chain reaction (PCR). Genomic DNA was extracted from whole blood (stored at
-20ºC) or breast feathers using a bead beater protocol. Specifically, 50µl of blood was lysed

21
using a combination of chemical (350µl of lysis buffer consisting of 4M guandidine thiocyanate,
0.01M Tris-HCl Ph 7.5, and 20µl/mL β-mercaptoethanol) and mechanical disruption using a 3.5
mm stainless steel bead for 30 sec at 1,500 oscillations per minute on a Mini-Beadbeater 24
(BioSpec Products Inc., Bartlesville, OK, USA). The lysed solution was then centrifuged and the
supernatant was applied to a spin column with a silica gel membrane (EconoSpin, Epoch Life
Science, Sugar Land, TX, USA). The column was then centrifuged to bind the nucleic acid and
the membrane was washed twice with a buffer consisting of 1mM Tris HCl pH 7.5 and 162.8g
potassium acetate before eluting with 75µl of ultra-pure water. DNA extraction from breast
feathers was conducted following Qiagen DNeasy blood and tissue kit (Qiagen, USA) with a
final elution volume of 100ul.
Following the methods of Ito et al. (2003), primers P2 and NP were used to amplify a
part of the CHD1 gene of the W chromosome which distinguishes female birds from male birds.
The PCR reaction occurred in 25µl volume using 1X PCR buffer (10mM Tris ph 8.4, 50mM
KCl), 1.5m MMgCl2, 0.2 mM deoxyribonucleotide triphosphate (dNTP), 0.4µM of each primer,
0.625 U Ampli Taq Gold polymerase (Thermo Fisher), 0.025µl 0.01% Tween 20 (Sigma-
Aldrich, Missouri, USA), and 2µl DNA, initially denatured at 94ºC for 4 mins, followed by 43
cycles of 94ºC (30 secs), 48ºC (45 secs), and 72ºC (45 secs), and a final extension at 72ºC for 5
mins. PCR products were run on an ABI 3130/3100XL sequencer (Applied Biosystems, USA)
for sex determination. All genetic analyses were conducted at the Savannah River Ecology
Laboratory in Aiken, South Carolina.
Data Preparation
Solar-powered GSM/GPS transmitters reported location (lat/long coordinates), speed
(knots), course, altitude (m), horizontal and vertical dilution of precision (HDOP, VDOP), and
22
number of satellites used to obtain each fix. Fixes were recorded at variable intervals, with the
highest frequency of fixes reported at times when solar availability (and thus peak battery power)
was greatest (Bryan et al. 2014; Byrne et al., in prep). The frequency of fixes obtained was
exceptionally high, with 25% of all locations collected at intervals of <1 minute, 51% with
intervals of 1-3 minutes, 9% with intervals of 3-10 minutes, 7% with intervals of 10-30 minutes,
and only 8% with intervals >30 minutes. Fixes received during the first two weeks post
transmitter deployment were excluded from analyses to allow vultures to become accustomed to
transmitters and return to normal movement patterns in the event of post-handling effects.
To avoid temporal bias in comparisons of space use (i.e., home range and core area)
estimations and activity patterns, data for all vultures were subset and standardized to include
only fixes received within equal timeframes (i.e., monthly, seasonal, or annual). Specifically, for
monthly space use and activity patterns comparisons, data from September 2013 to August 2015
were sorted by month based on calendar definitions (e.g., June contained fixes from 1 June 2015
00:00:00 EST to 30 June 2015 23:59:59 EST). For comparisons of activity patterns by season,
seasonal datasets were defined for three seasons (breeding, summer and winter), and included all
fixes received within equal durations of 121 days and eight hours, with the exception of the first
summer. The first summer only included data from the final 53 days and 16 hours of the season
because GPS transmitters were deployed in mid-summer. Breeding season durations are similar
for black and turkey vultures (Jackson 1983, Kirk and Mossman 1998, Buckley 1999), although
in areas of sympatry, black vultures typically nest two weeks earlier than turkey vultures (1
February - 10 June for black vultures and 15 February - 24 June for turkey vultures; Jackson
1983, Kirk and Mossman 1998, Buckley 1999). Therefore, breeding seasons in this analysis
included fixes from 8 Feb 00:00:00 to 9 June 07:59:59, which represent the median dates of

23
those described for vultures breeding at 32°-33° latitudes (Jackson 1983), and encompassed the
range of dates wherein adult black and turkey vultures are both influenced by breeding
phenology, and standardized for ease of comparison. Fixes received within the tertiles preceding
and following the breeding season were defined as winter (8 October 16:00:00 - 7 February
23:59:59) and summer (9 June 08:00:00 - 8 October 15:59:59), respectively. Seasonal data were
collected for one and a half summer seasons, two full breeding seasons, and two full winter
seasons. For comparisons of annual activity patterns, annual data include locations collected
between 1 September 2013 to 31 August 2014 for the first year and 1 September 2014 to 31
August 2015 for the second year.
Home Range and Core Area Estimations
Location data were filtered to remove fixes with altitudes above 12,000 m, inconclusive
data (“NegAlt”, “No Fix”, “2D”, “Batt Drain”, and “Low Voltage”), as well as any outliers
(McConnell et al. 1992). Specifically, I used the McConnell (1992) algorithm to calculate the
root mean square (rms) for each location based on reported transmitter speed. This algorithm
compares the speed of each location against the previous and subsequent two locations, removes
peaks in rms above a user-defined maximum speed (25 m/s), and recalculates rms until all
locations are below the defined speed threshold.
From the filtered data, I assessed each vulture’s net squared displacement (NSD;
Bunnefeld et al. 2011) from evening roost locations in order to verify that the vultures in this
analysis were indeed resident, non-migratory individuals. Specifically, I identified evening roosts
by extracting the average location from among fixes received between 20:00-00:00 hours for
each vulture. For nights where no fixes were received between 20:00-00:00 hours, evening roosts
were determined manually by examining location data for series of fixes within nighttime hours

24
where the bird clearly did not move for several hours throughout the evening and into the
following morning (00:00-04:00), reporting the evening roost as the average of those locations.
NSD for each vulture was measured as the straight line distance between the starting roost
location and the subsequent roost locations for the trajectory path of all roost locations
(Bunnefeld et al. 2011). NSDs were plotted and migration movements identified by peaks in
NSD within winter months (Figures 2-1, 2-2).
Filtered locational data were used to delineate monthly home ranges and core areas for
individual vultures using the dynamic Brownian Bridge Movement Model (dBBMM;
Kranstauber et al. 2012) with the ‘move’ package (Kranstauber and Smolla 2014) in the R
program (R Core Team 2014). An advantage of the dBBMM method is that it accounts for both
temporal autocorrelation and variation in trajectories between points (Kranstauber et al. 2012).
To fit the dBBMM to vulture movement paths and allow for comparisons across each model,
parameters were standardized (window size=47, margin=11, raster=30) with a location error of
±23 m based on the manufacturer’s estimate (Microwave Telemetry, Inc. 2013). To verify
location error, I validated vertical and horizontal accuracy of the GSM/GPS transmitters with a
series of static tests by placing the units in a range of environmental conditions with simulations
of bird behavior, and determined accuracy to be greater than the manufacturer’s estimate (Table
2-1). Thus, I am confident dBBMMs produced with ±23 m location error delineate reliable
boundaries of actual space use.
Using R (R Core Team 2014) and ArcMap GIS software (Esri 2012), I quantified
monthly core areas and home ranges based on the 50% and 95% isopleths of the utilization
distributions (UD), respectively. Shapiro-Wilk tests revealed that home range and core area sizes
were not normally distributed; therefore, I log-transformed the data and used unbalanced

25
repeated-measures linear mixed effects models to assess differences in space use across spatial
scales. Specifically, at each spatial extent (home range and core area) I developed linear mixed-
effects models with unstructured covariance structure using the ‘lme4’ package (Bates et al.
2015) in R (R Core Team 2014). In both mixed effects models, species, sex, and month were
included as fixed effects and individual was incorporated as a random effect.
Activity Patterns
For 9 black and 9 turkey vultures, activity patterns were quantified from movement states
(transit vs. stationary) ultimately determined after a series of data refinement procedures. Fixes
were initially characterized as “transit” or “stationary” by assessing distance traveled between
points and with consideration to the visual limitations of black and turkey vultures. For both
species, a 2-meter object becomes indiscernible at 1.79 km (Lisney et al. 2013). Assuming that
most movements are motivated by the need to search for feeding opportunities, and given that
vultures forage on items smaller than 2-meters in size, 1.5 km is a conservative estimate to define
distances between potential search areas. Therefore, transitional speeds over 1.5 km/hr (0.42 m/s)
were manually characterized as “transit” and all others were characterized as “stationary” with
consideration to altitudinal data such that locations were not mischaracterized as “stationary”
when vultures were flying/circling at high altitudes. Although top flight speeds for vultures in the
southeastern U.S. have not yet been reported, Mandel et al. (2008) observed a top speed for a
single turkey vulture of 68 km/hr (18.9 m/s) in a migration study. Therefore, I assumed a
reasonable max flight speed of a non-migratory vulture to be 90 km/hr (25 m/s). Locational data
with flight speeds >90 km/hr between locations were removed immediately as outliers, as well as
any locations without reasonable altitude readings (e.g., “NoFix” and negative altitudes),
resulting in the removal of 0.77% of original locations.

26
My field-based accuracy test of the GSM/GPS transmitters revealed that the units were
reliable indicators of activity state, with less than 1% of all locations reported as false
movements (Byrne et al., in prep). Therefore, remaining fixes with speeds ≥1 knot were then
characterized as “transit” and all others “stationary”. However, if the movement state of an
individual fix was preceded and followed by a series fixes characterized by the contrasting
movement state (i.e., a single “transit” fix in-between “stationary” fixes), the single fix was re-
characterized as “solitary”. Fixes characterized as “solitary” were assumed to be false
movements and removed from analysis. The proportion of “solitary” fixes (i.e. false movements)
was similar for black (n=9, 0.90 ± 0.06%) and turkey vultures (n=9, 1.07 ± 0.07%), and
coincided with results from the field-based accuracy test of the GSM/GPS transmitters. Fixes at
the end or beginning of a series of “transit” or “stationary” fixes were re-characterized as
“switch” states when preceded or followed by a series of fixes in the contrasting state. I used
proportions of “switch” states to compare differences in transitions between flight and stationary
behaviors by species.
The proportion of locations in transit or stationary states included in subsequent analyses
are reported only from the total number of locations unambiguously classified in each state (i.e.,
excluding “switch” states). Thus, regardless of the number of locations classified as “switch”
states, the proportion of “stationary” and “transit” locations summed to 100% for each
individual. I used two-sample t-tests to determine whether differences in activity rates existed
among species across monthly, seasonal, and annual timescales. Hereafter, “transit” states will be
termed as “in flight” or “flying”.

27
RESULTS
From June 2013 to August 2015, I collected 2,823,627 GPS locations from 26 vultures
(13 black and 14 turkey; Table 2-2). After removing birds with partial data and months with
migratory movements (see Table 2-3), a total of 321 monthly 95% home ranges and 50% core
areas were developed for 9 black vultures and 8 turkey vultures. Post-hoc molecular sex
determination of transmittered vultures revealed my sampling included 5 male and 4 female
black vultures, and 6 male and 2 female turkey vultures.
The two female turkey vultures (TUVU #03 and TUVU #01) monitored in this study
exhibited migratory behaviors in at least one winter (Figure 2-1), despite my attempts to trap
only non-migratory individuals. Therefore, analyses to elucidate differences in space use and
activity rates between sexes were only possible for black vultures. In addition, home ranges and
core areas estimated for these individuals during their winter migration months were excluded
from comparisons with space use by resident vultures in this study. TUVU #03 migrated south
into Florida during both winters, departing 13 November 2013 and returning 14 March 2014 in
the first winter, and departing 15 November 2014 and returning 2 February 2015 in the second
winter. The farthest distance travelled during migration for this individual was 757 and 774 km
in year 1 and year 2, respectively. TUVU #01, migrated 514 km south into Florida during winter
2013, departing 19 October 2013 and returning 9 February 2014, wherein she remained through
end of the study, 31 August 2015. Average maximum speed recorded during migration was
50.24 km/hr (min=43.56 km/hr, max=56.11 km/hr).
Monthly 95% Home Ranges and 50% Core Area Sizes
Monthly home ranges for turkey vultures (60.94 ± 4.24 km2) were significantly larger
than those of black vultures (30.51 ± 2.57 km2; F1,319=9.1646, P=0.008; Figure 2-3), although I

28
found no difference between core area sizes of turkey vultures (0.424 ± 0.027 km2) and black
vultures (0.45 ± 0.062 km2; F1,319=2.3198, P=0.1485; Figure 2-4). Monthly space use by black
vultures differed significantly over the course of the annual cycle for both home ranges
(F11,150=5.4214, P<0.001; Figure 2-3) and core areas (F11,150=6.385, P<0.001; Figure 2-4). For
turkey vultures, differences in monthly space use within the annual cycle was evident only for
core area sizes (F11,167=7.607, P<0.001; Figure 2-4) but not home ranges (F11,167=0.976,
P=0.469; Figure 2-3). Finally, although average monthly home ranges and core areas were
notably larger for female black vultures than those of males in March-May, differences were not
statistically significant across the annual cycle for either monthly home ranges (F1,167=0.523,
P=0.493; Figure 2-5) or core areas (F1,167=0.111, P=0.749; Figure 2-6). I also found no evidence
for an interactive effect of month and sex for black vulture monthly home ranges (F1,167=1.205,
P=0.291), however a significant interactive effect of month and sex existed for core areas
(F1,167=2.5095, P=0.007).
Activity Rates
Turkey vultures switched between stationary and movement states (7.35 ± 0.29%)
significantly more than black vultures (4.46 ± 0.24%; P<0.001; Figure 2-6). Additionally, turkey
vultures spent significantly more time in flight than black vultures across months (F1,340=13.48,
P=0.002; Figure 2-7), seasons (F1,82=12.25, P=0.004; Figure 2-8), and years (F1,82=12.715,
P=0.005; Figure 2-9). Average monthly proportion of time spent in flight was 52.1 ± 1% for
turkey vultures and 33.9 ± 1.7% for black vultures. Average seasonal proportion of time spent in
flight was 51.2 ± 1.7% for turkey vultures and 34.6 ± 2.8% for black vultures. Average annual
proportion of time spent in flight was 53.4 ± 1.8% for turkey vultures and 36.6 ± 5.1% for black
vultures.

29
DISCUSSION
This study strengthens inferences on the spatial ecology of black and turkey vultures by
providing information on the movement behavior of these species at a finer spatio-temporal
resolution than any previous study to date. Although both species are obligate scavengers with
substantial range overlap, my results reveal that substantive differences in home range size and
movement behavior exist between these species. These data undoubtedly reflect differences in
physiology, behavior, and social structure and thus represent underlying mechanisms of niche
differentiation between species.
Comparisons of Home Ranges and Core Area Sizes
When compared with estimations of space use in prior studies, my results (derived from
finer sampling frequencies than previous studies) agree with prior observations that turkey
vulture home ranges are larger than those of black vultures, and as expected, mean monthly
home ranges of turkey vultures were indeed larger than those of black vultures across nearly all
months. Prior estimations using the dBBMM to quantify space use by these species on the coast
of South Carolina found black vulture space use (50% UD: 38 ± 12 km2; 95% UD: 467 ± 183
km2) to be six times smaller than that observed for turkey vultures (50% UD: 227 ± 104 km2;
95% UD: 2,854 ± 990 km2; Fisher et al. 2014), but an earlier study of black and turkey vulture
home ranges based on VHF telemetry and using fixed-kernel density (KDE) to quantify space
use at the Savannah River Site found mean turkey vulture home ranges to be only twice the size
of black vulture home ranges (DeVault et al. 2004). My results similarly show turkey vulture
home ranges to be only about twice the size of home ranges of black vultures but only during the
months of June through December, as similar home range sizes were observed throughout the
rest of the year (January-May).

30
DeVault et al. (2004) previously reported home range sizes that were nearly four (95%
UD: 124 ± 51.2 km2) and six (95% UD: 340.5 ± 85.7 km2) times larger, and core areas nearly 50
(50% UD: 20.3 ± 3.3 km2) and 90 (50% UD: 41.6 ± 13 km2) times larger for black and turkey
vultures, respectively, than I observed in my study. Furthermore, core areas sizes differed
significantly between black and turkey vultures previously (DeVault et al. 2004), whereas I
surprisingly found no significant difference between core area sizes of black and turkey vultures
over the course of the year. Furthermore, in contrast to my expectation, turkey vulture home
ranges did not vary over the annual cycle. This lack of variation in turkey vulture home range
sizes may reflect the reliability of large (i.e., wild pig) carrion available throughout the Savannah
River Site during all months of the year. Wild pig populations have increased on the Savannah
River Site over the last several years and management efforts to control wild their abundance
have resulted in a steady supply of carcasses distributed throughout the landscape that may be
supplementing vulture populations with relatively reliable foraging opportunities (Beasley et al.
2013). However, accuracy of space use estimations increase with sampling frequency and this
study includes significantly more locations than DeVault et al. (2004) owing to differences in
tracking technologies used. Therefore, differences in estimates of space use may simply be due
to differences in sampling frequency as well as home range estimation between methods.
Although I was not able to verify breeding status for each vulture in this study, all were
adults presumably capable of breeding, and thus potentially influenced by breeding phenology
during the months of February through June. If space use is influenced by centralized
movements around nest locations, then I did not see evidence for this in my sampled population.
Rather, mean monthly core areas and home ranges of black vultures actually increased during the
breeding months versus months throughout the rest of the year. Similarly, turkey vulture core

31
areas increased significantly during the breeding season. These increases in space use during the
breeding season months were in contrast to my expectations and likely suggest individuals were
roaming more widely, potentially in search of mates and/or nest locations. Black and turkey
vultures are both known to participate in follow-flights or courtship flights (Kirk and Mossman
1998, Buckley 1999). Although my study did not address population dynamics, of the roughly
300 vultures marked for this study, only three (~1%) were recaptured and only a small number of
tagged vultures were recorded by remote cameras placed over carrion bait as part of additional
studies conducted during the time of my research. It may be possible that the vulture population
in the southeastern United States is so abundant that competition for nest sites in high-quality
areas is exceptionally high, making it difficult for sexually-mature vultures to establish and
maintain successful nesting sites from among limited options. Interestingly, only one black
vulture (BLVU #22) in this study appeared to possibly have a nest, which was in the same
abandoned building in both years of the study, although this could not be confirmed and was
based on centralized locations during months of the breeding seasons.
Comparisons of space use between male and female vultures were only possible for black
vultures in this study due to low numbers of monitored female turkey vultures. Female black
vultures generally had larger home ranges than male black vultures in March and April, and
although these differences were not significant, these months coincide with chick-hatching dates
and may be associated with an increase in energetic requirements following egg production by
females. Otherwise, body sizes of male and female black and turkey vultures do not differ (Kirk
and Mossman 1998, Buckley 1999), thus, their energetic requirements may be similar, and these
results support my original hypothesis as well as prior understandings of space use by sexually
monomorphic species (Kirk and Mossman 1998, Buckley 1999). However, larger sample sizes

32
may reveal differences in male and female space use during the breeding seasons due to
increased energetic demands by females associated with egg-production.
Comparisons of Monthly, Seasonal, and Annual Activity Patterns
Similar to prior studies of vulture activity patterns (Coleman and Fraser 1989, DeVault et
al. 2004), and in accordance with my expectation, my results suggest that turkey vultures spend
significantly more time in flight than black vultures across all temporal scales measured
(monthly, seasonally, and annually). Higher activity patterns in turkey vultures are to be
expected considering the amount of searching required by their solitary foraging strategy of
detecting carcasses by scent (Kirk and Mossman 1998). Similarly, reduced activity patterns in
black vultures would be expected as they spend substantial time in communal roosts for
information-exchange, increasing foraging efficiency by following other vultures to carrion sites
(Buckley 1997). Among turkey vultures, individuals were more active in the breeding season
than the summer and winter seasons, and they transitioned between flight/movement and
stationary states (roosting, foraging, and resting) more frequently than black vultures. Because
black vultures are highly social and forage in groups, their movements may be more deliberate
than those of turkey vultures. Group foraging provides benefits by “safety through numbers” as
vigilance is shared among multiple members within the group. It is less likely that an entire
group of black vultures will be flushed from an area than a solitary turkey vulture which is at
greater risk for predation. Therefore, the higher proportion of “switch” state behaviors exhibited
by turkey vultures may reveal their movements to be hastier and individuals are more reactive to
disturbances at solitary roosts or forage sites than black vultures.
In conclusion, results of this study show that black and turkey vultures exhibit immense
variability in space use and activity rates vary across the annual cycle. Evaluations based on

33
broader-scale sampling regimes may fail to identify important patterns evidencing distinctions,
and at these finer scales, this study reveals interesting and informative details regarding
distinctions in space use and activity patterns by these sympatric species. Quantification of space
use by black and turkey vultures through the development of monthly home range and core areas
with the dBBMM provides a vital component for habitat selection analyses.

34
Table 2-1. Mean positional error (m) of GPS locations collected by 3 Microwave Telemetry
solar-powered GPS/GSM avian transmitters in the horizontal and vertical dimensions across
three test treatments; 1: transmitters on ground under open canopy, 2: transmitters on ground
under forest canopy, and 3: transmitters suspended 11 m off the ground under open canopy.
Number of GPS locations for each treatment=672.
Treatment
Mean Error (SD)
Horizontal Vertical
1 5.5 (3.5) 7.4 (13.3)
2 12.4 (11.8) 12.6 (12.2)
3 8.1 (6.3) 8.9 (10.4)

35
Table 2-2. Number of locations received and range of dates over which GPS transmitters were carried for each adult vulture. Species:
BLVU=black vulture (Coragyps atratus), TUVU=turkey vulture (Cathartes aura); ID: patagial tag identification number; Sex:
F=female, M=male, U=unknown. Transmitter Deployment Start/End Date/Time: year/month/day hour:minute:second, Greenwich
Mean Time (GMT).
Species ID Sex
No.
Locations
Analysis Transmitter Deployment Date/Time
Status Inclusion Start End
TUVU 00 Unk 225 N 2013/06/13 12:19:53 2013/07/10 17:43:38 Transmission ceased; fate of bird
unknown
TUVU 01 F 257,753 Y 2013/06/26 14:00:42 2015/09/01 04:28:52 Active at end of study.
TUVU 02 U 143 N 2013/06/17 11:34:53 2013/06/17 17:00:01 Transmission ceased; fate of bird
unknown
TUVU 03 F 258,859 Y 2013/06/26 14:32:23 2015/09/01 04:52:35 Active at end of study.
BLVU 04 Unk 0 N 2013/06/17 00:00:00 2013/06/17 00:00:00 Transmission ceased; fate of bird
unknown
TUVU 06 M 215,442 Y 2013/06/17 13:15:54 2015/08/27 16:32:17 Active at end of study.
BLVU 08 M 102,537 Y 2013/06/18 18:07:12 2014/06/18 22:02:41 Transmission ceased; fate of bird
unknown
TUVU 10 Unk 280 N 2013/06/18 18:18:17 2013/06/19 18:56:52 Transmitter dropped, redeployed onto
new bird; fate of bird unknown
BLVU 12 M 178,571 Y 2013/06/20 11:38:11 2015/09/01 04:52:41 Active at end of study.
TUVU 13 F 41,625 Y 2013/06/27 13:24:20 2013/12/21 15:16:23 Transmission ceased; fate of bird
unknown
TUVU 19 Unk 268 N 2013/06/27 13:30:56 2013/06/27 23:58:53 Transmitter dropped, redeployed onto
new bird; fate of bird unknown
BLVU 22 F 121,498 Y 2013/06/20 12:34:26 2015/09/01 03:07:07 Deceased
BLVU 44 Unk 8,489 N 2013/07/03 12:57:26 2013/08/26 23:27:53 Transmitter dropped, redeployed onto
new bird; fate of bird unknown
BLVU 46 Unk 20,560 N 2013/07/03 13:32:20 2013/09/21 12:51:13 Transmitter dropped, redeployed onto
new bird; fate of bird unknown
BLVU 47 F 121,046 Y 2013/07/03 13:37:33 2015/09/01 04:31:54 Active at end of study.

36
Species ID Sex
No.
Locations
Analysis Transmitter Deployment Date/Time
Status Inclusion Start End
BLVU 48 M 96,043 Y 2013/07/03 13:44:23 2014/09/22 16:37:22 Transmitter dropped, redeployed onto
new bird; fate of bird unknown
BLVU 57 F 31,931 Y 2013/07/05 11:32:24 2014/03/21 19:47:00 Dead, shot; redeployed onto new bird
TUVU 60 M 225,904 Y 2013/07/05 12:46:25 2015/09/01 04:58:46 Active at end of study.
BLVU 65 Unk 2,833 N 2013/07/08 12:16:11 2013/07/25 23:57:55 Dead, unknown cause; redeployed onto
new bird
TUVU 75 M 201,902 Y 2013/07/09 15:29:50 2015/09/01 04:46:12 Active at end of study.
TUVU 76 Unk 25 N 2013/07/09 18:58:34 2013/07/10 20:48:07 Transmitter dropped, redeployed onto
new bird; fate of bird unknown
TUVU 90 M 185,527 Y 2013/07/30 14:03:23 2015/09/01 02:56:53 Active at end of study.
TUVU 91 M 202,737 Y 2013/07/31 15:46:32 2015/09/01 04:55:41 Active at end of study.
BLVU 92 F 181,466 Y 2013/08/02 12:47:23 2015/09/01 04:21:36 Active at end of study.
BLVU 108 M 91,654 Y 2014/04/21 17:58:09 2015/09/01 04:20:15 Active at end of study.
TUVU 123 M 147,388 Y 2014/04/23 19:43:13 2015/09/01 04:48:56 Active at end of study.
BLVU 126 M 128,921 Y 2014/05/01 13:00:53 2015/09/01 04:54:57 Active at end of study.
36

37
Table 2-3. Individual vultures included in monthly space use and activity pattern analyses. Grey fields indicate inclusion in analyses;
crossed grey fields indicate exclusion from space use analysis due to migratory movements for that month; white fields indicate
exclusion due to partial data for that month; black fields indicate no data and thus exclusion from space use analysis. BLVU=black
vulture (Coragyps atratus), TUVU=turkey vulture (Cathartes aura). ID: Patagial tag identification number. Sex: F=female, M=male.
Year 1=1 September 2013 – 31 August 2014; Year 2=1 September 2014 – 31 August 2015.
Species ID Sex Sep Oct Nov Dec Jan Feb Mar Apr May Jun Jul Aug Sep Oct Nov Dec Jan Feb Mar Apr May Jun Jul Aug
TUVU 01 F
TUVU 03 F
TUVU 06 M
TUVU 13 F
TUVU 60 M
TUVU 75 M
TUVU 90 M
TUVU 91 M
TUVU 123 M
BLVU 08 M
BLVU 12 M
BLVU 22 F
BLVU 47 F
BLVU 48 M
BLVU 57 F
BLVU 92 F
BLVU 108 M
BLVU 126 M
Year 1 Year 2
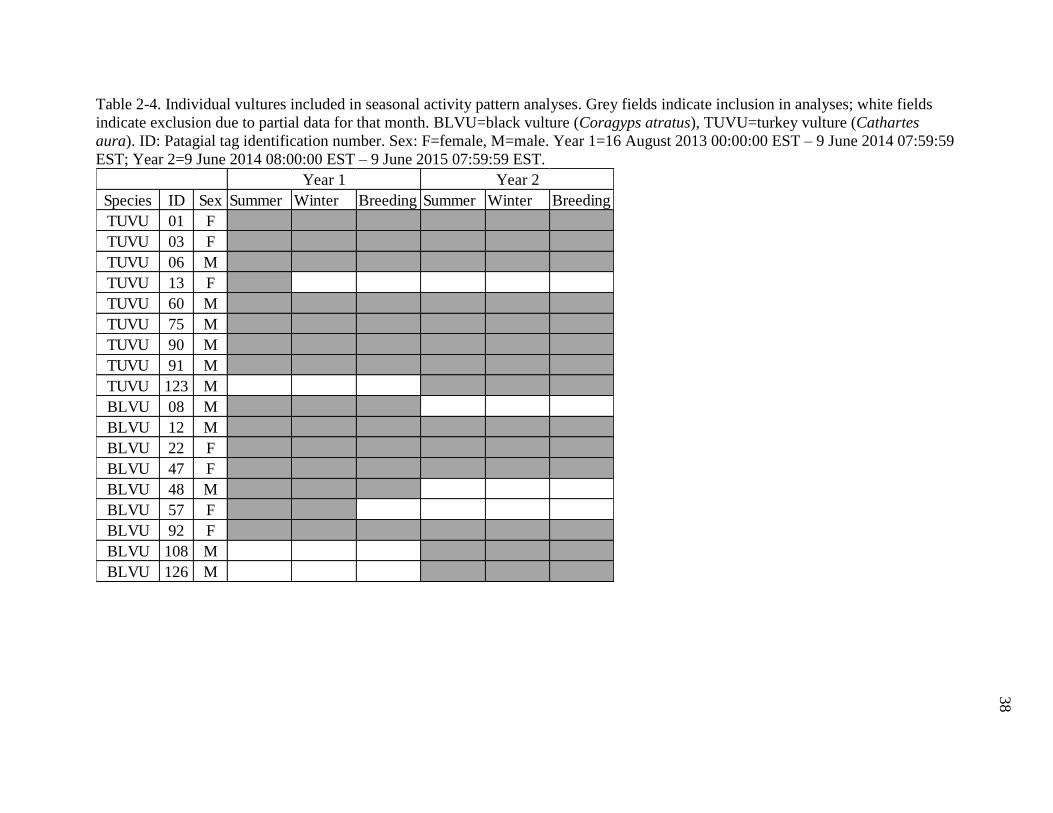
38
Table 2-4. Individual vultures included in seasonal activity pattern analyses. Grey fields indicate inclusion in analyses; white fields
indicate exclusion due to partial data for that month. BLVU=black vulture (Coragyps atratus), TUVU=turkey vulture (Cathartes
aura). ID: Patagial tag identification number. Sex: F=female, M=male. Year 1=16 August 2013 00:00:00 EST – 9 June 2014 07:59:59
EST; Year 2=9 June 2014 08:00:00 EST – 9 June 2015 07:59:59 EST.
Species ID Sex Summer Winter Breeding Summer Winter Breeding
TUVU 01 F
TUVU 03 F
TUVU 06 M
TUVU 13 F
TUVU 60 M
TUVU 75 M
TUVU 90 M
TUVU 91 M
TUVU 123 M
BLVU 08 M
BLVU 12 M
BLVU 22 F
BLVU 47 F
BLVU 48 M
BLVU 57 F
BLVU 92 F
BLVU 108 M
BLVU 126 M
Year 1 Year 2

39
Table 2-5. Individual vultures included in annual activity pattern analyses. Grey fields indicate inclusion in analyses; white fields
indicate exclusion due to partial data for that month. BLVU=black vulture (Coragyps atratus), TUVU=turkey vulture (Cathartes
aura). ID: Patagial tag identification number. Sex: F=female, M=male. Year 1=1 September 2013 – 31 August 2014; Year 2=1
September 2014 – 31 August 2015.
Species ID Sex Year 1 Year 2
TUVU 01 F
TUVU 03 F
TUVU 06 M
TUVU 13 F
TUVU 60 M
TUVU 75 M
TUVU 90 M
TUVU 91 M
TUVU 123 M
BLVU 08 M
BLVU 12 M
BLVU 22 F
BLVU 47 F
BLVU 48 M
BLVU 57 F
BLVU 92 F
BLVU 108 M
BLVU 126 M

40
Figure 2-1. Net-squared displacement from evening roost locations for 2 female (purple) and 7 male (olive) turkey vultures (TUVU;
Cathartes aura) derived from GPS location data from 16 August 2013 – 9 June 2015. TUVU-ID#=Patagial tag identification number.
Migratory movements shown by elevated peaks within winter seasons (7 October – 8 February) bounded by blue-grey boxes.
Migratory movements evident for 2 female turkey vultures: TUVU-01 and TUVU-03.

41
Figure 2-2. Net-squared displacement from evening roost locations for 4 female (purple) and 5 male (olive) black vultures (BLVU;
Coragyps atratus) derived from GPS location data from 16 August 2013 – 9 June 2015. BLVU-ID#=Patagial tag identification
number. Migratory movements would be shown by elevated peaks within winter seasons (7 October – 8 February) bounded by blue-
gray boxes. No migratory movements evident for black vultures in this analysis.

42
Figure 2-3. Median (±95% CIs) monthly 95% home range sizes (km2) for 9 black (Coragyps atratus; total locations=804,470; mean
locations/month=8,429, max=14,391, min=895) and 9 turkey (Cathartes aura; total locations=1,372,194; mean
locations/month=9,026, max=16,566, min=531) vultures calculated from GPS locations collected 1 September 2013 - 31 August
2015. BLVU=black vulture; TUVU=turkey vulture. Home ranges developed using the dynamic Brownian Bridge Movement Model.
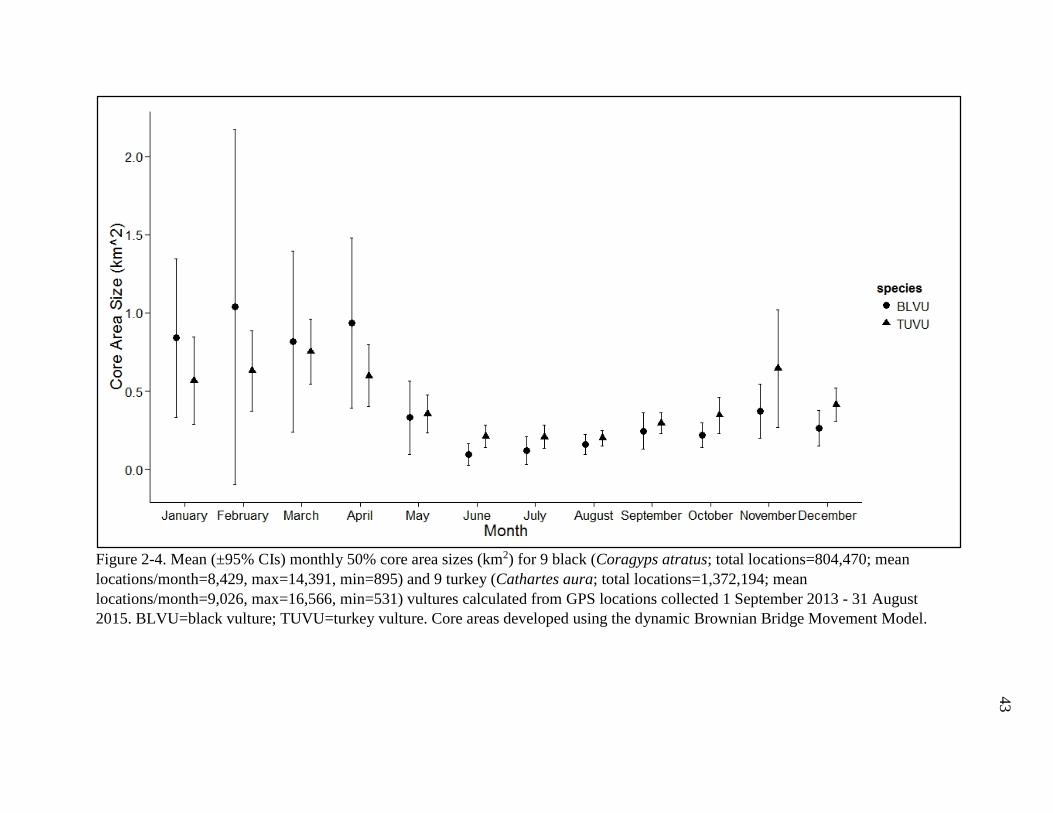
43
Figure 2-4. Mean (±95% CIs) monthly 50% core area sizes (km2) for 9 black (Coragyps atratus; total locations=804,470; mean
locations/month=8,429, max=14,391, min=895) and 9 turkey (Cathartes aura; total locations=1,372,194; mean
locations/month=9,026, max=16,566, min=531) vultures calculated from GPS locations collected 1 September 2013 - 31 August
2015. BLVU=black vulture; TUVU=turkey vulture. Core areas developed using the dynamic Brownian Bridge Movement Model.

44
Figure 2-5. Mean (±95% CIs) monthly 95% home range sizes (km2) for 5 male (total locations=437,629; mean
locations/month=8,429, max=14,391, min=3,164) and 4 female (total locations=363,210; mean locations/month=7,753, max=13,340,
min=895) resident black vultures (Coragyps atratus) calculated from GPS locations collected 1 September 2013 - 31 August 2015.
Home ranges developed using the dynamic Brownian Bridge Movement Model.
45
Figure 2-6. Mean (±95% CIs) monthly 50% core area sizes (km2) for 5 male (total locations=437,629; mean locations/month=8,429,
max=14,391, min=3,164) and 4 female (total locations=363,210; mean locations/month=7,753, max=13,340, min=895) resident black
vultures (Coragyps atratus) calculated from GPS locations collected 1 September 2013 - 31 August 2015. Core areas developed using
the dynamic Brownian Bridge Movement Model.

46
Figure 2-7. Mean (±95% CIs) proportion of switch (i.e., transitions between movement and
stationary) state locations from among GPS locations collected for 9 black (Coragyps atratus;
total locations=990,289; mean=110,032; max=171,932; min=29,808) and 9 turkey (Cathartes
aura; total locations=1,595,225; mean=177,247; max=241,187; min=38,694) vultures from 1
September 2013 to 31 August 2015. BLVU=black vulture; TUVU=turkey vulture.

47
Figure 2-8. Mean (±95% CIs) proportion of locations characterized as transit (i.e., flight) state by month from among GPS locations
collected for 9 black (Coragyps atratus; total locations=990,289; mean=110,032; max=171,932; min=29,808) and 9 turkey (Cathartes
aura; total locations=1,595,225; mean=177,247; max=241,187; min=38,694) vultures from 1 September 2013 to 31 August 2015.
BLVU=black vulture; TUVU=turkey vulture.
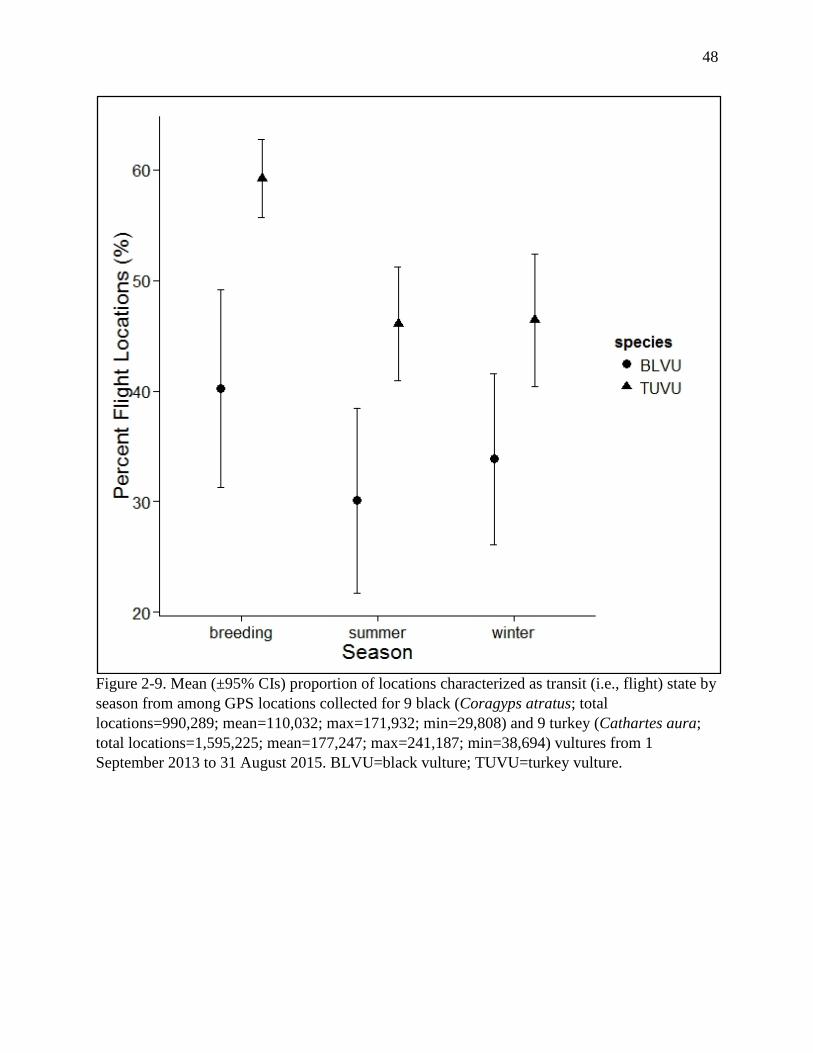
48
Figure 2-9. Mean (±95% CIs) proportion of locations characterized as transit (i.e., flight) state by
season from among GPS locations collected for 9 black (Coragyps atratus; total
locations=990,289; mean=110,032; max=171,932; min=29,808) and 9 turkey (Cathartes aura;
total locations=1,595,225; mean=177,247; max=241,187; min=38,694) vultures from 1
September 2013 to 31 August 2015. BLVU=black vulture; TUVU=turkey vulture.

49
Figure 2-10. Mean (±95% CIs) proportion of locations characterized as transit (i.e., flight) state
by year from among GPS locations collected for 9 black (Coragyps atratus; total
locations=990,289; mean=110,032; max=171,932; min=29,808) and 9 turkey (Cathartes aura;
total locations=1,595,225; mean=177,247; max=241,187; min=38,694) vultures from 1
September 2013 to 31 August 2015. BLVU=black vulture; TUVU=turkey vulture.

50
LITERATURE CITED
Avery, M. L. 2004. Trends in North American Vulture Populations. Vertebrate Pest Conference
21:116-121.
Avery, M. L., J. S. Humphrey, T. S. Daughtery, J. W. Fischer, M. P. Milleson, and E. A.
Tillman. 2011. Vulture Flight Behavior and Implications for Aircraft Safety. Journal of
Wildlife Management 75:1581-1587.
Bates, D. M. Maechler, B. Bolker, S. Walker, R. H. B. Christensen, H., Singmann, B. Dai, G.
Grothendieck. 2015. Lme4: Linear Mixed Effects Models Using ‘Eigen’ and S4. R
Package Version 1.1-10. <https://github.com/lme4/lme4/ http://lme4.r-forge.r-
project.org/>
Beasley, J. C., Z. H. Olson, and T. L. DeVault. 2015. Chapter 6: Ecological Role of Vertebrate
Scavengers. Carrion Ecology, Evolution and Their Applications. pp. 107-127.
Beasley, J.C., T.E. Grazia, P.E. Johns, and J.J. Mayer. 2013. Characterization of habitat
attributes associated with wild pig-vehicle collision locations. Wildlife Research 40:654-
660.
Blackwell, B. F., and A. E. Wright. 2006. Collisions of Red-tailed Hawks (Buteo jamaicensis),
Turkey Vultures (Cathartes aura), and Black Vultures (Coragyps atratus) with Aircraft:
Implications for Bird Strike Reduction. Journal of Raptor Research 40(1):76-80.
Bryan, A. L., A. E. Holland, J. C. Beasley, and O. E. Rhodes. 2014. Examining Vulture
Movements and Behaviors with GSM/GPS Transmitters. Microwave Telemetry, Inc.,
Newsletter p 5.
Buckley, N. J. 1998. Interspecific Competition Between Vultures for Preferred Roost Positions.
The Wilson Bulletin 110:122-125.
Buckley, N. J. 1999. Black Vulture (Coragyps atratus). Account 411 in A. Poole (editor). The
Birds of North America Online. Cornell Lab of Ornithology, Ithaca, New York.
<http://bna.birds.cornell.edu.proxy-remote.galib.uga.edu/bna/species/411>.
Bunnefeld, N., L. Börger, B. van Moorter, C. M. Rolandsen, H. Dettki, E. J. Solberg, and G.
Ericsson. 2011. A Model-Driven Approach to Quantify Migration Patterns: Individual,
Regional and Yearly Differences. Journal of Animal Ecology 80:466-476.
Byrne, M. E., A. E. Holland, A. L. Bryan, T. L. DeVault, O. E. Rhodes, and J. C. Beasley (in
prep) Efficacy of Solar-Powered Groupe Spécial Mobile/ Global Positioning System
(GSM/GPS) Transmitters in a Range of Weather Conditions.
Cagnacci, F., L. Boitani, R. A. Powell, and M. S. Boyce. 2010. Animal Ecology Meets GPS-
based Radiotelemetry: A Perfect Storm of Opportunities and Challenges. Philosophical
Transactions of the Royal Society 365:2157-2162.
51
Coleman, J. S., and J. D. Fraser. 1989. Habitat Use and Home Ranges of Black and Turkey
Vultures. Journal of Wildlife Management 53:782-792.
DeVault, T. L., J. C. Beasley, Z. H. Olson, M. Moleón, M. Carrete, A. Margalida, and J. A.
Sánchez-Zapata (in press). Why Do Birds Matter? Birds’ Ecological Functions and
Ecosystem Services, University of Chicago Press, edited by Sekercioglu, Wenny, and
Whelan.
DeVault, T. L., O. E. Rhodes. Jr., and J. A. Shivik 2003. Scavenging by Vertebrates: Behavioral,
Ecological, and Evolutionary Perspectives on an Important Energy Transfer Pathway in
Terrestrial Ecosystems. Oikos 102:225-234.
DeVault, T. L., B. D. Reinhart, I. L. Brisbin, Jr., and O. E. Rhodes. Jr. 2004. Home Ranges of
Sympatric Black and Turkey Vultures in South Carolina. Condor 106:706-711.
DeVault, T. L., B. D. Reinhart, I. L. Brisbin, Jr., and O. E. Rhodes. Jr. 2005. Flight Behavior of
Black and Turkey Vultures: Implications for Reducing Bird-Aircraft Collisions. Journal
of Wildlife Management 69:601-608.
DeVault, T. L., J. L. Belant, B. F. Blackwell, and T. W. Seamans. 2011. Interspecific Variation
in Wildlife Hazards to Aircraft: Implications for Airport Wildlife Management. Wildlife
Society Bulletin 35(4):394-402.
Dolbeer, R. A., 2011. Increasing Trend of Damaging Bird Strikes with Aircraft Outside the
Airport Boundary: Implications for Mitigation Measures. Human-Wildlife Interactions
5(2):235-248.
Dolbeer, R. A., S. E. Wright, J. Weller, and M. J. Begier. 2012. Wildlife Strikes to Civil Aircraft
in the United States. Federal Aviation Administration National Wildlife Strike Database
Serial Report Number 18, 89 pp.
Donázar, J. A., A. Travaini, O. Ceballos, A. Rodriguez, M. Delibes, and F. Hiraldo. 1999.
Effects of Sex-Associated Competitive Asymmetries on Foraging Group Structure and
Despotic Distribution in Andean Condors. Behavioral Ecology and Sociobiology 45:55-
65.
Environmental Systems Research Institute (Esri). 2012. ArcGIS Desktop: Release 10.1.
Redlands, California, USA
Fischer, J. W., W. D. Walter, and M. L. Avery. 2013. Brownian Bridge Movement Models to
Characterize Birds’ Home Ranges. The Condor 115:298-305.
Houston, D. C. 1979. Scavenging Efficiency of Turkey Vultures in Tropical Forest. The Condor
88:318–323.
Houston, C. S., P. D. McLoughlin, J. T. Mandel, M. J. Bechard, M. J. Stoffel, D. R. Barber, and
K. L. Bildstein. 2011. Breeding Home Ranges of Migratory Turkey Vultures Near Their
Northern Limit. The Wilson Journal of Ornithology 123:472-478.

52
International Union for Conservation of Nature (IUCN). 2015. The IUCN Red List of
Threatened Species. Version 2015-3. Accessed 07 October 2015. <www.iucnredlist.org>
Ito, H., A. Sudo-Yamaji, M. Abe, T. Murase, and T. Tsubota. 2003. Sex Identification by
Alternative Polymerase Chain Reaction Methods in Falconiformes. Zoological Science
20:339-344.
Jackson, J. A. 1983. Nesting Phenology, Nest Site Selection, and Reproduction Success of Black
and Turkey Vultures. In S. R. Wilbur and J. A. Jackson (editors). Vulture Biology and
Management. University of California Press, Los Angeles, USA, pp 245-270.
Kelly, N. E., D. W. Sparks, T. L. DeVault, and O. E. Rhodes, Jr. 2007. Diet of Black and Turkey
Vultures in a Forested Landscape. The Wilson Journal of Ornithology 119:267-270.
Kiff, L. F., 2000. The Current Status of North American Vultures. Raptors at Risk: Proceedings
of the V World Conference on Birds of Prey and Owls, Midrand, Johannesburg, South
Africa, 4-11 August 1998. pp 175-189.
Kirk, D. A., and D. C. Houston. 1995. Social Dominance in Migrant and Resident Turkey
Vultures at Carcasses: Evidence for a Despotic Distribution? Behavioral Ecology and
Sociobiology 36:323-332.
Kirk, D. A., and M. J. Mossman. 1998. Turkey Vulture (Cathartes aura). Account 339 in A.
Poole (editor). The Birds of North America Online. Cornell Lab of Ornithology, Ithaca,
New York. <http://bna.birds.cornell.edu.proxy-remote.galib.uga.edu/bna/species/339>
Kranstauber, B., R. Kays, S. D. LaPoint, M. Wikelski, and K. Safi. 2012. A Dynamic Brownian
Bridge Movement Model to Estimate Utilization Distributions for Heterogeneous Animal
Movement. Journal of Animal Ecology 81:738-746.
Kranstauber, B., and M. Smolla. 2014. move: Visualizing and Analyzing Animal Tracking Data.
R Package Version 1.2.475. <http://CRAN.R-project.org/package=move>
Lisney, T. J., K. Stecyk, J. Kolominsky, G. R. Graves, D. R. Wylie, and A. N. Iwaniuk. 2013.
Comparison of Eye Morphology and Retinal Topography in Two Species of New World
Vultures (Aves: Cathartidae). The Anatomical Record 296:1954-1970.
López-López, P., J. Benavent-Corai, C. Garcia-Ripolles, and V. Urios. 2013. Scavengers on the
Move: Behavioural Changes in Foraging Search Patterns during the Annual Cycle.
PLOS-One 8:1-9.
Loss, S. R., T. Will, and P. P. Marra. 2012. Direct Human-Caused Mortality of Birds: Improving
Quantification of Magnitude and Assessment of Population Impact. Frontiers in Ecology
and the Environment 10:357-364.
Mandel, J. T., K. L. Bildstein, G. Bohrer, and D. W. Winkler. 2008. Movement Ecology of
Migration in Turkey Vultures. Proceedings of the National Academy of Sciences of the
United States 105:19102-19107.

53
Markandya, A., T. Taylor, A. Longo, M. N. Murty, S. Murty, and K. Dhavala. 2008. Counting
the Cost of Vulture Decline: An Appraisal of the Human Health and Other Benefits of
Vultures in India. Ecological Economics 67:194–204.
Marra, P. P., C. J. Dove, R. Dolbeer, N. F. Dahlan, M. Heacker, J. F. Whatton, N. E. Diggs, C.
France, and G. A. Henkes. 2009. Migratory Canada Geese Cause Crash of US Airways
Flight 1549. Frontiers in Ecology and the Environment 7:297-301.
Martin, J. A., J. L. Belant, T. L. DeVault, B. F. Blackwell, L. W. Burger Jr., S. K. Riffell, and G.
Wang. 2011. Wildlife Risk to Aviation: A Multi-Scale Issue Requires a Multi-Scale
Solution. Human-Wildlife Interactions 5:198-203.
McConnell, B. J., C. Chambers, M. A. Fedak, 1992. Foraging Ecology of Southern Elephant
Seals in Relation to the Bathymetry and Productivity of the Southern Ocean, Antarctic
Science 4(4):393-398.
Microwave Telemetry, Inc. 2013. Solar GSM/GPS Transmitters.
<http://www.microwavetelemetry.com/bird/GSM.cfm> Accessed 29 Oct 2013.
Ogada, D. L., F. Keesing, and M. Z. Virani. 2012a. Dropping Dead: Causes and Consequences
of Vulture Population Declines Worldwide. Annals of the New York Academy of
Sciences 1249:57-71.
Ogada, D. L., M. E. Torchin, M. F. Kinnaird, and V. O. Ezenwa. 2012b. Effects of Vulture
Declines on Facultative Scavengers and Implications for Mammalian Disease
Transmission. Conservation Biology 23:453-460.
R Core Team. 2014. R: A language and environment for statistical computing. R Foundation for
Statistical Computing, Vienna, Austria. <http://www.R-project.org/.>
Rivers, J. W., J. M. Johnson, S. M. Haig, C. J. Schwarz, L. J. Burnett, J. Brandt, D. George, and
J. Grantham. 2014. An Analysis of Monthly Home Range Size in the Critically
Endangered California Condor Gymnogyps californianus. Bird Conservation
International 24(4):492-504.
Rolando, A. 2002. On the Ecology of Home Range in Birds [ABSTRACT]. Revue d’ Ecologie la
Terre et la vie 57:53-73.
Sauer, J. R., J. E. Hines, J. E. Fallon, K. L. Pardieck, D. J. Ziolkowski, Jr., and W. A. Link. 2012.
North American Breeding Bird Survey, Results and Analysis 1966 - 2011. Version
07.03.2013. USGS Patuxent Wildlife Research Center, Laurel, MD.
Sebastián-González, E., J. A. Sánchez-Zapata, J. A. Donázar, N. Selva,
A. Cortés-Avizanda, F. Hiraldo, M. Blázquez, F. Botella & M. Moleón. 2013. Interactive
Effects of Obligate Scavengers and Scavenger Community Richness on Lagomorph
Carcass Consumption Patterns. IBIS 255:881-885.

54
Wallace, M. P., and S. A. Temple. 1987. Competitive Interactions Within and Between Species
in a Guild of Avian Scavengers. The Auk 104:290-295.
Walter, W. D., J. W. Fischer, J. S. Humphrey, T. S. Daughtery, M. P. Milleson, E. A. Tillman,
and M. L. Avery. 2012. Using Three-dimensional Flight Patterns at Airfields to Identify
Hotspots for Avian-Aircraft Collisions. Applied Geography 35:53-59.
White, D. L., and K. E. Gaines. 2000. The Savannah River Site: Site Description, Land Use and
Management History. Studies in Avian Biology 21:8-17.
Wilson, E.E. and E.M. Wolkovich. 2011. Scavenging: How Carnivores and Carrion Structure
Communities. Trends in Ecology and Evolution 26:129–135.

55
CHAPTER 3
CHARACTERISTICS OF RESOURCE SELECTION FOR BLACK AND TURKEY
VULTURES IN THE SOUTHEASTERN UNITED STATES2
CHAPTER 3. CHARACTERISTICS OF RESOURCE SELECTION FOR BLACK AND
TURKEY VULTURES IN THE SOUTHEASTERN UNITED STATES
2 Holland, A. E., M. E. Byrne, J. Hepinstall-Cymerman, A. L. Bryan, T. L. DeVault,
O.E. Rhodes, and J. C. Beasley. To be submitted to Landscape Ecology.
56
ABSTRACT
As obligate scavengers utilizing similar habitats, interspecific competition undoubtedly
occurs over the annual cycle between resident black (Coragyps atratus) and turkey (Cathartes
aura) vultures. In the interest of exploring how sympatric species coexist through habitat
segregation, I examined resource selection of resident vultures in the southeastern United States
for evidence of niche differentiation. Using fine-scale movement data, I assessed characteristics
of habitats associated with roost sites, roost reuse frequency and roost site fidelity, and aspects of
resource selection based on utilization distributions of 9 black and 9 turkey vultures tracked from
September 2013 to August 2015 using GSM/GPS transmitters. Specifically, using > 2.8 million
GPS locations, I assessed seasonal selection of evening roost site habitat attributes, quantified
monthly, seasonal, and annual differences in the roost reuse frequency and roost site fidelity of
black and turkey vultures, and elucidated differences in monthly resource selection with
consideration to species and sex at multiple temporal scales. Results of these analyses revealed
interspecific differences in habitats associated with evening roost sites as turkey vulture roosts
comprised a significantly greater proportion of forest habitat, and black vulture roosts were
associated with areas with greater proportions of developed/urban habitat. Roost reuse frequency
was significantly lower in turkey vultures than black vultures, although roost site fidelity did not
differ by species. Comparisons of space use between male and female vultures were only
possible for black vultures for which monthly selection did not differ. Patterns of habitat
selection within the home range varied across the annual cycle with selection for wetland
habitats strongest for both species. Results of this study demonstrate differences in resource
selection and provide evidence for habitat segregation and niche differentiation by these vulture
species, for which competition exists in areas of sympatry.

57
INTRODUCTION
In areas of sympatry, competition between resident, non-migratory species occurs
throughout the annual cycle when resource requirements are similar; however, niche
differentiation reduces competition and allows for resource partitioning and coexistence.
Interspecific competition is a particular issue for vultures (i.e., obligate scavengers) as both Old
and New World species are specifically adapted to relying on carrion as a primary food resource
(Hertel 1994). Large bodies, broad wings for soaring, excellent vision, and highly acidic
stomachs are just some of the various morphological and physiological adaptations vultures
possess providing evolutionary advantages in carrion detection and consumption over other
facultative scavenging species (DeVault et al., in press). In areas where multiple vulture species
coexist, niche differentiation is demonstrated through variation in morphological characteristics
relating to feeding strategies such as body size, skull, beak, and mandible metrics (Hertel 1994).
However, when body sizes and feeding strategies are not notably distinct between coexisting
vulture species, the need to avoid direct interspecific competition drives spatial and temporal
niche separation and may be evidenced through habitat segregation.
In areas of sympatry, interspecific competition undoubtedly occurs between black and
turkey vultures as both species are diurnal, obligate scavengers utilizing similar roosting
(Buckley 1998, Avery et al. 2002, Evans and Sordahl 2009) and nesting habitats (Kirk and
Mossman 1998, Buckley 1999). However, turkey vultures primarily forage solitarily or in pairs
and have an enhanced sense of smell, allowing them to exploit carrion in areas where visual
detection is limited (Kirk and Mossman 1998) such as in forested areas with dense canopy cover.
Conversely, black vultures often forage with conspecifics (Buckley 1999), maintaining large
social groups and responding to visual cues of other scavenging birds for improved carcass

58
detection as they have a limited sense of smell (Buckley 1996, Buckley 1999). Furthermore,
black vultures are generally more aggressive and dominant and thus able to displace turkey
vultures at carcass sites (Buckley 1996, Buckley 1999). Resident vultures in the southeastern
United States are an ideal population to examine in the interest of exploring how seemingly
similar vulture species coexist through habitat segregation.
Although black and turkey vultures are relatively common and abundant throughout their
ranges, there remains a scarcity of studies elucidating the ecology and resource selection for
these species. Moreover, many prior assessments of home range and resource selection have
been limited by the capabilities of tracking devices available at the time – i.e, physical
observation (Novaes and Cintra 2013), VHF radio telemetry (Arrington 2003, Coleman and
Fraser 1989), and fixed-wing aerial radio telemetry (DeVault et al. 2004). Recent advancements
in GPS tracking technologies allow for intense sampling of vulture movements and, when
coupled with high-resolution land cover data, detailed examination of resource selection and
evidence for resource partitioning at finer temporal resolutions than previously possible (Fischer
et al. 2013). Characteristics of roost selection and measures of roost reuse and roost site fidelity
are additional aspects of vulture ecology where little is known. At increasingly finer spatial and
temporal scales, differences in resource utilization between sympatric vulture species may be
evident. To date, no prior studies have examined variation in black and turkey vulture resource
selection across fine temporal scales (e.g., monthly) and with consideration to sex-specific
differences.
Using fine-scale movement data from sympatric black and turkey vultures in the
southeastern United States, the objective of this study is to elucidate spatial and temporal
differences in resource selection throughout the annual cycle as a function of species and sex

59
with finer resolution than any previous study of these species to date. These data will further
develop our understanding of vulture ecology, allowing us to uncover distinctions in resource
selection toward evidencing niche differentiation in sympatric vulture species at fine spatial and
temporal resolutions. The specific goals of this study are to assess selection of habitat attributes
associated with vulture evening roost sites seasonally, quantify seasonal differences in the reuse
frequency and site fidelity of vultures to evening roost sites, and elucidate differences in monthly
resource selection with consideration to species and sex. From this assessment, I hypothesize
evening roost habitat selection, roost reuse frequency, and roost site fidelity will vary by season
and species. Specifically, I expect roosts to be composed of greater proportions of forest habitat
in winter months due to enhanced thermal cover. Considering that there are no perceptible
differences between sexes in body size or parental roles for either species, I have little reason to
expect differences in roost habitat selection, reuse frequency, or site fidelity between males and
females of either species. Furthermore, I expect monthly resource selection will vary between
species, and because nesting activities generally occur in areas of low-disturbance (Kirk and
Mossman 1998, Buckley 1999), I expect both species will utilize undisturbed (low human-
impact) areas during breeding season months more frequently than those of the non-breeding
season. In terms of revealing evidence for niche differentiation through habitat segregation, and
with consideration to these species’ morphological and behavioral differences in carcass-
detection and acquisition, I hypothesize turkey vultures will utilize greater proportions of
forested habitats, and black vultures will utilize greater proportions of open areas, roads,
agricultural areas, and other developed/human-disturbed areas (urban, landfills, etc.). I further
expect temporal resource partitioning between sympatric black and turkey vultures will be
apparent at these finer-scales as evidenced through variation in monthly habitat selection.

60
METHODS
Study Area
This research was conducted at the Savannah River Site (SRS), which is located along
the border of Georgia and South Carolina in the southeastern United States. Populations of black
and turkey vultures are abundant on the SRS as it provides important roosting, nesting, and
foraging habitat for both species (DeVault et al. 2004, DeVault et al. 2005). The SRS is a 780-
km2, limited-access nuclear research facility owned and operated by the U.S. Department of
Energy (DOE; White et al. 2000). Elevations range from <30 m to 115 m above sea level (White
et al. 2000). Much of SRS is relatively undisturbed by DOE activities and is primarily forested
(White et al. 2000). The SRS is composed of planted pine forests managed by the U.S. Forest
Service, bottomland hardwood, wetland, and various industrial areas including five
decommissioned nuclear reactors, radioactive materials processing plants, and landfills (White et
al. 2000). The composition of largely undisturbed natural areas and pockets of human-use
industrial areas at the SRS make this site an ideal location in which to study resident vulture
resource selection.
Vulture Trapping & Handling
During summer 2013 and spring 2014, I captured 295 black and turkey vultures. Of
these, 13 adult black and 14 adult turkey vultures were randomly selected and affixed with a
solar-powered 70-g Groupe Spécial Mobile/Global Positioning System (GSM/GPS) transmitter
(Microwave Telemetry, Inc. 2013). The transmitters reported locations (lat/long coordinates) at
variable intervals, with 76% of all locations collected with durations of 3 minutes or less between
fixes (see Chapter 2). Vultures were handled in accordance with the University of Georgia
Animal Care and Use Protocol No. A2013 02-004-Y2-A2. All trapping was conducted during

61
the non-migration season in an attempt to target only resident vultures. Non-migration/residency
was verified by assessing each vulture’s net-squared displacement (NSD; see Chapter 2) from
evening roost sites. All vultures were affixed with numbered patagial tags for individual
identification, measured for standard morphological characteristic, and aged (adult or juvenile)
based on coloration and wrinkling of the head (Kirk and Mossman 1998, Buckley 1999). Given
that black and turkey vultures are sexually monomorphic (Kirk and Mossman 1998, Buckley
1999), it was not possible to control for balanced ratios of male and female black and turkey
vultures from among those randomly selected to receive GPS tracking devices. I collected a
feather and blood from a leg or brachial vein for use in sex determination via sex-specific DNA
markers and polymerase chain reaction (PCR). All genetic analyses were conducted at the
Savannah River Ecology Laboratory in Aiken, South Carolina (see Chapter 2 for details).
Roost Habitat Characteristics, Roost Reuse and Roost Site Fidelity
Habitat characteristics of evening roosts, seasonal roost reuse frequency and roost site
fidelity were quantified using location data collected for 9 black and 9 turkey vultures from 16
August 2013 to 9 June 2015. Location data were subset into three seasons (breeding, summer
and winter) and included all fixes received within equal durations of 121 days, with the
exception of the first summer which only includes data from the final 52 nights of the season
because the GPS transmitters were first deployed mid-summer 2013. Breeding season durations
are similar for black and turkey vultures (Jackson 1983, Kirk and Mossman 1998, Buckley
1999), although in areas of sympatry, black vultures typically nest two weeks earlier than turkey
vultures (1 February - 10 June for black vultures and 15 February - 24 June for turkey vultures;
Jackson 1983, Kirk and Mossman 1998, Buckley 1999). Therefore, breeding seasons in this
analysis included fixes from 8 February to 8 June, which represent the median dates of those
62
described for vultures breeding at 32°-33° latitudes (Jackson 1983), and encompass the range of
dates wherein adult black and turkey vultures are both influenced by breeding phenology, and
standardized for ease of comparison. Fixes received within the tertiles preceding and following
the breeding season were defined as winter (9 October - 7 February) and summer (9 June - 8
October), respectively.
Evening roosts were standardized such that only those nights in which all birds had a
detectable roost location were included in this analysis, resulting in the exclusion of 3% (22 of
662) of all nights within the study period. To identify evening roosts, I extracted the average
location from among fixes received between 20:00-00:00 hours for each vulture. For nights
where no fixes were received between 20:00-00:00 hours, evening roosts were determined
manually by examining location data for series of fixes within nighttime hours where the bird
clearly did not move for several hours throughout the evening and into the following morning
(00:00-04:00), reporting the evening roost as the average of those locations. Evening roost
locations were buffered by 75 m and rounded to incorporate location error (±23 m, based on the
manufacturer’s estimate (Microwave Telemetry, Inc. 2013)). Neighboring roosts within 100 m of
one another were merged together using ArcMap GIS software (Esri 2012), incorporating
habitats between roosts to form a single roost in order to remove distinctions between locations
that may be proximally considered the same roost by a vulture.
Within each buffered roost, I quantified the proportion of each habitat type: i.e. including
proximity to roads, binned into two distance classes of 0-500m and 500-1,000m (based on
Euclidian distance) and derived from USA Major Roads map layer (Esri 2014); proximity to
landfills, binned into three distance classes of 0-500m, 500-1,000m, and >1,000m (based on
Euclidian distance) and derived from active solid waste landfill locations for Georgia (GSB-

63
EPD-GADNR 2000), South Carolina (SCDHEC-BLWM 2006), Florida (FLDEP 2015), and
North Carolina (NCDENR-DWM 2014); and five habitat types distinguished by ground-
visibility and relative level of human-impact disturbance (see Table 3-1) including wetlands
(emergent herbaceous and woody), forest (deciduous, evergreen and mixed), open developed,
open undeveloped (rock/clay/sand, barren land), and developed (low, medium and high intensity)
derived from 30m resolution land cover data from the National Land Cover Database
(NLCD2011, Homer et al. 2015). Normality was tested using the Shapiro-Wilk test and data
failing to meet the assumption of normality were square-root transformed. For normal and
square-root transformed data, I used unbalanced repeated-measures linear mixed effects models
with an unstructured covariance structure to assess differences in composition of habitat types by
species, sex and season, as well as interactions using the ‘lme4’ package (Bates et al. 2015) in
the R program (R Core Team 2014). I conducted a separate analysis for each habitat type and in
all models, species, sex, and season were included as fixed effects and individual was
incorporated as a random effect.
Roost site fidelity quantifies the percentage of evenings a vulture spends at its most
frequently re-used roost site. In other words, it gives a relative amount of time spent at the one
roost site that was most frequented by that bird. Roost site fidelity is thus calculated by dividing
the maximum number of nights at a single roost by the total number of nights sampled.
Frequency of roost reuse quantifies the percentage of evenings a vulture spends at any roost site
used once before. In other words, it reveals the frequency at which a bird reverts to any
previously used roost site as well as the inverse of utilization of new roosts. Roost reuse is thus
calculated by dividing the number of nights spent at any roost that was used more than once by
the total number of nights tracked. Normality was tested using the Shapiro-Wilk test and roost

64
site fidelity data were log-transformed to meet assumptions of normality. I used unbalanced
repeated-measures linear mixed effects models with unstructured covariance structure to assess
differences in roost reuse and log(site fidelity) by species, sex and season, as well as interactions
using the ‘lme4’ package (Bates et al. 2015) in the R program (R Core Team 2014). Analysis
between sexes was not possible for turkey vultures due to low numbers of monitored female
turkey vultures. In both models, species, sex, and season were included as fixed effects and
individual was incorporated as a random effect.
Utilization Distributions
Filtered locational data were used to develop monthly utilization distributions (UDs) for
individual vultures using the dynamic Brownian Bridge Movement Model (dBBMM;
Kranstauber et al. 2012) with the ‘move’ package (Kranstauber and Smolla 2014) in the R
program (R Core Team 2014). An advantage of the dBBMM method is that it accounts for both
temporal autocorrelation and variation in trajectories between points (Kranstauber et al. 2012).
Location data were filtered to remove erroneous data as well as any outliers according to the root
mean square (rms) algorithm of McConnell et al. (1992; see Chapter 2). To fit the dBBMM to
vulture movement paths and allow for comparisons across each model, parameters were
standardized (window=47, margin=11, raster=30) with a location error of ±23 m based on the
manufacturer’s estimate (Microwave Telemetry, Inc. 2013). To increase the certainty that UDs
developed through the dBBMMs produced reliable estimates of actual space use, vertical and
horizontal accuracy of the GSM/GPS transmitters were validated through with a series of static
tests (see Chapter 2).

65
Monthly Resource Selection
I assessed variation in vulture resource selection by delineating monthly UDs and relating
probabilities of black and turkey vulture use of specific habitat types within UDs relative to their
availability within the home range. Data for all vultures were subset and standardized to include
only fixes received within equal timeframes (i.e., monthly). Specifically, for monthly utilization,
data from September 2013 to August 2015 were sorted by month based on calendar definitions
(e.g., June contained fixes from 1 June 2015 00:00:00 EST to 30 June 2015 23:59:59 EST).
Monthly UDs were developed using the dBBMM (Kranstauber et al. 2012) in the ‘move’
package (Kranstauber and Smolla 2014) in R (R Core Team 2014; see Chapter 2) for 9 black (4
female, 5 male) and 9 turkey (3 female, 6 male) vultures monitored from 1 September 2013 to 31
August 2015. UDs provide an array of cell values based on probability of use throughout a home
range (Van Winkle 1975, Millspaugh et al. 2010). Areas receiving more use are represented by
cells of the UD with higher probability values, and substantial use of an area may suggest
importance in terms of quality or quantity of a resource therein. Contours defining 100% home
ranges were delineated from UDs and proportions of habitat types therein were used as an
estimate of available habitat.
Only habitat attributes expected to be important in providing vulture roosting, nesting,
and foraging resources were included in analyses of resource selection. Carrion is typically
ephemeral and difficult to predict spatially and temporally except along roads due to roadkill.
Landfills also are commonly used by vultures as they provide consistent and relatively reliable
foraging opportunities year-round. Roost selection by these species is influenced by level of
human disturbance (Coleman and Frasier 1989, Thompson et al. 1990), and can also be
influenced by proximity to food (Novaes and Cintra 2013), nests (Davis 1983), conditions

66
facilitating flight (Thompson et al. 1990), and social interactions (Rabenold 1986, 1987, Buckley
1996, 1997). Therefore, habitat variables in my analyses included distances to roads and
landfills, as well as land cover characteristics distinguished by both ground-visibility (i.e., open
areas vs. forests with canopy cover) and relative level of human-impact disturbance (developed
vs. undeveloped; Table 3-1; see section: Roost Habitat Characteristics, Roost Reuse and Roost
Site Fidelity). ArcMap GIS software (Esri 2012) was used to develop raster layers at 30 m
resolution of all input data for habitat types encompassing the spatial extent of the study area.
Study area was determined by buffering the outer edge of the 100% minimum convex polygon
(MCP) of all pooled vulture locations by 1000 km, which resulted in a study area roughly four-
times larger than the size of all combined vulture MCP 100% home range areas (Figure 3-1).
Resource selection was determined by ratios of proportional use to availability of each
habitat type within the home range. Use of each habitat type was determined with the expected
probabilities of occurrence derived from monthly UDs using the “Zonal Statistics” tool in
ArcMap GIS software (Esri 2012). Resource selection ratios (ln(rf)) were calculated for each
bird/year/month/habitat following the method of Rivers et al. (2013) where:
𝑌𝑏𝑖𝑟𝑑,𝑦𝑒𝑎𝑟,𝑚𝑜𝑛𝑡ℎ,ℎ𝑎𝑏𝑖𝑡𝑎𝑡 =
𝑙𝑛(𝑟𝑓𝑏𝑖𝑟𝑑,𝑦𝑒𝑎𝑟,𝑚𝑜𝑛𝑡ℎ,ℎ𝑎𝑏𝑖𝑡𝑎𝑡) =
𝑙𝑛 (Proportion Use𝑏𝑖𝑟𝑑,𝑦𝑒𝑎𝑟,𝑚𝑜𝑛𝑡ℎ,ℎ𝑎𝑏𝑖𝑡𝑎𝑡
Proportion Available𝑏𝑖𝑟𝑑,𝑦𝑒𝑎𝑟,𝑚𝑜𝑛𝑡ℎ,ℎ𝑎𝑏𝑖𝑡𝑎𝑡)
I removed months where available habitat was zero, resulting in the exclusion of ~5%
(124/2496) of total possible selection ratios. For retained months where a habitat was available
but not used, I replaced zero values of use with 1e-100 to constrain the output of the equation to
real numbers. Resource selection ratios were ln-transformed such that “a selection ratio of ½ is
the same distance away from 1 as a selection ratio of 2” (Rivers et al. 2013). Selection ratios

67
(ln(rf)) for each habitat type were assessed for normality using the Shapiro-Wilk test and
subsequently square-root transformed based on skew of the distribution (e.g.,
√(𝑙𝑛(rf) + |min(𝑙𝑛(rf))|)). For each habitat type, I developed 10 resource selection models a-
priori using linear mixed-effects models with unstructured covariance structure with the ‘lme4’
package (Bates et al. 2015) in R (R Core Team 2014). Fixed effects for each model included
species, month, and sex, combinations thereof, and species*sex and species*month interactions.
Individual was included as a random effect in the models. Models were ranked using Akaike’s
Information Criterion (AIC) and model weights and all models within 2 ΔAIC were considered
supported.
RESULTS
Seasonal Roost Characteristics
Habitat characteristics for seasonal (breeding, summer and winter) roosts were quantified
from 662 nights for 9 black vultures (4 female, 5 male) and 9 turkey vultures (3 female, 6 male)
from 16 August 2013 to 8 June 2015. Proportions of habitat types were calculated for an average
of 106 (min=50, max=123) nights across all seasons (Table 3-2). I observed a significant
difference in the proportion of forested habitat within evening roosts between black and turkey
vultures (F1,80=21.97, P<0.001) across all seasons (F3,79=10.536, P<0.001), with turkey vulture
roosts comprising significantly greater proportions of forest than those of black vultures (28.37 ±
1.6%, 14.62 ± 1%; Figure 3-2c). Mean proportions of developed/urban habitat types comprising
black vulture evening roosts (3.24 ± 0.96%) were greater than those of turkey vultures (0.79 ±
0.16%) amongst all seasons, although differences by species were not significant (F1,80=2.408,
P=0.32; Figure 3-2b). Mean proportions of developed/urban habitat in evening roosts was
substantially greater in female black vultures (5.21 ± 1.7%) than male black vultures (1.06 ±

68
0.3%) roosts, although differences were not significant (F1,7=1.63, P=0.24; Figure 3-5a). Mean
proportions of road distances 0-500m comprising turkey vulture evening roosts (19.4 ± 1.4%)
were greater than those of black vultures (13.6 ± 2.1%) across all seasons, although differences
were not significant (F1,80=16.17, P=0.32; Figure 3-3b). Proportions of evening roost
developed/open habitat did not differ between black and turkey vultures (10.9 ± 1.3%, 7.6 ±
0.8%; F1,80=1.682, P=0.213; Figure 3-2d). Although proportions of wetland habitat utilized at
evening roosts by black and turkey vultures did not differ between species (55.7 ± 2.7%, 47.2 ±
2.2%; F1,80=2.861, P=0.109), use differed significantly by season for both black (F2,79=3.541,
P=0.043) and turkey (F2,79=4.493, P=0.018) vultures, with use of wetland habitats highest in
winter (Figure 3-2a). Similarly, proportions of undeveloped/open habitat at evening roosts of
black and turkey vultures did not differ by species (13.6 ± 0.7%, 15.3 ± 1.1%; F1,80=0.540,
P=0.47), however use differed significantly by season (F2,79=5.633, P<0.001; Figure 3-3a) with
use highest in the breeding season. Finally, I found no differences in evening roost use of landfill
distances 0-500m (F1,80=0.724, P=0.407) and 500-1000m (F1,80=1.846, P=0.19) by black and
turkey vulture roosts, although use did vary by season (F1,80=4.68, P=0.019; and F1,80=14.17,
P<0.001), and was highest in the summer (Figure 3-3c,d).
Roost Reuse Frequency and Site Fidelity
Roost site fidelity did not differ between black (30.71 ± 4.23%) and turkey vultures
(19.91 ± 1.51%; F1,82=1.03, P=0.325; Figure 3-6b). The frequency of roost reuse was
significantly higher in black vultures (74.29 ± 2.11%) than turkey vultures (57.50 ± 2.41%;
F1,82=15.805, P=0.002; Figure 3-6a). Roost reuse also varied significantly among seasons for
both black (F2,36=4.54, P=0.02) and turkey vultures (F2,36=4.23, P=0.02; Figure 3-6a).
Specifically, roost reuse was highest in winter (79.5 ± 2.1%) over breeding (74 ± 4.3%) and

69
summer (69.4 ± 4%) seasons for black vultures, and highest in breeding (65.8 ± 2.7%) over
winter (57.3 ± 5%) and summer (50 ± 3.7%) seasons for turkey vultures. Roost reuse did not
vary between male and female black vultures (F1,36=0.248, P=0.633; Figure 3-7a) and there was
no evidence for a sex by season interaction (F2,36=1.24, P=0.306).
Monthly Resource Selection
Monthly resource selection within the home range was calculated for 9 black vultures (4
female, 5 male) and 9 turkey vultures (3 female, 6 male) from September 2013 to August 2015. I
assessed resource selection for an average of 16 (min=6, max=24) months for individual black
vultures and 18 (min=3, max=24) months for turkey vultures. Results of my mixed model
analyses for resource selection within the home range showed strongest support for monthly
effects on selection for most habitat types (Table 3-3). There was little evidence that selection
differed by species for developed/urban, developed/open, habitats with distances of 0-500m from
roads, and habitats with distances of 500-1,000m from landfills. For selection of wetland
habitats, there was evidence for an effect of species and sex interactions. For selection of habitats
within distance of 0-500m of landfills, I found strong support for a species and month interaction
effect. I found consistent evidence for selection of wetlands (Figure 3-8) whereas nearly all other
habitat types were used somewhat less than their availability (Figures 3-9 – 3-15). Month was the
strongest factor influencing selection for developed/urban habitats.
DISCUSSION
This study provides evidence for niche differentiation in sympatric black and turkey
vultures by demonstrating habitat segregation at a finer temporal resolution than previous
studies. Using over 2.8 million locations collected from GPS-tracked vultures, my results
demonstrate differences in roost site characteristics, roost reuse frequency, and resource selection

70
between these species at multiple spatial and temporal scales. These data undoubtedly reflect
differences in physiology, behavior, and social structure and thus represent underlying
mechanisms of niche differentiation between species.
Although black and turkey vultures are observed concurrently at roost sites (Thompson et
al. 1990), my data provide strong evidence for niche differentiation in evening roost site
characteristics as both species differed in the proximity of evening roosts to forest and
developed/urban habitats. Specifically, turkey vulture evening roosts comprised a significantly
greater proportion of forest habitat, whereas black vulture evening roosts comprised a greater
proportion of developed/urban habitat. Distinctions in the level of disturbance associated with
these habitats are substantial and suggest black and turkey vultures may differ in their sensitivity
to human disturbance at roost sites. Black vultures are generally described as bold compared to
turkey vultures (Buckley 1996, Buckley 1999) and their tolerance to roosting in developed areas
near human activity may be higher due to their inherent boldness as well as propensity to roost in
large groups of conspecifics, reducing predation risk (Buckley 1999). Turkey vultures likely
roost in forest habitats significantly more than black vultures because of their ability to exploit
carrion resources in forested areas through enhanced olfaction, while black vultures must rely
more so upon visual detection, which is limited in forested habitats (Kirk and Mossman 1998,
Buckley 1999). Furthermore, although I did not examine specific finer-scale roost characteristics
within the generalized habitats (i.e., tree type within forest or building/structure within
developed/urban habitat), black vultures may be utilizing communication towers and other tall
human structures within developed/urban habitats in order to gain in visual perspective. The
composition of other measured habitats at roost sites did not differ between species, although use
of wetlands varied by season. Specifically, use of wetlands was highest in winter and lowest in

71
breeding season for both species. In winter, wooded wetlands are likely used for thermal
properties as protection from adverse weather conditions (Thompson et al. 1990), and equally
may provide desirable cooling conditions with shade, water, and abundant perch structures for
resting in warm summer conditions.
Roost reuse and roost site fidelity also can be informative parameters differentiating
behaviors of sympatric black and turkey vultures. I used roost reuse frequency to elucidate a
measure of a vulture’s exploratory behavior and general success in finding new foraging
opportunities. When a vulture spends an evening in a new location, it is likely that it chose that
site after some searching and in response to having found something of value; most probably a
carcass. Roost reuse frequency measures the amount of time a vulture returns to any previously
used roost site, and thus the inverse of roost reuse may be a useful measure of successful
explorations for novel carrion sources. Roost reuse frequency was significantly lower in turkey
vultures than black vultures, and turkey vultures thus spent more nights in novel roosts than did
black vultures. This finding likely reflects the fact that turkey vultures have enhanced olfaction
and are typically the first to arrive at a carcass (Kirk and Mossman 1998, Roen and Yahner
2005). Moreover, the higher roost reuse frequency observed by black vultures may be indicative
that individuals return to familiar roosts more often in order to maintain social connections and
continue to benefit from responding to cues of other vultures for carrion resources (Buckley
1999). I found no significant evidence for differences in seasonal roost site fidelity by species or
sex, suggesting that all vultures return to dominant evening roost sites at relatively similar rates;
however, mean roost site fidelity was higher in black vultures than turkey vultures, which
supports my original hypothesis. These results can have important implications for vulture
management and conservation as roost habitat characteristics can be further examined to

72
understand aspects driving selection for and differences between these primary, reused and novel
roosts.
Analyses of monthly resource selection revealed significant selection for wetland habitats
by both species, while all other habitat types were selected to substantially lesser degrees. It is
important to note that proportions of habitat availability were not relative to other habitats in this
analysis, but rather relative to actual availability within the home ranges. For example, habitats
within distances of 0-500m from roads could also be composed of various proportions of forest,
developed/open, wetland, or any other habitat combinations included in this analysis. Therefore,
selection and use of one habitat did not necessarily suggest non-use or avoidance of others.
Wetland habitats included both emergent and wooded wetlands. This analysis did not distinguish
between wetland types; however, strong selection for wetlands was evident by both species and
is likely due to the substantial composition of wooded wetlands within the study area which
provides a variety of desirable conditions for a vulture including suitable flight conditions,
roosting and nesting structures, and reliable and consistent foraging opportunities due to high
biodiversity typical of wetlands (Dudgeon et al. 2006).
Vulture habitat selection varied by month for nearly all habitat types. Selection for
habitats within distances of 0-500m from roads, and within 0-1,000m of landfills did not differ
significantly by species, and varied similarly across months with lowest selection occurring
during winter and breeding months, especially for black vultures. Decreased selection for roads
and landfills during the winter months, however nominal, may suggest that more desirable
scavenging opportunities were available in less-disturbed habitats during winter months.
Although landfills and roads provide a relatively reliable source of scavenging opportunities
throughout the annual cycle, risks are associated with selection for carrion at these sites. Vultures

73
foraging on carcasses along roads risk colliding with passing vehicles, and trash at landfills is
constantly churned and plowed over by maintenance vehicles creating a relatively disruptive
environment for foraging vultures. Therefore, nominal selection for these habitat types may
suggest that roads and landfills are not preferentially selected, but rather may only be used in
times of desperation, when safer alternatives are not available or abundant.
Certain distinctions in habitat selection were evident by species. Fluctuations in monthly
selection for undeveloped/open habitats was relatively similar by species, although selection for
undeveloped/open habitats by turkey vultures was substantially higher across all months,
especially in the breeding season. Additionally, selection for forest habitats was greater in turkey
vultures throughout nearly all months except the end of summer. Black vulture selection for
habitats within distance of landfills at 0-1,000m dropped significantly while selection for
developed/open habitats increased substantially in the months of June and July, which coincide
with the range of dates over which chicks hatch. Black vultures tasked with chick-rearing in the
early stages may take greater precautions during foraging events and thus preferentially selected
less-disturbed habitats than landfills.
Resource selection by black and turkey vultures varies over the course of an annual cycle,
and differences previously undetected emerge at finer scales. Results of this study demonstrate
differences in resource selection and provide evidence for habitat segregation and niche
differentiation by these vulture species for which competition exists in areas of sympatry. These
data build upon our understanding of vulture spatial ecology, providing insights into underlying
behavioral mechanisms facilitating niche differentiation between species and ultimately should
provide critical insights into the conservation and management of this important group of birds.

74
Figure 3-1. Extent of study area for resource selection analysis including major portions of South
Carolina, Georgia and Florida in the southeastern United States.

75
Table 3-1. Habitat variables and associated descriptions for resource selection analyses
conducted for black and turkey vultures monitored with GPS transmitters in the southeastern
U.S.
Habitat Variable Class Descriptions
Wetland 90* Woody Wetland
95* Emergent Herbaceous Wetland
Forest 41* Deciduous Forest
42* Evergreen Forest
43* Mixed Forest
Developed 22* Developed, Low Intensity
23* Developed, Medium Intensity
24 Developed, High Intensity
Developed, Open 21* Developed, Open Space
31* Barren Land (Rock/Sand/Clay)
81* Pasture/Hay
82* Cultivated Crops
Undeveloped, Open 52* Shrub/Scrub
71* Grassland/Herbaceous
Landfill #1 -- Distance: 0-500 m
Landfill #2 -- Distance: 500-1,000 m
Road #1 -- Distance: 0-500 m
*Class\Value from National Land Cover Database 2011 (NLCD 2011)

76
Table 3-2. Table of individual vultures (ID) included in seasonal roost habitat analyses and
number of nights (n) included per season. Species: BLVU=black vulture (Coragyps atratus),
TUVU=turkey vulture (Cathartes aura); ID#: Patagial Tag Identification Number; Sex:
F=female, M=male. : included; -: not included in analyses.
Species ID Sex
Summer
2013
Winter
2014
Breeding
2014
Summer
2014
Winter
2014
Breeding
2015
n=50 n=119 n=117 n=110 n=123 n=121
TUVU 01 F
TUVU 03 F
TUVU 06 M
BLVU 08 M - - -
BLVU 12 M
TUVU 13 F - - - - -
BLVU 22 F
BLVU 47 F
BLVU 48 M - - -
BLVU 57 F - - - -
TUVU 60 M
TUVU 75 M
TUVU 90 M
TUVU 91 M
BLVU 92 F
BLVU 108 M - - -
TUVU 123 M - - -
BLVU 126 M - - -

77
Figure 3-2. Mean (±95% CI) proportions of (a) wetland, (b) developed/urban, (c) forest, and (d)
developed/open habitat types comprising evening roosts across breeding (B), summer (S), and
winter (W) seasons for 9 black (BLVU; Coragyps atratus), and 9 turkey (TUVU; Cathartes
aura) vultures monitored with GPS transmitters in the southeastern U.S.

78
Figure 3-3. Mean (±95% CI) proportions of (a) undeveloped/open, (b) distances of 0-500m from
road (c) distances of 0-500m from landfill, and (d) distances of 500-1,000m from landfill habitat
types comprising evening roosts across breeding (B), summer (S), and winter (W) seasons for 9
black (BLVU; Coragyps atratus), and 9 turkey (TUVU; Cathartes aura) vultures monitored with
GPS transmitters in the southeastern U.S.
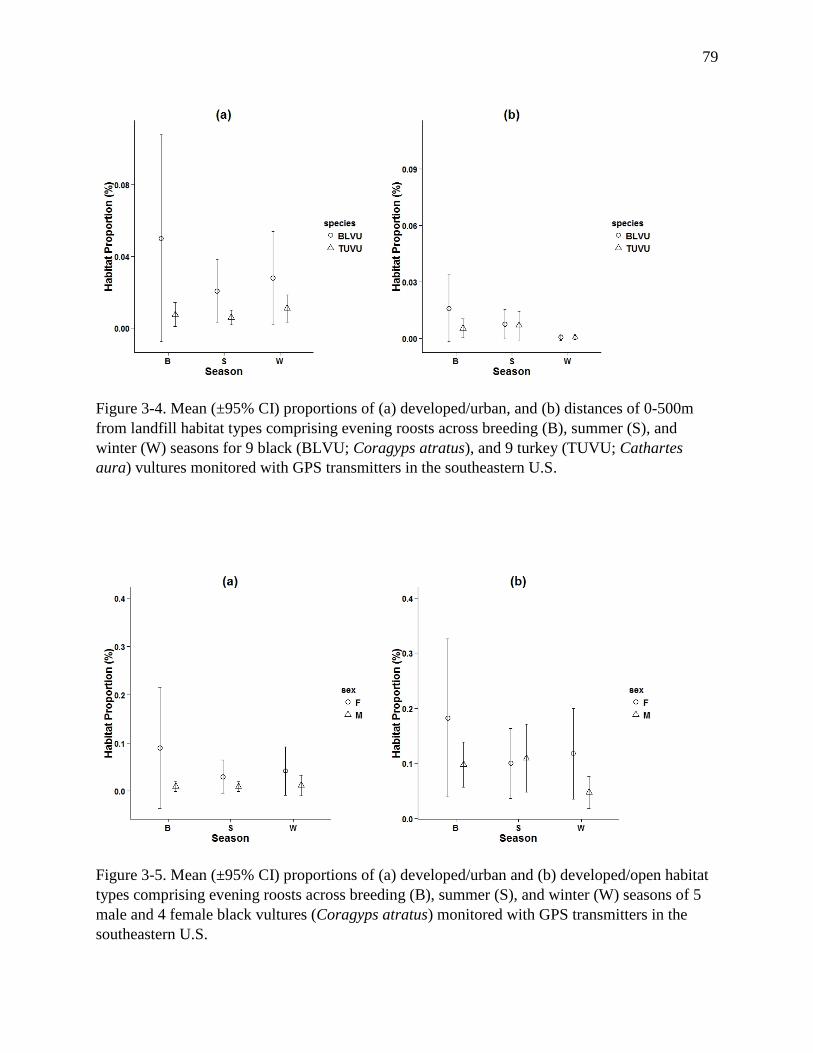
79
Figure 3-4. Mean (±95% CI) proportions of (a) developed/urban, and (b) distances of 0-500m
from landfill habitat types comprising evening roosts across breeding (B), summer (S), and
winter (W) seasons for 9 black (BLVU; Coragyps atratus), and 9 turkey (TUVU; Cathartes
aura) vultures monitored with GPS transmitters in the southeastern U.S.
Figure 3-5. Mean (±95% CI) proportions of (a) developed/urban and (b) developed/open habitat
types comprising evening roosts across breeding (B), summer (S), and winter (W) seasons of 5
male and 4 female black vultures (Coragyps atratus) monitored with GPS transmitters in the
southeastern U.S.

80
Figure 3-6. (a) Roost reuse (±95% CI) and (b) site fidelity (±95% CI) across breeding, summer,
and winter seasons for 9 black (BLVU; Coragyps atratus), and 9 turkey (TUVU; Cathartes
aura) vultures monitored with GPS transmitters in the southeastern U.S.
Figure 3-7. (a) Roost reuse (±95% CI) and (b) site fidelity (±95% CI) across breeding, summer,
and winter seasons for 5 male and 4 female black vultures (Coragyps atratus) monitored with
GPS transmitters in the southeastern U.S.

81
Table 3-3. Model selection results for repeated measures mixed model analyses based on
selection ratios (sr) for individual habitat types by species (spp), month (mo) and sex (sex)
within 100% home ranges with individual animal (id) as random effect.
Habitat Type Model
AIC
wt ΔAIC AIC Dev
Wetland sr~spp*sex+mo+(1|id) 0.85 0.00 335.60 321.6
sr~spp+sex*mo+(1|id) 0.14 3.60 339.20 285.2
sr~spp*sex*mo+(1|id) 0.00 10.80 346.40 246.4
sr~spp+sex+mo+(1|id) 0.00 18.50 354.10 322.1
sr~mo+(1|id) 0.00 19.30 354.90 326.9
sr~spp+mo+(1|id) 0.00 20.80 356.40 326.4
sr~spp*mo+(1|id) 0.00 30.30 365.90 313.9
sr~1+(1|id) 0.00 33.70 369.30 363.3
sr~spp+sex+(1|id) 0.00 33.70 369.30 359.3
sr~spp*sex+(1|id) 0.00 35.00 370.60 358.6
sr~spp+(1|id) 0.00 35.30 370.90 362.9
Forest sr~spp+mo+(1|id) 0.33 0.00 358.30 328.3
sr~spp+sex+mo+(1|id) 0.27 0.40 358.74 326.7
sr~spp*sex*mo+(1|id) 0.19 1.10 359.40 259.4
sr~spp*sex+mo+(1|id) 0.10 2.40 360.70 326.7
sr~spp+sex*mo+(1|id) 0.05 3.70 362.00 308.0
sr~mo+(1|id) 0.04 4.30 362.60 334.6
sr~spp*mo+(1|id) 0.03 5.10 363.40 311.4
sr~spp+(1|id) 0.00 8.90 367.20 359.2
sr~spp+sex+(1|id) 0.00 9.40 367.70 357.7
sr~spp*sex+(1|id) 0.00 11.40 369.70 357.7
sr~1+(1|id) 0.00 13.40 371.70 365.7
Developed
sr~mo+(1|id) 0.40 0.00 1005.50 977.5
sr~spp*mo+(1|id) 0.27 0.80 1006.30 954.3
sr~spp+mo+(1|id) 0.17 1.70 1007.20 977.2
sr~spp+sex+mo+(1|id) 0.09 3.10 1008.60 976.6
sr~spp*sex+mo+(1|id) 0.07 3.60 1009.10 975.1
sr~1+(1|id) 0.00 10.70 1016.20 1010.2
sr~spp+(1|id) 0.00 12.50 1018.00 1010.0
sr~spp+sex+(1|id) 0.00 13.90 1019.40 1009.4
sr~spp*sex+(1|id) 0.00 14.10 1019.60 1007.6
sr~spp+sex*mo+(1|id) 0.00 15.80 1021.30 967.3
sr~spp*sex*mo+(1|id) 0.00 22.20 1027.70 927.7

82
Table 3-3. Model selection results for repeated measures mixed model analyses based on
selection ratios (sr) for individual habitat types by species (spp), month (mo) and sex (sex)
within 100% home ranges with individual animal (id) as random effect.
Habitat Type Model
AIC
wt ΔAIC AIC Dev
Developed,
Open
sqrt(sr+|min(sr)|)~mo+(1|id) 0.46 0.00 41.50 13.5
sqrt(sr+|min(sr)|)~spp*sex+mo+(1|id) 0.27 1.10 42.60 8.6
sqrt(sr+|min(sr)|)~spp+mo+(1|id) 0.18 1.90 43.40 13.4
sqrt(sr+|min(sr)|)~spp+sex+mo+(1|id) 0.07 3.90 45.40 13.4
sqrt(sr+|min(sr)|)~spp*mo+(1|id) 0.03 5.50 47.00 -5.0
sqrt(sr+|min(sr)|)~spp+sex*mo+(1|id) 0.00 14.80 56.30 2.3
sqrt(sr+|min(sr)|)~1+(1|id) 0.00 18.90 60.40 54.4
sqrt(sr+|min(sr)|)~spp*sex+(1|id) 0.00 19.80 61.30 49.3
sqrt(sr+|min(sr)|)~spp+(1|id) 0.00 20.90 62.40 54.4
sqrt(sr+|min(sr)|)~spp+sex+(1|id) 0.00 22.90 64.40 54.4
sqrt(sr+|min(sr)|)~spp*sex*mo+(1|id) 0.00 25.50 67.00 -33.0
Undeveloped,
Open
sr~spp*sex+mo+(1|id) 0.23 0.00 381.10 347.1
sr~spp*sex+(1|id) 0.21 0.20 381.30 369.3
sr~spp+mo+(1|id) 0.14 1.00 382.10 352.1
sr~spp+(1|id) 0.11 1.50 382.60 374.6
sr~mo+(1|id) 0.09 1.80 382.90 354.9
sr~1+(1|id) 0.07 2.30 383.40 377.4
sr~spp+sex+mo+(1|id) 0.07 2.30 383.40 351.4
sr~spp+sex+(1|id) 0.06 2.70 383.80 373.8
sr~spp*mo+(1|id) 0.00 9.20 390.30 338.3
sr~spp+sex*mo+(1|id) 0.00 10.30 391.40 337.4
sr~spp*sex*mo+(1|id) 0.00 24.30 405.40 305.4
Landfill
Distance
(0-500m)
sqrt(sr+|min(sr)|)~spp*mo+(1|id) 0.57 0.00 525.40 473.4
sqrt(sr+|min(sr)|)~spp+mo+(1|id) 0.16 2.50 527.90 497.9
sqrt(sr+|min(sr)|)~spp+sex+mo+(1|id) 0.12 3.20 528.60 496.6
sqrt(sr+|min(sr)|)~mo+(1|id) 0.09 3.70 529.10 501.1
sqrt(sr+|min(sr)|)~spp*sex+mo+(1|id) 0.05 4.80 530.20 496.2
sqrt(sr+|min(sr)|)~spp+sex*mo+(1|id) 0.01 9.10 534.50 480.5
sqrt(sr+|min(sr)|)~spp+(1|id) 0.00 16.60 542.00 534.0
sqrt(sr+|min(sr)|)~spp+sex+(1|id) 0.00 17.30 542.70 532.7
sqrt(sr+|min(sr)|)~1+(1|id) 0.00 17.60 543.00 537.0
sqrt(sr+|min(sr)|)~spp*sex+(1|id) 0.00 18.00 543.40 531.4
sqrt(sr+|min(sr)|)~spp*sex*mo+(1|id) 0.00 26.00 551.40 451.4

83
Table 3-3. Model selection results for repeated measures mixed model analyses based on
selection ratios (sr) for individual habitat types by species (spp), month (mo) and sex (sex)
within 100% home ranges with individual animal (id) as random effect.
Habitat Type Model
AIC
wt ΔAIC AIC Dev
Landfill
Distance
(500-1000m)
sqrt(sr+|min(sr)|)~mo+(1|id) 0.40 0.00 539.50 511.5
sqrt(sr+|min(sr)|)~spp+mo+(1|id) 0.28 0.70 540.20 510.2
sqrt(sr+|min(sr)|)~spp*mo+(1|id) 0.15 2.00 541.50 489.5
sqrt(sr+|min(sr)|)~spp+sex+mo+(1|id) 0.12 2.40 541.90 509.9
sqrt(sr+|min(sr)|)~spp*sex+mo+(1|id) 0.05 4.10 543.60 509.6
sqrt(sr+|min(sr)|)~1+(1|id) 0.00 19.80 559.30 553.3
sqrt(sr+|min(sr)|)~spp+(1|id) 0.00 19.90 559.40 551.4
sqrt(sr+|min(sr)|)~spp+sex*mo+(1|id) 0.00 21.10 560.60 506.6
sqrt(sr+|min(sr)|)~spp+sex+(1|id) 0.00 21.70 561.20 551.2
sqrt(sr+|min(sr)|)~spp*sex+(1|id) 0.00 23.10 562.60 550.6
sqrt(sr+|min(sr)|)~spp*sex*mo+(1|id) 0.00 33.90 573.40 473.4
Road Distance
(0-500m)
sqrt(sr+|min(sr)|)~mo+(1|id) 0.51 0.00 452.60 424.6
sqrt(sr+|min(sr)|)~spp+mo+(1|id) 0.27 1.30 453.90 423.9
sqrt(sr+|min(sr)|)~spp+sex+mo+(1|id) 0.14 2.60 455.20 423.2
sqrt(sr+|min(sr)|)~spp*sex+mo+(1|id) 0.06 4.30 456.90 422.9
sqrt(sr+|min(sr)|)~1+(1|id) 0.01 8.00 460.60 454.6
sqrt(sr+|min(sr)|)~spp+(1|id) 0.01 9.20 461.80 453.8
sqrt(sr+|min(sr)|)~spp+sex+(1|id) 0.00 10.60 463.20 453.2
sqrt(sr+|min(sr)|)~spp*sex+(1|id) 0.00 12.40 465.00 453.0
sqrt(sr+|min(sr)|)~spp*mo+(1|id) 0.00 14.30 466.90 414.9
sqrt(sr+|min(sr)|)~spp+sex*mo+(1|id) 0.00 19.40 472.00 418.0
sqrt(sr+|min(sr)|)~spp*sex*mo+(1|id) 0.00 54.30 506.90 406.9

84
Figure 3-8. Mean (±SE) selection ratios (ln(rf)) for wetland habitat within 100% home ranges calculated from utilization distributions
of 9 black (Coragyps atratus; BLVU;) and 9 turkey (Cathartes aura; TUVU) vultures tracked via GPS transmitters from September
2013 to August 2015.
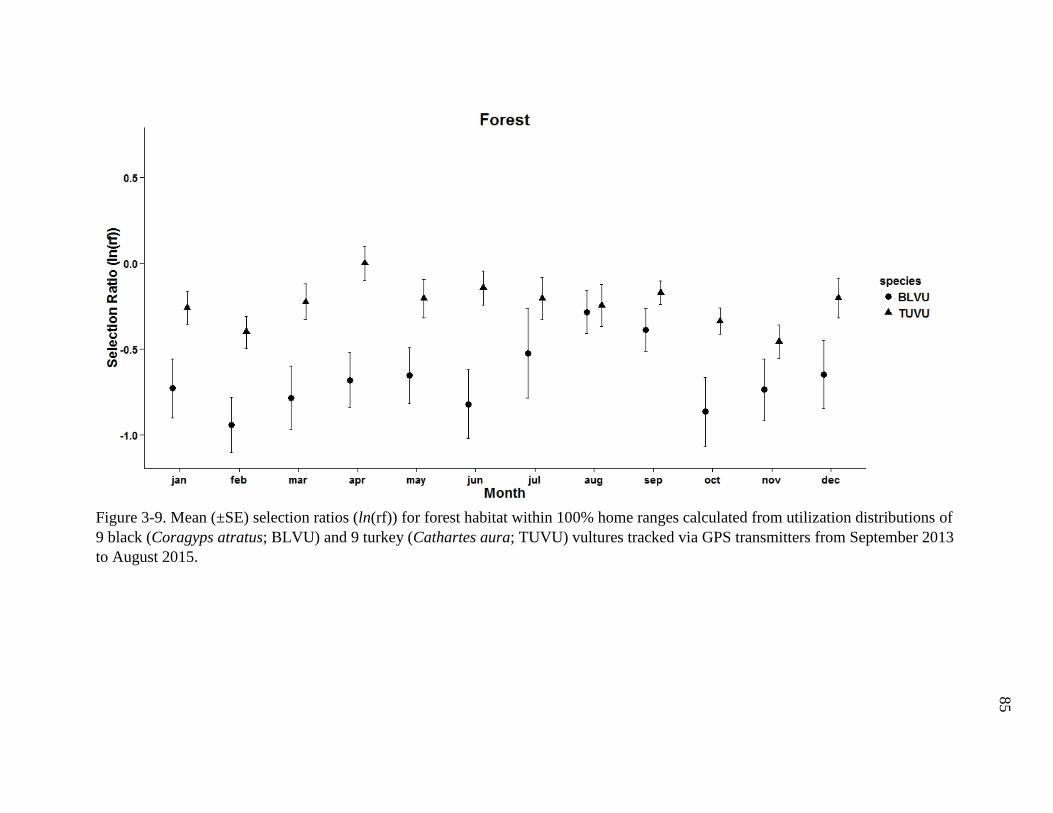
85
Figure 3-9. Mean (±SE) selection ratios (ln(rf)) for forest habitat within 100% home ranges calculated from utilization distributions of
9 black (Coragyps atratus; BLVU) and 9 turkey (Cathartes aura; TUVU) vultures tracked via GPS transmitters from September 2013
to August 2015.

86
Figure 3-10. Mean (±SE) selection ratios (ln(rf)) for developed habitat within 100% home ranges calculated from utilization
distributions of 9 black (Coragyps atratus; BLVU) and 9 turkey (Cathartes aura; TUVU) vultures tracked via GPS transmitters from
September 2013 to August 2015.

87
Figure 3-11. Mean (±SE) selection ratios (ln(rf)) for developed/open habitat within 100% home ranges calculated from utilization
distributions of 9 black (Coragyps atratus; BLVU) and 9 turkey (Cathartes aura; TUVU) vultures tracked via GPS transmitters from
September 2013 to August 2015.

88
Figure 3-12. Mean (±SE) selection ratios (ln(rf)) for undeveloped/open habitat within 100% home ranges calculated from utilization
distributions of 9 black (Coragyps atratus; BLVU) and 9 turkey (Cathartes aura; TUVU) vultures tracked via GPS transmitters from
September 2013 to August 2015.

89
Figure 3-13. Mean (±SE) selection ratios (ln(rf)) for habitat within distances of 0-500m from landfill within 100% home ranges
calculated from utilization distributions of 9 black (Coragyps atratus; BLVU) and 9 turkey (Cathartes aura; TUVU) vultures tracked
via GPS transmitters from September 2013 to August 2015.

90
Figure 3-14. Mean (±SE) selection ratios (ln(rf)) for habitat within distances of 500-1,000m from landfill within 100% home ranges
calculated from utilization distributions of 9 black (Coragyps atratus; BLVU) and 9 turkey (Cathartes aura; TUVU) vultures tracked
via GPS transmitters from September 2013 to August 2015.

91
Figure 3-15. Mean (±SE) selection ratios (ln(rf)) for habitat within distances of 0-500m from road within 100% home ranges
calculated from utilization distributions of 9 black (Coragyps atratus; BLVU) and 9 turkey (Cathartes aura; TUVU) vultures tracked
via GPS transmitters from September 2013 to August 2015.

92
LITERATURE CITED
Arrington, D. P. 2003. Flight Characteristics of Non-Migrating and Migrating Populations of
Turkey Vultures. Dissertation, Purdue University, West Lafayette, Indiana, USA.
Austin, D., W. D. Bowen, and J. I. McMillan. 2004. Intraspecific Variation in Movement
Patterns: Modeling Individual Behavior in a Large Marine Predator. Oikos 105:15–30.
Avery, M. L. 2004. Trends in North American Vulture Populations. Vertebrate Pest Conference
21:116-121.
Avery, M. L., J. S. Humphrey, T. S. Daughtery, J. W. Fischer, M. P. Milleson, and E. A.
Tillman. 2011. Vulture Flight Behavior and Implications for Aircraft Safety. Journal of
Wildlife Management 75:1581-1587.
Avery, M. L., J. S. Humphrey, E. A. Tillman, K. O. Phares, and J. E. Hatcher. 2002. Dispersing
Vulture Roosts on Communication Towers. Journal of Raptor Research 36:45-50.
Blackwell, B. F., and A. E. Wright. 2006. Collisions of Red-tailed Hawks (Buteo jamaicensis),
Turkey Vultures (Cathartes aura), and Black Vultures (Coragyps atratus) with Aircraft:
Implications for Bird Strike Reduction. Journal of Raptor Research 40(1):76-80.
Bryan, A. L., A. E. Holland, J. C. Beasley, and O. E. Rhodes. 2014. Examining Vulture
Movements and Behaviors with GSM/GPS Transmitters. Microwave Telemetry, Inc.,
Newsletter p 5.
Buckley, N. J. 1996. Food Finding and the Influence of Information, Local Enhancement, and
Communal Roosting on Foraging Success of North American Vultures. The Auk
113:473-488.
Buckley, N. J. 1998. Interspecific Competition Between Vultures for Preferred Roost Positions.
The Wilson Bulletin 110:122-125.
Buckley, N. J. 1999. Black Vulture (Coragyps atratus). Account 411 in A. Poole (editor). The
Birds of North America Online. Cornell Lab of Ornithology, Ithaca, New York.
<http://bna.birds.cornell.edu.proxy-remote.galib.uga.edu/bna/species/411>.
Byrne, M. E., A. E. Holland, A. L. Bryan, T. L. DeVault, O. E. Rhodes, and J. C. Beasley (in
prep) Efficacy of Solar-Powered Groupe Spécial Mobile/ Global Positioning System
(GSM/GPS) Transmitters in a Range of Weather Conditions.
Cogan, C. B., J. D’Elia, K. Convery, J. Brandt, and T. Bulgerin. 2012. Analysis of California
Condor (Gymnogyps californianus) Activity Using Satellite Telemetry Data. The Open
Ornithology Journal 5:82-93.
Coleman, J. S., and J. D. Fraser. 1989. Habitat Use and Home Ranges of Black and Turkey
Vultures. Journal of Wildlife Management 53:782-792.\

93
DeVault, T. L., J. C. Beasley, Z. H. Olson, M. Moleón, M. Carrete, A. Margalida, and J. A.
Sánchez-Zapata (in press). Why Do Birds Matter? Birds’ Ecological Functions and
Ecosystem Services, University of Chicago Press, edited by Sekercioglu, Wenny, and
Whelan.
DeVault, T. L., B. D. Reinhart, I. L. Brisbin, Jr., and O. E. Rhodes. Jr. 2004. Home Ranges of
Sympatric Black and Turkey Vultures in South Carolina. Condor 106:706-711.
DeVault, T. L., B. D. Reinhart, I. L. Brisbin, Jr., and O. E. Rhodes. Jr. 2005. Flight Behavior of
Black and Turkey Vultures: Implications for Reducing Bird-Aircraft Collisions. Journal
of Wildlife Management 69:601-608.
DeVault, T. L., J. L. Belant, B. F. Blackwell, and T. W. Seamans. 2011. Interspecific Variation
in Wildlife Hazards to Aircraft: Implications for Airport Wildlife Management. Wildlife
Society Bulletin 35(4):394-402.
Dolbeer, R. A., 2011. Increasing Trend of Damaging Bird Strikes with Aircraft Outside the
Airport Boundary: Implications for Mitigation Measures. Human-Wildlife Interactions
5(2):235-248.
Dolbeer, R. A., S. E. Wright, J. Weller, and M. J. Begier. 2012. Wildlife Strikes to Civil Aircraft
in the United States. Federal Aviation Administration National Wildlife Strike Database
Serial Report Number 18, 89 pp.
Dolbeer, R. A., S. E. Wright, J. R. Weller, and M. J. Begier. 2014. Wildlife Strikes to Civil
Aircraft in the United States 1990-2013. Federal Aviation Administration National
Wildlife Strike Database Serial Report Number 20, 98 pp.
Donázar, J. A., A. Travaini, O. Ceballos, A. Rodriguez, M. Delibes, and F. Hiraldo. 1999.
Effects of Sex-Associated Competitive Asymmetries on Foraging Group Structure and
Despotic Distribution in Andean Condors. Behavioral Ecology and Sociobiology 45:55-
65.
Dudgeon, D. A. H. Arthington, M. O. Gessner, Z.-I. Kawabata, D. J. Knowler, C. Lévêque, R. J.
Naiman, A-H. Prieur-Richard, D. Soto, M. L. J. Stiassny, and C. A Sullivan. 2007.
Freshwater Biodiversity: Important, Threats, Status and Conservation Challenges.
Biological Reviews 81(2):163-182.
Environmental Systems Research Institute (Esri). 2012. ArcGIS Desktop: Release 10.1.
Redlands, California, USA
Environmental Systems Research Institute (Esri). 2014. USA Major Roads ArcGIS Layer
Package. <http://www.arcgis.com>
Evans, B. A., and T. A. Sordahl. 2009. Factors Influencing Perch Selection by Communally
Roosting Turkey Vultures. Field Ornithology 80:364-372.

94
Fischer, J. W., W. D. Walter, and M. L. Avery. 2013. Brownian Bridge Movement Models to
Characterize Birds’ Home Ranges. The Condor 115:298-305.
Florida Department of Environmental Protection (FLEP). 2015. Solid Waste Facilities in Florida
– July 2015. Vector Digital Data. 30 July 2015.
<http://www.dep.state.fl.us/gis/datadir.htm>
Fortin, M.-J., and M. Dale. 2005. Spatial Analysis: A Guide for Ecologists. Cambridge
University Press, New York, USA. 365 pp.
Geological Survey Branch, Environmental Protection Division, Georgia Department of Natural
Resources (GSB-EPD-GADNR). 2000. Historic Location and Inspection Log of Georgia
Landfills, 1973 to 1992: Version 1. Atlanta, Georgia, USA.
Getz, W. M., S. Fortmann-Roe, P. C. Cross, A. J. Lyons, S. J. Ryan, and C. C. Wilmers. 2007.
LoCoH: Nonparametric Kernel Methods for Constructing Home Ranges and Utilization
Distributions. PLoS One 2:1-11.
Hedlin, E. M, C. S. Houston, P. D. McLoughlin, M. J. Bechard, M. J. Stoffel, D. R. Barber, and
K. L. Bildstein. 2013. Winter Ranges of Migratory Turkey Vultures in Venezuela.
Journal of Raptor Research 47:145-152.
Homer, C. G., J., A. Dewitz, L. Yang, S. Jin, P. Danielson, G. Xian, J. Coulston, N. D. Herold, J.
D. Wickham, and K. Megown. 2015. Completion of the 2011 National Land Cover
Database for the Conterminous United States-Representing a Decade of Land Cover
Change Information. Photogrammetric Engineering and Remote Sensing 81(5):345-354.
Houston, D., and J. Cooper. 1975. The Digestive Tract of the Whiteback Griffon Vulture and its
Role in Disease Transmission Among Wild Ungulates. Journal of Wildlife Diseases
11:306–313.
Houston, C. S., P. D. McLoughlin, J. T. Mandel, M. J. Bechard, M. J. Stoffel, D. R. Barber, and
K. L. Bildstein. 2011. Breeding Home Ranges of Migratory Turkey Vultures Near Their
Northern Limit. The Wilson Journal of Ornithology 123:472-478.
Jackson, J. A. 1983. Nesting Phenology, Nest Site Selection, and Reproduction Success of Black
and Turkey Vultures. In S. R. Wilbur and J. A. Jackson (editors). Vulture Biology and
Management. University of California Press, Los Angeles, USA, pp 245-270.
Johnson, D. H. 1980. The Comparison of Usage and Availability Measurements for Evaluating
Resource Preference. Ecology 61:65-71.
Kelly, N. E., D. W. Sparks, T. L. DeVault, and O. E. Rhodes, Jr. 2007. Diet of Black and Turkey
Vultures in a Forested Landscape. The Wilson Journal of Ornithology 119:267-270.
Kesler, D. C., and S. M. Haig. 2007. Multiscale Habitat Use and Selection in Cooperatively
Breeding Micronesian Kingfishers. Journal of Wildlife Management 71:765-772.

95
Kirk, D. A., and J. E. P. Currall. 1994. Habitat Associations of Migrant and Resident Vultures in
Central Venezuela. Journal of Avian Biology 25:327-337.
Kirk, D. A., and D. C. Houston. 1995. Social Dominance in Migrant and Resident Turkey
Vultures at Carcasses: Evidence for a Despotic Distribution? Behavioral Ecology and
Sociobiology 36:323-332.
Kirk, D. A., and M. J. Mossman. 1998. Turkey Vulture (Cathartes aura). Account 339 in A.
Poole (editor). The Birds of North America Online. Cornell Lab of Ornithology, Ithaca,
New York. <http://bna.birds.cornell.edu.proxy-remote.galib.uga.edu/bna/species/339>
Kranstauber, B., R. Kays, S. D. LaPoint, M. Wikelski, and K. Safi. 2012. A Dynamic Brownian
Bridge Movement Model to Estimate Utilization Distributions for Heterogeneous Animal
Movement. Journal of Animal Ecology 81:738-746.
Kranstauber, B., and M. Smolla. 2014. move: Visualizing and Analyzing Animal Tracking Data.
R Package Version 1.2.475. <http://CRAN.R-project.org/package=move>
Lisney, T. J., K. Stecyk, J. Kolominsky, G. R. Graves, D. R. Wylie, and A. N. Iwaniuk. 2013.
Comparison of Eye Morphology and Retinal Topography in Two Species of New World
Vultures (Aves: Cathartidae). The Anatomical Record 296:1954-1970.
López-López, P., J. Benavent-Corai, C. Garcia-Ripolles, and V. Urios. 2013. Scavengers on the
Move: Behavioural Changes in Foraging Search Patterns during the Annual Cycle.
PLOS-One 8:1-9.
Loss, S. R., T. Will, and P. P. Marra. 2012. Direct Human-Caused Mortality of Birds: Improving
Quantification of Magnitude and Assessment of Population Impact. Frontiers in Ecology
and the Environment 10:357-364.
Mandel, J. T., and K. L. Bildstein. 2007. Turkey Vultures Use Anthropogenic Thermals to
Extend Their Daily Activity Period. The Wilson Journal of Ornithology 19:102-105.
Mandel, J. T., K. L. Bildstein, G. Bohrer, and D. W. Winkler. 2008. Movement Ecology of
Migration in Turkey Vultures. Proceedings of the National Academy of Sciences of the
United States 105:19102-19107.
Markandya, A., T. Taylor, A. Longo, M. N. Murty, S. Murty, and K. Dhavala. 2008. Counting
the Cost of Vulture Decline: An Appraisal of the Human Health and Other Benefits of
Vultures in India. Ecological Economics 67:194–204.
Marra, P. P., C. J. Dove, R. Dolbeer, N. F. Dahlan, M. Heacker, J. F. Whatton, N. E. Diggs, C.
France, and G. A. Henkes. 2009. Migratory Canada Geese Cause Crash of US Airways
Flight 1549. Frontiers in Ecology and the Environment 7:297-301.
Martin, J. A., J. L. Belant, T. L. DeVault, B. F. Blackwell, L. W. Burger Jr., S. K. Riffell, and G.
Wang. 2011. Wildlife Risk to Aviation: A Multi-Scale Issue Requires a Multi-Scale
Solution. Human-Wildlife Interactions 5:198-203.

96
Microwave Telemetry, Inc. 2013. Solar GSM/GOS Transmitters.
<http://www.microwavetelemetry.com/bird/GSM.cfm> Accessed 29 Oct 2013.
Millspaugh, J. J., R. M. Nielson, L. McDonald, J. M. Marzluff, R. A Gitzen, C. D. Rittenhouse,
M. W. Hubbard, and S. L. Sheriff. 2010. Analysis of Resource Selection Using
Utilization Distributions. Journal of Wildlife Management 70(2):384-395.
Moreno-Opo, R., A. Margalida, F. Garcia, A. Arrendondo, C. Rodriguez, and L. M. Gonzalez.
2012. Linking Sanitary and Ecological Requirements in the Management of Avian
Scavengers: Effectiveness of Fencing Against Mammals in Supplementary Feeding Sites.
Biodiversity Conservation 21:1673-1685.
North Carolina Division of Environmental Quality Division of Waste Management (NCDENR
DWM). 2014. Active Permitted Landfills. Vector Digital Data.
<http://portal.ncdenr.org/c/document_library/get_file?p_l_id=116721&folderId=364024
&name=DLFE-28209.xml>
Novaes, W. G., and R. Cintra. 2013. Factors Influencing the Selection of Communal Roost Sites
by the Black Vulture Coragyps atratus (Aves: Cathartidae) in an Urban Area in Central
Amazon. Zoologia 30(6):607-614.
Ogada, D. L., F. Keesing, and M. Z. Virani. 2012a. Dropping Dead: Causes and Consequences
of Vulture Population Declines Worldwide. Annals of the New York Academy of
Sciences 1249:57-71.
Ogada, D. L., M. E. Torchin, M. F. Kinnaird, and V. O. Ezenwa. 2012b. Effects of Vulture
Declines on Facultative Scavengers and Implications for Mammalian Disease
Transmission. Conservation Biology 23:453-460.
R Core Team. 2014. R: A language and environment for statistical computing. R Foundation for
Statistical Computing, Vienna, Austria.<http://www.R-project.org/.>
Ramenofsky, M., J. M. Cornelius, and B. Helm. 2012. Physiological and Behavioral Responses
of Migrants to Environmental Cues. Journal of Ornithology 153:181-191.
Roen, K. T. and R. H. Yahner. 2005. Behavioral Responses of Avian Scavengers in Different
Habitats. Northeastern Naturalist 12(1):103-112.
Rolando, A. 2002. On the Ecology of Home Range in Birds [ABSTRACT]. Revue d’ Ecologie la
Terre et la vie 57:53-73.
Sauer, J. R., J. E. Hines, J. E. Fallon, K. L. Pardieck, D. J. Ziolkowski, Jr., and W. A. Link. 2012.
North American Breeding Bird Survey, Results and Analysis 1966 - 2011. Version
07.03.2013. USGS Patuxent Wildlife Research Center, Laurel, MD.
Sebastián-González, E., J. A. Sánchez-Zapata, J. A. Donázar, N. Selva,
A. Cortés-Avizanda, F. Hiraldo, M. Blázquez, F. Botella & M. Moleón. 2013. Interactive

97
Effects of Obligate Scavengers and Scavenger Community Richness on Lagomorph
Carcass Consumption Patterns. IBIS 255:881-885.
Sekercioglu, C. H., G. C. Daily, and P. R. Ehrlich. 2004. Ecosystem Consequences of Bird
Declines. Proceedings of the National Academy of Sciences of the United States of
America 101:18042-18047.
Sekercioglu, C. H. 2006. Increasing Awareness of Avian Ecological Function. Trends in Ecology
& Evolution 21:464-471.
South Carolina Department of Health and Environmental Control (SCDHEC-BLWM). 2006.
swaste (solid waste landfills). Vector Digital Data.
<www.scdhec.gov/HomeAndEnvironment/maps/GIS/GISDataClearinghouse>
Thompson, W. L. R. H. Yahner, and G. L. Storm. 1990. Winter Use and Habitat Characteristics
of Vulture Communal Roosts. The Journal of Wildlife Management 54(1):77-83.
Tracey, J. A., J. Zhu, E. Boydston, L. Lyren, R. N. Fisher, and K. R. Crooks. 2013. Mapping
Behavioral Landscapes for Animal Movement: A Finite Mixture Modeling Approach.
Ecological Applications 23:654-669.
U.S. Environmental Protection Agency (USEPA). 2013. Level III Ecoregions of the Continental
United States. Corvallis, Oregon, U.S. EPA. National Health and Environmental Effects
Research Laboratory, map scale 1:7,500,000,
<http://www.epa.gov/wed/pages/ecoregion>.
Van Winkle, W. 1975. Comparison of Several Probabilistic Home Range Models. Journal of
Wildlife Management 39(1):118-123.
Wallace, M. P., and S. A. Temple. 1987. Competitive Interactions Within and Between Species
in a Guild of Avian Scavengers. The Auk 104:290-295.
Walter, W. D., J. W. Fischer, J. S. Humphrey, T. S. Daughtery, M. P. Milleson, E. A. Tillman,
and M. L. Avery. 2012. Using Three-dimensional Flight Patterns at Airfields to Identify
Hotspots for Avian-Aircraft Collisions. Applied Geography 35:53-59.
Walters, J. R., S. R. Derrickson, D. M. Fry, S. M. Haig, J. M. Marzluff, and J. M. Wunderle, Jr.
2010. Status of the California Condor (Gymnogyps californianus) and Efforts to Achieve
Its Recovery. The Auk 127:969-1001.
WCS (Wildlife Control Supplies, LLC). 2008. A Safer Way to Capture Wildlife.
<http://wcsnetblaster.com/> Accessed 29 Oct 2013.
Webb, W. C., J. M. Marzluff, and J. Hepinstall-Cymerman. 2012. Differences in Space Use by
Common Ravens in Relation to Sex, Breeding Status, and Kinship. The Condor 113:584-
594.

98
White, D. L., and K. E. Gaines. 2000. The Savannah River Site: Site Description, Land Use and
Management History. Studies in Avian Biology 21:8-17.
Worton, B. J. 1989. Kernel Methods for Estimating the Utilization Distribution in Home-Range
Studies. Ecology 70:164-168.
Worton, B. J. 1995. Using Monte Carlo Simulation to Evaluate Kernel-Based Home Range
Estimators. Journal of Wildlife Management 59:794–800.

99
CHAPTER 4. CONCLUSION
In the interest of filling important gaps in our understandings of vulture ecology, the
objective of my master’s research was to quantify space use, activity patterns, and resource
selection of sympatric black (Coragyps atratus) and turkey (Cathartes aura) vultures with
greater resolution than previous studies conducted on these species. Recent advancements in
tracking device technologies allow the collection of fine-scale spatial data, which provide
information that has been unattainable in many previous studies of vulture spatial ecology. In my
research, I utilized GPS data collected using solar-powered GSM/GPS transmitters affixed to
black and turkey vultures to monitor fine-scale vulture movements and to assess potential
differences in resource utilization among individuals, species, sexes, and seasons.
In Chapter 2, I conducted the first assessment of monthly home range and core area sizes
with consideration to sex for black and turkey vultures. I elucidated differences in monthly,
seasonal, and annual activity patterns based on analyses of fine-scale movement data. I
conducted these assessments based on 321 monthly 95% home ranges and 50% core areas
derived from >2.8 million fixes collected from 9 black and 8 turkey vultures using the dynamic
Brownian Bridge Movement Model (dBBMM). Using these data, I compared monthly home
range and core area sizes by species and sex and found turkey vulture home ranges to be about
two times larger than those of black vultures but only over a portion of the year. I also did not
find any differences in core area sizes throughout the year, and home range sizes were
comparable over months in the breeding season. I found no difference between home range and
core area sizes of male and female black vultures; however, core areas of females were notably

100
larger than those of males during March to May within the breeding season. I also compared
monthly, seasonal, and annual proportions of flight, stationary, and switch states (transitions
between flight and stationary) by species and found turkey vultures to have significantly higher
activity rates than black vultures across all temporal scales, demonstrated by greater proportions
of time spent in flight as well as higher switch states.
In Chapter 3, I assessed habitat characteristics of evening roosts, roost reuse and site
fidelity, as well as aspects of monthly resource selection within home ranges based on utilization
distributions (UDs) developed using the dBBMM. Evening roost locations were extracted from
GPS location data from transmittered birds and I quantified proportions of habitats associated
with roost sites and compared proportional use of roost habitats among species, sexes and
seasons (breeding, summer and winter). Habitat variables included proximity to roads (distances
of 0-500m), proximity to landfills (distance classes of 0-500m, and 500-1,000m), wetland, forest,
developed, developed/open, undeveloped/open habitats types. I found turkey vulture evening
roosts comprised a significantly greater proportion of forest habitat, whereas black vulture
evening roosts comprised a greater proportion of developed/urban habitat. For both species, use
of roost sites near wetlands was highest in winter and lowest in breeding seasons. I compared
seasonal roost reuse frequency and site fidelity between species and found turkey vultures to
have lower roost reuse frequencies than black vultures. Roost site fidelity was substantially
higher in black vultures, although not significantly.
I also measured resource selection by black and turkey vultures by calculating ratios of
use derived from UDs relative to the portion of available habitat within 100% home ranges. I
developed a suite of a-priori resource selection models for each habitat type using linear mixed-
effects models and ranked models using Akaike’s Information Criterion. From these analyses I

101
found month and species to be strong factors influencing selection for most habitats within the
home range. I also found selection for wetland habitats to be strongest across all months for both
species. Selection for habitat types within distances of 0-500m from roads and distances of 0-
500m and 500-1,000m from landfills was limited and lowest during the winter months for both
species. Selection of most habitats also fluctuated by month for both species. Selection for forest
habitat was greatest in turkey vultures throughout all months except the end of summer.
Similarly, I found black vulture selection of developed/open habitats to be significantly higher in
the summer months.
The array of conclusions drawn from my master’s research contributes new information
to our understandings of the patterns and mechanisms underlying differences in space use,
movement patterns and resource selection by sympatric black and turkey vultures. Specifically,
spatio-temporal variations in the spatial ecology of black and turkey vultures are apparent when
examining the movement behavior of these species at fine spatial and temporal scales. My data
also revealed that space use by black and turkey vultures varies over the course of an annual
cycle, which is a pattern previously undetected at coarser temporal scales. Differences in
resource selection also emerged at finer spatial and temporal scales and provide evidence for
habitat segregation and niche differentiation by these species, for which competition exists in
areas of sympatry. These data build upon our understanding of vulture spatial ecology and
provide insights into underlying behavioral mechanisms facilitating niche differentiation
between species, which ultimately should provide critical insights into the conservation and
management of this important group of birds.