spatial heterogeneity in the structure of planktonic food web
TRANSCRIPT

MARINE ECOLOGY PROGRESS SERIES Mar Ecol Prog Ser
Published July 9 l
Spatial heterogeneity in the structure of the planktonic food web in the North Sea
Katherine R i c h a r d s o n l , * , Torkel Gissel ~ i e l s e n ~ , Flemming Bo pedersen3, Jens Peter ~e i lmann ' , Bo L0kkegaard4, Hanne ~ a a s ~
'Danish Institute for Fisheries Research, Department of Marine and Coastal Ecology, Kavalergarden 6, DK-2920 Charlottenlund, Denmark
'National Environmental Research Institute. Department of Marine Ecology and Microbiology. Frederiksborgvej 399. PO Box 358, DK-4000 Roskilde. Denmark
3 ~ S V ~ . The Technical University of Denmark, Building 115, DK-2800 Lyngby, Denmark
'DIS, Vestergade 7. DK-1456 Copenhagen K, Denmark
ABSTRACT: The distributions of bacteria, phytoplankton, protozooplankton and copepod biomass and activity were examined in relation to hydrographic characteristics of the water column on 2 cruises in the North Sea (August 1991 and May 1992). On both cruises, the greatest phytoplankton biomass con- centrations were associated with subsurface chlorophyll peaks. The 480:665 nm absorption ratio sug- gested that phytoplankton located in surface waters were nutrient depleted and the ratio of phyto- plankton carbon to bacterial carbon was generally low, suggesting that bacteria played an important ro!e ir! n u t ~ e n t turnever !n snrfzce x!ate:s a! these tLTes !a t h e subsu:facc ck!~:sphy!! pc;ks, :he pattern was variable with respect to the apparent nutrient status of the phytoplankton and the phyto- plankton to bacteria carbon ratios On the basis of oceanographic features, we identified sites where we predicted the formation of subsurface chlorophyll peaks. At these sites, the phytoplankton to bacteria carbon ratios in the subsurface peak were generally hlgh and the 480:665 nm absorption ratio sug- gested that the phytoplankton were not nutrient limited. Also at these sites, the greatest absolute values of copepod production as well as the greatest percentage of total water column primary pro- duction being channelled into copepods were recorded. The regions where subsurface phytoplankton peaks were predicted to form were, thus, characterised by a 'classical' food web in which energy is efficiently transferred into larger zooplankters. We argue that heterogeneity in the nutrient status of phytoplankton in the subsurface peak can be important in controlling the type ('classical' or 'regener- ated') of planktonic food web found in the water column as a whole.
K E Y WORDS: Phytoplankton Zooplankton . Food web Vertical and honzontal heterogeneity
INTRODUCTION
Phytoplankton are well known to be patchily distrib- uted both In the horizontal and vertical planes in strat- ified marine waters. With respect to the horizontal, numerous studies have, since the mid-1970s, been devoted to describing the distribution of phytoplank- ton in relation to hydrographic fronts in temperate shelf seas (e.g. Holligan et al. 1984, Fogg et al. 1985,
'Present address: Dept Marine Ecology, Aarhus University, Flnlandsgade 14, DK-8200 Aarhus N, Denmark. E-mail: richardson@biology aau.dk
Loder & Platt 1985, Le Fevre 1986, Richardson et al. 1986, Prieur & Legendre 1988, Legendre & Le Fevre 1989). It has often been demonstrated that the occur- rence of phytoplankton patches in frontal zones can influence the planktonic food web such that it, in the vicinity of the front, differs from that on elther side of the frontal feature (e.g. Kiarboe & Johansen 1986, Kiarboe et al. 1988, Griffith et al. 1990, Munk & Nielsen 1994).
Such observations have led to the suggestion (e.g. Cushing 1989, Ki~rboe 1993) that the 'classical' food chain (characterized by large phytoplankton cells and a dominance of large zooplankton 'copepods')
0 Inter-Research 1998 Resale of full article not permjtted

198 Mar Ecol Prog Ser 1
may dominate and that the production occurring in frontal waters may often have a higher f-ratio (i.e. per- centage of new production relative to regenerated pro- duction sensu Dugdale & Goering 1967) than in sur- rounding waters. If this is so, then these frontal reglons may be particularly important in the transfer of energy to higher levels in the food web. There is circumstan- tial support for this hypothesis in the observation that fish larvae are often found to be concentrated in frontal regions (e.g. Munk et al. 1986, Ki~rboe et al. 1988, Munk et al. 1995, and review by Heath 1992). Few studies have, however, actually examined the mecha- nisms that may give rise to heterogeneity in food web structure near frontal regions.
Vertical heterogeneity in phytoplankton distribu- tions has also long been known to occur, and sub- surface chlorophyll peaks are a common feature In stratified temperate marine waters (e.g. Petersson 1934, Holligan & Harbour 1977, Vandevelde et al. 1987, Riegman et al. 1990). However, it is only relatively recently that it has been demonstrated that these peaks are often comprised of actively photosynthesiz- ing phytoplankton (e.g. Richardson 1985, Richardson &
Chnstoffersen 1991, Bj~lrnsen et al. 1993, Nielsen et al. 1993, Heilmann et al. 1994, Karlson et al. 1996). Photo- synthesis occurring in these subsurface peaks can make a significant contribution to the total annual pri- mary production occurring in a given region (Richard- son & Christoffersen 1991). In addition, several studies have demonstrated changes in the composition of and/or production in other components of the plank- tonic food web in association with subsurface phyto- plankton peaks (e.g. Holligan et al. 1984, Nielsen et al. 1990, 1993, Munk & Nielsen 1994). Thus, it seems clear that there is also the potential for vertical hetero- geneity in the distribution and activity of plankton to significantly affect the overall production patterns in a given region.
The purpose of this study was to examine both hori- zontal and vertical heterogeneity in primary and secondary production in the central North Sea to try and identify the causes of such heterogeneity. The investi- gation has its startmg point in studies over Dogger Bank (Nielsen et al. 1993) in which we identified the presence of a subsurface chlorophyll peak in the pycnocline layer and where we reported evidence which suggested that the structure of the planktonic food web associated with the subsurface chlorophyll peak changed with distance from the northern edge of the Bank.
After Nielsen et al. (1993) was reported, Bo Pedersen (1994) presented a model based partly on the hydro- graphic and chlorophyll data collected during that study and the August cruise data presented here. He argues that a bottom front occurs at the northern edge of the Dogger Bank and that a tidal 'pump' exists in
association with this front that introduces nutrient-rich water into the pycnocline layer in a predictable man- ner associated with the spring-neap tidal cycle. Thus, assumlng adequate light conditions in the pycnocline layer, this model predicts favorable conditions for phytoplankton growth and the creation of subsurface chlorophyll peaks on the stratified side of the front at specific periods in the tidal cycle.
In this study, we return to the Dogger Bank and the stratified waters to its north to (1) test the model (Bo Pedersen 1994) relating the formation of subsurface chlorophyll peaks north of the Dogger Bank to tidal phase (using data from the May 1992 cruise) and (2) examine whether the occurrence of sub-surface chlorophyll peaks can be linked to responses in the heterotrophic compartments of the plankton food web at a given site (using data from both cruises).
Specifically, we are testing the hypothesis that the 'classical' food chain will dominate in regions at or near where subsurface chlorophyll peaks are formed, while the 'microbial' food chain, characterized by pro- tozooplankton grazers and relatively high bactena to phytoplankton ratios, will dominate elsewhere.
MATERIALS AND METHODS
The data presented here were collected on 2 cruises with RV 'Dana' (Danish Food, Agriculture and Fish- eries Ministry). The first cruise was carried out from 29 August to 5 September 1991 and stations near the Dogger Bank were visited. At thls time, the front was at its outermost (spring tide) position. Hydrographic measurements made on this cruise have been reported and discussed in detail by Bo Pedersen (1994). On the second cruise (23 May to l June 1992), the stations on and near the Dogger Bank were revisited. At thls time, the front was at its innermost (neap) position. In addl- tion, a number of transects to the north and northeast of Dogger Bank were studied on this second cruise. The study area and stations visited are shown in Fig. 1 Hydrographic measurements (CTD) were carned out at all stations. Chemical (nutrient) and plankton sam- pling were carried out at selected stations distnbuted along the transects.
Hydrographic and chemical measurements. Hydro- graphic measurements (temperature, salinity) were made using a Neil Brown CTD. Penetration of photo- synthetically active radiation was measured at all day- light stations using a Q Instruments (Copenhagen, Denmark) quanta meter (cosine collector) lowered through the water column and corrected for changes in surface irradiation. Inorganic nutrient analysis was carried out using an automated analyzer according to the methods of Grasshoff (1976).

Richardson et al. Spatial heterogeneity of the planktonic food web
N 8
..-I-&-- ---.-..-..- ,... c l ,ly r0p:aunrull ulcaaul CIIIG~~:~. I l u v ~ CJLCLALE! iIlt2.2-
surements were carried out using a Q Instruments fluorometer (Hundahl & Holck 1980). Fluorescence was converted to chlorophyll distribution in the water column by linear regressions constructed on the basis of discrete chlorophyll samples made at 2 to 3 different depths in the water column at all stations. Spectro- photometric determination of chlorophyll a (chl a) con- centration was made following the Lorenzen method (Strickland & Parsons 1972). Chlorophyll versus fluo- rescence linear regressions were obtained for each individual transect. The number of data points per transect varied between 13 an.d 55. All slopes were statistically significant (p < 0.005) and all r 2 values 20.92.
Sample collection for and measurement of primary production (using an artificial light incubator) were carried out as described in Nielsen et al. 1993. The photosynthetic characteristics alpha and P,,, (photo- synthetic efficiency and maximum photosynthesis) were determined in an artificial light incubator for a sample taken from the surface mixed layer (3 m) and from below the surface mixed layer (i.e. in the sub- surface chlorophyll maximum). The obtained photo- synthetic characteristics (corrected for in situ changes in chlorophyll concentration) were assumed to apply to the entire surface mixed layer and below the surface mixed layer, respectively.
'
l N / Transect l
Fig. 1 Study area showing positions 561 of the 3 transects and the stations visited in May 1992 A shorter version of Transect 1 was visited in August 1991 (end points August 1991. 55"18'N, 3'46'E and 56"8'N, 3"2'E). (X) CTD and primary production measurements; (0) CTD, primary production and bacteria measure- 55- ments; ((3) CTD, primary production, bacteria and zooplankton measure-
ments
*b5 - - - " -- . . ,y,,.: ;:-:.;:,, -',. ,; ,5 +, ,. -,,, ,-.-, . . . .- ..
., -,5,, D - - -- , h .. .so , I, .35 .
, , .: , , h0
, ' '
:' ' ' , p-,-.. -.
! , '
. p : : .p ; ;
Transect 3 ', - . & , , ,
(May, 1992) a bi & + , D o ? ? ,
-
3
N 57 Transect 2 Transect 1
(May, 1992) .' b' ,,. .'' ,,-, . .
,' ,,. , .so - -
- , - . S .V,',,,, ...,S, *,,,,..-- ,- .-' I45~', ,,-,-.' ,. ._'
.*. ' ; ,h0 -,,-
- " ,.,35' X ;
0 ,' ..- X . ' ._I' 9 ,,Y
, ; .R- ' +-- , : . ,P 8:
' : ; . X - - , ' , , : . p
, , 8 , . ,
4 E
T-t-l r . r l t n r ,.-m mr,-=v 7 n ~ n A , , ~ t i n n ..aLL, y.;uLU. I VUuL.LV.. was ca!- culated by applying the obtained photosynthesis characteristics (corrected for changes in chlorophyll throughout the water column) to a light versus depth (meter intervals) and time (hourly intervals) matrix constructed using measured light attenuation coeffi- cients and a model describing average insolation rates over Copenhagen, which is at a latitude similar to that of most of our sampling stations (see Nielsen et al. 1993 for a more detailed description of the method).
'Subsurface chlorophyll' was defined as that found below the surface mixed layer [which was identified by a homogeneous distribution of sigma-t (water density) in surface waters]. The depth of the maximal density gradient in the vertical varied along the different tran- sects over a depth interval of 6 to 8 m. These vertical density gradients were taken to represent the lower boundary of the surface mixed layer along each indi- vidual transect.
At some stations, the density profiles indicated the presence of more than one pycnocline. In such cases, the density profiles were compared to the fluorescence profiles. If no peak in fluorescence was observed at the most shallow pycnocline, then the next density gradi- ent was examined, and so on. An abrupt increase in fluorescence at a density gradient was taken to repre- sent a 'subsurface' chlorophyll layer.

200 Mar Ecol Prog Ser
In cases where there was a distinct subsurface chlorophyll peak and fluorescence decreased to near background levels below the peak, 'subsurface' pri- mary production was only calculated for the peak itself. In cases where elevated chlorophyll fluores- cence was distributed throughout the bottom layer, subsurface primary production was calculated from the density gradient and down to a maximum of 50 m. At stations where the total water column was mixed, the contribution of a 'subsurface' chlorophyll layer to total primary production was taken to be zero.
In addition to chlorophyll determinations at 665 nm on acetone extracted samples, the absorption at 480 nm was also determined. The 480:665 nm absorp- tion ratio was then used as an indicator of the phyto- plankton comn~unity's nutrient status, where ratios approaching and exceeding 2.0 suggest nutrient defi- ciency as described in Heath et al. (1990).
The conversion of chl a to phytoplankton carbon was made assuming a conversion factor for surface waters of 88 g phytoplankton C per g chl a and, for the sub- surface chlorophyll layer. of 47 rj phytoplanktnn C
per g chl a (from Richardson et al. 1986). The differ- ence between the 2 layers reflects an increase in chl a per cell in the low light adapted cells. As phytoplank- ton biomass in the water column was, at most stations, dominated by that found in the subsurface chlorophyll peak, an arbitrary conversion factor of 50 g phyto- plankton C per g chlorophyll a was used when esti- mating water column phytoplankton carbon.
Bacteria and protozooplankton measurements. Sam- ples for the determination of biomass and production of bacteria and protozooplankton were collected at 5 to 7 depths at the stations indicated in Fig. 1. Bacteria were quantified by the acridine orange technique (Hobbie et al. 1977). At least 400 cells were counted on each filter using an Olympus BH2 epifluorescence microscope. The volume was calculated from length and width measurements of at least 50 cells per filter and con- verted to carbon by a conversion factor of 0.35 pg C pm-3 (Bjsrnsen 1986). Bacterial production was mea- sured from incorporation of 3H-thymidine (Fuhrmann & Azam 1980). Triplicate samples (10 ml) were incu- bated with 5 nM methylL3H thymidine (20 ~ C I nmol-', New England Nuclear) for 30 min at in situ tempera- ture (11°C). The biomass and production per m2 were calculated by trapezoidal integration over the depth strata (Nielsen & Bresta 1984).
Blanks were prepared by the addition of formalin prior to the addition of the isotope. The incubations were stopped by the addition of buffered formalin (1 % final concentration) and filtered onto 0.2 pm cellulose nitrate filters. The filters were washed 10 times with 5'.% ice-cold TCA and counted by liquid scintillation counting. The incorporated -'H thymidine was con-
verted to cell production using a conversion factor of 1 1 X 10'* cells mol-' thymidlne incorporated (Riemann et al. 1987).
The ratio of phytoplankton to bacterial carbon was used as an indicator of the relative importance of the 2 components of the food web at discrete depths in the water column. Ideally, in order to examine the relative importance of bacteria relative to phytoplankton, one should compare activity (production) of these 2 plank- ton groups. However, the fact that the subsurface chlorophyll maxima were found at different depths means that the light climate for these peaks differs. As the light climate is the major controlling factor for phytoplankton, considerable variability is noted in the phytoplankton production recorded in the subsurface peak (see Figs. 2 to 5).
We choose, therefore, to estimate the relative impor- tance of phytoplankton and bacteria in the nutrient and energy turnover occurring both in surface waters and in the subsurface phytoplankton peaks by compar- ing the biomasses of the 2 groups. A low ratio, where bacterial hinmaff i q large relative to phytop!ankton biomass, is assumed to indicate the potential presence of an active microbial food web.
Protozooplankton (ciliates and heterotrophic dinofla- gellates) samples (300 ml) were fixed in l % Lugol's sol.ution (final concentration) and counted after sedi- mentation (24 h) using a Leitz inverted microscope. Identifications of ciliates to species or morphological types were based on Lynn & Montagnes (1988). The thecate dinoflagellates were identified using Dodge (1985), while the athecate heterotrophic dinoflagel- lates were divided into size classes. Biovolumes were estimated from measurements of linear dimensions and assuming simple geometrical shapes. The bio- volumes were converted to carbon using conversion factors of 0.11 pg C pm-3 for ciliates and athecate dino- flagellates and 0.13 pg C ~ m - ~ for thecate dinoflagel- lates (Edler 1979). The carbon demand and production of the protozooplankton were estimated by assuming a clearance rate of 105 body volumes h-' and a growth yield of 33 % (Hansen et al. 1997).
Copepod biomass and production. Mesozooplank- ton were sampIed using a submersible pump (3000 l min-7 equipped with a 5 m conical net (mesh size 30 pm). During sampling, the pump was raised through the water colun~n at 10 m min-l. The samples were fixed in buffered formalin ( 2 % final concentra- tion). The sorting criteria used in later sample analysis are described in detail in Nielsen & Sabatini (1996).
Egg production rates of the calanoid copepods were determined by incubation of fertilized females accord- ing to Kisrboe et al. (1985). The egg production rates of the egg carrying cyclopoid copepod Oithona spp. were calculated from the egg to female ratio in the biomass
Richardson et al.: Spat~dl heterc )geneity of the planktonic food w e b 201
samples and the temperature dependent hdtch~ng rate (Nielsen & Sabatiiii 1996) Data on the egg production and species composition of the copepod community are reported In detail elsewhere [ l991 data in Munk & Nielsen (1994) 1992 data in Nielsen & Sabatini (1996)] but used here The calculation of grazlng Impact ivas made from the specific egg production rate and the depth integrated biomass, assuming equal specific egg production and juvenile growth rate (Bergreen et a1 1988) For those species where no production estimates were available the aveiage specific egg pioduction (excluding Oithona spp ) was applied The carbon demand of the copepod community (1 e ~ngestion) was estimated from the production rate assuming a gross efficiency of 33% (l e ingestion = 3 X production) (Hansen et a1 1997)
The copepod to protozooplankton biomass ratio in the water column is used here as an indicator of the relative importance of large relative to small zooplank- teis in the grazing activity taking place In the water column When the ratio is high and large zooplankters ( l e copepods) dominate the zooplankton community, the food web is assumed to be of a 'classical' type (sensu Cushing 1989)
RESULTS
The meteorological conditions (warm and calm) be- fore and during our May 1992 cruise favoured the development of a very shallow pycnocline (Flgs 2a, 3a & 4a) In addition, a layer of warm Ivatel was observed over the entire Dogger Bank transect at this time Thus evidence of the characteristic frontal water masses along the transect was not visible In surface measurements The Dogger Bank transect examined on 29 to 30 August 1991 was studled much later in the h e a t ~ n g peiiod (Fig 5a) As a result, the pycnocllne IS
located much deeper In the water column and the theriiiocllne layer (8 to 16°C) was thicker A patch of colder water in the bottom xvatels south of the Dogger Bank ind~cates cross-transect water flow (Fig 2a)
The low values of salinity recorded along the east- ernmost transect examined in May 1992 clearly reflect the influence of the Jutland Coastal Current here ( l e region of freshwater influence) (Fig 4b) The frontal structure in the salinity (observed In the region of Stns l l 1 to 140) suggests a baroclinic circulation here driven by the density differences arlslng froin the meeting of waters ot different salinlties
The distributions of nltrate and chloiophyll, the ratio of 480 665 nm absorption, bacterial biomass and prl- mary and bacterial production for each of the transects carried out on the 2 cruises are shown in Figs 2 to 5 Only in the deep bottom waters north of the Dogger
Bank and in the waters influenced by riverine inflow to the eastern North Sea were nitrate concentrations measurable.
A dominant feature on both cruises was the occur- rence of subsurface chlorophyll peaks comprised of actively photosynthesizing phytoplankters. The great- est chlorophyll concentrations encountered on both crulses were recorded in subsurface peaks. Taking the study region as a whole, the chlorophyll concentrations recorded in the subsurface peak were often more than 4 times those observed at the surface, and concentra- tions of up to over 10 pg 1-' were observed in 1992.
Average estimated water column primary produc- tion (for all stations visited) was 414 mg C m-2 d-l (SD = 414, n = 7) in August 1991 and 326 mg C m-2 d-" (SD = 180, n = 44) in May 1992. The average integrated water column chlorophyll concentration observed in August 1991 was 36 mg m-2 (SD = 23.6, n = 25) as com- pared with 34 mg m-' (SD = 13, ii = 130) in May 1992. The primary production associated with the subsurface peak accounted, at some stations, for up to about 75 % and averaged 36 and 37% of the total primary pro- duction recorded, respectively, on the 1991 and 1992 cruises.
Average light attenuation coefficients (determined ac- cording to the Lambert-Beer Law) for the 4 transects studied are shown in Table 1. These indicate the depth of l ''c S U ~ ~ ~ C P light p e ~ e t r ~ t i e r ! !C he betweer? 30 and 40 m over most of the study area. Using the 1 % light pene- tration level as indicative of the extent of the photic zone, it appears that the subsurface chlorophyll peaks occur at the bottom of the photic zone \vhile the elevated concentrations of nitrate observed in bottom waters north of the Dogger Bank seem to be below the photic zone. South of the Dogger Bank, the bottom depths are close to the predicted depth of the photic zone.
The 480:665 nni absorption ratios for surface and sub- surface waters are shown together with chlorophyll dis- tribution data in Figs. 2b, 3b, 4b & 5b. In surface waters, the values are consistently high (usually over 2.0) indi- cating that the phytoplankton there are probably nutri- ent depleted. At depth, in the subsurface chlorophyll peaks, the ratio was generally, but not always, lower than for surface waters. The range of 480:665 nm ab- sorption ratios recorded in subsurface waters (from 1.2 to 2.7) suggests that the phytoplankton in some sub- surface peaks werc, probably nutrient replete while, in others, they were not (Heath et al. 1990).
Ratio of phytoplankton carbon to bacterial carbon
The phytoplankton carbon:bacterial carbon ratios for the surface waters and in the subsurface chlorophyll peaks are presented along with the hydrographic tran-

202 Mar Ecol Prog Set 168. 197-211, 1998
North South 3 s 3713936 35/22 34 33 32 31 30146 29 28 27 2618 25 24 23
sect data in Figs. 2 to 5. The lowest ratios of phyto- plankton carbon:bacterial carbon were recorded In the surface waters, suggesting an important role for bacte- ria in the turnover of nutrients and energy occurring here. The phytoplankton carbon:bacterial carbon ratios recorded in, the subsurface chlorophyll peaks were much more variable than those recorded at the surface. Maxima in phytoplankton carbon:bacterial carbon were recorded in the subsurface chlorophyll peaks at the
Fig. 2. Transect 1, May 1992 (station num- bers are shown in upper panel): (a) Nitrate concentrations (pm01 I-') superimposed on temperature isotherms ("C) along the tran- sect. (+) Locations of nitrate samplmg Isotherms drawn from temperature data collected with the CTD at every station. (b) Chlorophyll distributions (pg I-') calcu- lated from conversion of fluorescence pro- files generated at each station. Superim- posed on the chlorophyll distributions are the measured 480:665 nm absorption ra- tios (numerical values) (c) Primary pro- duction (mg C m-3 d-'). (+) Stations where primary production was determined. (d) Bacteria biomass (bold numerical val- ues in mg C m-3) and production (italic nu- merical values in mg C m-3 d.'). (e) Phyto- plankton.bacteria carbon ratlo in surface waters and in the subsurface chlorophyll peak. ( f ) Copepod:protozooplankton bio-
mass ratio in the wrater column
northern edge of the Dogger Bank on both Dogger Bank transects. The highest phytoplankton carbon: bacterial carbon ratios encountered were recorded in the subsurface chlorophyll peak encountered on Tran- sect 2 (Stns 84 to 89) in May 1992.
Phytoplankton carbon bacterial carbon ratios along transect 3 (eastern North Sea) were generally low- both in the surface waters and at depth. The highest value encountered was in a subsurface peak at Stn 129.

204 Mar Ecol Prog Ser 168: 197-21 1, 1998
West ,p ,
East $ \%! <> Q> .$ \3Q \S \h\ ,c, \S- \S" \\> \\". ,\\ ,\Q \* ,Q% \a ,c+
+ + + + + + + + + +
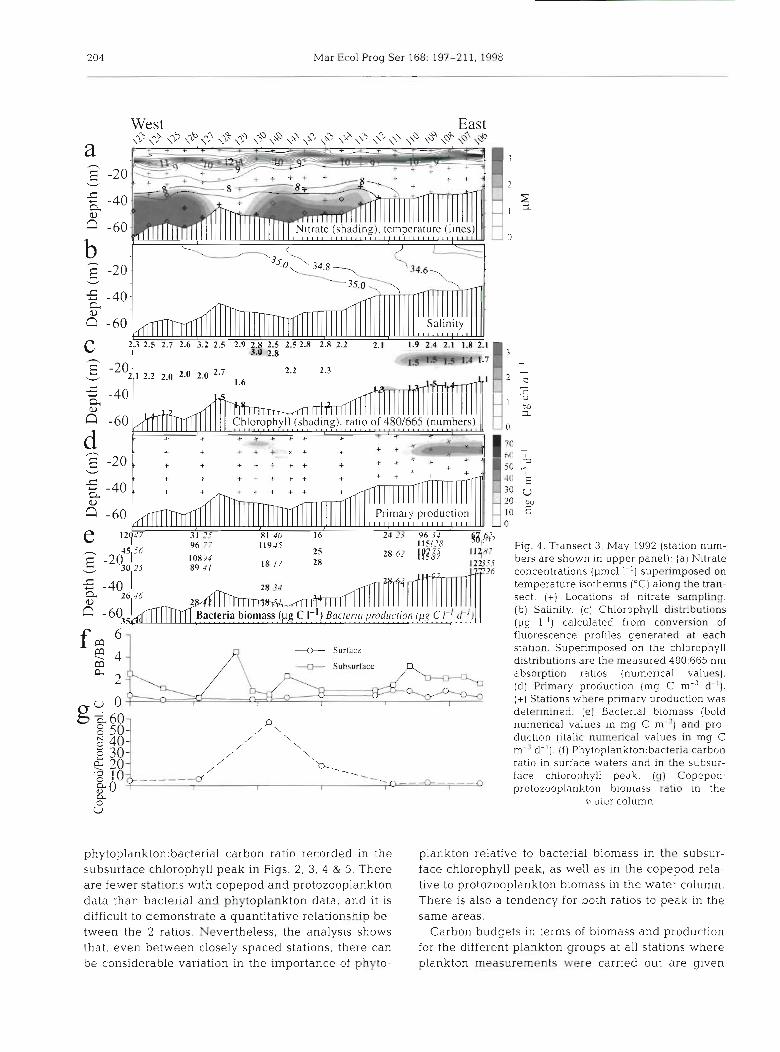
Fig. 4. Trdnsect 3, May 1992 (station num-
1 8 1 7 28 - bers are shown in upper panel). (a) Nitrate 6 concentrations (pm01 I-') superimposed on
temperature isotherms ("C) along the tran- sect. (+) Locations of nitrate sampling. (b) Salinity. (c) Chlorophyll distributions (pg 1-l) calculated from conversion of
t- a b
4 + Surface
2 + Subsurface
2
,U 0
phytop1ankton:bactenal carbon ratio recorded in the subsurface chlorophyll peak in Figs. 2, 3, 4 & 5. There are fewer stations with copepod and protozooplankton data than bacterial and phytoplankton data, and it is difficult to demonstrate a quantitative relationshp be- tween the 2 ratios. Nevertheless, the analysis shows that, even between closely spaced stations, there can be considerable variation in the importance of phyto-
fluorescence profiles generated at each station. Superimposed on the chlorophyll distributions are the measured 480:665 nm absorption ratios (numerical values). (d) Primary production (mg C m-3 d-l).
(+) Stations where primary production was determined. (e) Bacterial biomass (bold numerical values In mg C m-") and pro- duct~on (itallc numerical values in mg C m-%-'). ( f ) Phytop1ankton:bacteria carbon ratio in surface waters and in the subsur- face chlorophyll pedk. (g) Copepod protozooplankton bionldss ratio in the
v tcr column
plankton relative to bacterial biomass in the subsur- face chlorophyll peak, as well as in the copepod rela- tive to protozooplankton biomass in the water column. There is also a tendency for both ratios to peak in the same areas.
Carbon budgets in terms of biomass and production for the different plankton groups at all stations where plankton measurements were carried out are given

Richardson et al.: Spatial heterogene~ty of the planktonic food web 205
in Tables 2 to 5. When comparing the absolute magni- tude of the copepod ingestion and the percentage of phytoplankton production ingested by copepods at the different stations, several interesting features emerge:
(1) The absolute magnitude of copepod production (and, hence, ingestion) along the Dogger Bank transect is very similar on both the August and May cruises.
(2) In the central North Sea (i.e. north of the Dogger Bank and away from the waters influenced by the Jutland Coastal Current, see Tables 2 to 4 ) copepod ingestion often appears to exceed primary production during the May cruise. As these copepods are ob- served to lay eggs, it is assumed they are actively feeding. These observations suggest that the copepods may be exploiting an energy source in addition to
Fig. 5. Transect 1, August 1991 (sta- tion numbers are shown in upper panel): (a) Nitrate concentrat~ons (1.1mol I-') superimposed on temper- ature isotherms ("C) along the tran- sect. (+) Locations of sampling. (b) Chlorophyll distributions (pg I-') calculated from conversion of fluo- rescence profiles generated at each station. Superimposed on the chloro- phyll dlstlibutions are the measured 480:665 nm absorption ratios (nu- merical values). (c) Primary pro- duction (mg C m-3 d-'). (+) Stations where primary production was de- termined. (d) Bacterial biomass (bold numerical values in mg C m-". (e) Phytop1ankton:bacteria carbon ratio in surface waters and in the subsurface chlorophyll peak. ( f ) Copeod:protozooplankton biomass
ratio in the water column
North + South ?? 4' ? > . ? ~ , \ \ ~ \ ~ \ ? b \ ~ \ ~ \ ~ \QC, i .S
U Suriace
+ Subburfilce
5 : 0
16

206 Mar Ecol Prog Ser 168: 197-211. 1998
Table l . Mean attenuation coefficients ( k ) and mean water Table 3. Distribution of biomass, production and ingestion of column depth (m) at which 1 YO of the surface photosynthetic selected auto- and heterotrophs across Transect 2 (the central active radiation (SPAR) is left. SD is the standard deviation North Sea, May 27 to 28, 1992). Positions of the transect and
and n the number of observations stations shown in Figs. 1 & 3, respectively
Mean k SD Mean depth SD n at 1 % SPAR
Transectl.Aug1991 0.15 0.04 32 8 5 Transect 2. May 1992 0.13 0 03 36 6 8 Transect 3, May 1992 0.12 0 03 39 9 4 Transect l , May 1992 0.18 0.07 26 10 7
phytoplankton or that primary production may be underestimated. Examination of the carbon budgets presented indicates that the calculated ingestion re- quirements of the copepods on most stations can be met by combining the primary and protozooplankton production. Thus, we suggest that copepods are graz- ing on both phyto- and protozooplankton. At only 1 station (81) does the combined phytoplankton and pro- tozooplankton production not meet the calculated copepod grazing demand. At this station, there was an exceptionally dense patch of Calanus spp. recorded (see Table 3).
(3) At the most coastal stations (i.e. on and south of the Dogger Bank and at the easternmost stations of Transect 3: May 1992) the absolute magnitude of copepod inges- tion as well as the % of primary production being in- gested by copepods is generally much lower than the values recorded in the offshore waters north of the Dog- ger Bank. This is probably a function of the distribution
Stn: 76 90 87 82 Bottom depth (m): 42 55 57 60
Biomass (my C m-') Phytoplankton 1440 2060 2115 1865 Bacteria 1166 2640 2278 2583 Heterotrophic ciliates 253 476 940 399 Heterotrophic dinoflagellates 184 131 241 110 Protozoans 709 607 1181 509 Copepods 1045 1622 4844 503
Production (mg C d-l) Phytoplankton 245 574 235 244 Bacteria 822 1429 1414 1360 Protozooplankton 161 150 289 104 Copepods 27 247 586 53
Ingestion (mg C d-') Protozooplankton 486 455 876 316 Copepods 80 740 1758 159 % primary production copepods 33 129 748 65
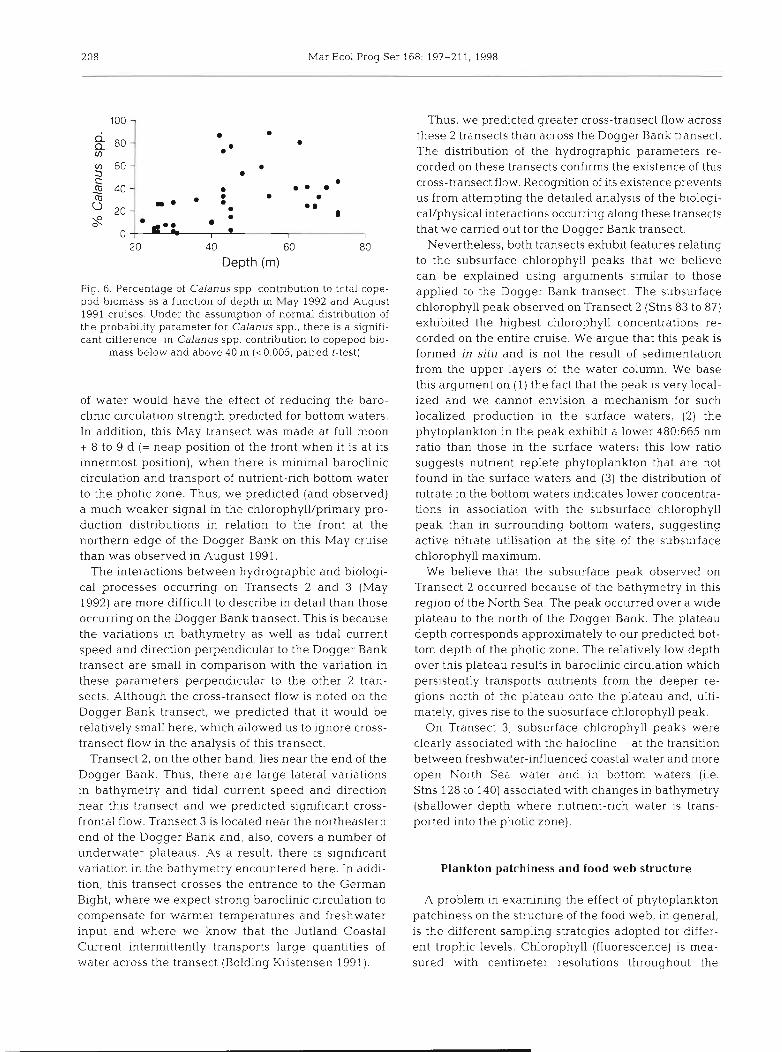
of Calanusspp. as these large copepods comprise only a small component of the total zooplankton biomass at stations less than about 40 m in depth (Fig. 6).
(4) On all 3 of the May 1992 transects, the greatest values of copepod production and ingestion were recorded at the plankton sampling stations that were located in or closest to the subsurface chlorophyll peaks occurring below 40 m in the water column (i.e. Stn 22 on Transect 1, Stn 87 on Transect 2, and Stn 140 on Transect 3).
Table 2. Distribution of biomass, production and ingestion of selected auto- and heterotrophs across Transect 1 (Dogger Bank, May 23 to 26, 1992). % pnmary production + copepods indicates of primary production ingested by cope-
pods. Positions of the transect and stations shown ID Figs. 1 & 2, respectively
Stn: 8 46 33 22 38 Bottom depth (m): 50 30 47 55 70
Biomass (mg C m-Z) Phytoplankton 1200 735 1295 1700 l700 Bacteria 1351 1236 935 1.990 4861 Heterotrophic ciliates 587 123 1168 3505 Heterotrophic dinoflagellates 97 84 63 124 Protozoans 684 207 1231 3629 Copepods 570 330 670 2300 1000
Production (mg C m-2 d-') Phytoplankton 280 385 412 348 176 Bacteria 581 270 562 995 2097 Protozooplankton 11 1 38 251 582 Copepods 10 18 97 8
Ingestion (mg C m-2 d-l) Protozooplankton 335 114 761 1763 Copepods 31 54 291 24 %, primary production a copepods 8 13 84 14
DISCUSSION
Plankton patchiness in relation to hydrography
The density distributions recorded in August 1991 are typical of those predicted for shallow (sensu Pingree et al. 1978) bottom (sensu Bo Pedersen 1994) fronts where greatest density (temperature) gradients and, hence, the strongest baroclinic circulation are observed in the bottom layer Bo Ped- ersen (1994) presented evidence for a tidally driven 'pump' where nutrient- rich bottom water from north of the Dogger Bank IS transported into the (higher light) pycnocline regime in association with the front at the north- ern edge of the Dogger Bank. At the time of the August 1991 visit to the

Richardson et al . . Spatial heterogeneity of the planktonic food web 207
-
Table 4 D~stnbution of b~omass product~on and ingestion of selected auto- and heterotrophs across Transect 3 ( the eastern North Sea, May 30 to J u n e 1. 1992)
Posltlons of the transect and statlons shown in Figs 1 & 4, respectively
Stn 106 109 111 143 140 127 123 Bottom depth (m) 30 32 38 55 60 5 3 62
-
Blomass (mg C m ') Phytoplankton 1770 1995 2000 3000 2535 2710 2435 Bactena 3054 3492 1083 1278 2676 3398 2925 Heterotrophic ciliates 344 174 359 1 3 4 56 64 Heterotrophlc dinoflagellates 63 45 224 38 48 77 183 PI otozoans 407 219 582 52 51 113 247 Copepods 355 375 460 889 2908 710 1070
Production (mg C m ' d-') Phytoplankton 595 664 245 403 152 172 256 Bacteria 5006 2900 2108 1089 1780 2841 2806 Protozooplankton 159 90 202 19 14 45 64 Copepods 29 27 46 56 126 80 80
Ingestion (mg C m L d.') Protozooplankton 480 273 613 56 43 136 194 Copepods 86 81 137 167 377 240 240 " C , pnmaryproduction copepods 14 12 56 41 248 139 94
Table 5. Distribution of biomass, product~on and ingestion of selected auto- and heterotrophs across Transect 1 (Dogger Bank, August 29 to 30, 1991). Positions
of the transect and stations shown in Figs. 1 & 5, respectively
Stn. Bottom depth (m):
Biomass (mg C m-') Phytoplankton Bacteria Heterotrophic ciliates Heterotrophic dinoflagellates Protozoans Copepods
Production (mg C m-' d-') Phytoplankton Bacteria Protozooplankton 18 6 23 56 Copepods 14 7 12 18
Ingest~on [mg C 111 :' d.') Protozooplankton 55 18 71 170 Copepods 41 19 37 53 O/o primary production *copepods 19 9 15 12
Dogger Bank transect, the front was at its spring tide position (i.e. full moon + 5 d) . In other words, the front was at its outermost offshore position. It is at this time that the maximum density gradients during the tidal cycle are observed in bottom water. Thus, it is also at this time that the Bo Pedersen (1994) model predicts maximum transport of nutrient-rich bottom water into the photic zone.
The model predicts ongoing transport of nutrient- rich bottom water into the pycnocline layer starting with the beginning of the retreat of the front. Condi- tions in the pycnocline layer should, then, be con-
ducive to the rapid growth of phyto- plankton. The observed subsurface chlorophyll peak in the pycnocline layer north of the Dogger Bank in August 1991 is consistent with this prediction (Fig. 5). Support for the pre- dicted (l30 Pedersen 1994) baroclinic circulation pattern in bottom waters north of the Dogger Bank can also be found in the shape of the subsur- face concentration profiles of nitrate, chlorophyll and primary production (Fig. 5).
The temperature distributions re- corded south of the Dogger Bank in August 1991 resembled those north of the Bank. However, the distribution of the biological parameters was quite dif- ferent. We believe that this is a result of the bottom depth being shallower to the south than to the north of the Dogger Bank. Light attenuation coefficients measured on this cruise indicated the level of 1 O/o light penetration to be be- tween 27 and 43 m. Phytoplankton in the bottom layer of the water column can be expected to be mixed in this layer Thus, the averaqe light experi- enced by the phytoplankton south of the Dogger Bank will be above 1 O/o sur- face light levels. We believe this ex- plains why no recordable nitrate con- centrations were encountered here. We also predicted the presence of a baro- clinic circulation pattern south of the Dogger Bank whereby bottom waters
1; ;; 1 are transported along the bottom and into the pycnocline layer. However, as this transport does not result in the transfer of nutrient-rich bottom waters
< 1 into the photic zone, its influence on the biology of the region is less marked than north of the Bank.
The situation along the Dogger Bank transect in May 1992 (Fig. 2) was markedly different from that re- corded in August 1991. Firstly, the pycnocline was shallower and the thermocline layer thinner than that observed on the August cruise. These observations agree well with model predictions made by Bo Peder- sen (1994) concerning pycnocline strength and depth based on considerations of seasonal variation in heat input, wind fields and tidal pumping. At the time of the May visit to the Dogger Bank transect, the weather was unusually warm and calm and a layer of warm (low density) water covered the entire area. This layer
208 Mar Ecol Prog Ser 168: 197-211, 1998
20 40 60 80
Depth (m)
Fig 6 Percentage of Calanus spp contnbutlon to total cope- pod biomass as a function of depth in May 1992 and August 1991 cruises Under the assumption of normal dlstrlbution of the probablltty parameter for Calanus spp , there is a signifl- cant difference In Calanus spp contnbutlon to copepod blo-
mass below and above 40 m (<O 005, palred t-test)
of water would have the effect of reducing the baro- clinic circulation strength predicted for bottom waters. In addition, this May transect was made at full moon + 8 to 9 d (= neap position of the front when lt is at its innermost position), when there is minimal baroclinic circulation and transport of nutrient-rich bottom water to the photic zone. Thus, we predicted (and observed) a much weaker signal in the chlorophyll/primary pro- duction distributions in relation to the front at the northern edge of the Dogger Bank on thls May cruise than was observed in August 1991.
The interactions between hydrographic and biologi- cal processes occurring on Transects 2 and 3 (May 1992) are more difficult to describe in detail than those occurring on the Dogger Bank transect. This is because the variations in bathymetry as well as tidal current speed and direction perpendlcular to the Dogger Bank transect are small in comparison with the variation in these parameters perpendlcular to the other 2 tran- sects. Although the cross-transect flow is noted on the Dogger Bank transect, we predicted that it would be relatively small here, whlch allowed us to ignore cross- transect flow in the analysis of this transect.
Transect 2, on the other hand, lies near the end of the Dogger Bank. Thus, there are large lateral variations In bathymetry and tidal current speed and direction near thls transect and we predicted significant cross- frontal flow. Transect 3 is located near the northeastern end of the Dogger Bank and, also, covers a number of underwater plateaus. As a result, there is significant variation in the bathymetry encountered here. In addi- tion, this transect crosses the entrance to the German Bight, where we expect strong baroclinic circulation to compensate for warmer temperatures and freshwater input and where we know that the Jutland Coastal Current intermittently transports large quantities of water across the transect (Bolding Kristensen 1991).
Thus, we predicted greater cross-transect flow across these 2 transects than across the Dogger Bank transect. The distribution of the hydrographic parameters re- corded on these transects confirms the existence of this cross-transect flow. Recognltion of its existence prevents us from attempting the detalled analysis of the biologi- cal/physical interactions occurnng along these transects that we carrled out for the Dogger Bank transect.
Nevertheless, both transects exhibit features relating to the subsurface chlorophyll peaks that we believe can be explained using arguments strnilar to those applied to the Dogger Bank transect. The subsurface chlorophyll peak observed on Transect 2 (Stns 83 to 87) exhibited the highest chlorophyll concentrations re- corded on the entire cruise. We argue that thls peak is formed in situ and is not the result of sedimentation from the upper layers of the water column. We base this argument on (1) the fact that the peak i s very local- ized and we cannot envision a mechanism for such localized production in the surface waters, (2) the phytoplankton in the peak exhibit a lower 480:665 nm ratio than those in the surface waters; this low ratio suggests nutrient replete phytoplankton that are not found in the surface waters and (3) the distribution of nitrate in the bottom waters indicates lower concentra- tions in assoclation with the subsurface chlorophyll peak than in surrounding bottom waters, suggesting active nitrate utilisation at the site of the subsurface chlorophyll maximum.
We believe that the subsurface peak observed on Transect 2 occurred because of the bathymetry in this region of the North Sea. The peak occurred over a wide plateau to the north of the Dogger Bank. The plateau depth corresponds approximately to our predicted bot- tom depth of the photic zone. The relatively low depth over this plateau results in baroclinic circulation which persistently transports nutrients from the deeper re- gions north of the plateau onto the plateau and, ulti- mately, gives rise to the subsurface chlorophyll peak.
On Transect 3, subsurface chlorophyll peaks were clearly associated with the halocline-at the transition between freshwater-influenced coastal water and more open North Sea water and in bottom waters (i.e. Stns 128 to 140) associated with changes in bathymetry (shallower depth where nutnent-rlch water is trans- ported into the photic zone).
Plankton patchiness and food web structure
A problem in examining the effect of phytoplankton patchiness on the structure of the food web, in general, is the different sampling strategies adopted for differ- ent trophic levels. Chlorophyll (fluorescence) is mea- sured with centimeter resolutions throughout the

Richardson et al . . Spatial heterogeneity of the planktonic food web
water column. The detailed picture that emerges is that large differences exist in the distribution and activity of phytoplankton in the water column. Cope- pods, on the other hand, are more difficult to relate to discrete depth layers as they, potentially, exploit the whole water column. Thus, copepod distributions and activities are, most often, recorded on a water column basis rather than at discrete depths in the water col- umn. When relating phytoplankton and zooplankton activity, it is tempting to average the phytoplankton signal throughout the water column in order to make it directly comparable to the zooplankton signal. How- ever, this would entail the loss of considerable detail in the signal and make it difficult to examine the effect of layers, per se, on the food web.
In this study, the highest concentrations (up to over 10 yg 1-') were observed in subsurface chlorophyll peaks and surface chlorophyll concentrations were generally less than 1 pg I-'. We argue, then, that it is the biomass of phytoplankton in the subsurface chloro- phyll peaks that primarily influences the feeding response in the zooplankton and, thus, the water col- umn response registered in the zooplankton. We choose, therefore, to examine characteristics of the zooplankton food web in the entire water column in relation to characteristics of the phytoplankton and bacteria in the subsurface peak.
The arclas identified as those where we predicted the baroclinic transport of nutrients from bottom waters up into the photic zone (i.e. at the northern edge of the Dogger Bank, near Stns 84 to 87 on Transect 2 and in association with a bathymetric anomaly near Stns 128 to 140 on Transect 3 in May 1992) are those where the highest phytop1ankton:bacterial carbon ratios in the subsurface chlorophyll peak are recorded. Also the 480:665 nm absorption ratios here indicate the pres- ence of nutrient replete phytoplankton (Figs. 3 & 4). In addition, the absolute magnitude of the copepod pro- duction and the % of primary production being in- gested by the copepods were greatest in these regions (Tables 3 & 4). Thus, we argue that localized patches in which the 'classical' food web (characterized by the oc- currence of many large zooplankter grazers) domi- nates will develop in the water column in association with the creation of subsurface chlorophyll peaks dur- ing summer months in the North Sea. These sub- surface peaks will be generated by circulation phenomena through which nutrient-rich bottom water is transported into the photic zone.
Support for our argument comes from Munk & Nielsen (1994) who have examined the distribution of fish larvae (i.e. grazers on large zooplankton) on our August 1991 Dogger Bank transect. These authors found the greatest biomass of fish larvae at the north- ern edge of the Dogger Bank [i.e. at the location where
Bo Pedersen (1994) predicts the development of a sub- surface phytoplankton peak and in a region character- ized by high phytop1ankton:bacterial carbon and low 480:665 nm absorption ratios in the subsurface chloro- phyll peak (Fig. 5)).
Importance of heterogeneity in plankton distributions to the study area as a whole
Both of the cruises carried out as part of this study took place during the period of thermal stratification of the central and northern North Sea, and, on both cruises, the greatest concentrations of phytoplankton biomass encountered were at depth in the water col- umn. These subsurface phytoplankton accumulations were comprised of actively photosynthesizing phyto- plankton. Despite the low ambient light conditions associated with these subsurface phytoplankton peaks, we estimate that the primary production associated with them was, on average, 36 to 37% of the total water column productivity at our sampling stations. At some stations, up to about 75% of total water column primary production was recorded in association with the subsurface chlorophyll peak.
We acknowledge that some of these estimates of pho- tosynthetic rates in the subsurface chlorophyll peak may be too hiqh, as both the surface and subsurface water samples were incubated in the same incubator (i.e. at the same temperature). In some cases, this means that the subsurface sample was incubated at up to 6'C higher than the collection temperature. This higher tempera- ture of incubation can be expected to influence photo- synthesis rates. The influence of temperature on phyto- plankton growth rate exhibits a QIo of about 2 (Harris 1986). However, it has been demonstrated that temper- ature effects on photosynthesis are greatest on the max- imum rate of photosynthesis (P,,,,,). Alpha is relatively unaffected by temperature changes (Kirk 1984). As pho- tosynthesis is light limited in these subsurface peaks, we expect the changes in temperature experienced by the phytoplankton from subsurface peaks under incubations to have only a small effect on the rates of photosynthesis estimated here for the subsurface peaks.
Thus, these subsurface phytoplankton peaks are capable of active photosynthesis. Their 480:665 nm ratios suggest that their physiological state is better than that of their surface water counterparts. Finally, the fact that the greatest biomass accumulations are found in the subsurface peaks makes these peaks especially important for grazers and we predict that they are primary sites for transferring of energy from primary to higher trophic levels during the period of thermal stratification in the North Sea (May to October, see Bo Pedersen 19941.
210 Mar Ecol Prog Se
W e believe that t h e coupling b e t w e e n hydrographic a n d biological processes hypothesized by Bo Pedersen (1994) is a plausible explanat ion for t h e creation of these subsurface chlorophyll p e a k s a long bottom fronts i n t h e North Sea . T h e a p p a r e n t mechanism of t h e stimulation of phytoplankton growth a n d accumu- lation a t d e p t h is t h e transport of nutrients from bottom water into t h e photic zone-this transport being caused by barocllnic circulation, pat terns occurring n e a r t h e bottom front.
O u r s tudy suggests that , a t t h e sites of formation of t h e subsurface chlorophyll peaks , a 'classical' food web domina ted by la rge zooplankton grazers devel- ops. Thus, w e predict that regions w h e r e subsurface phytoplankton p e a k s a r e formed will b e a r e a s of effi- c ient transfer of e n e r g y to h igher trophic levels, a n d we expec t accumulat ions of pelagic feeders (fish a n d larvae) i n such areas .
Acknowledgements. The authors thank Alice Christoffersen and Jack Melbye for help in carrying out the biological measurements, Jacob Carstensen for help with t h p 5tat15tlcal analysis and the Captain and crew of RV 'Dana' for their help and support dunng data collection. This study was partially supported by a grant from the Danish Natural Science Research Council.
LITERATURE CITED
Bergreen U, Hansen B, Kiarboe T (1988) Food size spectra, ingestion and growth of the copepod Acartia tonsa: irnpli- cations for the determination of copepod production. Mar Bio199:341-352
Bjarnsen PK (1986) Automdtized determination of bacterio- plankton biomass by image analysis. Appl Envlron Micro- biol 51:1199-1204
Bjarnsen PK, Kaas H, Kaas H, Nielsen TG, Olesen M, Richardson K (1993) Dynamics of a subsurface phyto- plankton maximum In the Skagerrak. Mar Ecol Prog Ser 95(3):279-294
Boldrng Kristensen K (1991) The Jutland coastal current. Technical University of Denmark. Series Paper no. 53. Lyngby
Bo Pedersen F (1994) The oceanographic and biological tidal cycle succession in shallow sea fronts in the North Sea and the English Channel. Estuar Coast Shelf Sci 38:249-269
Cushing DH (1989) A difference in structure between eco- systems in strongly stratified waters and in those that are only weakly stratified. J Plankton Res 11(1):1-13
Dodge JD (1985) Manne d~noflagellates of the Bntlsh Isles Her Majesty's Stationery Office, London
Dugdale RC, Goering JJ (1967) Uptake of new and regener- ated forms of n~trogen In primary productivity. Limnol Oceanogr 12:196-206
Edler L (1979) Recommendations for marine biological stud~es in the Baltic Sea. Baltic Mar Biol Pub1 5:l-38
Fogg GE, Egan FRSB. Floodgate GD, Jones DA, Kassab JY, Lochte K, Rees EIS, Scrope-Howe S, Turley C:M (1985) Biological studies in the vicinity of a shallow-sea tidal mix- ing front. VII. The frontal ecosystems. Phi1 Trans R Soc Lond Ser B 310:555-571
Fuhrman J. Azam F (1980) Bacterioplankton secondary pro- duction estimates for coastal waters of British Columbia, Antarctica and California. Appl Environ Microbial 39(6): 1085-1095
Grasshoff K (1976) Methods of seawater analysis. Verlag Chemie, Weinheim
Griffith PC, Douglas DJ, Wainrlght SC (1990) Metabolic activ- ity of size-fractionated microbial plankton in estuarine, nearshore and continental shelf waters of Georg~a. Mar Ecol Prog Ser 59(3).263-270
Hansen PJ, Bjernsen PK, Hansen B (1997) Zooplankton graz- ing and growth: scallng wlthin the 2 pm-2000 pm body size range. Limnol Oceanogr 42:63-79
Harris GP (1986) Phytoplankton ecology: structure, function and fluctuation. Chapman and Hall, London
Heath MR (1992) Field investigations of the early life stages of marine fish. Adv Mar Biol 28:l-174
Heath MR. Richardson K, Kiarboe T (1990) Optical assess- ment of phytoplankton nutrient depletion. J Plankton Res 12(2):381-396
Heilmann JP, Richardson K. Ertebjerg G (1994) Annual distribution and ac!ivity of phytoplankton in thc Sltager- rak/Kattegat frontal reglon. Mar Ecol Prog Ser 112: 213-223
Hobbie JE, Daley RJ, Jaspers S (1977) Use of nuclepore filters for counting bacteria by epdluorescence. Appl Environ Microhiol 00.1 21.5-1 728
Holligan PM, Harbour DS (1977) The vertical distribution and succession of phytoplankton in the western English Channel in 1975 and 1976. J Mar Biol Assoc UK 57(4):1075-1093
Holligan PM, Harris RP, Newel1 RC. Harbour DS, Head RN, Linley EAS, Lucas MI, Tranter PRG, Weekley CM (1984) Vertical distribution and partitioning of organic carbon in mixed, frontal and stratified waters of the English Chan- nel. Mar Ecol Prog Ser 14:lll-127
Hundahl H, Holck J (1980) A new in situ fluorometer for detection of Rhodamine B and chlorophyll. Report no. 42, Institute of Physical Oceanography, Univ of Copenhagen, p 145-154
Karlson B, Edler L, Granelli W, Sahlsten E, Kuylerstierna M (1996) Subsurface chlorophyll maxlma in the Skagerrak- processes and plankton community structure. J Sea Res 35(1-3):139-158
IOerboe T (1993) Turbulence, phytoplankton cell size, and the structure of pelagic food webs Adv Mar Biol 29:l-72
ffisrboe T, Johansen K (1986) Studies of larval herring (Clupea harrngus L.) patch in the Buchan area. IV. Zooplankton distribution and productivity in relation to hydrographic features. Dana 6:37-51
I e r b o e T, Mahlenberg F, RiisgArd HU (1985) In situ feed- mg rates of planktonic copepods: a comparison of four methods. J Exp Mar Biol Ecol88:67-81
Kisrboe T, Munk P, Richardson K, Christensen V, Paulsen H (1988) Plankton dynamics and larval herring growth., drift and survival in a frontal area Mar Ecol Prog Ser 44: 205-219
IOrk JTO (1984) Light and photosynthesis in aquatic ecosys- tems. Cambridge University Press, Cambridge
Le Fevre J (1986) Aspects of the biology of frontal systems. Adv blar Biol 23:210-299
Legendre L, Le Fevre J (1989) Hydrodynamical singularities as controls of recycled versus export production in oceans. In: Berger WH, Smetacek VS, Wefer G (eds) Productivity of the ocean: present and past. John U'iley and Sons, Chichester, p 44-63
Loder JW, Platt T (1985) Physical controls on phytoplankton production at tidal fronts. In: Gibbs PE (ed) Proc 19th Eur

Richardson e t al.: Spatial heterogeneity of the planktonic food web 21 1
Mar Biol Symp. Cambridge Uni\~ersity Press, Cambridge, p 3-22
Lynn DH, Montagnes DJS (1988) Taxonomic descriptions of some conspicuous species of strobilidiine ciliates (Cilio- phora: Choreotrichida) from the Isles of Shoals, Gulf of Maine. J Mar Biol Assoc UK 68:639-658
Munk P, Christensen V, Paulsen H (1986) Studies of a larval herring (Clupea harengus L.) patch in the Buchan area. 11. Growth. mortality and drift of larvae. Dana 6:l l-24
Munk P, Larsson PO, Danielsen DS, Moksness E (1995) Larval and small juvenile cod Gadus nlorhua concentration in the highly producti\re areas of a shelf break front. Mar Ecol Prog Ser 125:21-30
Munk P, Nielsen TG (1994) Trophodynamics of the plankton community at Dogger Bank: predatory impact by larval fish. J Plankton Res 16(9):1225-1245
Nielsen G E , Bresta AM (1984) Guidelines for measurements of phytoplankton primary production. Baltic Mar Biol Pub1 1:l-23
Nielsen TG, Kiorboe T, Bjsrnsen PK (1990) Effect of a Chryso- chromulina polylepjs subsurface bloom on the plankton~c community. Mar Ecol Prog Ser 62:21-35
Nielsen TG, Lokkegaard B, hchardson K, Pedersen FB, Hansen L (1993) The structure of plankton communities in the Dogger Bank area (North Sea) during a stratified s ~ t u - ation Mar Ecol Prog Ser 95:115-131
Nielsen TG, Sabatini M (1996) Role of cyclopoid copepods Oithona spp. in North Sea plankton communities. Mar Ecol Prog Ser 139:79-93
Petersson H (1934) Scattering and extinction of light in sea- water. Meddelanden Goteborgs Hogskolas Oceano- grafiska Institution 4b(4)
Editorial responsibility: Otto Kinne (Editor), Oldendorf/Luhe, Germany
Pingree RD, Holligan PM, ~Mardsell GT (1978) The effects of vertical stability on phytoplankton distribution in the sum- mer on the northwest European shelf. Deep Sea Res 25: 101 1-1028
Prieur L, Legendre L (1988) Oceanographic criteria for new phytoplankton production. In: Rothschild BJ (ed) Toward a theol-y of biological-phys~cal interact~on in the world ocean. Kluwer Academic Publishers, Dordrecht, p 71-112
Richardson K (1985) Plankton distribution and activity in the North Sea/Skagerrak-Kattegat frontal area in April 1984. Mar Ecol Prog Ser 26:233-244
Richardson K, Christoffersen A (1991) Seasonal distribution and production of phytoplankton in the southern Kattegat. Mar Ecol Prog Ser 78:217-227
Richardson K, Heath MR, Pedersen SM (1986) Studles of a larval herring (Clupea harengus L . ) patch in the Buchan area. 111. Phytoplankton distribution and primary produc- tivity in relation to hydrographic features. Dana 6:25-36
Riegman R, Malschaert H, Colijn F (1990) Primary production of phytoplanktoil at a frontal zone located at the northern slope of the Dogger Bank (North Sea). Mar Biol 105: 329-336
Riemann B, B j ~ r n s e n PK, Newel1 S, Fallon R (1987) Calcula- tion of cell production of coastal marine bacteria based on measured incorporation of (3H) thymidine Limnol Oceanogr 32(2):47 1-476
Strickland JDH, Parsons TR (1972) A practical handbook of seawater analysis. Bull Fish Res Bd Can 167:l-310
Vandevelde T, Legendre L, Therriault JC , Demers S, Bah A (1987) Subsurface chlorophyll maxlmum and hydrody- namics of the water column. J Mar Res 45:377-396
Submitted: November 10, 1997; Accepted: March 9, 1998 Proofs received from author(s): June 23, 1998