spatial indices of residential segregation - stata · overview description examples conclusion...
TRANSCRIPT
OverviewDescriptionExamples
ConclusionReferences
Spatial Indices of Residential Segregation
Maurizio Pisati
Department of Sociology and Social ResearchUniversity of Milano-Bicocca (Italy)
6th Italian Stata Users Group meetingGrand Hotel Baglioni - Firenze, November 19-20, 2009
Maurizio Pisati Spatial Indices of Residential Segregation
OverviewDescriptionExamples
ConclusionReferences
Outline
1 OverviewIntroductionAnalysis of residential segregation
2 DescriptionProgramNotationFormulas
3 Examples
4 Conclusion
5 References
Maurizio Pisati Spatial Indices of Residential Segregation
OverviewDescriptionExamples
ConclusionReferences
IntroductionAnalysis of residential segregation
Introduction
The measurement of residential segregation is generally basedon indices that do not appropriately take into account thespatial patterning of the phenomena of interest
To overcome such limitation, new indices have been proposedthat adequately account for the relationships of spatialcontiguity among residential locations
The purpose of this talk is to present a preliminary version ofspseg, a novel user-written Stata program that computesthree indices of this kind: two multigroup spatial clusteringindices – the spatial dissimilarity index D and the spatialinformation theory index H – and the spatial exposure indexP∗kℓ
Maurizio Pisati Spatial Indices of Residential Segregation
OverviewDescriptionExamples
ConclusionReferences
IntroductionAnalysis of residential segregation
What is residential segregation
Residential segregation can be defined as the extent to which,within a given geographical area (e.g., a city), individualsbelonging to different social groups live in neighborhoodscharacterized by different social compositions (Reardon andO’Sullivan 2004)
Maurizio Pisati Spatial Indices of Residential Segregation

OverviewDescriptionExamples
ConclusionReferences
IntroductionAnalysis of residential segregation
What is residential segregation
Residential segregation can be defined as the extent to which,within a given geographical area (e.g., a city), individualsbelonging to different social groups live in neighborhoodscharacterized by different social compositions (Reardon andO’Sullivan 2004)
For example, suppose the inhabitants of Florence are classifiedinto two social classes: white collars and blue collars. If themajority of white collars live in neighborhoods populatedprimarily by white collars, while most blue collars reside inneighborhoods whose population consists mainly of bluecollars, then we can conclude that Florence is characterized bya certain degree of residential segregation by social class
Maurizio Pisati Spatial Indices of Residential Segregation

OverviewDescriptionExamples
ConclusionReferences
IntroductionAnalysis of residential segregation
Measuring residential segregation
Measuring residential segregation within a given geographicalarea entails two basic operations: (a) defining theneighborhoods within which individuals live, and (b)quantifying the extent to which the distribution of the socialattribute of interest (e.g., social class) varies acrossneighborhoods (Reardon and O’Sullivan 2004)
Maurizio Pisati Spatial Indices of Residential Segregation
OverviewDescriptionExamples
ConclusionReferences
IntroductionAnalysis of residential segregation
Measuring residential segregation
Measuring residential segregation within a given geographicalarea entails two basic operations: (a) defining theneighborhoods within which individuals live, and (b)quantifying the extent to which the distribution of the socialattribute of interest (e.g., social class) varies acrossneighborhoods (Reardon and O’Sullivan 2004)
The indices of residential segregation most commonly used inthe literature focus on the second operation, but completelyelude the first one, thus failing to take into account thespatial nature of the phenomenon
Maurizio Pisati Spatial Indices of Residential Segregation
OverviewDescriptionExamples
ConclusionReferences
IntroductionAnalysis of residential segregation
Measuring residential segregation
Expressly, the traditional indices of residential segregationequate the neighborhoods within which individuals live withthe administrative units (e.g., the census tracts) into whichthe geographical area of interest is divided
The establishment of such equivalence between administrativeunits and neighborhoods, however, raises two issues potentiallyrelevant to the measurement of residential segregation: (a)the checkerboard problem, and (b) the comparability problem
Maurizio Pisati Spatial Indices of Residential Segregation

OverviewDescriptionExamples
ConclusionReferences
IntroductionAnalysis of residential segregation
The checkerboard problem
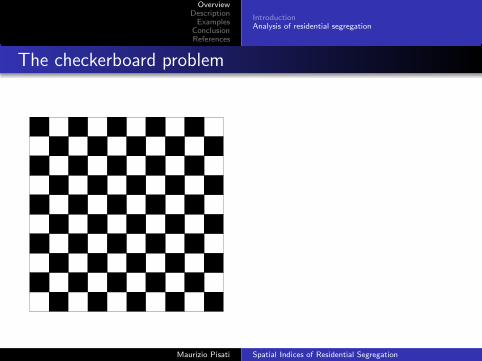
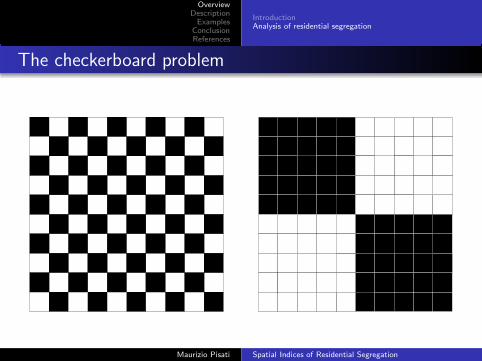
The checkerboard problem stems from considering eachadministrative unit in isolation from the others, thusneglecting the overall social composition of its surroundingspace
Maurizio Pisati Spatial Indices of Residential Segregation
OverviewDescriptionExamples
ConclusionReferences
IntroductionAnalysis of residential segregation
The checkerboard problem
Maurizio Pisati Spatial Indices of Residential Segregation
OverviewDescriptionExamples
ConclusionReferences
IntroductionAnalysis of residential segregation
The checkerboard problem
Maurizio Pisati Spatial Indices of Residential Segregation
OverviewDescriptionExamples
ConclusionReferences
IntroductionAnalysis of residential segregation
The comparability problem
The issue of comparability is also very important and comesfrom the fact that different geographical areas – or the samegeographical area at different times – are often divided intoadministrative units according to different criteria
This means that, whenever we equate neighborhoods withadministrative units and are interested in carrying out acomparative analysis of residential segregation, different areas– or the same area at different times – will likely correspondto different definitions of neighborhoods, thus making anycomparison of segregation levels unreliable
Maurizio Pisati Spatial Indices of Residential Segregation
OverviewDescriptionExamples
ConclusionReferences
IntroductionAnalysis of residential segregation
Some solutions
To tackle the checkerboard and the comparability problems, inthe last few years several scholars have devised new indices ofresidential segregation that take into account the spatialdimension of the phenomenon (e.g., Morgan 1983; White1983; Morrill 1991; Wong 1993, 1998, 2003; Grannis 2002;Feitosa et al. 2004; Reardon e O’Sullivan 2004; O’Sullivan eWong 2007)
These indices are based on definitions of neighborhoods thatare less sensitive to the nature of pre-existing administrativeunits
Maurizio Pisati Spatial Indices of Residential Segregation
OverviewDescriptionExamples
ConclusionReferences
IntroductionAnalysis of residential segregation
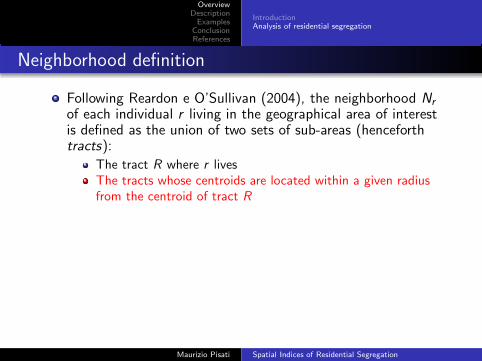
Neighborhood definition
Following Reardon e O’Sullivan (2004), the neighborhood Nr
of each individual r living in the geographical area of interestis defined as the union of two sets of sub-areas (henceforthtracts):
Maurizio Pisati Spatial Indices of Residential Segregation

OverviewDescriptionExamples
ConclusionReferences
IntroductionAnalysis of residential segregation
Neighborhood definition
Following Reardon e O’Sullivan (2004), the neighborhood Nr
of each individual r living in the geographical area of interestis defined as the union of two sets of sub-areas (henceforthtracts):
The tract R where r lives
Maurizio Pisati Spatial Indices of Residential Segregation
OverviewDescriptionExamples
ConclusionReferences
IntroductionAnalysis of residential segregation
Neighborhood definition
Following Reardon e O’Sullivan (2004), the neighborhood Nr
of each individual r living in the geographical area of interestis defined as the union of two sets of sub-areas (henceforthtracts):
The tract R where r livesThe tracts whose centroids are located within a given radiusfrom the centroid of tract R
Maurizio Pisati Spatial Indices of Residential Segregation
OverviewDescriptionExamples
ConclusionReferences
IntroductionAnalysis of residential segregation
Neighborhood definition
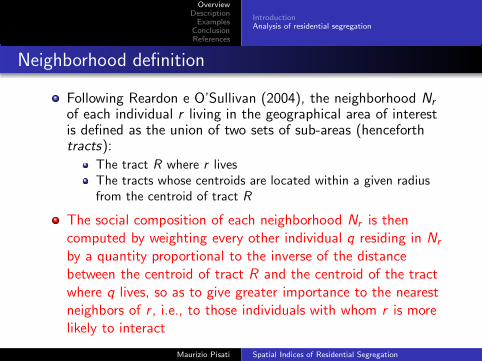
Following Reardon e O’Sullivan (2004), the neighborhood Nr
of each individual r living in the geographical area of interestis defined as the union of two sets of sub-areas (henceforthtracts):
The tract R where r livesThe tracts whose centroids are located within a given radiusfrom the centroid of tract R
The social composition of each neighborhood Nr is thencomputed by weighting every other individual q residing in Nr
by a quantity proportional to the inverse of the distancebetween the centroid of tract R and the centroid of the tractwhere q lives, so as to give greater importance to the nearestneighbors of r , i.e., to those individuals with whom r is morelikely to interact
Maurizio Pisati Spatial Indices of Residential Segregation

OverviewDescriptionExamples
ConclusionReferences
IntroductionAnalysis of residential segregation
Neighborhood definition
R Radius = 500 meters
Maurizio Pisati Spatial Indices of Residential Segregation

OverviewDescriptionExamples
ConclusionReferences
ProgramNotationFormulas
spseg
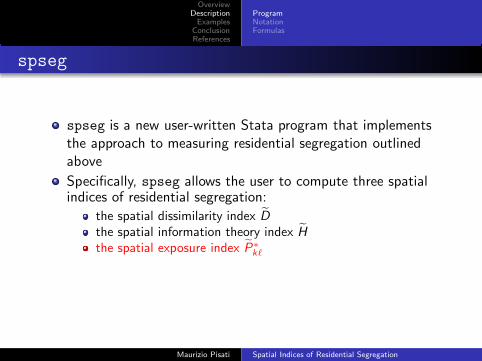
spseg is a new user-written Stata program that implementsthe approach to measuring residential segregation outlinedabove
Maurizio Pisati Spatial Indices of Residential Segregation
OverviewDescriptionExamples
ConclusionReferences
ProgramNotationFormulas
spseg
spseg is a new user-written Stata program that implementsthe approach to measuring residential segregation outlinedabove
Specifically, spseg allows the user to compute three spatialindices of residential segregation:
Maurizio Pisati Spatial Indices of Residential Segregation

OverviewDescriptionExamples
ConclusionReferences
ProgramNotationFormulas
spseg
spseg is a new user-written Stata program that implementsthe approach to measuring residential segregation outlinedabove
Specifically, spseg allows the user to compute three spatialindices of residential segregation:
the spatial dissimilarity index D
Maurizio Pisati Spatial Indices of Residential Segregation
OverviewDescriptionExamples
ConclusionReferences
ProgramNotationFormulas
spseg
spseg is a new user-written Stata program that implementsthe approach to measuring residential segregation outlinedabove
Specifically, spseg allows the user to compute three spatialindices of residential segregation:
the spatial dissimilarity index D
the spatial information theory index H
the spatial exposure index P∗
kℓ
Maurizio Pisati Spatial Indices of Residential Segregation
OverviewDescriptionExamples
ConclusionReferences
ProgramNotationFormulas
spseg
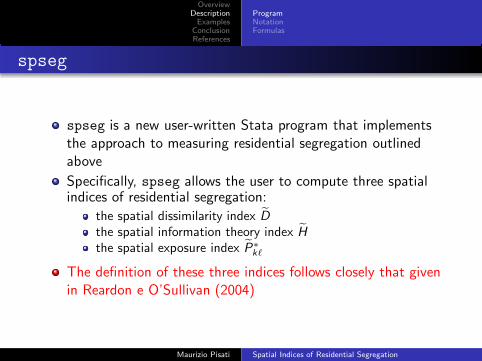
spseg is a new user-written Stata program that implementsthe approach to measuring residential segregation outlinedabove
Specifically, spseg allows the user to compute three spatialindices of residential segregation:
the spatial dissimilarity index D
the spatial information theory index H
the spatial exposure index P∗
kℓ
The definition of these three indices follows closely that givenin Reardon e O’Sullivan (2004)
Maurizio Pisati Spatial Indices of Residential Segregation
OverviewDescriptionExamples
ConclusionReferences
ProgramNotationFormulas
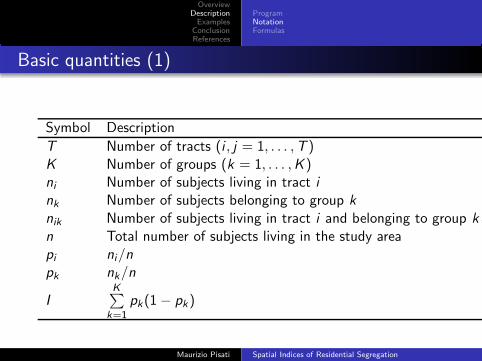
Basic quantities (1)
Symbol Description
T Number of tracts (i , j = 1, . . . ,T )K Number of groups (k = 1, . . . ,K )ni Number of subjects living in tract ink Number of subjects belonging to group k
nik Number of subjects living in tract i and belonging to group k
n Total number of subjects living in the study areapi ni/npk nk/n
IK∑
k=1
pk(1− pk)
Maurizio Pisati Spatial Indices of Residential Segregation

OverviewDescriptionExamples
ConclusionReferences
ProgramNotationFormulas
Basic quantities (2)
Symbol Description
niT∑j=1
wijnj
nikT∑j=1
wijnjk
pk|i nik/niwij f (dij , r)dij Euclidean distance between the centroids of tracts i and j
r Radius of the neighborhood
Maurizio Pisati Spatial Indices of Residential Segregation
OverviewDescriptionExamples
ConclusionReferences
ProgramNotationFormulas
Spatial dissimilarity index D
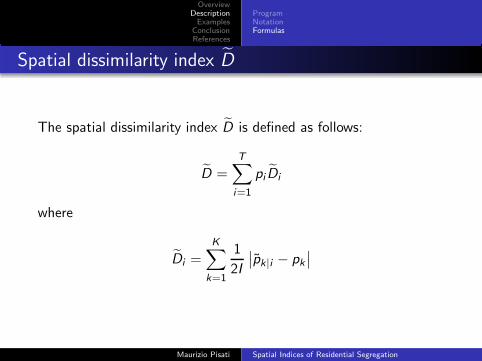
The spatial dissimilarity index D is defined as follows:
D =
T∑
i=1
pi Di
where
Di =
K∑
k=1
1
2I
∣∣pk|i − pk∣∣
Maurizio Pisati Spatial Indices of Residential Segregation

OverviewDescriptionExamples
ConclusionReferences
ProgramNotationFormulas
Spatial dissimilarity index D
D can be interpreted as a measure of how different the socialcomposition of neighborhoods is, on average, from the socialcomposition of the study area
D can take values ranging from 0 (no segregation) to 1(maximum possible segregation)
Maurizio Pisati Spatial Indices of Residential Segregation
OverviewDescriptionExamples
ConclusionReferences
ProgramNotationFormulas
Spatial information theory index H
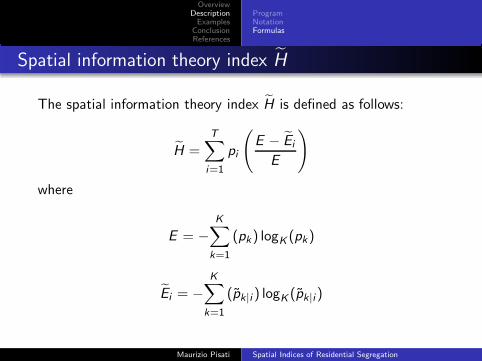
The spatial information theory index H is defined as follows:
H =
T∑
i=1
pi
(E − Ei
E
)
where
E = −
K∑
k=1
(pk) logK (pk)
Ei = −
K∑
k=1
(pk|i ) logK (pk|i )
Maurizio Pisati Spatial Indices of Residential Segregation

OverviewDescriptionExamples
ConclusionReferences
ProgramNotationFormulas
Spatial information theory index H
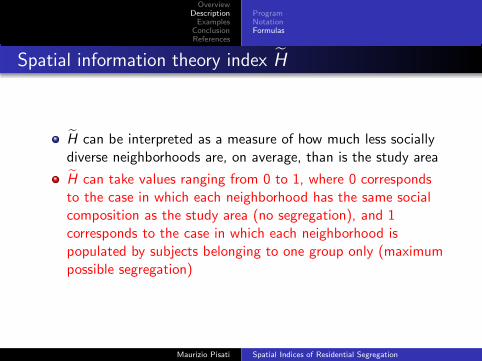
H can be interpreted as a measure of how much less sociallydiverse neighborhoods are, on average, than is the study area
Maurizio Pisati Spatial Indices of Residential Segregation
OverviewDescriptionExamples
ConclusionReferences
ProgramNotationFormulas
Spatial information theory index H
H can be interpreted as a measure of how much less sociallydiverse neighborhoods are, on average, than is the study area
H can take values ranging from 0 to 1, where 0 correspondsto the case in which each neighborhood has the same socialcomposition as the study area (no segregation), and 1corresponds to the case in which each neighborhood ispopulated by subjects belonging to one group only (maximumpossible segregation)
Maurizio Pisati Spatial Indices of Residential Segregation
OverviewDescriptionExamples
ConclusionReferences
ProgramNotationFormulas
Spatial exposure index P∗kℓ
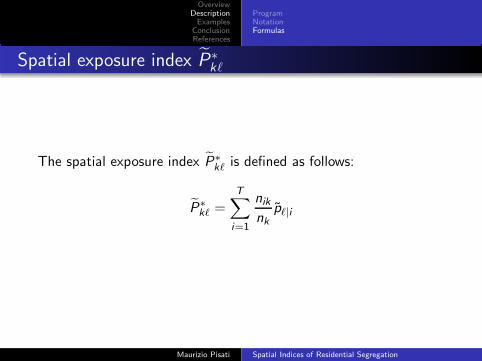
The spatial exposure index P∗kℓ is defined as follows:
P∗kℓ =
T∑
i=1
nik
nkpℓ|i
Maurizio Pisati Spatial Indices of Residential Segregation
OverviewDescriptionExamples
ConclusionReferences
ProgramNotationFormulas
Spatial exposure index P∗kℓ
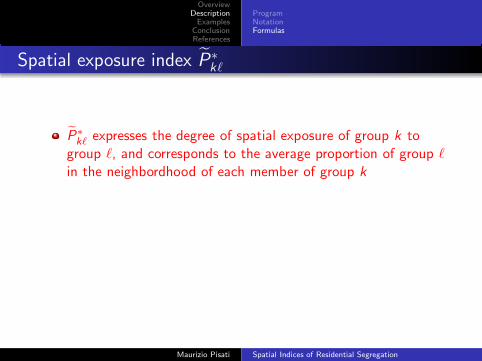
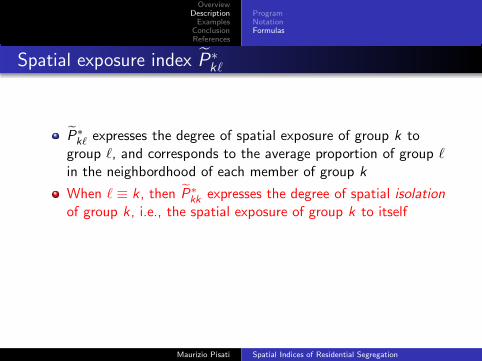
P∗kℓ expresses the degree of spatial exposure of group k to
group ℓ, and corresponds to the average proportion of group ℓin the neighbordhood of each member of group k
Maurizio Pisati Spatial Indices of Residential Segregation
OverviewDescriptionExamples
ConclusionReferences
ProgramNotationFormulas
Spatial exposure index P∗kℓ
P∗kℓ expresses the degree of spatial exposure of group k to
group ℓ, and corresponds to the average proportion of group ℓin the neighbordhood of each member of group k
When ℓ ≡ k , then P∗kk expresses the degree of spatial isolation
of group k , i.e., the spatial exposure of group k to itself
Maurizio Pisati Spatial Indices of Residential Segregation

OverviewDescriptionExamples
ConclusionReferences
ProgramNotationFormulas
Spatial exposure index P∗kℓ
P∗kℓ expresses the degree of spatial exposure of group k to
group ℓ, and corresponds to the average proportion of group ℓin the neighbordhood of each member of group k
When ℓ ≡ k , then P∗kk expresses the degree of spatial isolation
of group k , i.e., the spatial exposure of group k to itself
In absence of segregation, P∗kℓ corresponds exactly to pℓ, i.e.,
to the proportion of group ℓ in the study area
On the contrary, when there is segregation P∗kℓ 6= pℓ
Maurizio Pisati Spatial Indices of Residential Segregation
OverviewDescriptionExamples
ConclusionReferences
The data
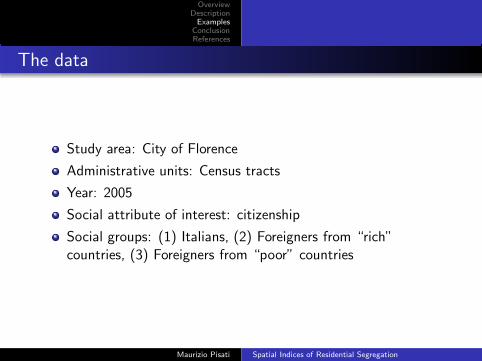
Study area: City of Florence
Administrative units: Census tracts
Year: 2005
Social attribute of interest: citizenship
Social groups: (1) Italians, (2) Foreigners from “rich”countries, (3) Foreigners from “poor” countries
Maurizio Pisati Spatial Indices of Residential Segregation
OverviewDescriptionExamples
ConclusionReferences
Dissimilarity index and Information theory indexAspatial versions computed by user-written programs seg and spseg – Selected output
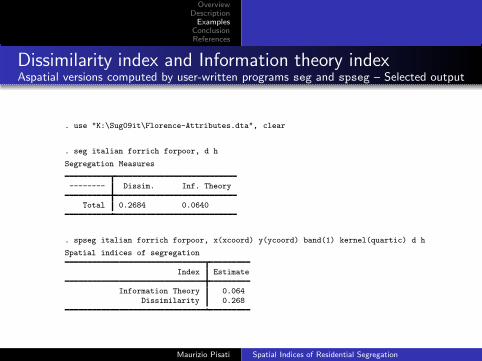
. use "K:\Sug09it\Florence-Attributes.dta", clear
. seg italian forrich forpoor, d h
Segregation Measures
-------- Dissim. Inf. Theory
Total 0.2684 0.0640
. spseg italian forrich forpoor, x(xcoord) y(ycoord) band(1) kernel(quartic) d h
Spatial indices of segregation
Index Estimate
Information Theory 0.064Dissimilarity 0.268
Maurizio Pisati Spatial Indices of Residential Segregation
OverviewDescriptionExamples
ConclusionReferences
Dissimilarity index and Information theory indexSpatial versions computed by spseg – Selected output
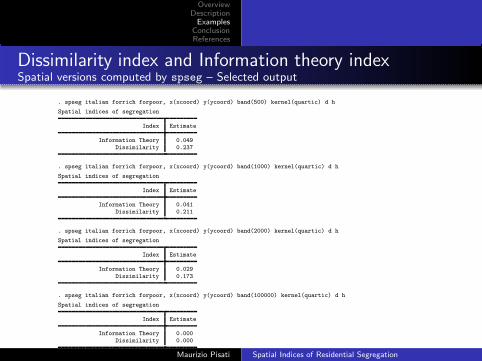
. spseg italian forrich forpoor, x(xcoord) y(ycoord) band(500) kernel(quartic) d h
Spatial indices of segregation
Index Estimate
Information Theory 0.049Dissimilarity 0.237
. spseg italian forrich forpoor, x(xcoord) y(ycoord) band(1000) kernel(quartic) d h
Spatial indices of segregation
Index Estimate
Information Theory 0.041Dissimilarity 0.211
. spseg italian forrich forpoor, x(xcoord) y(ycoord) band(2000) kernel(quartic) d h
Spatial indices of segregation
Index Estimate
Information Theory 0.029Dissimilarity 0.173
. spseg italian forrich forpoor, x(xcoord) y(ycoord) band(100000) kernel(quartic) d h
Spatial indices of segregation
Index Estimate
Information Theory 0.000Dissimilarity 0.000
Maurizio Pisati Spatial Indices of Residential Segregation
OverviewDescriptionExamples
ConclusionReferences
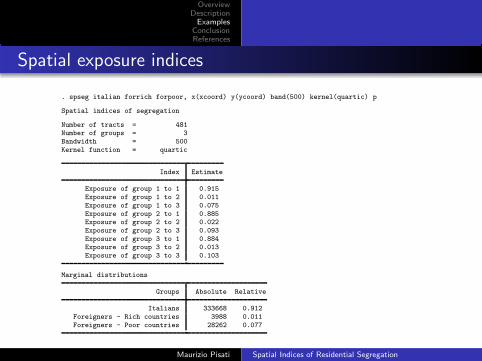
Spatial exposure indices
. spseg italian forrich forpoor, x(xcoord) y(ycoord) band(500) kernel(quartic) p
Spatial indices of segregation
Number of tracts = 481Number of groups = 3Bandwidth = 500Kernel function = quartic
Index Estimate
Exposure of group 1 to 1 0.915Exposure of group 1 to 2 0.011Exposure of group 1 to 3 0.075Exposure of group 2 to 1 0.885Exposure of group 2 to 2 0.022Exposure of group 2 to 3 0.093Exposure of group 3 to 1 0.884Exposure of group 3 to 2 0.013Exposure of group 3 to 3 0.103
Marginal distributions
Groups Absolute Relative
Italians 333668 0.912Foreigners - Rich countries 3988 0.011Foreigners - Poor countries 28262 0.077
Maurizio Pisati Spatial Indices of Residential Segregation
OverviewDescriptionExamples
ConclusionReferences
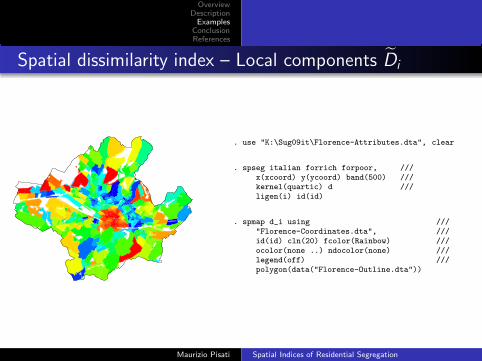
Spatial dissimilarity index – Local components Di
. use "K:\Sug09it\Florence-Attributes.dta", clear
. spseg italian forrich forpoor, ///x(xcoord) y(ycoord) band(500) ///kernel(quartic) d ///ligen(i) id(id)
. spmap d_i using ///"Florence-Coordinates.dta", ///id(id) cln(20) fcolor(Rainbow) ///ocolor(none ..) ndocolor(none) ///legend(off) ///polygon(data("Florence-Outline.dta"))
Maurizio Pisati Spatial Indices of Residential Segregation

OverviewDescriptionExamples
ConclusionReferences
Conclusion
spseg complements the existing Stata programs for theanalysis of segregation, namely seg (by Sean F. Reardon),duncan (by Ben Jann) and hutchens (by Stephen P. Jenkins)
Maurizio Pisati Spatial Indices of Residential Segregation

OverviewDescriptionExamples
ConclusionReferences
Conclusion
spseg complements the existing Stata programs for theanalysis of segregation, namely seg (by Sean F. Reardon),duncan (by Ben Jann) and hutchens (by Stephen P. Jenkins)
spseg is still at a very preliminary stage and it will take sometime before it reaches a publishable form
Maurizio Pisati Spatial Indices of Residential Segregation
OverviewDescriptionExamples
ConclusionReferences
References
Feitosa, F.F., G. Camara, A.M.V. Monteiro, T. Koschitzki,and M.P.S. Silva. 2004. Spatial Measurement of ResidentialSegregation, in Proceedings of GeoInfo 2004, pp. 59–73.Geneve: IFIP.
Grannis, R. 2002. Discussion: Segregation Indices and TheirFunctional Inputs. Sociological Methodology 32: 69–84.
Morgan, B.S. 1983. An Alternate Approach to theDevelopment of a Distance-Based Measure of RacialSegregation. American Journal of Sociology 88: 1237–1249.
Morrill, R.L. 1991. On the Measure of Spatial Segregation.Geography Research Forum 11: 25–36.
O’Sullivan, D. and D.W.S. Wong. 2007. A Surface-BasedApproach to Measuring Spatial Segregation. GeographicalAnalysis 39: 147–168.
Maurizio Pisati Spatial Indices of Residential Segregation
OverviewDescriptionExamples
ConclusionReferences
References
Reardon, S.F. and D. O’Sullivan. 2004. Measures of SpatialSegregation. Sociological Methodology 34: 121–162.
White, M.J. 1983. The Measurement of Spatial Segregation.American Journal of Sociology 88: 1008–1018.
Wong, D.W.S. 1993. Spatial Indices of Segregation. UrbanStudies 30: 559–572.
Wong, D.W.S. 1998. Measuring Multiethnic SpatialSegregation. Urban Geography 19: 77–87.
Wong, D.W.S. 2003. Implementing Measures of SpatialSegregation in GIS. Computers, Environment and Urban
Systems 27: 53–70.
Maurizio Pisati Spatial Indices of Residential Segregation