spatial scale effects on taxonomic and biological...
TRANSCRIPT

1
Spatial scale effects on taxonomic and biological trait diversity of aquatic 1
macroinvertebrates in Mediterranean streams 2
3
Eduardo M. García-Roger1, 5+, María del Mar Sánchez-Montoya2, Núria Cid1, Stefania 4
Erba3, Ioannis Karaouzas4, Iraima Verkaik1, Maria Rieradevall1, Rosa Gómez2, M. Luisa 5
Suárez2, M. Rosario Vidal-Abarca2, Daniele DeMartini3, Andrea Buffagni3, Nikos 6
Skoulikidis4, Núria Bonada1, and Narcís Prat1 7
8
Authors’ addresses: 9 1 Grup de Recerca “Freshwater Ecology and Management (FEM)”, Departament 10
d’Ecologia. Universitat de Barcelona, Spain 11 2 Departamento de Ecología e Hidrología. Regional Campus of International Excellence 12
"Campus Mare Nostrum". Universidad de Murcia, Spain 13 3 Istituto di Ricerca Sulle Acque (CNR-IRSA), Italy 14 4 Hellenic Centre for Marine Research (HCMR), Greece 15 5 Institut Cavanilles de Biodiversitat i Biologia Evolutiva. Universitat de València, Spain 16 + Corresponding author; E-mail: [email protected] 17
18
With 5 figures and 6 tables 19
20
21
22
23
24
25
26
27
28
29
30
31

2
Abstract: We examined the effect of spatial scale on aquatic macroinvertebrate communities in 1 Mediterranean streams from six basins distributed across southern Europe, including Spain, France, 2 Italy, and Greece. We classified the studied streams according to their long-term aquatic regime 3 into the three following types: (i) permanent (P), (ii) intermittent with summer pools (I-P), and (iii) 4 intermittent with summer dry channels (I-D). For each stream type, we analyzed taxonomic and 5 trait diversity, as well as the composition of the macroinvertebrate community, following a spatially 6 nested design at three spatial scales of analysis: microhabitat (substratum patches), mesohabitat 7 (pools vs. riffles), and macrohabitat (streams). In order to assess intrinsic seasonal variability in 8 streams from the Mediterranean region, 20 Surber samples were taken from each stream according 9 to meso- and microhabitat frequency in the wet and the dry season during 2010. Given the need for 10 adaptation to specific hydrological conditions and the fact that microhabitats should encompass the 11 niche requirements of particular taxa, we hypothesized that this spatial scale would have a greater 12 influence on macroinvertebrate taxa composition and biological traits than the other two larger 13 spatial scales in intermittent streams. We observed that patterns in the relative importance of 14 variance components across hierarchical spatial scales changed with time because low flow or 15 droughts altered both mesohabitat prevalence and microhabitat composition. Our results confirm 16 the importance of the microhabitat scale in I-P streams in the wet season but not in the dry one, 17 when a loss of microhabitat diversity occurred. Stream-to-stream variability was more important in 18 P and I-D streams. Our study also explored the relationships between traits and aquatic regimes. We 19 found that aquatic macroinvertebrates inhabiting permanent streams exhibited traits related to the 20 longer duration of life cycles in these rivers (e.g. large size of adult stages) and adaptations to 21 flowing conditions (e.g. modes of aquatic dispersal), whereas aquatic macroinvertebrates inhabiting 22 intermittent streams with summer pools had traits adapted to depositional conditions and ecological 23 preferences for confined habitats (i.e. disconnected pools without flow). Finally, aquatic 24 macroinvertebrates from intermittent streams with summer dry channels had adaptations conferring 25 ability to survive periods with no water (e.g. modes of aerial dispersal, resistant stages). These 26 results indicate that microhabitat conditions should not be neglected as they can play an important 27 role in certain situations. 28 29
30
31
Key words: aquatic macroinvertebrates, biological traits, diversity, Mediterranean region, 32
microhabitats, seasonal changes, spatial scale. 33

3
Introduction 1
2
Understanding how and why biological community attributes change across multiple 3
spatial scales remains one of the most challenging tasks facing ecology as a general 4
discipline (Levin 1992, Borcard et al. 1992, Dungan et al. 2002, Pavoine & Dolédec 2005, 5
Crist & Veech 2006) and stream ecology in particular (see for review Parsons et al. 2004, 6
Lowe et al. 2006, Johnson & Host 2010, Winemiller et al. 2010). It is widely accepted that 7
any given community descriptor (e.g. diversity, taxonomic or biological trait composition) 8
may generate different patterns across a range of spatial scales, from the macrohabitat to 9
the microhabitat, since different mechanisms are likely to operate at each scale (Morris 10
1987, Kolasa 1989, Wiens 1989, Levin 1992). 11
12
Streams and rivers subdivide easily into clear hierarchical scales of organization (Frissell et 13
al. 1986, Allan 1995), and many studies have attempted to disentangle the relative 14
importance of each scale for various aquatic organism assemblages (see Johnson & Host 15
(2010) for a review of the last decade, but also Robson et al. (2005) for a more specific 16
review of macroinvertebrates in stony perennial streams during the 1993-2005 period). 17
However, the ranges of scales considered have varied from study to study, from eco-18
regions and catchments (Li et al. 2001, Heino et al. 2004, Townsend et al. 2003, Mykrä et 19
al. 2004, 2008) and streams and reaches (Boyero & Bailey 2001, Boyero 2003, 2005) to 20
mesohabitats and microhabitats (Wang et al. 2003, Finn & Poff 2005, Heino & Korsu 21
2008, Buffagni et al. 2010). 22
23
Despite the variety of responses found in these studies, some general conclusions can be 24
drawn. First, with respect to spatial scale, recognition of the importance of small scales 25
depends on the range of scales considered and the analytical method used (hierarchical vs. 26
non-hierarchical). For instance, when catchments or eco-regions are included in multi-scale 27
comparisons, they usually account for most variation of biological assemblages and 28
community metrics (e.g. taxa richness, diversity). If small patches are included in analyses, 29
their significance emerges only when either disturbance gradients are considered (Wang et 30
al. 2006) or when geographical position is analyzed not as a factor in the spatial hierarchy 31

4
but as a covariate (Heino 2005, Mykrä et al. 2008). When lower spatial scales are 1
considered (e.g. streams and reaches, mesohabitats and microhabitats), the smallest ones 2
are usually where most of the variation in macroinvertebrate structural and functional 3
measures is observed (Downes et al. 1993, 2000, Robson et al. 2005, Boyero & Bailey 4
2001, Boyero 2003, Heino et al. 2004, Heino & Korsu 2008, Giri et al. 2010). 5
6
Second, analysis of taxonomic composition was the main focus of most of these studies. In 7
the context of the river habitat templet, the assembly of local communities is visualized as a 8
process whereby multiple habitat filters act hierarchically, selecting those organisms 9
endowed with a set of biological traits that allow them to survive, grow, and reproduce 10
under increasingly constraining factors (Poff & Ward 1990, Townsend & Hildrew 1994, 11
Poff 1997, Statzner et al. 2001). However, only a few studies have analyzed trait 12
composition at different hierarchical scales. For example, Lamoroux et al. (2004) analyzed 13
the relationships between habitat and the functional structure of aquatic macroinvertebrate 14
assemblages (12 biological traits) at three spatial scales varying from the microhabitat to 15
the basin scale. These authors found that variability in most biological traits depended 16
largely on microhabitat conditions, but larger-scale effects were not negligible. Similarly, 17
following a nested design and considering only two biological traits (size and feeding 18
habits), Pavoine & Dolédec (2005) found that most of the variation occurred at the lowest 19
spatial scale studied, which was comparable to the microhabitat scale. 20
21
Third and finally, most of the studies have focused on perennial streams in temperate 22
regions, while data on intermittent streams from drier areas such as the Mediterranean are 23
scarce. The Mediterranean region is characterized by high spatial and temporal 24
heterogeneity (di Castri 1981, Gasith & Resh 1999, Blondel et al. 2010, Robson et al. 25
2011) and may offer a very interesting scenario for the question of multi-scale patterns. For 26
instance, the relative importance of spatial scales may change over time due to seasonal 27
episodes of low flow/droughts that may alter pool and riffle prevalence and microhabitat 28
composition within streams. Interestingly, Lind et al. (2006) found that when flow 29
decreases, run mesohabitats more closely resemble pools, and microhabitats become more 30
homogeneous. Moreover, analysis of relationships between habitats and biological traits 31

5
may be particularly valuable in Mediterranean streams because natural disturbances such as 1
droughts may disrupt aggregate assemblage composition by causing local extinctions, 2
while biological traits adapted to such seasonal disturbances (e.g. formation of resistant 3
stages) are expected to remain strongly associated with local conditions. Droughts are 4
described as ramp disturbances, with progressive effects in stream ecosystem, first isolating 5
pools and then initiating an ecological succession process within each pool until 6
desiccation (Lake 2007, Boulton & Lake 2008). Complete desiccation may or may not take 7
place depending on substrate, groundwater hydrology, and pool morphology, which leads 8
to a particularly high diversity of streams in the Mediterranean region including the 9
following aquatic regimes: (i) permanent, (ii) intermittent with isolated summer pools, (iii) 10
intermittent with dry channels in summer, and (iv) ephemeral (Gallart et al. 2012). 11
Furthermore, inter-annual variability in the region (dry vs. wet years) may periodically alter 12
the long-term hydrological regime of each stream type. 13
14
In this study, we tested the relative contribution of different spatial scales to variation in 15
aquatic macroinvertebrate assemblages and their taxonomic and biological trait diversities 16
in the aforementioned stream types. Following Frissell et al. (1986), we used the following 17
operational nested scales: (i) macrohabitat, which corresponds to streams, (ii) mesohabitat, 18
which corresponds to the pool/riffle system within a reach, and (iii) microhabitat, which 19
corresponds to different substratum types within a mesohabitat. In order to capture the 20
temporal heterogeneity of Mediterranean streams, we included two sampling seasons. 21
Inter-annual differences have also been shown to change macroinvertebrate structure and 22
trait composition in Mediterranean streams (Bêche et al. 2006, Bêche & Resh 2007), but in 23
this study we concentrated on a shorter time period and a wide spatial extent. Given the 24
need for organisms to adapt to specific hydrological conditions and the fact that 25
microhabitats should encompass the niche requirements of particular taxa, we hypothesized 26
that the microhabitat scale would have a greater influence on macroinvertebrate taxa 27
composition and biological and ecological traits than the other two larger spatial scales in 28
intermittent streams. Finally, we tested for the existence of significant associations between 29
biological and ecological traits and each aquatic regime. In general, we expected that (i) 30
aquatic macroinvertebrates from permanent streams would have traits adapted to dominant 31

6
flow conditions (e.g. organisms temporarily attached, filter feeders), (ii) aquatic 1
macroinvertebrates from intermittent streams with isolated summer pools would have traits 2
related to life under confined conditions, typically characterized by reduced levels of 3
oxygen and depositional regimes (e.g. deposit feeders), and (iii) aquatic macroinvertebrates 4
from intermittent streams with dry channels in summer would have traits conferring the 5
ability to escape the periods of habitat disappearance (e.g. short aquatic stages, resistant 6
structures, modes of aerial dispersal). 7
8
Methods 9
10
Study sites 11
12
This study was conducted in six stream basins throughout the European Mediterranean 13
region (Fig. 1). The streams belong to five circum-Mediterranean eco-regions according to 14
the classification by Illies (1978): Ibero-Macaronesian region (Taibilla), Pyrenees 15
(Vallcebre), Western plains (La Vêne), Italy-Corsica-Malta region (Biferno and 16
Candelaro), and Hellenic Western Balkan region (Evrotas), thus providing sufficient 17
variation of the aquatic macroinvertebrate communities at the macrohabitat scale. All 18
streams were the subject of MIRAGE (Mediterranean Intermittent River ManAGEment) 19
studies, a EU-funded research project, and are located in areas with minimal human 20
influence on stream hydrology and water quality. 21
22
Study design and sampling 23
24
We used a nested sampling design to estimate the components of variation in the structure 25
and composition of aquatic macroinvertebrate communities associated with the three 26
successive spatial scales introduced earlier: (i) macrohabitat (hereafter referred to as 27
stream), (ii) mesohabitat, and (iii) microhabitat. 28
29
From each of the six basins, we surveyed streams differing in their hydrological regime. 30
Each stream was classified according to its long-term aquatic regime as (i) permanent (P), 31

7
(ii) intermittent with summer pools (I-P), or (iii) intermittent with summer dry channels (I-1
D). When long-term hydrological data were available, we used the flow permanence and 2
seasonal predictability metrics proposed by Gallart et al. (2012) to classify the streams into 3
the abovementioned types. In the absence of such data, we relied on field surveys, 4
bibliographic information, and expert advice. See Table 1 for a list of the studied streams 5
and their classification. 6
7
A reach measuring 25-30 m long in each stream was sampled in spring and summer 2010. 8
These two sampling periods represented the wet and dry seasons in the Mediterranean 9
region (García-Roger et al. 2011). Within reaches, we sampled pool (velocity < 0.03 m s-1) 10
and riffle mesohabitats based on their frequency of occurrence. Within mesohabitats, we 11
sampled microhabitats, also based on frequency of occurrence. Thus, 20-22 Surber samples 12
were taken proportionally to the relative occurrence of pool-riffle mesohabitats and 13
microhabitats (see Table 2) within each reach in each sampling period (427 samples in 14
total). Water depth (cm) and velocity (m s-1) were measured for each sample, and samples 15
were fixed with formaldehyde (4% final concentration). The number of batches of 20-22 16
samples per stream was high enough to reach an asymptote in taxon accumulation curves 17
(data not shown, but previously demonstrated for a subset of the studied streams by García-18
Roger et al. (2011)). Surber dimensions were adapted to stream size (ranging from 0.025 to 19
0.09 m2; 250 µm mesh), so the final percentage of habitat sampled in each stream was 20
standardized to ~1% of the reach studied to allow comparisons across streams (on average, 21
the sum of the 20 Surber samples in each stream represented 1.14 % ± 0.08 SE). We found 22
no significant differences in taxa richness per sample for either of the two different Surber 23
sizes used in our dataset (Kruskal-Wallis rank sum test, p-value = 0.722). 24
25
For each stream on each sampling occasion we recorded the following physicochemical 26
parameters: temperature (ºC), conductivity (µS cm-1), pH, and dissolved oxygen 27
concentration (mg L-1) and its saturation percentage (Table 1). Additionally, water samples 28
of 250 mL were collected, filtered upon arrival at the laboratory through 0.45 µm 29
membrane filters, kept in cool conditions (4 ºC), and analyzed to determine concentrations 30
of nitrates (mg NO3- L-1) and nitrites (mg NO2
- L-1) using HPLC, ammonia (mg NH4+ L-1) 31

8
through chemical titration, and phosphates (mg PO43- L-1) following Murphy & Riley 1
(1962). Discharge (L s-1) was obtained from automatic gauging stations or by measuring 2
channel width and water velocity at a minimum of five equal subsections of the stream 3
cross-section at each reach. 4
5
Sample identification and preliminary data handling 6
7
Macroinvertebrate samples were examined under a stereoscope at 10x, with all individuals 8
counted and identified to family level following Tachet et al. (2010), except for 9
Oligochaeta (82 taxa in total). We set taxonomic resolution at family level as a trade-off 10
between comparing streams from sufficient eco-regions and obtaining enough information 11
on the structure and composition of their macroinvertebrate communities. The usefulness 12
of the family level for detecting changes in the structure and functional composition of 13
stream macroinvertebrate communities has been demonstrated in previous studies (Dolédec 14
et al. 2000, Gayraud et al. 2003, Bonada et al. 2006, 2007b, Vieira et al. 2006). 15
16
Macroinvertebrate trait data were obtained from Tachet et al. (2010). We used 63 17
categories of 11 biological traits (Table 3a) and 50 categories of 10 ecological traits (Table 18
3b). Biological traits and their respective trait categories describe macroinvertebrate 19
variation in morphology (1. maximum potential size), life-cycle features (2. duration, 3. 20
number of cycles per year, 4. aquatic stages), reproduction, resilience or resistance ability 21
(5. reproductive modes, 6. dispersal, 7. resistant forms, 8. locomotion), physiology (9. 22
respiration), and feeding behaviour (10. Food and 11. feeding habits). Ecological traits and 23
trait categories reflect environmental preferences and behaviours associated with such 24
preferences. Following Usseglio-Polatera et al. (2000), the ecological traits considered in 25
this study focused on variables that reflected the spatial distribution of aquatic 26
macroinvertebrates (1. longitudinal, 2. transversal, and 3. altitudinal), their microhabitat 27
preferences (4. substrate, 5. water velocity, 6. temperature, 7. salinity, 8. pH, 9. saprobity), 28
and the productivity of the inhabited water bodies (10. trophic status). 29
30

9
The trait database assigned affinities of genera to each trait category using a fuzzy coding 1
approach (Chevenet et al. 1994, Bonada et al. 2007a), but because we worked at the family 2
level we averaged and re-scaled (0-5 scale) the affinities of all genera recorded within a 3
family, as in previous studies (Dolédec et al. 2000, Gayraud et al. 2003). In order to assess 4
effects of the level of taxonomic resolution on the structure of biological and ecological 5
trait data, we followed Gayraud et al. (2003) and calculated the Difference in Trait 6
Structure index (DTS) at the family and genus levels for a subset of our studied streams 7
(Cal Rodó, Can Vila, and La Rogativa) for which we had samples (n = 242) identified to 8
the genus level (except for Chironomidae, which were identified to sub-family). These 9
streams covered a gradient of summer drought conditions. DTS was computed for each 10
sample as follows: 11
12 13
where pi is the relative frequency of the trait category i at the first taxonomic level (i.e. 14
genus), qi is the relative frequency of the same trait category at the second taxonomic level 15
(i.e. family), and n is the number of trait categories in the trait. This measure varies from 16
zero (if relative frequencies of trait categories at both identification levels are identical) to 17
one (if relative frequencies of trait categories at the two identification levels are totally 18
different). It should be noted that relative frequencies of trait categories were obtained from 19
samples x trait matrices computed respectively for genus and family data as described in 20
the general procedure of data analysis (see below). To limit the number of variables 21
describing differences in data structure of the 11 biological plus 10 ecological traits at the 22
genus and family levels, we derived an overall index named Difference in Functional 23
Structure (DFS) by averaging the 21 DTSs for each sample. 24
25
Data analyses 26
27
As a first step, we studied the environmental heterogeneity associated with each spatial 28
scale. We used Principal Components Analysis (PCA) to assess differences between 29
reaches in the environmental variables measured in each season. Since the environmental 30

10
variables are measured with different scales and units, we computed PCA on standardized 1
values. Uncorrelated environmental variables with a high power of differentiation 2
(Pearson's r < 0.8) were retained for analysis. At lower spatial scales, we explored inter-3
seasonal changes in the relative frequencies of different mesohabitats and microhabitats by 4
means of Fisher’s exact tests on count data for each stream studied. We used Simpson’s 5
diversity index to describe changes between seasons in the relative frequency of each 6
mesohabitat and microhabitat type, and repeated-measures ANOVA to test for significant 7
differences in diversity between seasons for each aquatic regime (P, I-P, or I-D). 8
9
Our macroinvertebrate analyses were based on two sets of data in the form of matrices. The 10
first was a standard samples x taxa matrix (427 x 82) containing log-abundances at family 11
level. The second was a samples x trait categories matrix (427 x 113) obtained by 12
multiplying samples x taxa log-abundances (427 x 82) and taxa x trait category affinity (82 13
x 113) matrices. For each Surber sample, we computed Rao’s taxonomic and trait diversity 14
(HD) as follows:!15
16 17
where pi is the relative frequency of taxon (or trait category) i, pj is the relative frequency 18
of taxon (or trait category) j, and dij is the distance between the ith and jth taxa (or trait 19
categories) according to Rao (1982) and Champely & Chessel (2002). We obtained 20
taxonomic distances at family and order levels following Clarke & Warwick’s (1998) 21
procedure. For traits, we computed Rao’s diversity for each trait and sample, although we 22
finally derived an average value. This was a weighted average, where weights were the 23
numbers of trait categories within each biological trait. No distance measurement was used 24
between traits, dij being set to 1 for traits, and so Rao’s diversity was equal to the Gini-25
Simpson diversity index. 26
27
The variation due to each spatial scale was separately assessed for each metric with nested 28
Generalized Linear Models (GLMs; Nelder & Wedderburn 1972), with the above-29
mentioned three nested factors. We analyzed the data from the wet and dry seasons 30

11
separately to look for changes in multi-scale variation partitioning associated with 1
hydrological change. The GLMs had the following general equation: 2
3
Yijkl = µ + αi + Bij + Cijk + εijkl 4
5
where Yijkl is the expected value of any given metric for a single observation, µ equals the 6
parametric mean of each metric distribution, αi is the fixed effect of the ith stream, Bij is the 7
contribution for the jth mesohabitat of the ith stream, Cijk is the contribution for the kth 8
microhabitat of the jth mesohabitat of the ith stream, and εijkl is the error term of the lth item 9
in the kth microhabitat of the jth mesohabitat of the ith stream (which corresponds to within-10
microhabitat Surber-sample variation). It is important to note that levels within nested 11
factors, especially mesohabitat and microhabitat, did not represent a random sample of all 12
the possible levels but were deliberately arranged, so factors were treated as fixed. Hence, 13
each factor was compared against the error term (Quinn & Keough 2002). In the GLMs, we 14
used deviances to estimate the percentage of variation accounted for by each spatial scale. 15
The community composition of samples was analyzed through Permutational Multivariate 16
Analysis of Variance using distance matrices of macroinvertebrate abundance data 17
(Anderson 2001) with the same factors and the same analytical constraints as in the above-18
cited GLMs. In total, 999 permutations were performed on the Euclidean distance matrix 19
obtained from log-transformed macroinvertebrate abundances. 20
21
Finally, we used the fourth-corner methodology to look for associations between stream 22
types and aquatic macroinvertebrate traits (Legendre et al. 1997). This procedure measured 23
the linkages between three tables: a table L (427 x 82) containing the log-abundances of 82 24
macroinvertebrate taxa in 427 samples, a second table R (427 x 3) with the three aquatic 25
regimes (P, I-P, and I-D) coded as dummy variables for each sample, and a third table Q 26
(82 x 113) describing 113 trait categories for the 82 taxa. Through matrix algebra, the 27
fourth-corner method estimates parameters describing the relationships between habitat 28
characteristics and traits. The link between the aquatic regime and traits was measured 29
through a correlation coefficient whose significance was tested by a permutation procedure. 30
According to the update by Dray & Legendre (2008) of the fourth-corner method, we first 31

12
permuted samples to test the null hypothesis that taxa log-abundances and aquatic regimes 1
were unrelated (permutation model 2, repeated 999 times). Next we permuted taxa to test a 2
second null hypothesis that taxa log-abundances and traits were unrelated (permutation 3
model 4, repeated 999 times). Only when both permutation tests were significant did we 4
consider that aquatic regimes and particular traits were effectively linked. In a conservative 5
manner, we considered p-values for each association equal to the maximum of p-values of 6
the two permutation tests. The Holm correction for multiple tests was applied on the 7
statistics obtained from the fourth-corner analysis. 8
9
All statistical analyses were performed with packages from R 2.13.1 statistical software (R 10
Development Core Team 2011). We used the base package for GLMs, repeated-measures 11
ANOVA and Fisher’s exact tests, the vegan package for PCA and Permutational 12
Multivariate Analysis of Variance, and the ade4 package for the computation of taxonomic 13
distances and fourth-corner analyses. 14
15
Results 16
17
Heterogeneity associated with each spatial scale 18
19
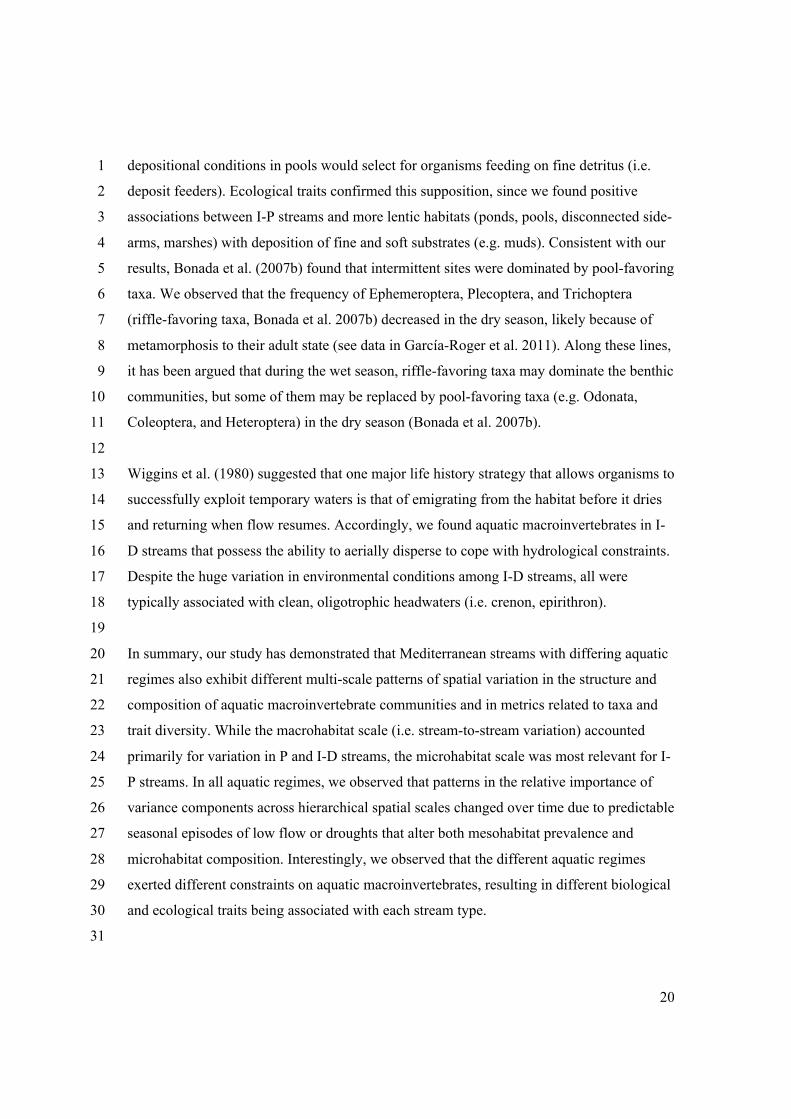
PCA summarized environmental differences between the streams (Fig. 2a-b). The first axis 20
explained 37.2% of total variance and was positively related to temperature (loading = 21
0.425), and negatively to conductivity (loading = -0.447) and oxygen concentration 22
(loading = -0.442). The second axis, which explained 21.4% of variance, was negatively 23
related to nitrate concentration (loading = -0.651), and was interpreted as a negative 24
gradient of moderate eutrophy. When comparing the wet (Fig. 2a) and the dry season (Fig. 25
2b), we observed that ellipsoids of data dispersion at 95% confidence increased for P and I-26
P streams, reflecting a higher variability of conditions in the dry season. Of course, there 27
were no data for I-D streams in the dry season. 28
29
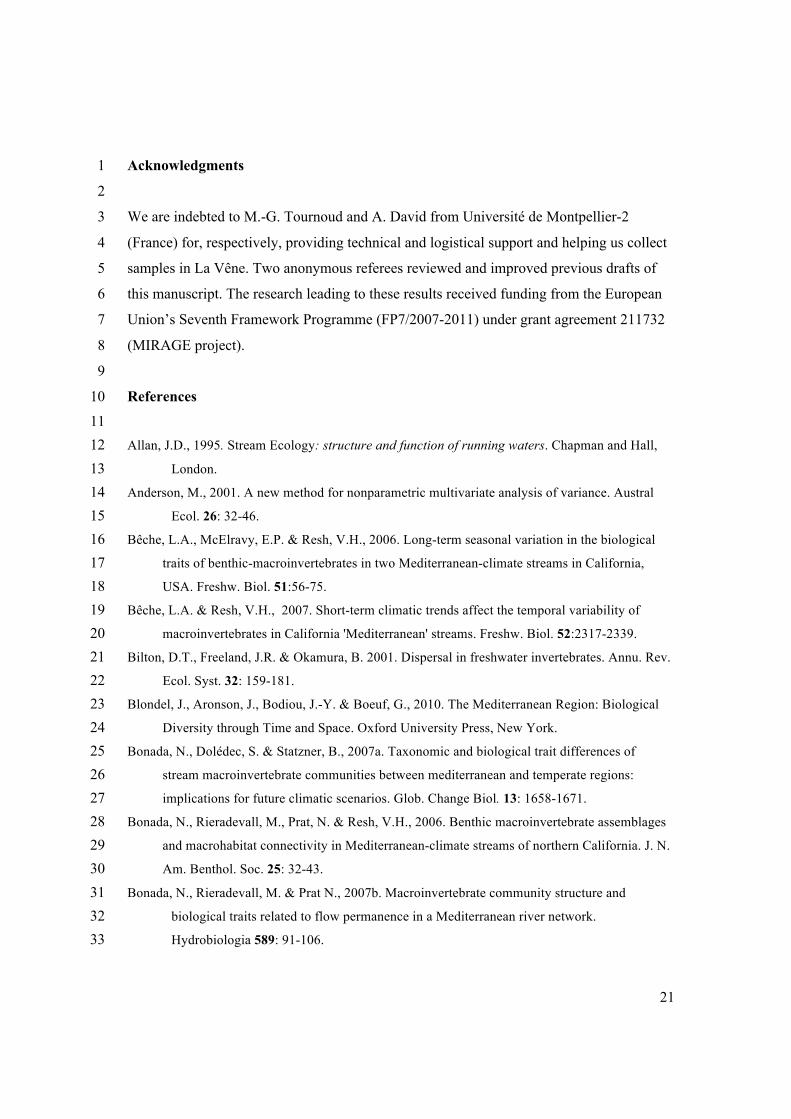
Seasonal differences were also noticeable at the mesohabitat and microhabitat scales, 30
especially in I-P and I-D streams (Fig. 3). The prevalence of riffles decreased in the dry 31

13
season, although the change was only marginally significant in P streams (Fisher’s Exact 1
test; p-value = 0.0797), in which the variety of mesohabitats as estimated by Simpson’s 2
diversity index did not differ significantly between seasons (repeated-measures ANOVA, 3
p-value = 0.420). In I-P streams, pools became the dominant mesohabitat by a highly 4
significant margin in the dry season (Fisher’s Exact test; p-value < 0.001), during which 5
heterogeneity at this spatial scale decreased significantly (repeated-measures ANOVA, p-6
value = 0.003). 7
8
A great variety of substrata were observed at the microhabitat scale (Fig. 3). Differences in 9
microhabitat composition were especially marked between streams. In Table 4, we show 10
the results of Fisher’s Exact tests for changes in microhabitat composition between seasons 11
for P and I-P streams. While in general P streams did not vary in microhabitat composition 12
between seasons (only KOL at Evrotas showed a significant change in microhabitat 13
composition), I-P streams, with only one exception (2010 was a wet year in Can Vila), 14
shifted in microhabitat composition between seasons to a dominance of organic substrates 15
(Table 4). However, total microhabitat diversity did not differ in either P streams (repeated-16
measures ANOVA, p-value = 0.799) or I-P streams (p-value = 0.147), although a slight 17
tendency to homogenization was observed in the latter. 18
19
Effect of taxonomic resolution on the functional description of the aquatic 20
macroinvertebrate communities 21
22
Prior to further analyses, we confirmed that taxonomic resolution (family cf. genus) had 23
little bearing on the functional description of the communities based on biological traits. 24
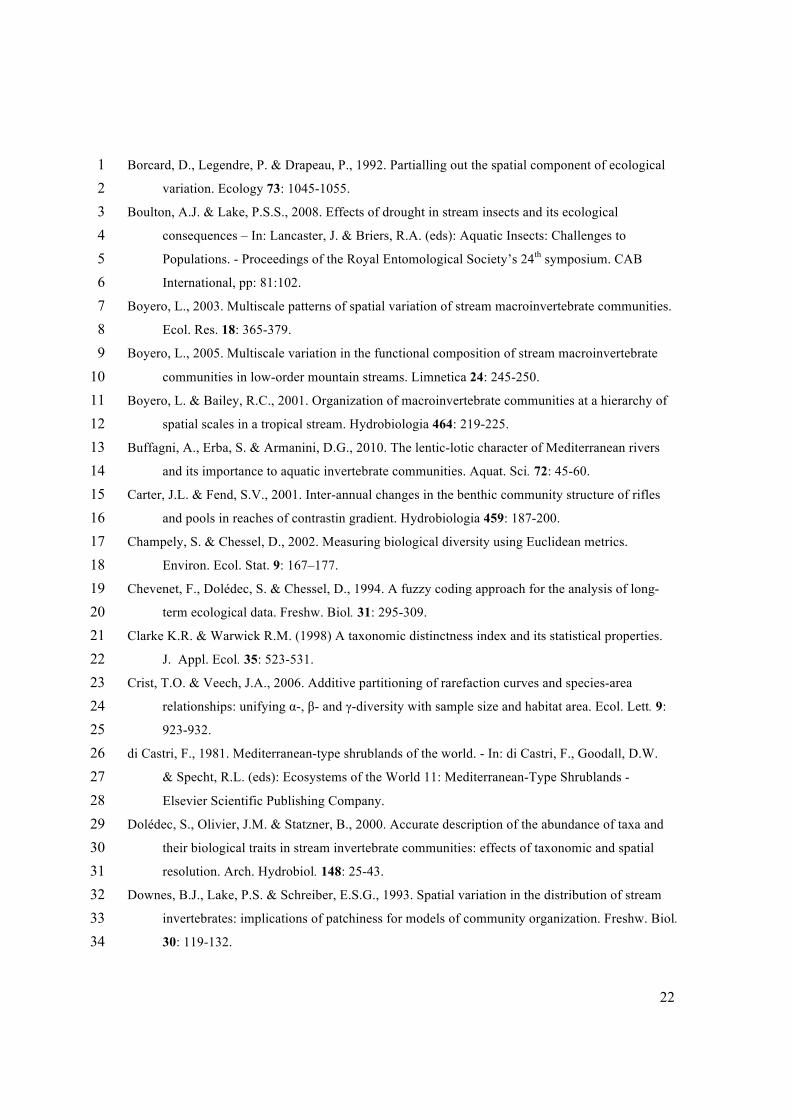
Despite differences between the subset of three streams considered (Fig. 4), overall median 25
similarity was high, at nearly 80% (DFS-values ~ 0.2), indicating that reducing taxonomic 26
resolution to family level had only minor effects on the functional description of the 27
aquatic macroinvertebrate communities. 28
29
30
31

14
Relative importance of spatial scales 1
2
The hierarchical structure of stream habitats affected the significance and relative 3
importance of the different spatial scales, as shown by our nested analyses (Table 5). 4
In general, results for each aquatic regime were consistent for the different metrics used. 5
6
The relative importance of each spatial scale differed between aquatic regimes, and patterns 7
also varied between seasons (Fig. 5). In all cases, a substantial proportion of variation in 8
community composition and metrics was explained. For P streams in the wet season, 9
results were consistent across metrics, and streams accounted for the largest proportion of 10
explained variation in all cases (30-40%), followed by microhabitats (20-30%) and 11
mesohabitats (4-20%). All scales were significant for all metrics (Table 5a). In the dry 12
season, partitioning of explained variance was similar, but the proportion of unexplained 13
variance increased. Among explained variance, the relative importance of the microhabitat 14
scale decreased compared with the wet season. No significant effects were associated with 15
this spatial scale in any metric (Table 5b). 16
17
For I-P streams in the wet season, the scale accounting for the largest proportion of 18
variance for two of the three metrics was the microhabitat (25-40%), followed by streams 19
(10-30%) and mesohabitats (8-12%). Interestingly, differences in trait diversity between 20
mesohabitats were not significant in the wet season (Table 5a). The largest spatial scale 21
accounted for most of the variance in community composition, which was expected given 22
the wide biogeographical range explored in this study. In the dry season, the relative 23
importance of all spatial scales decreased, offset by an increase in unexplained variation 24
due to within-sample variability (40-65%). Nevertheless, the partitioning of explained 25
variance did not differ from that observed in the wet season, with microhabitats accounting 26
for most variation (16-30%). For the diversity metrics, significant effects were observed at 27
the microhabitat scale in the dry season, while no differences were seen for either 28
mesohabitats or streams (Table 5b). In the case of community composition, most variation 29
was explained (approx. 60%). Interestingly, significant effects were observed at all spatial 30
scales for this metric in the dry season. 31

15
For I-D streams, with data available only in the wet season, the largest spatial scale 1
accounted for most of the variation in all metrics (45-90%). And for the two diversity 2
metrics, it was the only significant factor. Again, significant effects were observed for 3
community composition at all scales, with differences between streams, between riffles and 4
pools within streams, and between microhabitats within mesohabitats (Table 5a). 5
6
Relationships between aquatic regimes and aquatic macroinvertebrate traits 7
8
The fourth-corner analysis produced 41 significant relationships between trait categories 9
and aquatic regimes (Table 6). Only 7 of the 21 biological (life-cycle duration, number of 10
cycles per year, food) and ecological traits (altitude, temperature, salinity, pH) had no 11
significant relationships. 12
13
P streams harbored larger macroinvertebrates (> 2-4 cm maximal size) than I-P streams 14
(0.5-1 cm maximal size), typically for the entire life cycle (i.e. up to adults), with 15
adaptations for aquatic dispersal (either active or passive). In contrast, I-D streams were 16
associated with aerial passive mechanisms of dispersion. Adaptations to flow conditions in 17
each aquatic regime were also significant for respiration modes (i.e. gills in P streams, and 18
spiracles in I-P streams) and feeding habits (e.g. aquatic macroinvertebrates from I-P 19
streams were typically deposit feeders, likely because of depositional conditions in summer 20
pools). 21
22
There were a handful of significant relationships between ecological traits and the habitat 23
characteristics of each aquatic regime. Streams with P aquatic regimes usually had flowing 24
channels with hard, mineral substrates, whereas I-P streams typically had lentic habitats (no 25
flow) as ponds, pools, or marshes, with soft substrates (e.g. muds), and I-D streams 26
typically had clean, oligotrophic, temporary headwaters (i.e. crenon, epirithron). 27
28
29
30
31

16
Discussion 1
2
Aquatic regimes and the relative importance of spatial scales on community metrics 3
4
It is generally assumed that the spatial scale at which biological communities exhibit the 5
greatest variation is the scale over which important physicochemical gradients or biotic 6
interactions control assemblage composition (Li et al. 2001). Interestingly, we observed 7
that regardless of the metrics used to describe aquatic macroinvertebrate communities, 8
streams differing in aquatic regimes also differed in the spatial scale at which the highest 9
proportion of variation was explained (the macrohabitat scale in P and I-D streams, but the 10
microhabitat in I-P streams). In general, for the wet season, all nested models displayed a 11
considerable amount of explained variation (range: 40-60%). The hydrological conditions 12
during the dry season differed between aquatic regimes. While P streams kept pool-riffle 13
sequences, I-P streams typically lost their riffles and were reduced to a chain of 14
disconnected pools, and I-D streams completely dried. The present study also demonstrates 15
that environmental changes in the dry season typically increased the proportion of 16
unexplained variation, but patterns of explained variation remained the same for each 17
aquatic regime. Furthermore, this study supports the use of nested designs for examining 18
spatial scales of variation in Mediterranean streams with different aquatic regimes. 19
20
At the macrohabitat scale, P streams exhibited a wide range of physicochemical conditions 21
in both the wet and dry seasons. This was consistent with the importance of this spatial 22
scale in explained variation in both seasons for all metrics considered. Under P aquatic 23
regimes, the mesohabitat scale accounted for a much lower proportion of variation for all 24
metrics, despite the existence of riffles and pools and their persistence in the dry season. 25
Previous studies have pointed out that taxon diversity does not differ in general between 26
mesohabitats in P streams when inter-annual differences in discharge are low (Scullion et 27
al. 1982, McElravy et al. 1989, Carter and Fend 2001), and at this spatial scale, nor did trait 28
diversity. To clarify, this does not mean that similar traits were associated with pools and 29
riffles, but that the diversity of traits and trait categories was similar in both mesohabitats. 30
This suggests that although trait structure may change in response to the main 31

17
environmental factors in each mesohabitat, as evidenced by the fourth-corner analysis, the 1
variety of life-history strategies needed to cope with the particular constraints in each 2
mesohabitat remains more or less constant. Note, too, that pool and riffle communities have 3
been shown to differ in taxonomic composition (García-Roger et al. 2011). The importance 4
of the microhabitat scale, nested within mesohabitats, was also low for this aquatic regime. 5
Moreover, we observed that P streams were in general more stable with respect to 6
microhabitat composition between seasons than streams subjected to the I-P aquatic regime 7
(Table 4). 8
9
Under the I-P aquatic regime, we found that the microhabitat scale accounted for most of 10
the explained variation in the two diversity metrics considered in this study. It might be 11
argued that the diminished importance of the stream spatial scale could be attributed to the 12
lower number of I-P streams studied compared with P streams. Nevertheless, our result is 13
similar to previous findings by Downes et al. (1993) and Boyero (2003), who observed that 14
lower spatial scales explained most of the variation in metrics related to richness and 15
diversity in Australian and Mediterranean streams with even fewer stream replicates. The 16
importance of the microhabitat scale was also highlighted by Robson et al. (2005), who 17
employed a nested approach to partition the variation due to several spatial scales from 18
microhabitats (individual stones) to stream types (perennial and intermittent) in Australia. 19
However, in that case, the largest source of variation in taxa richness was found to be 20
stream type, which could obscure differences at lower spatial scales. 21
22
For taxonomic composition, we observed that the stream scale was responsible for the 23
highest proportion of explained variation, which makes sense considering the wide 24
geographical range covered in this study. The proportion of variation explained by the three 25
spatial scales considered decreased in the dry season, but the relative importance of the 26
spatial scales in explained variation remained nearly constant. Mesohabitat and 27
microhabitat heterogeneity decreased in the dry season (Table 4), which is consistent with 28
the decrease in the importance of these two spatial scales observed in our nested analysis. 29
Microhabitats dominating pools during this season were essentially organic (e.g. deposits 30
of organic matter, submerged and emergent macrophytes) as previously reported by 31

18
García-Roger et al. (2011). Unexplained variation in taxa and trait diversity metrics, as well 1
as in taxonomic composition,!increased in the dry season due to inter-sample variation, a 2
pattern also observed by Heino & Korsu (2008) and Giri et al. (2010), which ultimately 3
may be a consequence of divergent community trajectories in the remaining pool habitats 4
(e.g. differences in the degree and duration of disconnection, Bonada et al. 2006). 5
Finally, we observed that I-D streams presented a wider range of conditions (according to 6
the PCA biplot in Fig. 2a) than I-P and P streams in the wet season. The huge variability 7
observed in I-D streams is consistent with the relative importance of the macrohabitat scale 8
(i.e. stream), as found also by Bêche et al. (2006). The strong effect of stream-to-stream 9
variability on all metrics studied in these streams likely prevented the detection of 10
differences at lower spatial scales. Moreover, it has been argued by Gallart et al. (2012) 11
that the characteristics of the aquatic macroinvertebrates inhabiting I-D streams (i.e. the 12
aquatic assemblage and the set of traits) are likely to differ from stream to stream in this 13
aquatic regime because of the large variability in habitat predictability associated with 14
them. 15
16
Relationships between aquatic regimes and aquatic macroinvertebrate traits 17
18
It has long been recognized that biological traits of macroinvertebrate communities such as 19
respiration, reproduction, locomotion, life cycle duration, and dispersal capacity differ 20
according to stream flow duration and predictability, and thus habitat persistence (Williams 21
1996). The analysis of biological traits in stream macroinvertebrate communities has 22
received a great impetus in the last decade (Usseglio-Polatera et al. 2000, Vieira et al. 2006, 23
Statzner & Bêche 2010), and Bonada et al. (2007b) have shown that different biological 24
traits are associated with permanent, intermittent, and ephemeral streams, which differ in 25
flow regimes and substrata. Statzner & Bêche (2010) have reviewed trait category 26
responses reported in the literature in relation to changes in discharge, emphasizing that 27
biological trait responses to flow variation are extraordinarily diverse, and thus it is 28
difficult to establish unequivocal relationships between aquatic regimes and traits. We 29
found results consistent with previous studies of Mediterranean-climate streams (Bêche et 30
al., 2006, Bonada et al., 2007b) and extended these analyses by including ecological traits, 31
19
which reflect the environmental preferences of aquatic macroinvertebrates and the 1
behaviours associated with those preferences (Vieira et al. 2006). 2
3
In contrast to the results obtained by Bonada et al. (2007b), who found only one significant 4
trait associated with permanent streams (aquatic eggs), we found a large set of significant 5
biological and ecological traits for P streams. For biological traits, the long-term stability of 6
P streams appears to permit the development of large-sized macroinvertebrates (>2-4 cm in 7
maximal size) and wholly aquatic life cycles (i.e. up to adult stages). Moreover, stable 8
conditions are compatible with asexual modes of reproduction since clonal proliferation 9
allows a more rapid colonization of the habitat than sexual reproduction (Bilton et al. 10
2001). Consistent with the long-term persistence of flow, the mechanisms of dispersal that 11
were significantly associated with P streams were either active or passive but always 12
aquatic-based. The production of drought resistant forms is unnecessary in a permanent 13
habitat, which explains why we found a negative relationship between this aquatic regime 14
and the ability to produce a particular kind of protective case (cocoons). For ecological 15
traits, we found that aquatic macroinvertebrates from P streams preferentially inhabit river 16
channels with substrates composed of flags, boulders, cobbles, and pebbles. According to 17
the NC Division of Water Quality (2010), the bed of P streams is often comprised of 18
coarser particles than other temporary stream types (e.g. I-P and I-D) due to consistent 19
stream-forming flows, which transport finer particles downstream. 20
21
I-P streams had positive associations with smaller maximal body sizes (>0.5-1 cm). We 22
believe that enclosure and overcrowding in the remaining isolated pools may typically lead 23
to an increase in stress conditions. For instance, increasing competition and predation may 24
lead to smaller sizes. Consistently, we found negative associations in I-P streams with 25
larger macroinvertebrate sizes (>2-4 cm) and with aquatic modes of dispersal, both of 26
which were positively associated with P streams. These results are similar to those of 27
Bonada et al. (2007b) and Finn et al. (2008, reviewed by Statzner & Bêche 2010). 28
Considering the prevalence of lentic conditions in the dry season and the progressive 29
depletion of dissolved oxygen in the remaining pools, our finding of a positive association 30
between I-P streams and spiracles for respiration seems reasonable. Furthermore, 31
20
depositional conditions in pools would select for organisms feeding on fine detritus (i.e. 1
deposit feeders). Ecological traits confirmed this supposition, since we found positive 2
associations between I-P streams and more lentic habitats (ponds, pools, disconnected side-3
arms, marshes) with deposition of fine and soft substrates (e.g. muds). Consistent with our 4
results, Bonada et al. (2007b) found that intermittent sites were dominated by pool-favoring 5
taxa. We observed that the frequency of Ephemeroptera, Plecoptera, and Trichoptera 6
(riffle-favoring taxa, Bonada et al. 2007b) decreased in the dry season, likely because of 7
metamorphosis to their adult state (see data in García-Roger et al. 2011). Along these lines, 8
it has been argued that during the wet season, riffle-favoring taxa may dominate the benthic 9
communities, but some of them may be replaced by pool-favoring taxa (e.g. Odonata, 10
Coleoptera, and Heteroptera) in the dry season (Bonada et al. 2007b). !11
12
Wiggins et al. (1980) suggested that one major life history strategy that allows organisms to 13
successfully exploit temporary waters is that of emigrating from the habitat before it dries 14
and returning when flow resumes. Accordingly, we found aquatic macroinvertebrates in I-15
D streams that possess the ability to aerially disperse to cope with hydrological constraints. 16
Despite the huge variation in environmental conditions among I-D streams, all were 17
typically associated with clean, oligotrophic headwaters (i.e. crenon, epirithron). 18
19
In summary, our study has demonstrated that Mediterranean streams with differing aquatic 20
regimes also exhibit different multi-scale patterns of spatial variation in the structure and 21
composition of aquatic macroinvertebrate communities and in metrics related to taxa and 22
trait diversity. While the macrohabitat scale (i.e. stream-to-stream variation) accounted 23
primarily for variation in P and I-D streams, the microhabitat scale was most relevant for I-24
P streams. In all aquatic regimes, we observed that patterns in the relative importance of 25
variance components across hierarchical spatial scales changed over time due to predictable 26
seasonal episodes of low flow or droughts that alter both mesohabitat prevalence and 27
microhabitat composition. Interestingly, we observed that the different aquatic regimes 28
exerted different constraints on aquatic macroinvertebrates, resulting in different biological 29
and ecological traits being associated with each stream type. 30
31
21
Acknowledgments 1
2
We are indebted to M.-G. Tournoud and A. David from Université de Montpellier-2 3
(France) for, respectively, providing technical and logistical support and helping us collect 4
samples in La Vêne. Two anonymous referees reviewed and improved previous drafts of 5
this manuscript. The research leading to these results received funding from the European 6
Union’s Seventh Framework Programme (FP7/2007-2011) under grant agreement 211732 7
(MIRAGE project). 8
9
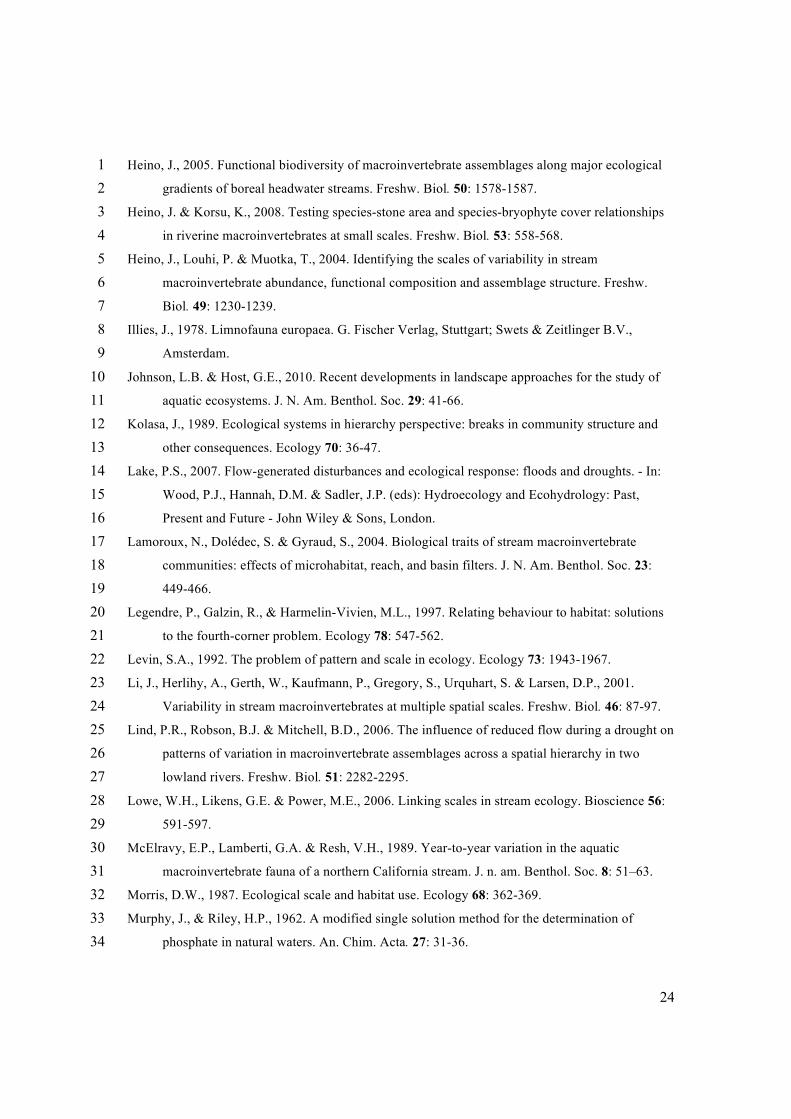
References 10
11 Allan, J.D., 1995. Stream Ecology: structure and function of running waters. Chapman and Hall, 12
London. 13 Anderson, M., 2001. A new method for nonparametric multivariate analysis of variance. Austral 14
Ecol. 26: 32-46. 15 Bêche, L.A., McElravy, E.P. & Resh, V.H., 2006. Long-term seasonal variation in the biological 16
traits of benthic-macroinvertebrates in two Mediterranean-climate streams in California, 17 USA. Freshw. Biol. 51:56-75. 18
Bêche, L.A. & Resh, V.H., 2007. Short-term climatic trends affect the temporal variability of 19 macroinvertebrates in California 'Mediterranean' streams. Freshw. Biol. 52:2317-2339. 20
Bilton, D.T., Freeland, J.R. & Okamura, B. 2001. Dispersal in freshwater invertebrates. Annu. Rev. 21 Ecol. Syst. 32: 159-181. 22
Blondel, J., Aronson, J., Bodiou, J.-Y. & Boeuf, G., 2010. The Mediterranean Region: Biological 23 Diversity through Time and Space. Oxford University Press, New York. 24
Bonada, N., Dolédec, S. & Statzner, B., 2007a. Taxonomic and biological trait differences of 25 stream macroinvertebrate communities between mediterranean and temperate regions: 26 implications for future climatic scenarios. Glob. Change Biol. 13: 1658-1671. 27
Bonada, N., Rieradevall, M., Prat, N. & Resh, V.H., 2006. Benthic macroinvertebrate assemblages 28 and macrohabitat connectivity in Mediterranean-climate streams of northern California. J. N. 29 Am. Benthol. Soc. 25: 32-43. 30
Bonada, N., Rieradevall, M. & Prat N., 2007b. Macroinvertebrate community structure and 31 biological traits related to flow permanence in a Mediterranean river network. 32 Hydrobiologia 589: 91-106. 33
22
Borcard, D., Legendre, P. & Drapeau, P., 1992. Partialling out the spatial component of ecological 1 variation. Ecology 73: 1045-1055. 2
Boulton, A.J. & Lake, P.S.S., 2008. Effects of drought in stream insects and its ecological 3 consequences – In: Lancaster, J. & Briers, R.A. (eds): Aquatic Insects: Challenges to 4 Populations. - Proceedings of the Royal Entomological Society’s 24th symposium. CAB 5 International, pp: 81:102. 6
Boyero, L., 2003. Multiscale patterns of spatial variation of stream macroinvertebrate communities. 7 Ecol. Res. 18: 365-379. 8
Boyero, L., 2005. Multiscale variation in the functional composition of stream macroinvertebrate 9 communities in low-order mountain streams. Limnetica 24: 245-250. 10
Boyero, L. & Bailey, R.C., 2001. Organization of macroinvertebrate communities at a hierarchy of 11 spatial scales in a tropical stream. Hydrobiologia 464: 219-225. 12
Buffagni, A., Erba, S. & Armanini, D.G., 2010. The lentic-lotic character of Mediterranean rivers 13 and its importance to aquatic invertebrate communities. Aquat. Sci. 72: 45-60. 14
Carter, J.L. & Fend, S.V., 2001. Inter-annual changes in the benthic community structure of rifles 15 and pools in reaches of contrastin gradient. Hydrobiologia 459: 187-200. 16
Champely, S. & Chessel, D., 2002. Measuring biological diversity using Euclidean metrics. 17 Environ. Ecol. Stat. 9: 167–177. 18
Chevenet, F., Dolédec, S. & Chessel, D., 1994. A fuzzy coding approach for the analysis of long-19 term ecological data. Freshw. Biol. 31: 295-309. 20
Clarke K.R. & Warwick R.M. (1998) A taxonomic distinctness index and its statistical properties. 21 J. Appl. Ecol. 35: 523-531. 22
Crist, T.O. & Veech, J.A., 2006. Additive partitioning of rarefaction curves and species-area 23 relationships: unifying α-, β- and γ-diversity with sample size and habitat area. Ecol. Lett. 9: 24 923-932. 25
di Castri, F., 1981. Mediterranean-type shrublands of the world. - In: di Castri, F., Goodall, D.W. 26 & Specht, R.L. (eds): Ecosystems of the World 11: Mediterranean-Type Shrublands - 27 Elsevier Scientific Publishing Company. 28
Dolédec, S., Olivier, J.M. & Statzner, B., 2000. Accurate description of the abundance of taxa and 29 their biological traits in stream invertebrate communities: effects of taxonomic and spatial 30 resolution. Arch. Hydrobiol. 148: 25-43. 31
Downes, B.J., Lake, P.S. & Schreiber, E.S.G., 1993. Spatial variation in the distribution of stream 32 invertebrates: implications of patchiness for models of community organization. Freshw. Biol. 33 30: 119-132. 34

23
Downes, B.J., Lake, P.S., Schreiber, E.S.G. & Glaister, A., 2000. Habitat structure, resources and 1 diversity: the separate effects of surface roughness and macroalgae on stream invertebrates. 2 Oecologia 123: 569-581. 3
Dray, S. & Legendre, P., 2008. Testing the species traits-environment relationships: the fourth-4 corner problem revisited. Ecology 89: 3400-3412. 5
Dungan, J.L., Perry, J.N., Dale, M.R.T, Legendre, P., Citron-Pousty, S., Fortin, M.-J., Jakomulska, 6 A., Miriti, M., Rosenberg, M.S., 2002. A balanced view of scale in spatial statistical analysis. 7 Ecography 25: 626– 640. 8
Finn, D.S. & Poff, N.L., 2005. Variability and convergence in benthic communities along the 9 longitudinal gradients of four physically similar Rocky Mountain streams. Freshw. Biology 10 50: 243-261. 11
Finn, D.S., Adams, S.R., Whiles, M.R. & Garvey, J.E., 2008. Biological responses to contrasting 12 hydrology in backwaters of Upper Mississippi river navigation pool 25. Env. Manag. 41: 13 468-486. 14
Frissell, C.A., Liss, W.J., Warren, E. & Hurley, M.D., 1986. A hierarchical framework for stream 15 habitat classification: viewing streams in a watershed context. Environ. Manag. 10: 199-214. 16
García-Roger, E.M., Sánchez-Montoya, M.M., Gómez, R., Suárez, M.L., Vidal-Abarca, M.R., 17 Latron J., Rieradevall, M. & Prat, N., 2011. Do seasonal changes in habitat features influence 18 aquatic macroinvertebrate assemblages in perennial vs temporary Mediterranean streams? 19 Aq. Sci. 73: 567-579. 20
Gallart, F., Prat, N., García-Roger, E.M., Latron, J., Rieradevall, M., Llorens, P., Barberá, G.G., 21 Brito, D, De Girolamo, A.M., Lo Porto, A., Buffagni, A., Erba, S., Neves, R., Nikolaidis, 22 N.P., Perrin, J.L., Querner, E.P., Quiñonero, J.M., Tournoud, M.G., Tzoraki, O., Skoukulidis, 23 N., Gomez, R., Sanchez-Montoya, M. & Froebrich, J., 2012. A novel approach to analysing 24 the regimes of temporary streams in relation to their controls on the composition and 25 structure of aquatic biota. Hydrol. Earth Syst. Sci. 16: 3165-3182. 26
Gasith, A. & Resh, V.H., 1999. Streams in Mediterranean climate regions: Abiotic influences and 27 biotic responses to predictable seasonal events. Annu. Rev. Ecol. Syst. 30: 51-81. 28
Gayraud, S., Statzner, B., Bady, P., Haybach, A., Schöll, F., Usseglio-Polatera, P. & Bacchi, M., 29 2003. Invertebrate traits for the biomonitoring of large European rivers: an initial assessment 30 of alternative metrics. Freshw. Biol. 48: 2045-2064. 31
Giri, M.L., Chester, E.T. & Robson, B.J., 2010. Does sampling method or microhabitat type control 32 patterns of macroinvertebrate assemblage structure across spatial scales in rivers? Mar. 33 Freshw. Res. 61: 1313-1317. 34
24
Heino, J., 2005. Functional biodiversity of macroinvertebrate assemblages along major ecological 1 gradients of boreal headwater streams. Freshw. Biol. 50: 1578-1587. 2
Heino, J. & Korsu, K., 2008. Testing species-stone area and species-bryophyte cover relationships 3 in riverine macroinvertebrates at small scales. Freshw. Biol. 53: 558-568. 4
Heino, J., Louhi, P. & Muotka, T., 2004. Identifying the scales of variability in stream 5 macroinvertebrate abundance, functional composition and assemblage structure. Freshw. 6 Biol. 49: 1230-1239. 7
Illies, J., 1978. Limnofauna europaea. G. Fischer Verlag, Stuttgart; Swets & Zeitlinger B.V., 8 Amsterdam. 9
Johnson, L.B. & Host, G.E., 2010. Recent developments in landscape approaches for the study of 10 aquatic ecosystems. J. N. Am. Benthol. Soc. 29: 41-66. 11
Kolasa, J., 1989. Ecological systems in hierarchy perspective: breaks in community structure and 12 other consequences. Ecology 70: 36-47. 13
Lake, P.S., 2007. Flow-generated disturbances and ecological response: floods and droughts. - In: 14 Wood, P.J., Hannah, D.M. & Sadler, J.P. (eds): Hydroecology and Ecohydrology: Past, 15 Present and Future - John Wiley & Sons, London. 16
Lamoroux, N., Dolédec, S. & Gyraud, S., 2004. Biological traits of stream macroinvertebrate 17 communities: effects of microhabitat, reach, and basin filters. J. N. Am. Benthol. Soc. 23: 18 449-466. 19
Legendre, P., Galzin, R., & Harmelin-Vivien, M.L., 1997. Relating behaviour to habitat: solutions 20 to the fourth-corner problem. Ecology 78: 547-562. 21
Levin, S.A., 1992. The problem of pattern and scale in ecology. Ecology 73: 1943-1967. 22 Li, J., Herlihy, A., Gerth, W., Kaufmann, P., Gregory, S., Urquhart, S. & Larsen, D.P., 2001. 23
Variability in stream macroinvertebrates at multiple spatial scales. Freshw. Biol. 46: 87-97. 24 Lind, P.R., Robson, B.J. & Mitchell, B.D., 2006. The influence of reduced flow during a drought on 25
patterns of variation in macroinvertebrate assemblages across a spatial hierarchy in two 26 lowland rivers. Freshw. Biol. 51: 2282-2295. 27
Lowe, W.H., Likens, G.E. & Power, M.E., 2006. Linking scales in stream ecology. Bioscience 56: 28 591-597. 29
McElravy, E.P., Lamberti, G.A. & Resh, V.H., 1989. Year-to-year variation in the aquatic 30 macroinvertebrate fauna of a northern California stream. J. n. am. Benthol. Soc. 8: 51–63. 31
Morris, D.W., 1987. Ecological scale and habitat use. Ecology 68: 362-369. 32 Murphy, J., & Riley, H.P., 1962. A modified single solution method for the determination of 33
phosphate in natural waters. An. Chim. Acta. 27: 31-36. 34

25
Mykrä, H., Heino, J. & Muotka, T., 2004. Variability of lotic macroinvertebrate assemblages and 1 habitat characteristics across hierarchical landscape classifications. Environ. Manag. 34: 2 341–352. 3
Mykrä, H., Aroviita, J., Hämäläinen, H., Kotanen, J., Vuori, K.-M. & Muotka, T., 2008. Assessing 4 stream condition using macroinvertebrates and macrophytes: concordance of community 5 responses to human impact. Fund. Appl. Limnol. 172: 191–203. 6
NC Division of Water Quality, 2010. Methodology for Identification of Intermittent and Perennial 7 Streams and their Origins, Version 4.11. North Carolina Department of Environment and 8 Natural Resources, Division of Water Quality. Raleigh, NC. 9
Nelder, J.A. & Wedderburn, R.W., 1972. Generalized linear models. J. Roy. Stat. Soc. Ser. A 135: 10 370–384. 11
Parsons, M., Thoms, M.C. & Norris, R.H., 2004. Using Hierarchy to Select Scales of Measurement 12 in Multiscale Studies of Stream Macroinvertebrate Assemblages. J. N. Am. Benthol. Soc. 13 23: 157-170. 14
Pavoine, S. & Dolédec, S., 2005. The apportionment of quadratic entropy: a useful alternative for 15 partitioning diversity in ecological data. Environ. Ecol. Stat. 12: 125-138. 16
Poff, N.L., 1997. Landscape filters and species traits: towards mechanistic understanding and 17 prediction in stream ecology. J. N. Am. Benthol. Soc. 16: 391-409. 18
Poff, N.L. & Ward, J.V., 1990. Physical habitat template of lotic systems: recovery in the context of 19 historical pattern of spatiotemporal heterogeneity. Environ. Manag. 14: 629-645. 20
Quinn, G.P. & Keough, M.J., 2002. Experimental design and data analysis for biologists. 21 Cambridge University Press, Cambridge. 22
R Development Core Team, 2011. R: A language and environment for statistical computing. R 23 Foundation for Statistical Computing, Vienna, Austria. ISBN 3-900051-07-0, URL 24 http://www.R-project.org. 25
Rao, C.R., 1982. Diversity: Its measurement, decomposition, apportionment and analysis. Sankhya 26 Ser. A. 44: 1-22. 27
Robson, B.J., Chester, E.T. & Austin, C.M., 2011. Why life history information matters: drought 28 refuges and macroinvertebrate persistence in non-perennial streams subject to a drier climate. 29 Mar. Freshw. Res. 62: 801-810. 30
Robson, B.J., Hogan, M. & Forrester, T., 2005. Hierarchical patterns of invertebrate assemblage 31 structure in stony upland streams change with time and flow permanence. Freshw. Biol. 50: 32 944-953. 33

26
Scullion, J., Parish, C.A., Morgan, N. & Edwards, R.W., 1982. Comparison of benthic 1 macroinvertebrate fauna and substràtum composition in riffles and pools in the impounded 2 River Elan and the unregulated River Wye, mid-Wales. Freshwat. Biol. 12: 579–595. 3
4 Statzner, B., Hildrew, A.G. & Resh, V.H., 2001. Species traits and environmental constraints: 5
entomological research and the history of ecological theory. Annu. Rev. Entomol. 46: 291-6 316. 7
Statzner, B. & Beche, L. A., 2010. Can biological invertebrate traits resolve effects of multiple 8 stressors on running water ecosystems ? Freshw. Biol. 55: 80-119. 9
Tachet, H., Richoux, P., Bournard, M. & Usseglio-Polatera, P., 2010. Invertébrés d’Eau Douce – 10 Systématique, Biologie, Écologie. 2nd corrected impression. CNRS éditions, Paris. 11
Tournoud, M.-G., Perrin, J.-L., Gimbert, F. & Picot, B., 2005. Spatial evolution of nitrogen and 12 phosphorous loads along a small Mediterranean river: implication of bed sediments. Hydrol 13 Process. 19: 3581-3592. 14
Townsend, C.R., Dolédec, S., Norris, R., Peacock, K. & Arbuckle, C., 2003. The influence of scale 15 and geography on relationships between stream community composition and landscape 16 variables: description and prediction. Freshw. Biol. 48: 768-785. 17
Townsend, C.R. & Hildrew, A., 1994. Species traits in relation to a habitat templet for river 18 systems. Freshw. Biol. 31: 265-275. 19
Usseglio-Polatera, P., Bournaud, M., Richoux, P. & Tachet, H., 2000. Biological and ecological 20 traits of benthic freshwater macroinvertebrates: relationships and definition of groups with 21 similar traits. Freshw. Biol. 43: 175-205. 22
Vieira, N.K.M., N.L., Poff, D.M., Carlisle, S.R., Moulton, M.L., Koski & Kondratieff, B.C., 2006. 23 A database of lotic invertebrate traits for North America. USGS Data Series 187. 24
Wang, L., Lyons, J., Rasmussen, P., Seelbach, P., Simon, T., Wiley, M., Kanehl, P., Baker, E., 25 Niemela, S. & Stewart, P.M., 2003. Watershed, reach, and riparian influences on stream fish 26 assemblages in the Northern Lakes and Forest Ecoregion, U.S.A. Can. J. Fish. Aquat. Sci. 27 60: 491-505. 28
Wang, L., Seelbach, P.W. & Hughes, R.M., 2006. Introduction to landscape influences on stream 29 habitats and biological assemblages. American Fisheries Society Symposium 48: 1-23. 30
Wiens, J.A., 1989. Spatial Scaling in Ecology. Funct. Ecol. 3: 385-397. 31 Wiggins, G.B., Mackay, R.J. & Smith, I.M., 1980. Evolutionary and ecological strategies of 32
animals in annual temporary pools. Archiv für Hydrobiologie (suppl.) 58: 97-206. 33

27
Williams, D.D., 1996. Environmental constraints in temporary fresh waters and their consequences 1 for the insect fauna. J. North Am. Benth. Soc. 15:634–650. 2
Winemiller, K.O., Flecker, A.S. & Hoeinghaus, D.J., 2010. Patch dynamics and environmental 3 heterogeneity in lotic ecosystems. J. N. Am. Benthol. Soc. 29: 84–99. 4
5

Figure captions
Fig. 1. Map of the study area showing the locations of the stream basins studied.
Fig. 2. PCA biplot of stream environmental variables for a) the wet season and b) the dry
season. Stream type is represented by symbols: (■) P, (○) I-P, and (∆) I-D. 95% confidence
ellipsoids for each stream type are shown. Codes for streams are in Table 1.
Fig. 3. Relative frequency of meso- (P: pools, R: riffles) and micro-habitats (see legend) in
each stream type (P, I-P, I-D; see text for description) in a) the wet season and b) the dry
season. Codes for streams are in Table 1. Dashed vertical lines separate streams.
Fig. 4. Box-plots of Difference in Functional Structure (DFS) comparing identifications at
the genus and family levels in CR, CV, and ROG. Boxes and lines indicate respectively the
range of the central 50 and 90% of DFS values.
Fig. 5. Variation partitioning for the metrics analysed with GLMs (Rao’s taxonomic
diversity and Rao’s trait diversity) and permutational ANOVA (assemblage taxonomic
composition) for each stream type in a) the wet season and b) the dry season.

Fig. 1
Taibilla
Vallcebre
La Vêne
BifernoCandelaro
Evrotas

Fig. 2
-4 -2 0 2 4
-4-2
02
4
pca_scores$sites[, 1]
pca_
scor
es$s
ites[
, 2]
-4 -2 0 2 4
-4-2
02
4
pca_scores$sites[, 1]
pca_
scor
es$s
ites[
, 2]
37.2%
PC1
21.4
%
PC2
Temperature (0.425)Conductivity (-0.447), O2 (-0.442)N
itrate(-0.651)
Nitrate
(-0.651)
CC
BLAIS
KOL
CR CV
RMROG
SEN
FMK
RAS
CVCR
ISKOL
BLACC
SEN
ROG
P
I-P
I-D
I-P
P
a) Wet season
b) Dry season

Fig. 3
0.0
0.2
0.4
0.6
0.8
1.0
0.0
0.2
0.4
0.6
0.8
1.0
0.0
0.2
0.4
0.6
0.8
1.0
0.0
0.2
0.4
0.6
0.8
1.0
0.0
0.2
0.4
0.6
0.8
1.0
ARGPSAAKAMILMELMALMGLALSMTPXYCPOMFPOMEM
P
P
P PP P
P
PP P
P
P
P
P
P
P
PP
P
P
R
RR
R
RR
R
R
RR
R
RR R
R
RR R
R
CC KOL IS BLA CR
CC KOL IS BLA CR RM SEN ROG CV
RM SEN ROG CV
FM RAS K
P I-P I-D
Mes
o-an
d m
icro
habi
tatf
requ
ency
a) Wet season
b) Dry season
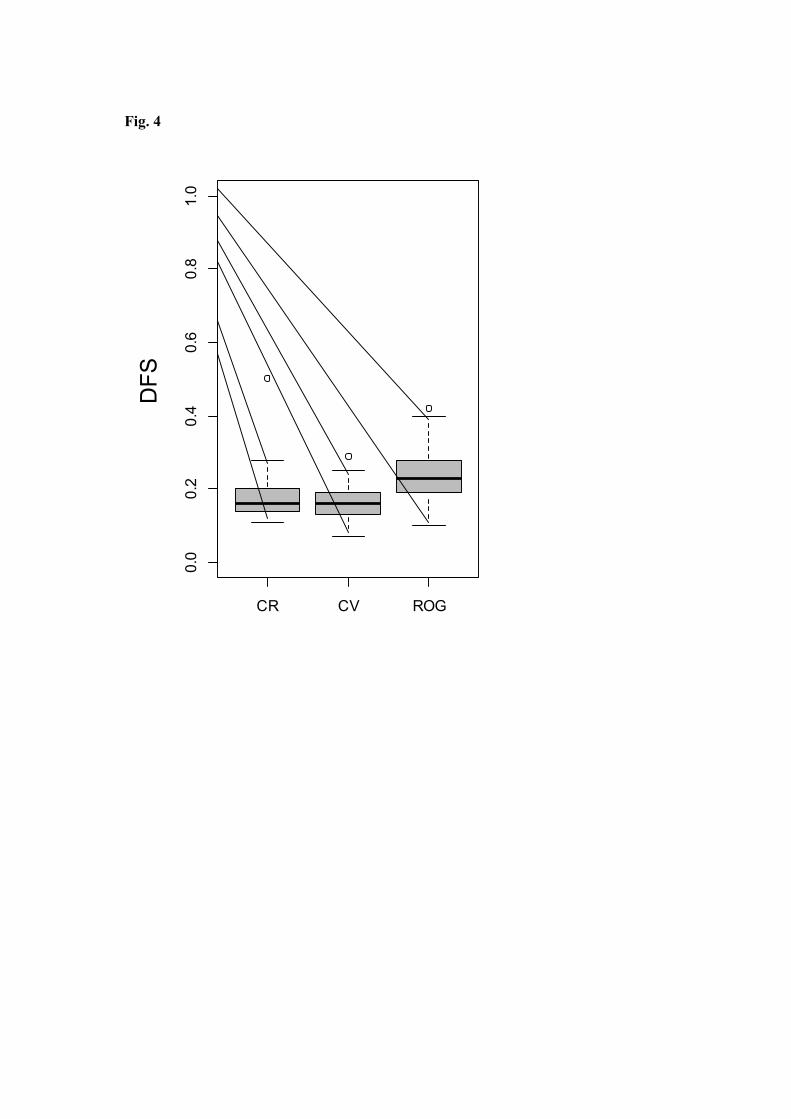
Fig. 4
CR CV ROG
0.0
0.2
0.4
0.6
0.8
1.0
DFS
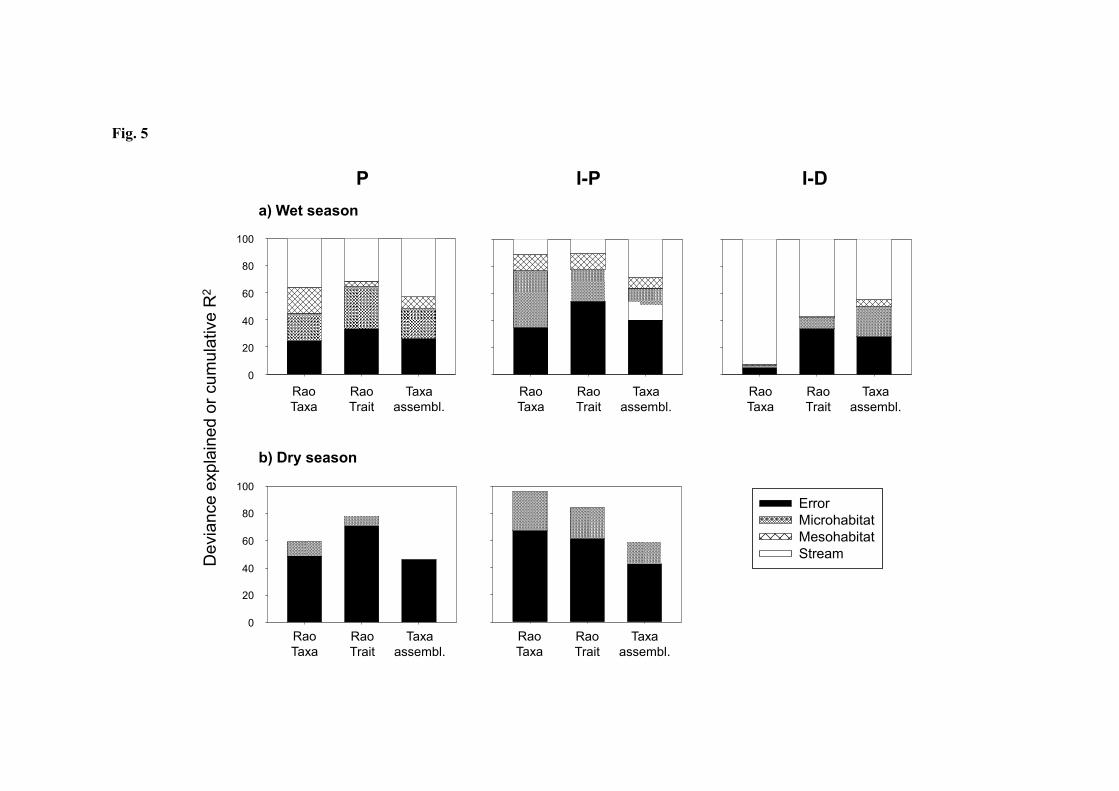
Fig. 5
0
20
40
60
80
100100
80
60
40
20
0
100
80
60
40
20
0
P I-P I-D
a) Wet season
b) Dry season
RaoTaxa
RaoTrait
Taxaassembl.
RaoTaxa
RaoTrait
Taxaassembl.
RaoTaxa
RaoTrait
Taxaassembl.
RaoTaxa
RaoTrait
Taxaassembl.
RaoTaxa
RaoTrait
Taxaassembl.
ErrorMicrohabitatMesohabitatStreamD
evianceexplainedorcumulativeR2

Table 1. Environmental characteristics of the streams studied. Each stream was classified according to its long-term aquatic regime. Only uncorrelated variables (Pearson’s r < 0.8) are shown. Values are provided for the wet (W) and dry (D) season respectively. Dashes indicate that no data were available due to the complete drying of the stream channel in the dry season.
n.a. data not available for the study period.
Basin
Stream
Aquatic regime
Temp (º C)
Cond (µS cm-1)
O2 (mg l-1)
Nitrate (mg l-1)
Phosphate (mg l-1)
Depth (m)
Velocity (m s-1)
Source W D W D W D W D W D W D W D Biferno RM I-P Field surveys 13.0 n.a. 684 n.a. 10.71 n.a. 0.18 n.a. 0.001 n.a. 0.18 n.a. 0.16 n.a.
Candelaro CC P Field surveys 16.4 21.0 535 429 9.93 10.80 0.67 0.77 0.014 0.051 0.20 0.04 0.22 0.31
FM I-D Field surveys 15.4 - 445 - 9.31 - 0.51 - 0.009 - 0.07 - 0.13 -
Evrotas KOL P Gallart et al. 2012 11.1 23.2 385 429 7.42 7.03 3.08 3.03 0.023 0.080 0.18 0.07 0.25 0.21
SEN I-P Field surveys 21.3 23.0 496 475 8.28 6.86 3.85 2.57 0.170 0.080 0.46 0.22 0.50 0.11
RAS I-D Field surveys 12.6 - 264 - 8.35 - 0.11 - 0.160 - 0.26 - 0.23 -
Taibilla BLA P García-Roger et al. 2010 21.2 23.7 756 560 8.06 7.49 1.24 1.73 0.031 0.046 0.24 0.04 0.34 0.26
ROG I-P García-Roger et al. 2010 13.5 15.2 714 618 9.35 8.88 5.05 4.12 0.025 0.052 0.16 0.01 0.09 0.01
Vallcebre CR P García-Roger et al. 2010 14.7 10.9 1780 1342 10.04 9.57 6.47 5.45 0.020 0.035 0.46 0.13 0.50 0.10
CV I-P García-Roger et al. 2010 10.6 10.7 1951 1395 10.41 9.50 5.78 3.52 0.030 0.040 0.22 0.08 0.12 0.07
La Vêne IS P Tournoud et al. 2005 15.3 16.6 520 565 9.90 8.70 0.13 0.63 0.011 0.058 0.19 0.16 0.08 0.09
K I-D Gallart et al. 2012 14.2 - 559 - 8.65 - 0.15 - 0.016 - 0.18 - 0.06 -

Table 2. List and description of microhabitats (see García-Roger et al. 2011for more details) Microhabitat Organic Code Algae - Filamentous algae, algal tufts AL Submerged macrophytes (including bryophytes) SM Living part of terrestrial plants - Fine roots, floating riparian vegetation TP Xylal - Tree trunks, dead wood, branches, roots XY CPOM - Deposits of coarse particulate organic matter CP FPOM - Deposits of fine particulate organic matter FP Emergent macrophytes EM Mineral Wentworth class Argyllal < 6 µm Clay ARG Psammal > 6 µm to 2 mm Fine Silt - Coarse Sand PSA Akal > 2 mm to 2 cm Gravel AKA Microlithal > 2 cm to 6 cm Coarse Gravel - Pebble MIL Mesolithal > 6 cm to 20 cm Cobble MEL Macrolithal > 20 cm to 40 cm Boulder MAL Megalithal > 40 cm Boulder MGL
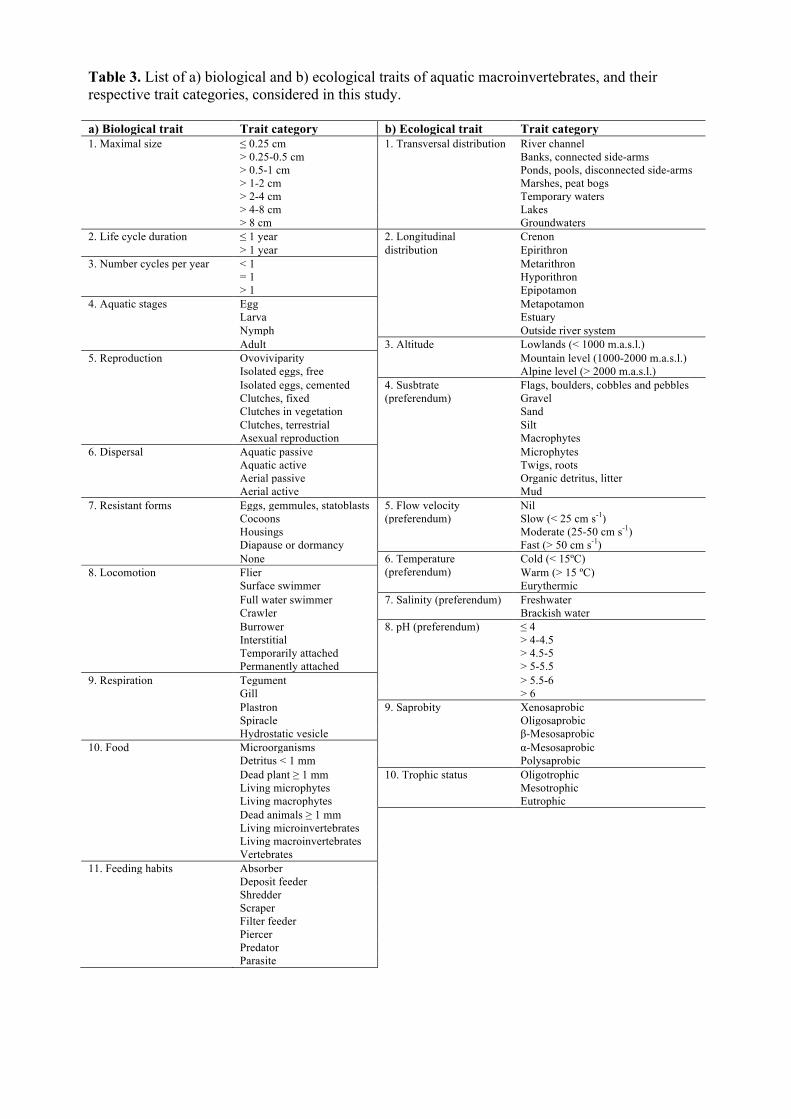
Table 3. List of a) biological and b) ecological traits of aquatic macroinvertebrates, and their respective trait categories, considered in this study. a) Biological trait Trait category b) Ecological trait Trait category 1. Maximal size ≤ 0.25 cm 1. Transversal distribution River channel > 0.25-0.5 cm Banks, connected side-arms > 0.5-1 cm Ponds, pools, disconnected side-arms > 1-2 cm Marshes, peat bogs > 2-4 cm Temporary waters > 4-8 cm Lakes > 8 cm Groundwaters 2. Life cycle duration ≤ 1 year 2. Longitudinal
distribution Crenon
> 1 year Epirithron 3. Number cycles per year < 1 Metarithron = 1 Hyporithron > 1 Epipotamon 4. Aquatic stages Egg Metapotamon Larva Estuary Nymph Outside river system Adult 3. Altitude Lowlands (< 1000 m.a.s.l.) 5. Reproduction Ovoviviparity Mountain level (1000-2000 m.a.s.l.) Isolated eggs, free Alpine level (> 2000 m.a.s.l.) Isolated eggs, cemented 4. Susbtrate
(preferendum) Flags, boulders, cobbles and pebbles
Clutches, fixed Gravel Clutches in vegetation Sand Clutches, terrestrial Silt Asexual reproduction Macrophytes 6. Dispersal Aquatic passive Microphytes Aquatic active Twigs, roots Aerial passive Organic detritus, litter Aerial active Mud 7. Resistant forms Eggs, gemmules, statoblasts 5. Flow velocity
(preferendum) Nil
Cocoons Slow (< 25 cm s-1) Housings Moderate (25-50 cm s-1) Diapause or dormancy Fast (> 50 cm s-1) None 6. Temperature
(preferendum) Cold (< 15ºC)
8. Locomotion Flier Warm (> 15 ºC) Surface swimmer Eurythermic Full water swimmer 7. Salinity (preferendum) Freshwater Crawler Brackish water Burrower 8. pH (preferendum) ≤ 4 Interstitial > 4-4.5 Temporarily attached > 4.5-5 Permanently attached > 5-5.5 9. Respiration Tegument > 5.5-6 Gill > 6 Plastron 9. Saprobity Xenosaprobic Spiracle Oligosaprobic Hydrostatic vesicle β-Mesosaprobic 10. Food Microorganisms α-Mesosaprobic Detritus < 1 mm Polysaprobic Dead plant ≥ 1 mm 10. Trophic status Oligotrophic Living microphytes Mesotrophic Living macrophytes Eutrophic Dead animals ≥ 1 mm Living microinvertebrates Living macroinvertebrates Vertebrates 11. Feeding habits Absorber Deposit feeder Shredder Scraper Filter feeder Piercer Predator Parasite

Table 4. P-values from Fisher’s exact tests of the change in microhabitat composition between the wet and dry season in each stream. Only P and I-P streams are shown. Stream basin
P I-P Stream p-value Stream p-value
Biferno - - RM < 0.001 Candelaro CC 0.192 - - Evrotas KOL < 0.001 SEN 0.001 La Vêne IS 0.435 - - Taibilla BLA 0.147 ROG < 0.001 Vallcebre CR 0.531 CV 0.194

Table 5. P-values from significance tests associated with generalized linear models (GLMs) applied to taxonomic and biological trait community metrics, and permutational ANOVA of community composition data for a) the wet and b) the dry season. For Rao’s diversities of both taxa and biological traits we assumed a Gaussian distribution and used an identity link function a) Wet season
b) Dry season
P I-P I-D Effect
df
Rao (taxa)
Rao (traits)
Taxa assembl.
Rao (taxa)
Rao (traits)
Taxa assembl.
Rao (taxa)
Rao (traits)
Taxa assembl.
Stream 4 < 0.001 < 0.001 0.001 < 0.001 0.026 0.001 < 0.001 < 0.001 0.001 Mesohabitat within Stream 4 < 0.001 0.023 0.001 0.002 0.766 0.001 0.169 0.840 0.033 Microhabitat within Mesohabitat within Stream 28 0.003 < 0.001 0.003 < 0.001 0.038 0.001 0.862 0.908 0.018
P I-P Effect
df
Rao (taxa)
Rao (traits)
Taxa assembl.
Rao (taxa)
Rao (traits)
Taxa assembl.
Stream 4 < 0.001 0.058 0.001 0.985 0.085 0.001 Mesohabitat within Stream 4 0.003 0.544 0.021 0.904 0.362 0.001 Microhabitat within Mesohabitat within Stream 28 0.672 1.000 0.067 0.024 0.021 0.002

Table 6. Results of fourth-corner analysis. Significant positive (+) and negative (-) associations (P 1 < 0.05) and non-significant associations (0) between trait categories and aquatic regimes are shown. 2 After the application of the Holm correction, significant associations are shown in bold. 3 4 5
Trait Trait Category P I-P I-D Maximal size > 0.5-1 cm - + 0 > 2-4 cm + - 0 Aquatic stages Adult + 0 0 Reproduction Ovoviviparity + 0 0 Asexual reproduction + 0 0 Dispersal Aquatic passive + - 0 Aquatic active + 0 0 Aerial passive 0 0 + Resistant forms Cocoons - 0 0 Respiration Gill + - 0 Plastron + 0 0 Spiracle - + 0 Locomotion Full water swimmer + 0 0 Feeding habits Deposit feeder 0 + 0 Transversal distribution River channel + - 0 Ponds, pools, disconnected side-arms 0 + - Marshes, peat-bogs - + 0 Temporary waters - + 0 Longitudinal distribution Crenon 0 0 + Epirithron 0 0 + Epipotamon 0 - 0 Metapotamon 0 0 0 Substrate Flags, boulders, cobbles and pebbles + - 0 Mud 0 + 0 Flow velocity Nil 0 + 0 Slow + 0 0 Medium 0 - 0 Saprobity Xenosaprobic 0 0 + Oligosaprobic 0 0 + Trophic status Oligotrophic 0 - + Mesotrophic 0 0 -