spe-163690-ms synthetic, geomechanical logs for marcellus shale · synthetic, geomechanical logs...
TRANSCRIPT

SPE-163690-MS
Synthetic, Geomechanical Logs for Marcellus Shale M. O. Eshkalak, SPE, S. D. Mohaghegh, SPE, S. Esmaili, SPE, West Virginia University
Copyright 2013, Society of Petroleum Engineers
This paper was prepared for presentation at the 2013 SPE Digital Energy Conference and Exhibition held in The Woodlands, Texas, USA, 5–7 March 2013.
This paper was selected for presentation by an SPE program committee following review of information contained in an abstract submitted by the author(s). Contents of the paper have not been reviewed by the
Society of Petroleum Engineers and are subject to correction by the author(s). The material does not necessarily reflect any position of the Society of Petroleum Engineers, its officers, or members. Electronic
reproduction, distribution, or storage of any part of this paper without the written consent of the Society of Petroleum Engineers is prohibited. Permission to reproduce in print is restricted to an abstract of not more
than 300 words; illustrations may not be copied. The abstract must contain conspicuous acknowledgment of SPE copyright.
Abstract
Successful recovery of hydrocarbons from the reservoirs, notably shale, is attributed to realizing the key fundamentals of
reservoir rock properties. Having adequate and sufficient information regarding the variable lithology and mineralogy is
crucial in order to identify the “right” pay-zone intervals for shale gas production. Also, contribution of mechanical properties
(Principal stress profiles) of shale to hydraulic fracturing strategies is a well understood concept. It may also contribute to
better, more accurate simulation models of production from shale gas reservoirs.
In this study, synthetic geomechanical logs (Including following properties: Poisson’s Ratio, Total Minimum Horizontal
Stress, Bulk and Shear Modulus, etc.) are developed for more than 50 Marcellus Shale wells. Using Artificial Intelligence and
Data Mining (AI&DM), data-driven models are developed that are capable of generating synthetic geomechanical logs from
conventional logs such as Gamma Ray and Density Porosity. The data-driven models are validated using wells with actual
geomechanical logs that have been removed from the database to serve as blind validation wells. In addition, having access to
necessary data to building a geomechanical distribution (Map and Volume) model can assist in understanding the rock
mechanical behavior and consequently creating effective hydraulic fractures which is considered to be an essential step in
economically development of Shale assets.
Moreover, running geomechanical logs on a subset of wells, but having the luxury of generating logs of similar quality for all
the existing wells in a Shale asset can prove to be a sound reservoir management tool for better reservoir characterization,
modeling and efficient production of Marcellus Shale reservoir.
Introduction
Principal stress profiles in a filed are related to rock geomechanical properties. Geomechanical properties of rock include:
Poisson’s Ratio, Total Minimum Horizontal Stress, Bulk, Young and Shear Modulus. These properties play significant role in
developing Shale assets. Having access to geomechanical data can assist engineers and geoscientists during geomechanical
modeling, hydraulic fracture treatment design and in some cases during reservoir modeling in Shale Gas fields. A common
source of securing such data is geomechanical well logs. Running geomechanical well logs (in all wells in a Shale asset) is not
common practice among operators. This may be attributed to the cost associated with running such logs.
Artificial Intelligent and Data Mining have been used with in recent years in reservoir modeling to perform analysis of
formation characteristics (Mohaghegh et al. 2009)[1, 2, 3, 4]. Also some studies indicates that ANN is a powerful tool for
pattern recongnition and system identification such as methodology developed by Mohaghegh et al. (1998)[5] to generate
synthetic Magnetic Resonance Imagin (MRI) logs using conventional logs such as SP, GR and Resistivity. The methodology
incorporated an artificial neural network as its main tool. The synthetic magnetic resonance imaging logs were generated with
a high degree of accuracy even when the model developed used data not employed during model development.
Basheer, I. A. shows that ANN is suitable to predict and classify soil compaction and rocks characteristics as well as to
determine some mechanical parameters such as Young’s modulus, Poisson’s Ratio [6]. They mainly investigate Neural
Network capability in solving geotechnical engineering problems and they provided a general view of some Neural Network
applications in their field of research.
2 SPE -163690-MS
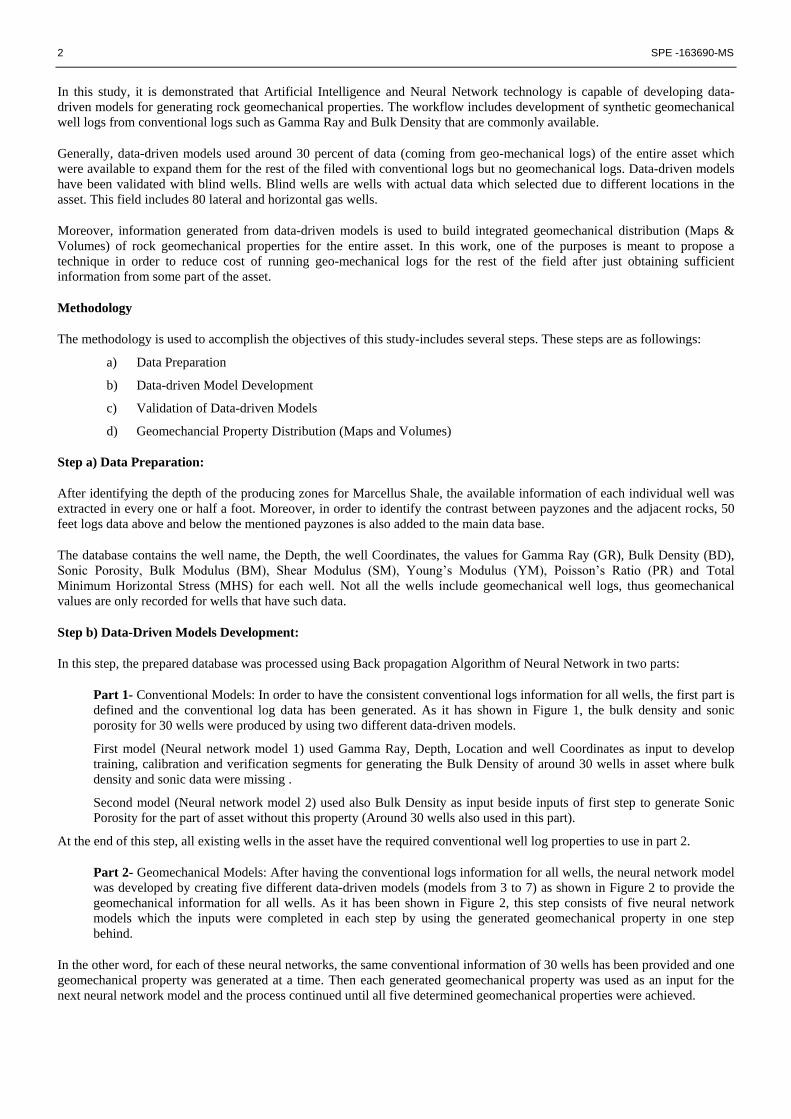
In this study, it is demonstrated that Artificial Intelligence and Neural Network technology is capable of developing data-
driven models for generating rock geomechanical properties. The workflow includes development of synthetic geomechanical
well logs from conventional logs such as Gamma Ray and Bulk Density that are commonly available.
Generally, data-driven models used around 30 percent of data (coming from geo-mechanical logs) of the entire asset which
were available to expand them for the rest of the filed with conventional logs but no geomechanical logs. Data-driven models
have been validated with blind wells. Blind wells are wells with actual data which selected due to different locations in the
asset. This field includes 80 lateral and horizontal gas wells.
Moreover, information generated from data-driven models is used to build integrated geomechanical distribution (Maps &
Volumes) of rock geomechanical properties for the entire asset. In this work, one of the purposes is meant to propose a
technique in order to reduce cost of running geo-mechanical logs for the rest of the field after just obtaining sufficient
information from some part of the asset.
Methodology
The methodology is used to accomplish the objectives of this study-includes several steps. These steps are as followings:
a) Data Preparation
b) Data-driven Model Development
c) Validation of Data-driven Models
d) Geomechancial Property Distribution (Maps and Volumes)
Step a) Data Preparation:
After identifying the depth of the producing zones for Marcellus Shale, the available information of each individual well was
extracted in every one or half a foot. Moreover, in order to identify the contrast between payzones and the adjacent rocks, 50
feet logs data above and below the mentioned payzones is also added to the main data base.
The database contains the well name, the Depth, the well Coordinates, the values for Gamma Ray (GR), Bulk Density (BD),
Sonic Porosity, Bulk Modulus (BM), Shear Modulus (SM), Young’s Modulus (YM), Poisson’s Ratio (PR) and Total
Minimum Horizontal Stress (MHS) for each well. Not all the wells include geomechanical well logs, thus geomechanical
values are only recorded for wells that have such data.
Step b) Data-Driven Models Development:
In this step, the prepared database was processed using Back propagation Algorithm of Neural Network in two parts:
Part 1- Conventional Models: In order to have the consistent conventional logs information for all wells, the first part is
defined and the conventional log data has been generated. As it has shown in Figure 1, the bulk density and sonic
porosity for 30 wells were produced by using two different data-driven models.
First model (Neural network model 1) used Gamma Ray, Depth, Location and well Coordinates as input to develop
training, calibration and verification segments for generating the Bulk Density of around 30 wells in asset where bulk
density and sonic data were missing .
Second model (Neural network model 2) used also Bulk Density as input beside inputs of first step to generate Sonic
Porosity for the part of asset without this property (Around 30 wells also used in this part).
At the end of this step, all existing wells in the asset have the required conventional well log properties to use in part 2.
Part 2- Geomechanical Models: After having the conventional logs information for all wells, the neural network model
was developed by creating five different data-driven models (models from 3 to 7) as shown in Figure 2 to provide the
geomechanical information for all wells. As it has been shown in Figure 2, this step consists of five neural network
models which the inputs were completed in each step by using the generated geomechanical property in one step
behind.
In the other word, for each of these neural networks, the same conventional information of 30 wells has been provided and one
geomechanical property was generated at a time. Then each generated geomechanical property was used as an input for the
next neural network model and the process continued until all five determined geomechanical properties were achieved.

SPE -163690-MS 3
Figure 1. Part 1- Data Driven Model for Conventional Logs
Figure 2. Part 2- Data Driven Models for Geomechanical Logs
All above-mentioned models are a multilayer neural network that is trained using a back-propagation technique. 80% of data
was used for training, and 20% for calibration and verification (10% for each).
Step c) Data-Driven Model Validation:
To examine the model validity, the information of some wells (which have both conventional and geomechanical logs) was
removed from the training dataset and it was attempted to re-generate the geomechanical logs. These removed wells are so
called blind wells. Blind wells have been chosen from different location of Marcellus Shale asset. Data-driven models used
this new data set to be trained to generate geomechanical properties for blind wells.
Data-driven models number 3 to 7 has been validated separately to generate geomechanical properties. In each step, the
generated property compared with the actual values which have been removed from main dataset. Validation results have been
discussed in the Result and Discussion section of this paper.
Step d) Geo-mechanical Property Distribution:
In this step, the first objective of this paper is accomplished; geo-mechanical properties are generated for all existing wells in
the asset. Different geostatistic methods have been analyzed to perform geo-mechanical property distribution.
Sequential Gaussian simulation (SGS) finally used to create distribution according to well locations for the entire field. Two
types of maps are created. First map is only incorporated with 30 wells which already have actual geomechanical logs. The
second map is related to entire field (50 wells with generated property and 30 wells with actual data). These two maps

4 SPE -163690-MS
demonstrate differences between geomechanical property distribution with and without having full-field data. Ten maps which
shows distribution of five rock geomechancial properties in the Marcellus shale asset is performed and showed in appendix.
This distribution maps have been discussed later in this paper.
Results and Discussions
The study focuses on part of Marcellus Shale field. Figure 3 shows the distribution of existing wells in the Marcellus Shale
asset which is used in this study. Table 1 shows the information and number of the wells which were used to develop data-
driven models for step b –part 1 and 2 as well as validation purpose in step c.
Figure 3. Marcellus Shale gas field for this study
Table 1. Information used for data bases for developing Data-driven models
Well
Identifier
Description Conventional
Well Logs
Geomechanical
Well logs
Number
of wells
Green Circle Blind Validation Wells YES YES 5
Red Square Wells Used for Training, Calibration & Validation YES YES 25
Blue Diamond Wells with no Geo-mechanical logs YES NO 50
In this study, a multilayer neural networks or multilayer perceptions are used (Haykin 1999). [7] These networks are most
suitable for pattern recognition specially in non-linear problems Neural network have one hidden layers with different number
of hidden neurons that are selected based on the number of data record available and the number of input parameters selected
in each training process.
The training process of the neural networks is conducted using a back propagation technique (Chauvin et al. 1995). [8] In the
training process, the data set is partitioned into three separate segments. This is done in order to make sure that the neural
network will not be trapped in the memorization phase (Maren et al. 1990). [9]
The Intelligent partitioning process allows the network to adapt to new data one it is being trained. The first segment, which
includes the majority of the data, is used to train the model. In order to prevent the memorizing and overtraining effect in the
neural network training process, a second segment of the data is taken for calibration that is blind to the neural network and at
each step of training process, the network is tested for this set. If the updated network given better predictions for the
calibration set, it will replace the previous neural network; otherwise, the previous network is selected. Training will be
continued once the error of predictions for both the calibration and training data set is satisfactory. This will be achieved only
if the calibration and training partitions are showing similar statistical characteristics. Verification partition is the thirds and
last segment used for the process that is kept out of training and calibration process and is used only to test the precision of the
neural networks. Once the network is trained and calibrated, then the final model is applied to the verification set. If the results
are satisfactory then the neural network is accepted as part of the entire prediction system. (Khazani, Mohaghegh 2012). [10]
Once models are developed, Key Performance Indicator process (KPI) is performed in order to investigate the influence of

SPE -163690-MS 5
each parameter in data-driven models. This process is analyzed for each step during model developments. Figure 4 illustrates
the ranking of different inputs when Total Minimum Horizon Stress is used as an output.
Figure 4. Impact of input parameters in data-driven models
R-squared calculated for training, calibration and verification segments, is also an indicator of accuracy of the data-driven
models in performing results as output. The higher the R-squared, the closest the results to the actual values. In our study the
highest achieved R-squared is around 95 and the lower one in some cases around 85 percent, which in both situation the results
presented are highly acceptable but the critical point is when the model gained very low R-squared, the results were so poor in
generating a matched data. Higher level of R-squared reflects, in all three stages of training, calibration and verification, the
reliable correlation between actual and generated data.
It is also important to mention that during the initial training of data sets; the results obtained were with low R-squared.
Unsuccessful behavior of models was understood because of having some wells with log data for each 0.5 ft. which is in
contrast with the rest of the wells with every 1 ft. log data available. Once data of 0.5 ft. turned to 1 ft. which considered as
discrepancy which misleads the models, the results came out properly and the data-driven models showed rapid improvements.
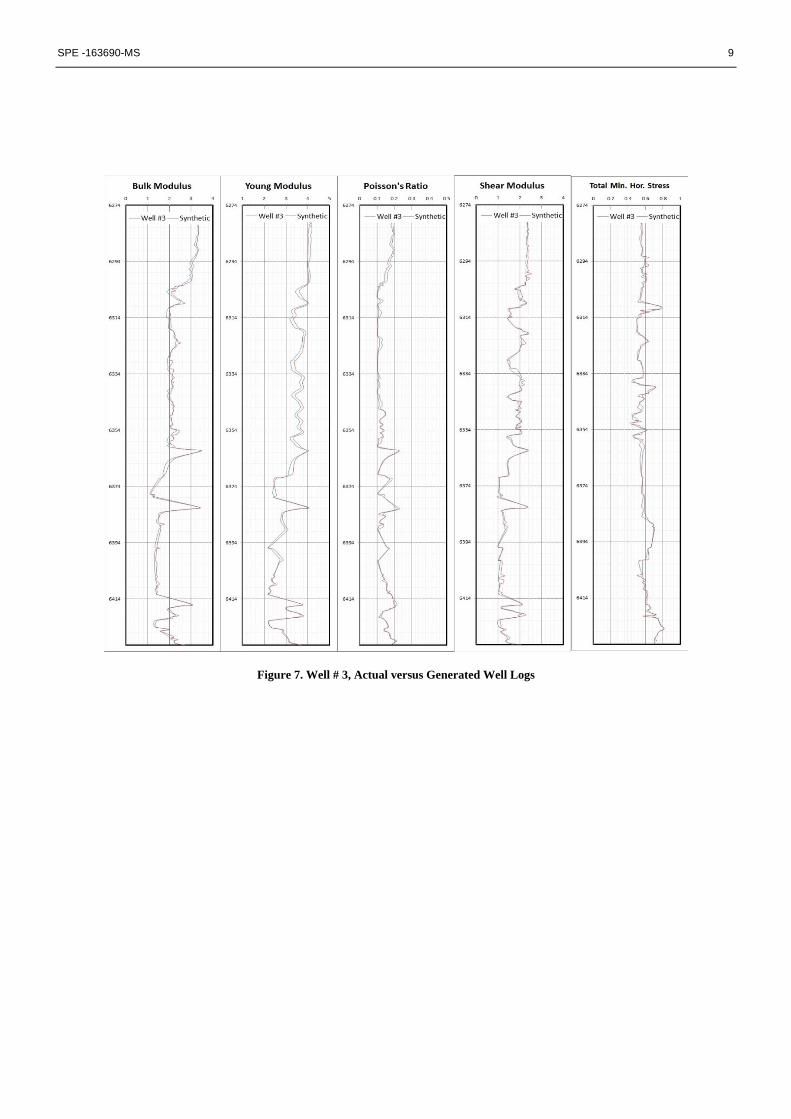
In Figures number 5 to 9 in appendix, we present actual well logs and generated logs for 5 blind wells. To compare the results,
both actual and generated properties are plotted in the same figure like an actual well log. Properties such as Bulk Modulus,
Young Modulus, Poisson’s Ratio, Shear Modulus and Total Minimum Horizontal Stress are presented respectively.
Blue line shows the actual value and the red line is for generated values by data-driven models. For well # 1 to well # 4, there
is perfect match between blue and red lines. These wells are in proximity of wells with actual geomechanical properties
according to their locations and depths. As it was expected, results showed for these wells are accurate which demonstrate
data-driven models capability in predicting geomechanical properties.
For well # 5, in Figure 9, the generated data is not close to the actual and it might be because of the location of the well which
is far from (Upper side of the asset in the field- Figure 2) the rest of wells that we have used for the training purposes. This fact
indicates that the models could not be able to predict the behavior of outlier wells. Moreover, the producing payzone depth of
this well, compared to other four blind wells, is different (out of range) and it might be another reason related to the fact which
models could not capture the behaviors very well.
Figures number 10 to 14 (In the Appendix) are showing distribution models for five geomechanical rock properties. For each
property there are two distributions; one by using the actual data and the second one by using the information of both
generated and actual data (Full-field data). A comparison between maps for each property shows that more reasonable
distribution gained using more data for the asset. The Sequential Gaussian Simulation (SGS) algorithm was used in order to
generate the maps. In the top distribution, plus signs represent the wells with actual data which have been used in data set for
training, calibration and verification during neural network development.
Conclusions
In this work, authors demonstrated the application of AI&DM as a reliable tool in performing accurate results for generating
synthetic geomechanical logs. In simple terms, we used conventional well logs to generate geomechanical properties and
create distribution maps of geomechanical properties for the entire asset.

6 SPE -163690-MS
Five data-driven models have been designed to predict five geomechanical properties of Marcellus Shale rock. Validation
process conducted to illustrate data-driven models accuracy in predicting Young Modulus, Poisson Ratio, Bulk Modulus,
Shear Modulus and Total Minimum Horizontal Stress. Data mining issues in some cases related to geomechanical properties
are successfully managed to reach to a reliable prediction.
Geomechanical property distribution model of the entire asset shows more reasonable between distributions when there are
just a few available actual data rather than having access to the full-field data.
Synthetic geomechanical logs and property distributions for Marcellus shale exhibits a great deal of assistant to better
performing reservoir modeling and the optimizing of hydraulic fracturing issues related to Marcellus Shale development
strategies. Authors expect these models will conclude also accurate results in other shale assets.
Acknowledgement
Authors would like to thank the members of the Petroleum Engineering & Analytical research Lab (PEARL) at West Virginia
University for their assistance and support. We also thank and acknowledge Intelligent Solutions Inc. for providing IDEA
software.
References
[1] S. D. Mohaghegh, Luisa Rolon, Sam Ameri, Razi Gaskari, Bret McDaniel Using artificial neural networks to generate
synthetic well logs. Journal of Natural Gas Science and Engineering 1 -118–133. 2009
[2] S. D. Mohaghegh, Arefi, s. Ameri, ‘’Reservoir Characterization with the aid of artificial Neural Network’’ journal of
Petroleum science and engineering, Vol. 16, pp263-274, Elsevier Science Publication, 1996
[3] S. D. Mohaghegh, Intelligent Solutions, Inc. & West Virginia University’ ’Recent’’ SPE journal Paper, 2005
[4] S. D. Mohaghegh, Intelligent Solutions, Inc. & West Virginia University’ ’Reservoir’s conference Paper, 2011
[5] S. D. Mohaghegh, S., Richardson, M., Ameri, S., 1998. Virtual magnetic imaging logs: generation of synthetic MRI logs
from conventional well logs. SPE 51075. SPE Eastern Regional Conference, Pittsburgh, PA. 2011
[6] Basheer, I. A. and Y. M. Najjar, A neural network for soil compaction, Proc., 5th Int. Symp. Numerical Models in
Geomechanics, G. N. Pande and S. Pietrusczczak, eds., Roterdam: Balkema, 435-440. 1995
[7] Haykin, s. Neural Network, a comprehensive Foundation, Second Edition, Upper Saddle River, NJ: Prentice Hall Inc.
[8] Chauvin, Y and Rumelhart, D, E. ed. Backpropagation theory, Architecture and Applications. London: Psychology press/
Taylor $ Francis Group1995
[9] Maren, A. J. Harston, C. T., and Pap, R. M, Handbook of Neural Computation applications, San Diego, California:
Academic Press 1990
[10] Khazani, Y, Mohaghegh S. D., Intelligent Production Modeling Using ful-field Pattern Recognition, 2011 SPE Reservoir
Vol. 14, No. 6 pp. 735-749

SPE -163690-MS 7
Appendix:
Figures number 5 to 9 is showing well logs generated versus actual log data for Blind Wells in the asset.
Figure 5. Well # 1, Actual versus Generated Well Logs

8 SPE -163690-MS
Figure 6. Well # 2, Actual versus Generated Well Logs
SPE -163690-MS 9
Figure 7. Well # 3, Actual versus Generated Well Logs

10 SPE -163690-MS
Figure 8. Well # 4, Actual versus Generated Well Logs

SPE -163690-MS 11
Figure 9. Well # 2, Actual versus Generated Well Logs

12 SPE -163690-MS
Figures number 10 to 14 is showing geomechanical property distribution for Marcellus Shale. Plus signs are well locations.
Figure 10. Distribution of Young Modulus based on actual data (Top) and Distribution with full-field data. (Bottom)

SPE -163690-MS 13
Figure 11. Distribution of Shear Modulus based on actual data (Top) and Distribution with full-field data. (Bottom)

14 SPE -163690-MS
Figure 12. Distribution of Poisson’s Ratio based on actual data (Top) and Distribution with full-field data. (Bottom)

SPE -163690-MS 15
Figure 13. Distribution of Total Min. Hor. Stress based on actual data (Top) and Distribution with full-field data. (Bottom)

16 SPE -163690-MS
Figure 14. Distribution of Bulk Modulus based on actual data (Top) and Distribution with full-field data. (Bottom)