speakers: timothy p. runde, mai, leed ap - appraisal … · · 2013-10-28speakers: timothy p....
TRANSCRIPT

Speakers:
Timothy P. Runde, MAI, LEED AP Carneghi-Blum & Partners, Inc.
Tenaya Asan, Build It Green
August 1, 2012
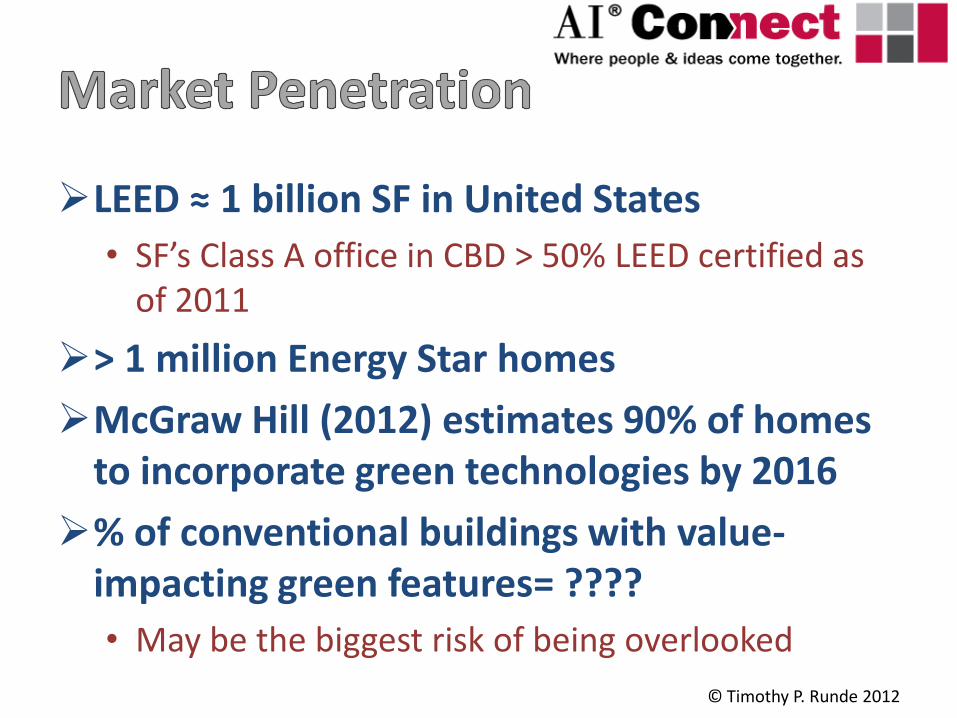
LEED ≈ 1 billion SF in United States
• SF’s Class A office in CBD > 50% LEED certified as of 2011
> 1 million Energy Star homes
McGraw Hill (2012) estimates 90% of homes to incorporate green technologies by 2016
% of conventional buildings with value-impacting green features= ????
• May be the biggest risk of being overlooked
© Timothy P. Runde 2012
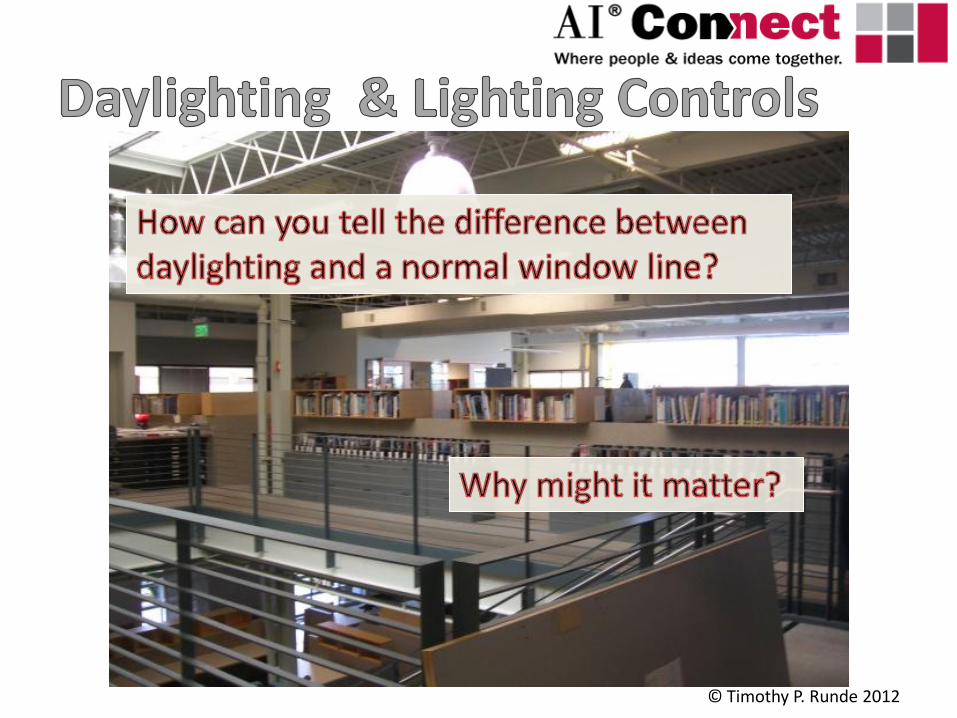
Do labels matter?
What makes a building “green”?
© Timothy P. Runde 2012
Section One
Does market care about it?
What’s behind the label?
© Timothy P. Runde 2012
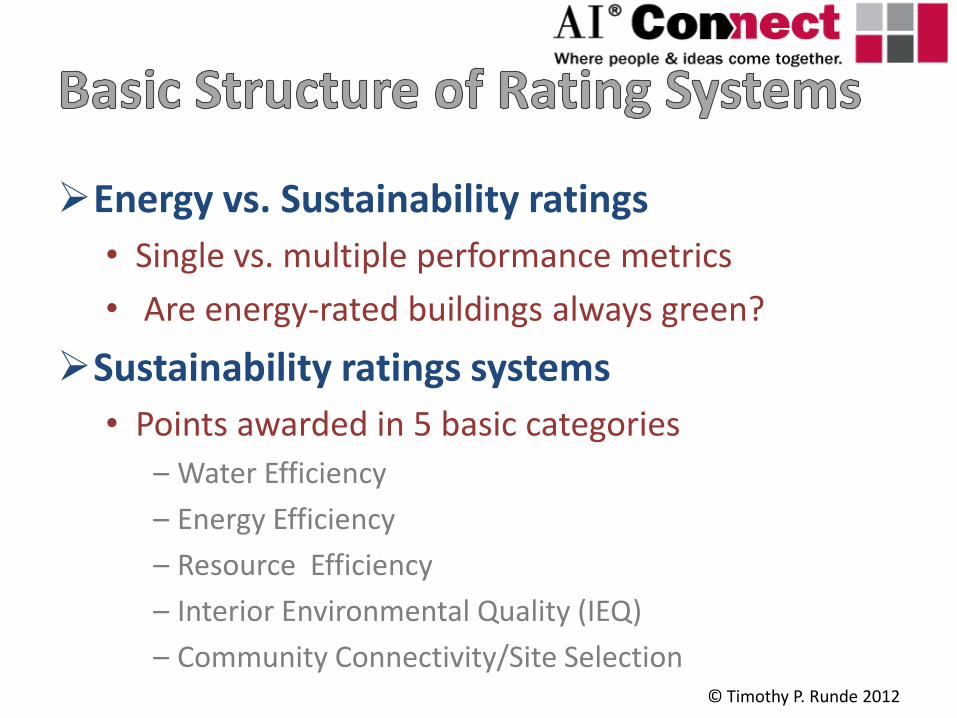
Energy vs. Sustainability ratings
• Single vs. multiple performance metrics
• Are energy-rated buildings always green?
Sustainability ratings systems
• Points awarded in 5 basic categories
– Water Efficiency
– Energy Efficiency
– Resource Efficiency
– Interior Environmental Quality (IEQ)
– Community Connectivity/Site Selection © Timothy P. Runde 2012
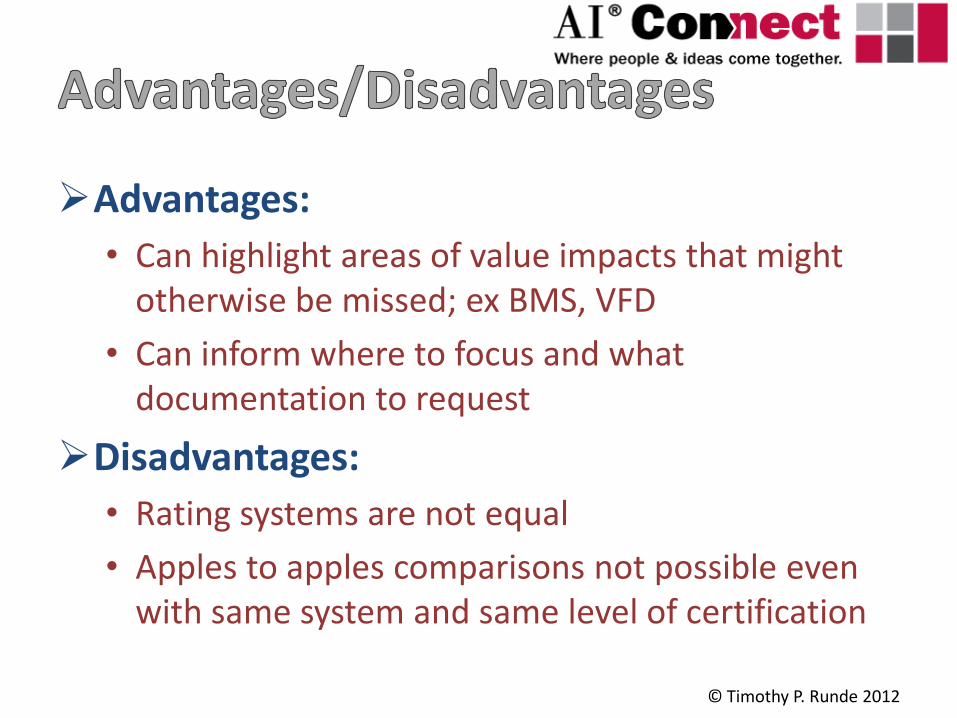
Advantages:
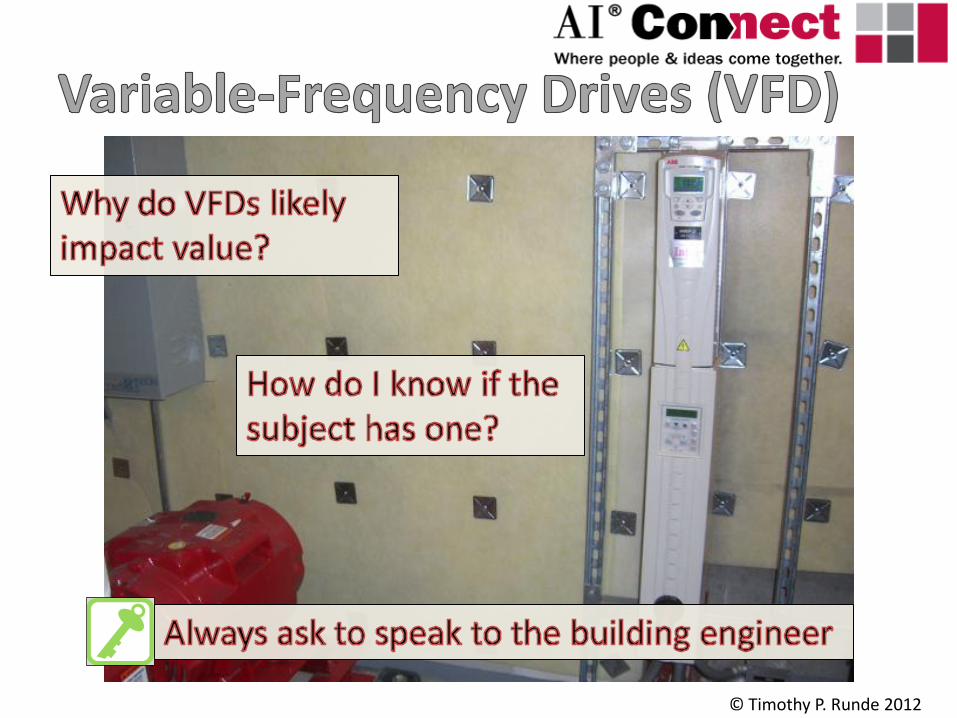
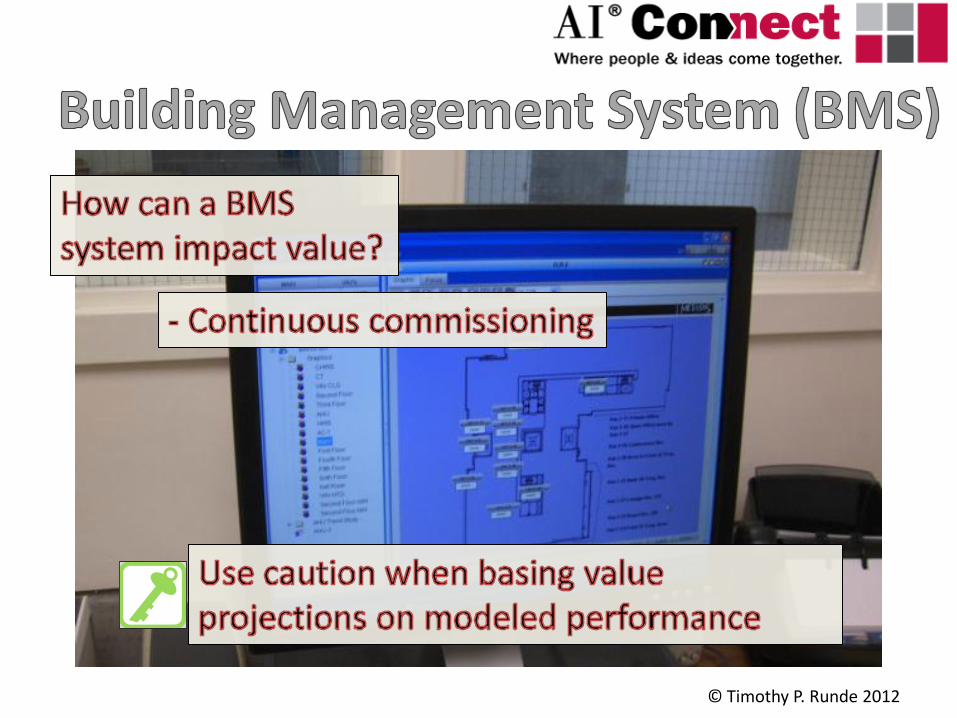
• Can highlight areas of value impacts that might otherwise be missed; ex BMS, VFD
• Can inform where to focus and what documentation to request
Disadvantages:
• Rating systems are not equal
• Apples to apples comparisons not possible even with same system and same level of certification
© Timothy P. Runde 2012
Section Two
What is LEED?
• Leadership
• Energy
• Environmental
• Design
Mission statement: “To transform the way buildings
and communities are designed, built and operated, enabling an environmentally and socially responsible, healthy, and prosperous environment that improves the quality of life.”
USGBC is an NGO not a government entity
© Timothy P. Runde 2012
New Construction & Major Renovation (NC)
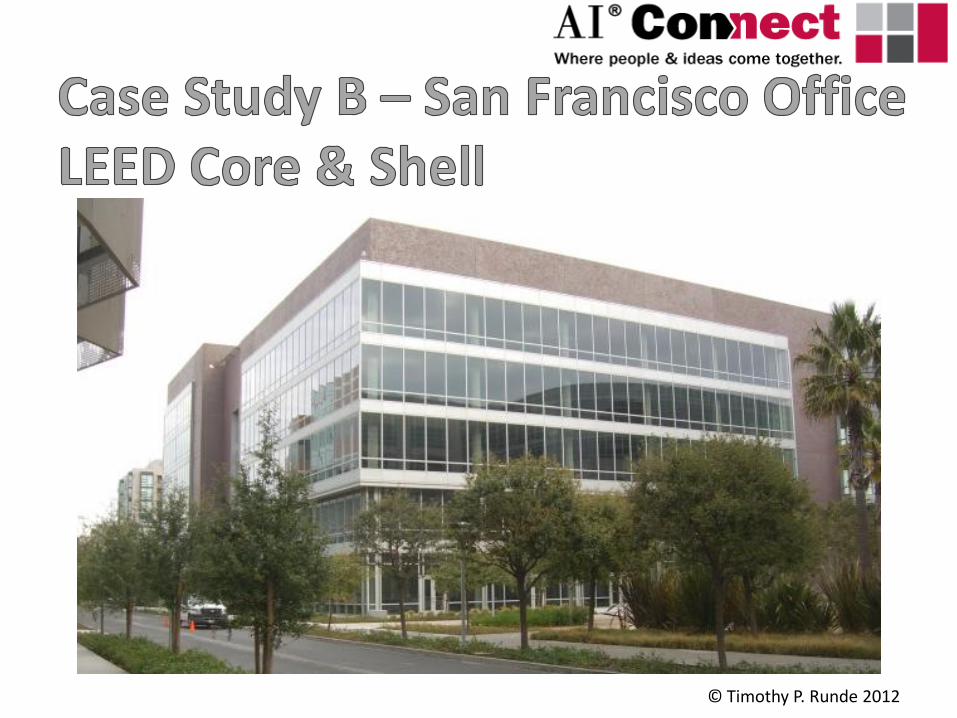
Core & Shell (CS)
Existing Buildings Operation and Maintenance (EBOM)
Commercial Interiors (CI)
Schools
Retail
Healthcare
Homes
Neighborhood Development (ND) © Timothy P. Runde 2012
Sustainable Sites
Water Efficiency
Energy & Atmosphere
Materials & Resources
Indoor Environmental Quality
Innovation
Regional Priority (new to v3 2009)
© Timothy P. Runde 2012
© Timothy P. Runde 2012
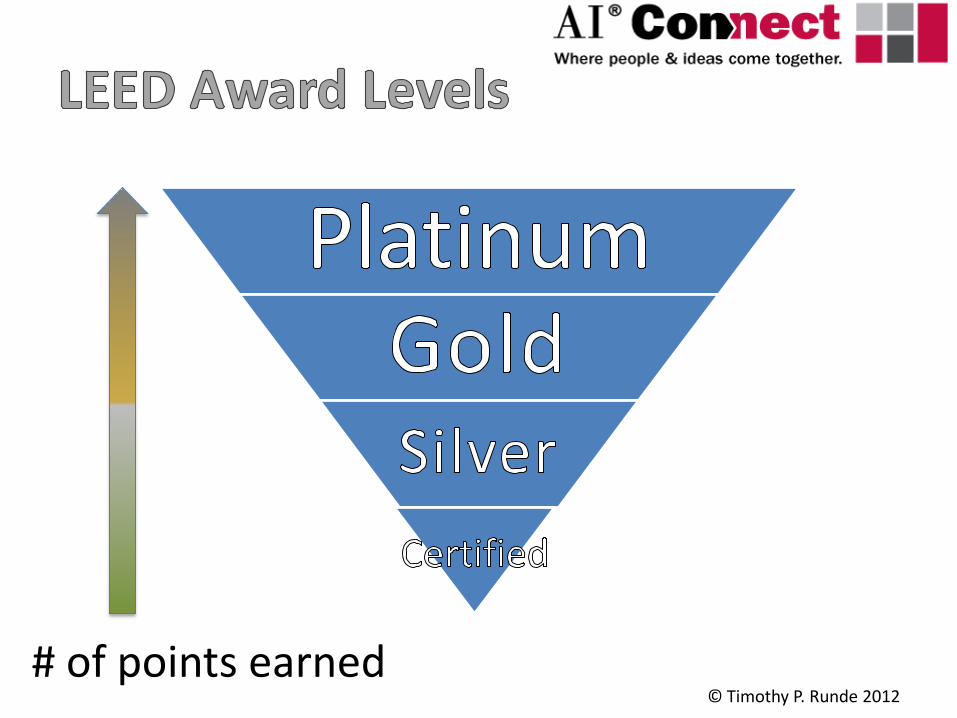
# of points earned

© Timothy P. Runde 2012
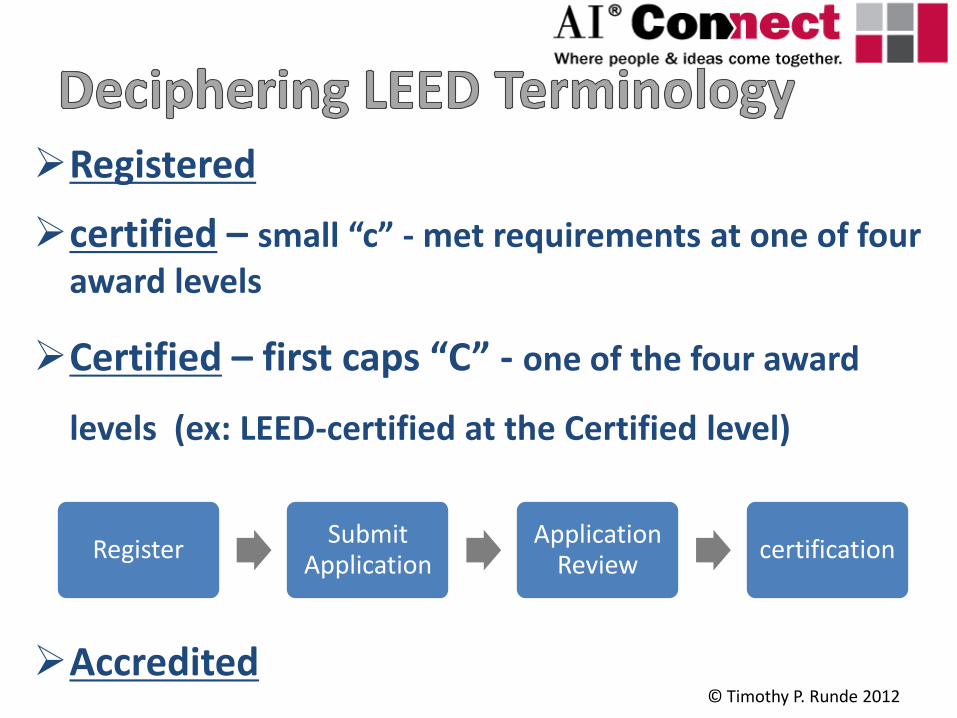
Registered
certified – small “c” - met requirements at one of four award levels
Certified – first caps “C” - one of the four award
levels (ex: LEED-certified at the Certified level)
Accredited
Register Submit
Application Application
Review certification
© Timothy P. Runde 2012
What does a scorecard look like?
Check for this info first:
• Certified at what level or still in process?
• Which track?
• Which version?
© Timothy P. Runde 2012
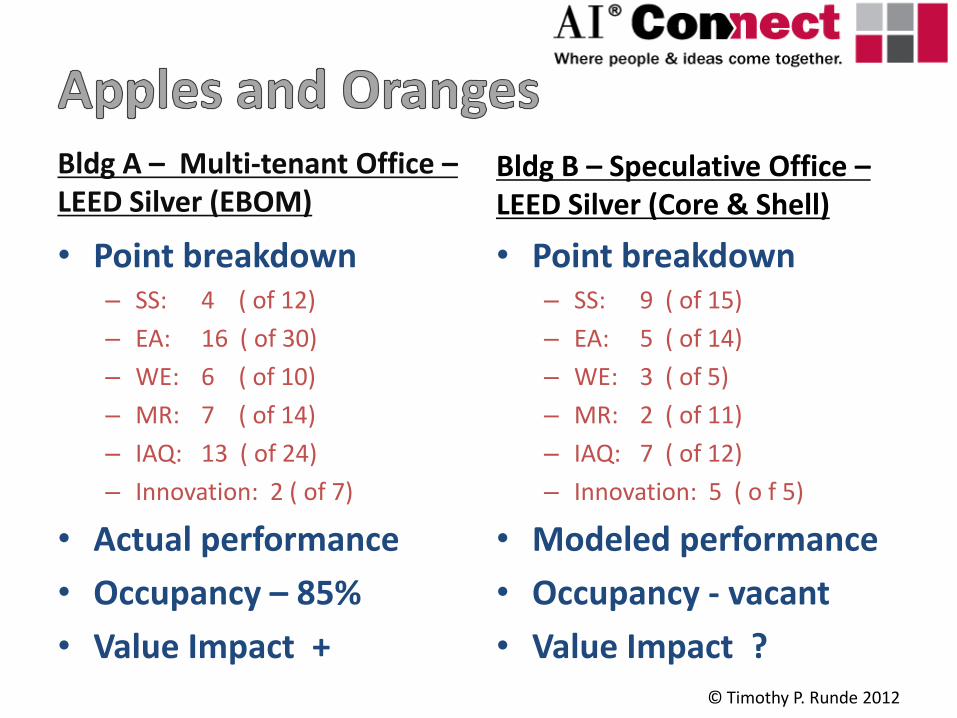
Bldg A – Multi-tenant Office – LEED Silver (EBOM)
• Point breakdown – SS: 4 ( of 12)
– EA: 16 ( of 30)
– WE: 6 ( of 10)
– MR: 7 ( of 14)
– IAQ: 13 ( of 24)
– Innovation: 2 ( of 7)
• Actual performance
• Occupancy – 85%
• Value Impact +
Bldg B – Speculative Office – LEED Silver (Core & Shell)
• Point breakdown – SS: 9 ( of 15)
– EA: 5 ( of 14)
– WE: 3 ( of 5)
– MR: 2 ( of 11)
– IAQ: 7 ( of 12)
– Innovation: 5 ( o f 5)
• Modeled performance
• Occupancy - vacant
• Value Impact ? © Timothy P. Runde 2012
Section Three
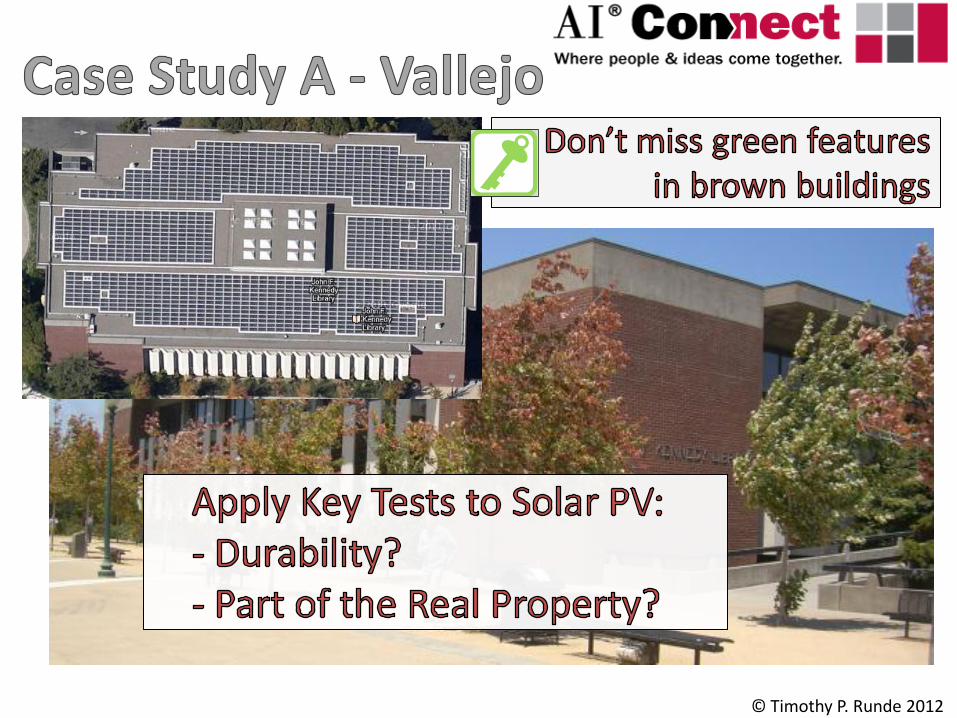
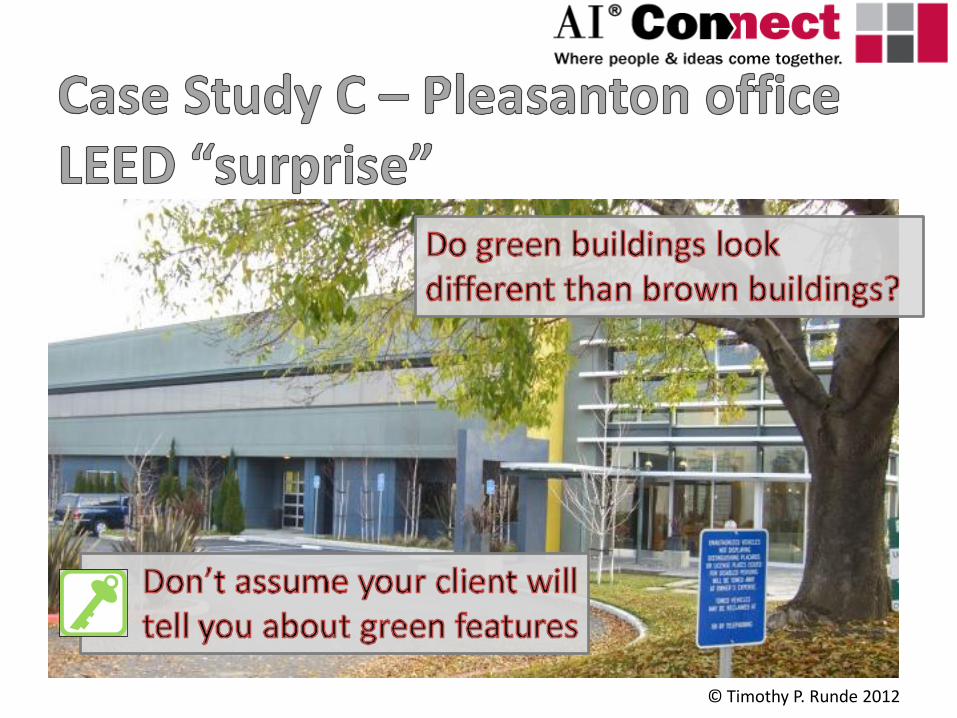
Green buildings easy to miss
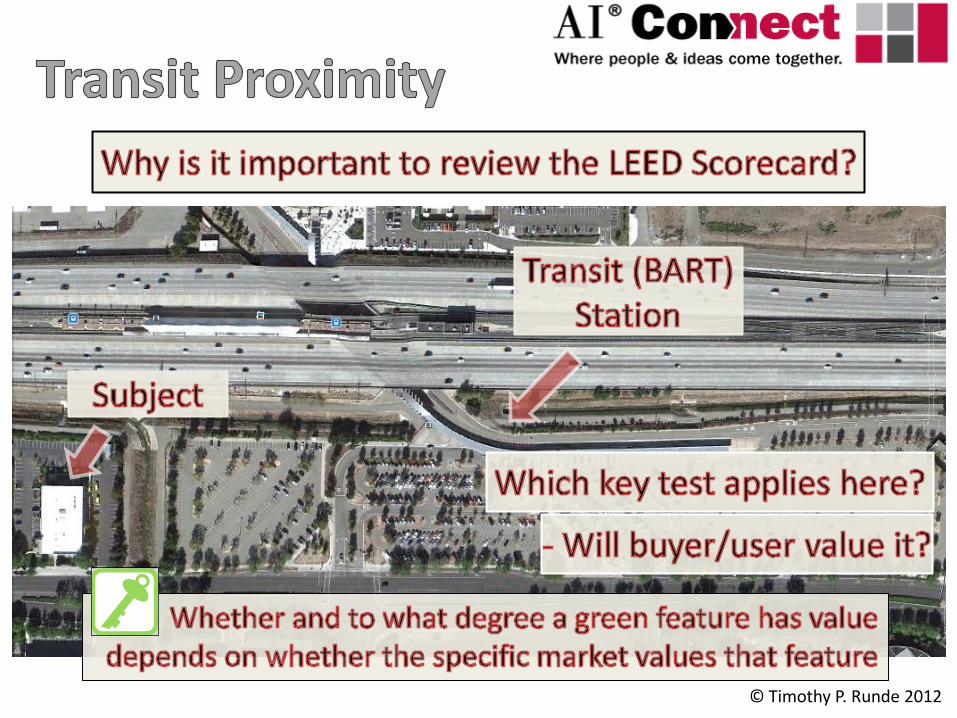
Value impact of green buildings are largely dependent on their green features and the degree to which the market values them
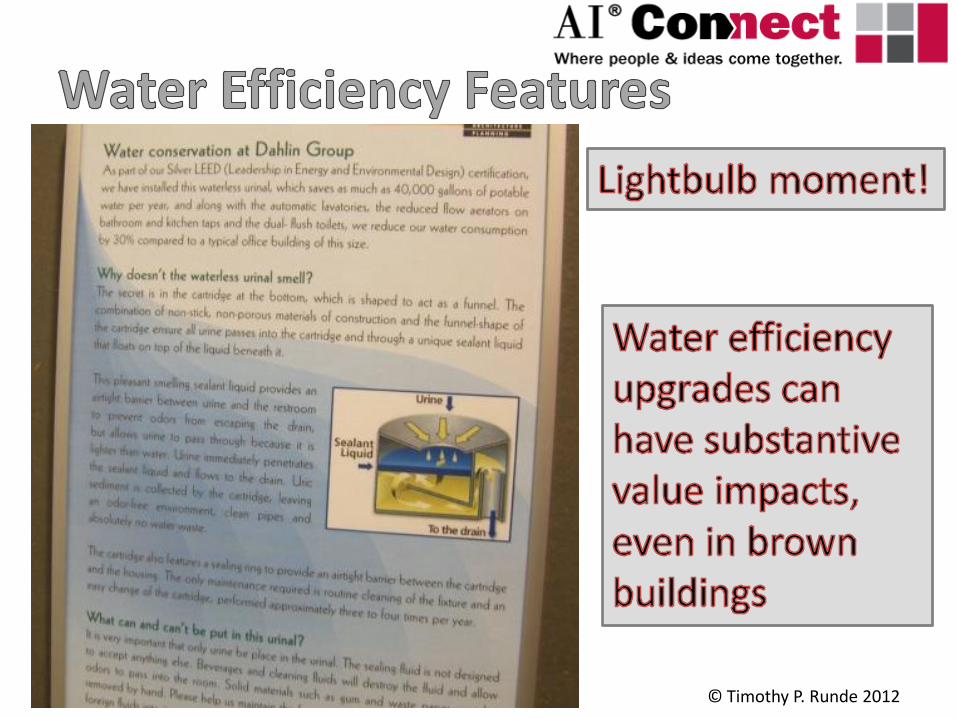
Brown buildings can have green features with substantive market value impact
© Timothy P. Runde 2012
Learn to recognize the influence of a new market fundamental (sustainability)
Understand a new set of property characteristics (green features)
© Timothy P. Runde 2012
Helps identify and measure ways sustainability impacts market value
Helps price that impact
Can accommodate change in market SO and subject’s “greenness” over time
© Timothy P. Runde 2012
Market is the first word in value
Who are the market participants?
• Tenants?
• Investors?
• Owner/users?
Is market SO or NSO?
© Timothy P. Runde 2012

• Few regulations
• Green-up limited to compliance
• Few or no green buildings beyond those mandated (eg: gov’t buildings)
• Limited or no evidence of sustainability uptake in community
• Survey data indicates regional area is brown
• Many regulations, incentives
• Voluntary green-up by landlords
• Green buildings common
• “Prius effect"; triple waste
stream; farmers’ markets; solar panels on homes
• Regional area scores high on green uptake
© Timothy P. Runde 2012
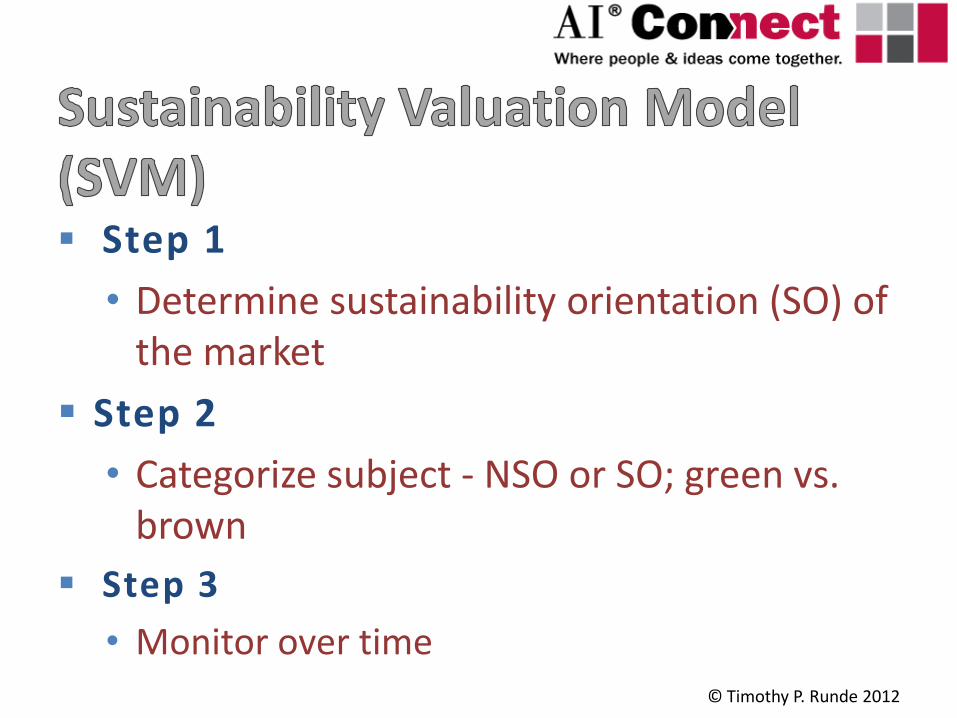
Step 1
• Determine sustainability orientation (SO) of the market
Step 2
• Categorize subject - NSO or SO; green vs. brown
Step 3
• Monitor over time
© Timothy P. Runde 2012
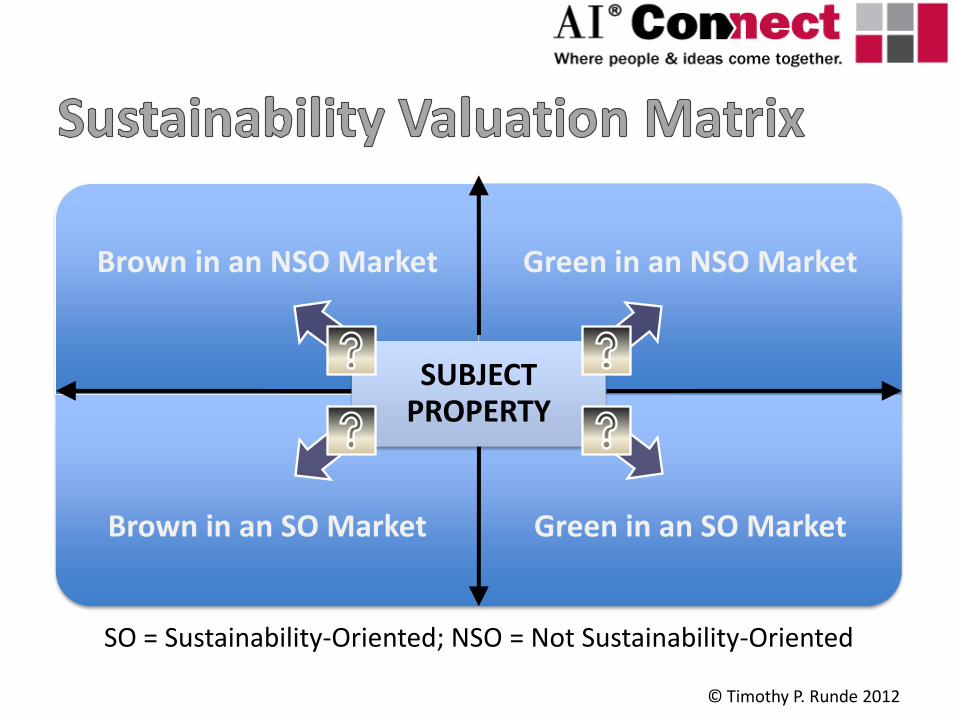
Brown in an NSO Market Green in an NSO Market
Brown in an SO Market Green in an SO Market
SUBJECT PROPERTY
SO = Sustainability-Oriented; NSO = Not Sustainability-Oriented
© Timothy P. Runde 2012
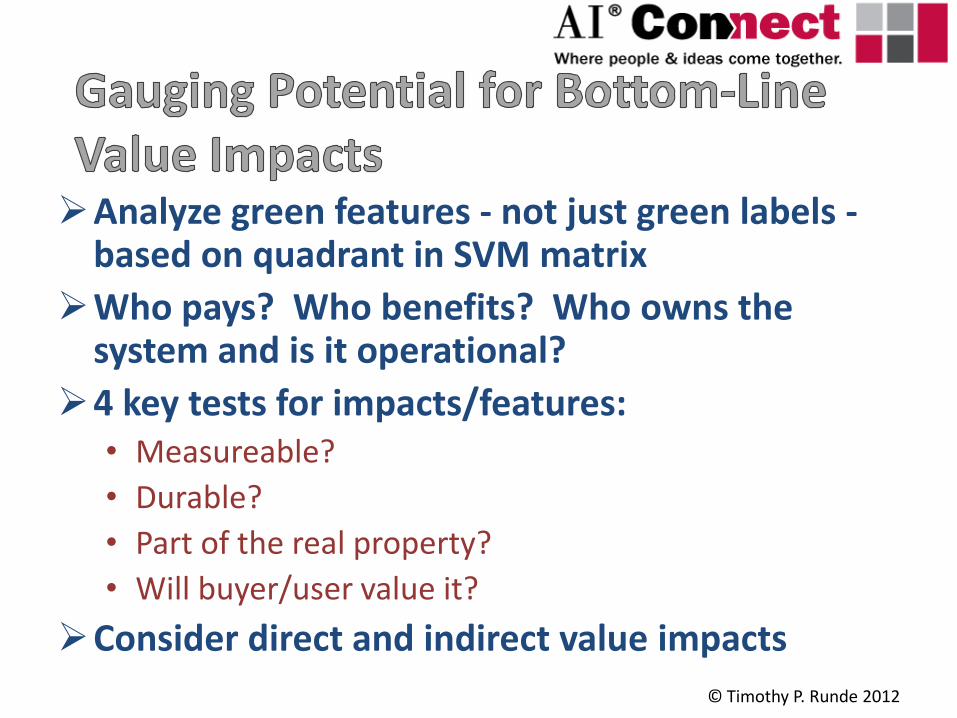
Analyze green features - not just green labels - based on quadrant in SVM matrix
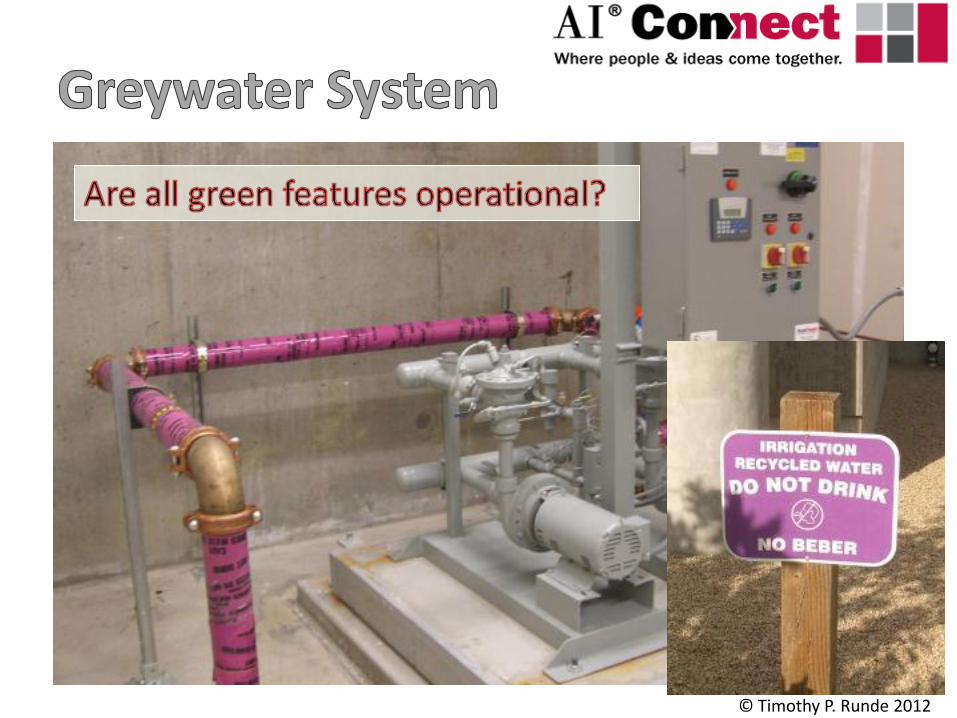
Who pays? Who benefits? Who owns the system and is it operational?
4 key tests for impacts/features: • Measureable?
• Durable?
• Part of the real property?
• Will buyer/user value it?
Consider direct and indirect value impacts
© Timothy P. Runde 2012
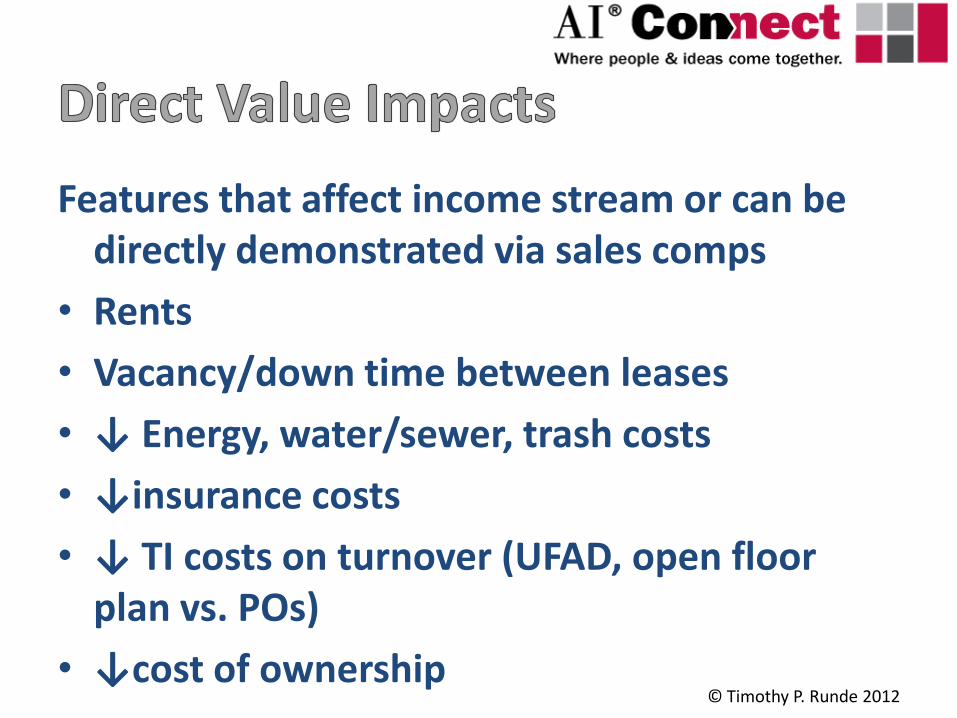
Features that affect income stream or can be directly demonstrated via sales comps
• Rents
• Vacancy/down time between leases
• ↓ Energy, water/sewer, trash costs
• ↓insurance costs
• ↓ TI costs on turnover (UFAD, open floor plan vs. POs)
• ↓cost of ownership © Timothy P. Runde 2012
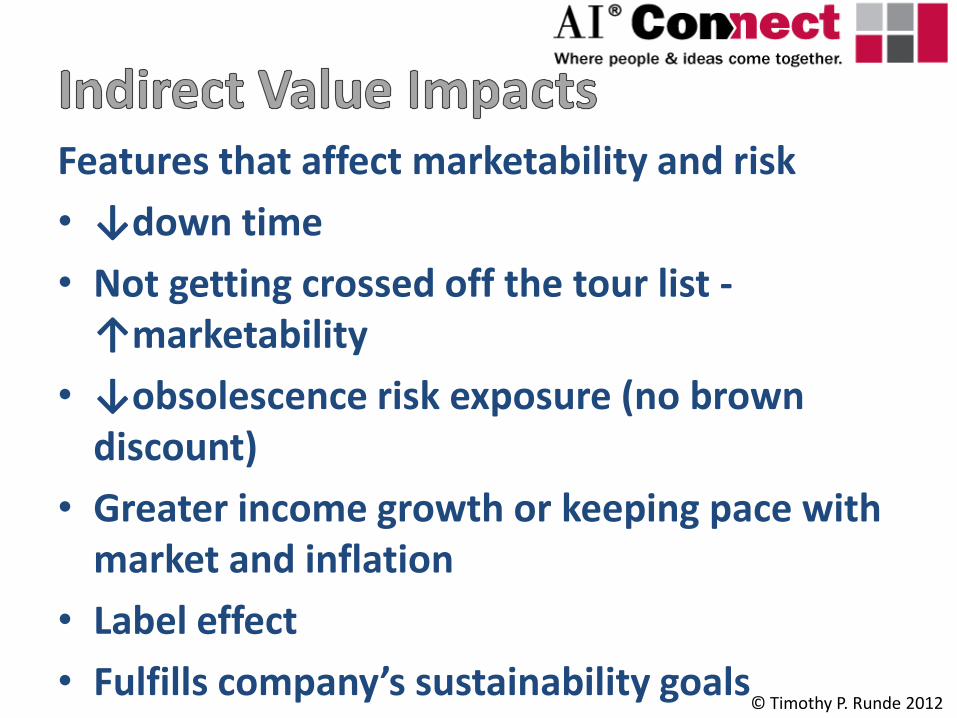
Features that affect marketability and risk
• ↓down time
• Not getting crossed off the tour list - ↑marketability
• ↓obsolescence risk exposure (no brown discount)
• Greater income growth or keeping pace with market and inflation
• Label effect
• Fulfills company’s sustainability goals © Timothy P. Runde 2012
© Timothy P. Runde 2012
© Timothy P. Runde 2012
© Timothy P. Runde 2012
© Timothy P. Runde 2012
© Timothy P. Runde 2012
© Timothy P. Runde 2012
© Timothy P. Runde 2012
© Timothy P. Runde 2012
© Timothy P. Runde 2012
Section Four
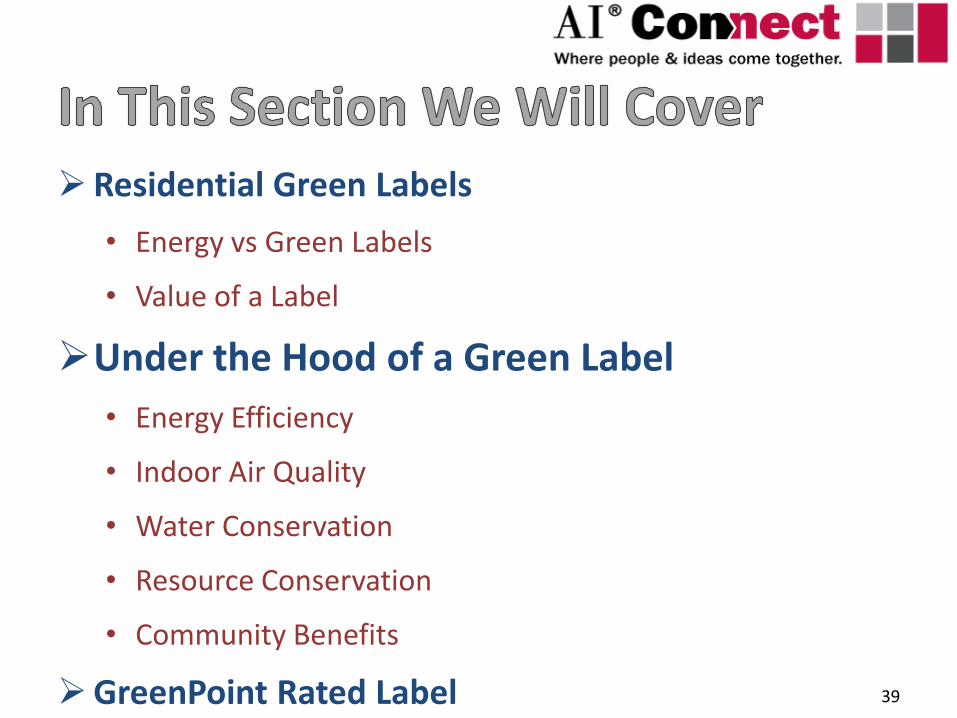
Residential Green Labels
• Energy vs Green Labels
• Value of a Label
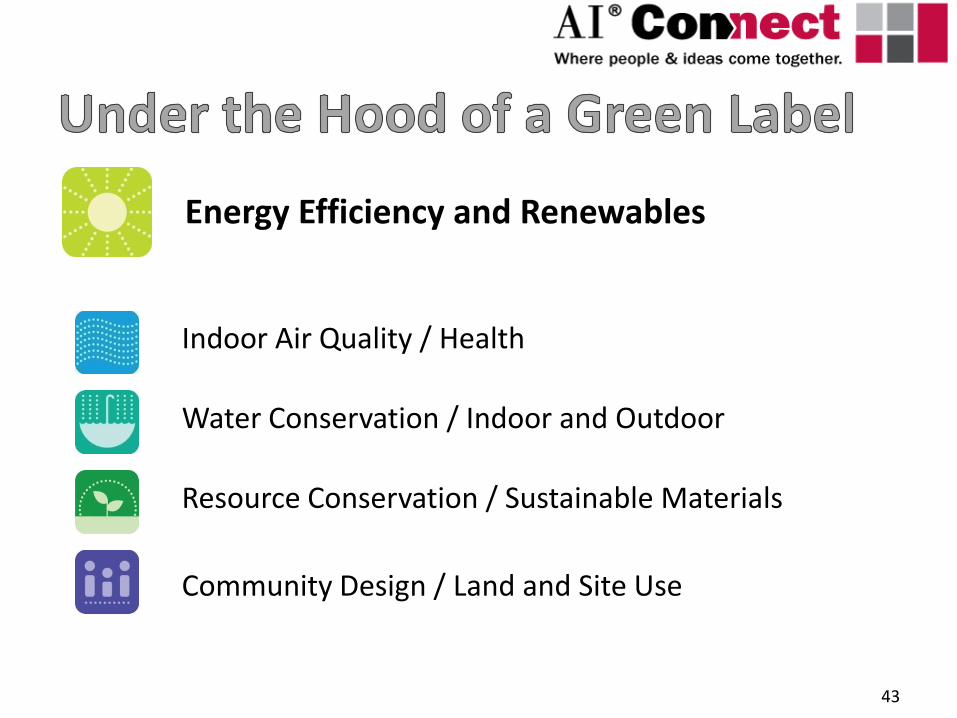
Under the Hood of a Green Label
• Energy Efficiency
• Indoor Air Quality
• Water Conservation
• Resource Conservation
• Community Benefits
GreenPoint Rated Label 39
Set a standard
Third party verification
Quality assurance
Based on research and industry expertise
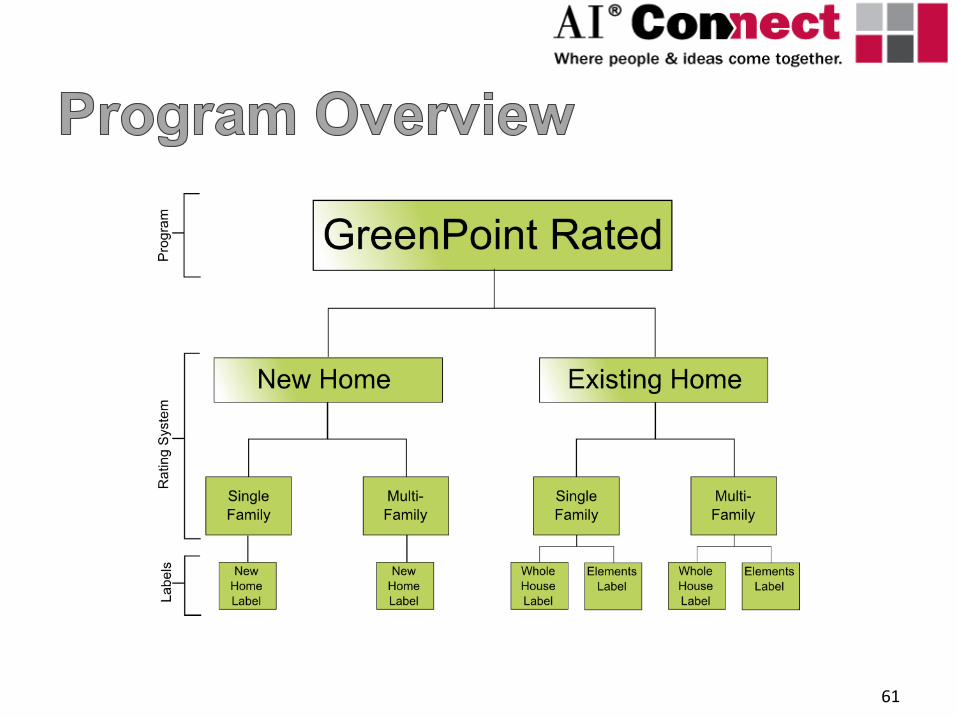
• Energy Efficiency Home Labels – New Homes: ENERGY STAR Homes – Existing Homes:
– California Home Energy Rating (HERS II) – DOE Home Energy Score
Green Home Labels – LEED for Homes – National Green Building Standard (NAHB) – GreenPoint Rated
Product Labels
41
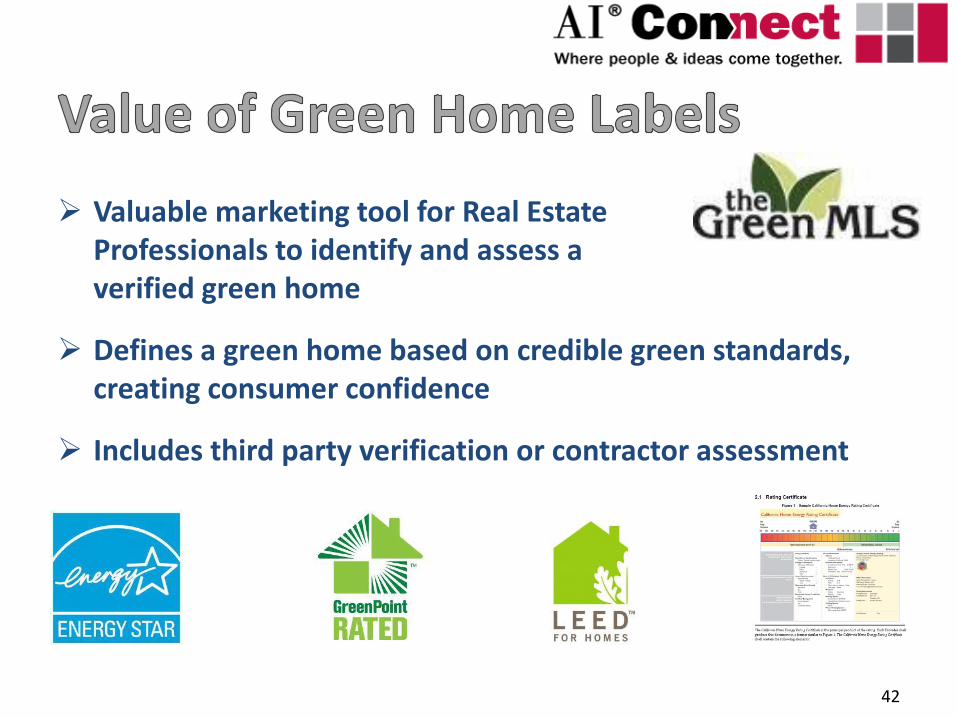
Valuable marketing tool for Real Estate Professionals to identify and assess a verified green home
Defines a green home based on credible green standards, creating consumer confidence
Includes third party verification or contractor assessment
42
43
Energy Efficiency and Renewables
Indoor Air Quality / Health
Water Conservation / Indoor and Outdoor
Resource Conservation / Sustainable Materials
Community Design / Land and Site Use
44
Energy Efficiency Energy efficient homes are typically: • Less drafty • More comfortable • Quieter • Have lower utility bills • Lower demand on power grid • Have lower environmental impact
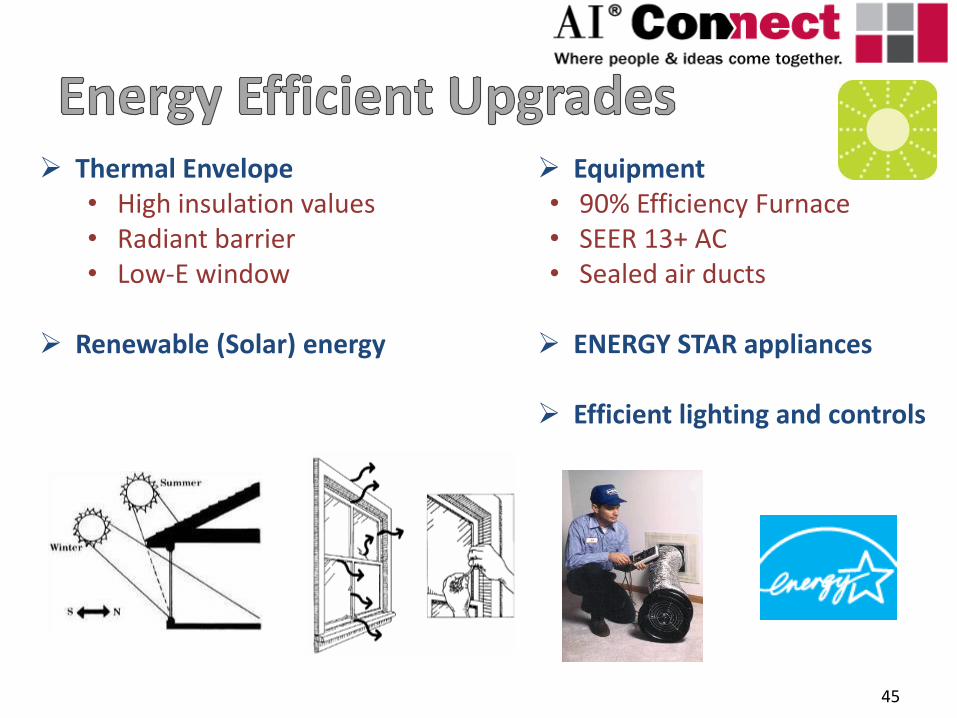
Thermal Envelope • High insulation values • Radiant barrier • Low-E window
Renewable (Solar) energy
45
Equipment • 90% Efficiency Furnace • SEER 13+ AC • Sealed air ducts
ENERGY STAR appliances
Efficient lighting and controls
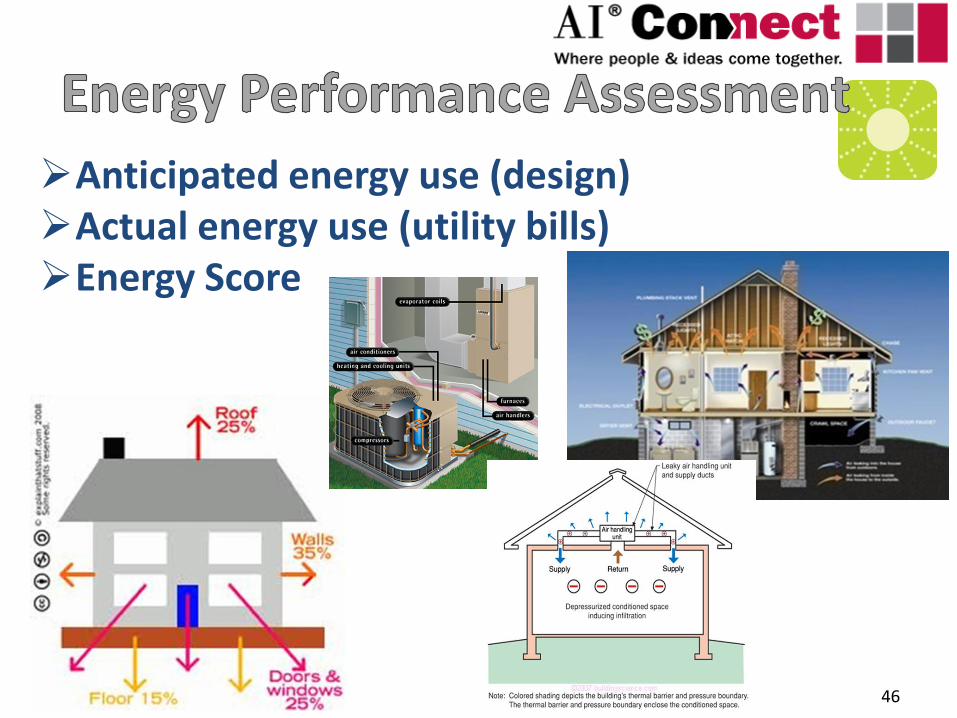
Anticipated energy use (design) Actual energy use (utility bills) Energy Score
46
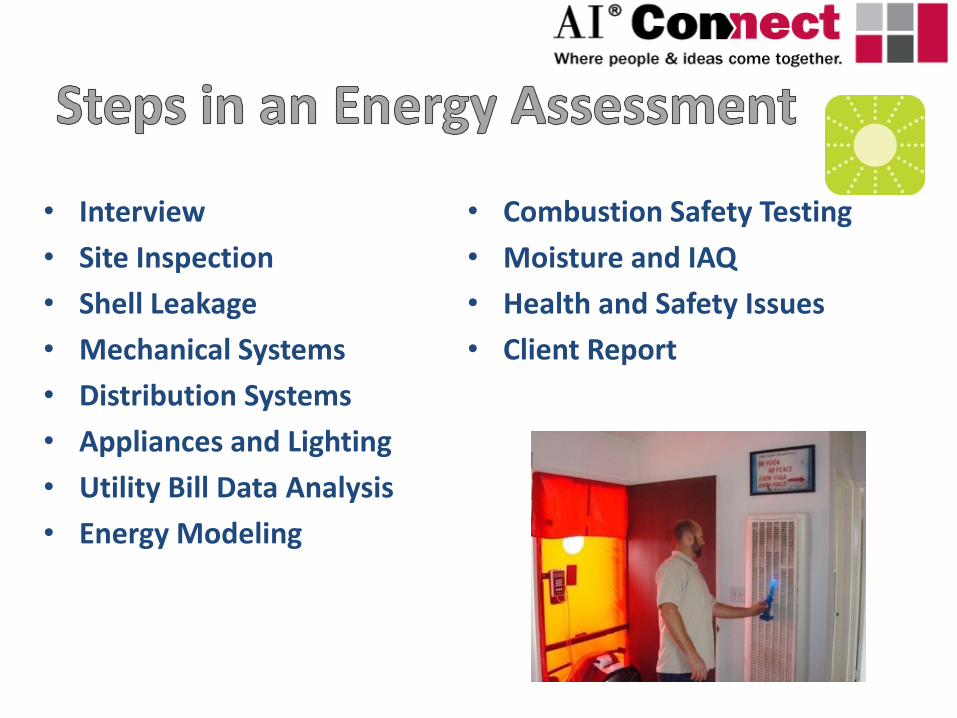
• Interview
• Site Inspection
• Shell Leakage
• Mechanical Systems
• Distribution Systems
• Appliances and Lighting
• Utility Bill Data Analysis
• Energy Modeling
• Combustion Safety Testing
• Moisture and IAQ
• Health and Safety Issues
• Client Report
48
Indoor Air Quality
• Indoor Air = 10X more polluted than outdoor air (EPA)
• 40 % of children will develop respiratory disease in part due to chemicals in their homes (New England Journal of Medicine)
• Commonly used adhesives, paints, and floor finishes contain compounds that are known to cause cancer or trigger asthma.
• Poor ventilation = excessive dust and mold = adverse health effects
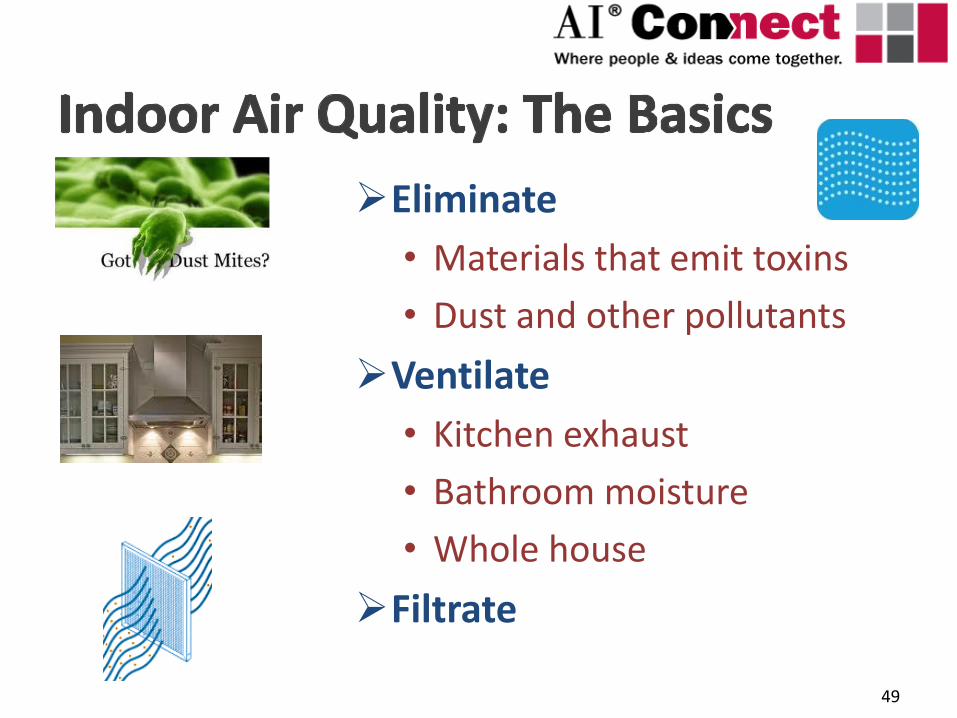
Eliminate
• Materials that emit toxins
• Dust and other pollutants
Ventilate
• Kitchen exhaust
• Bathroom moisture
• Whole house
Filtrate
49
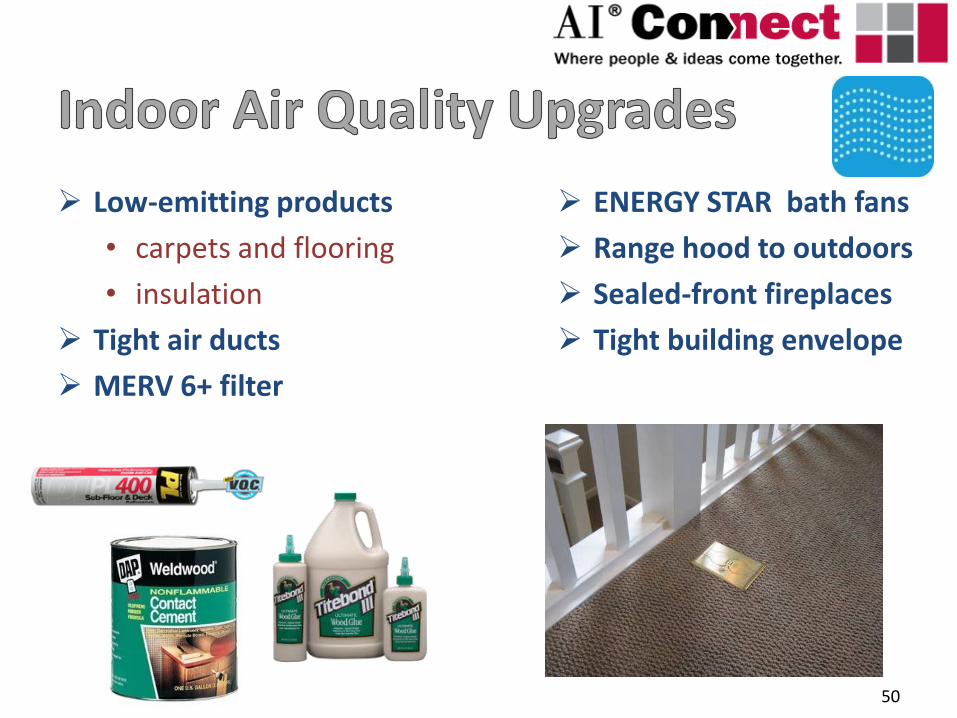
Low-emitting products
• carpets and flooring
• insulation
Tight air ducts
MERV 6+ filter
50
ENERGY STAR bath fans
Range hood to outdoors
Sealed-front fireplaces
Tight building envelope
51
Water Conservation
Water efficient homes typically: • Use less water for domestic and irrigation • Use less energy for hot water use • Save on utility bills • Perform better in periods of water shortage
and cost increases
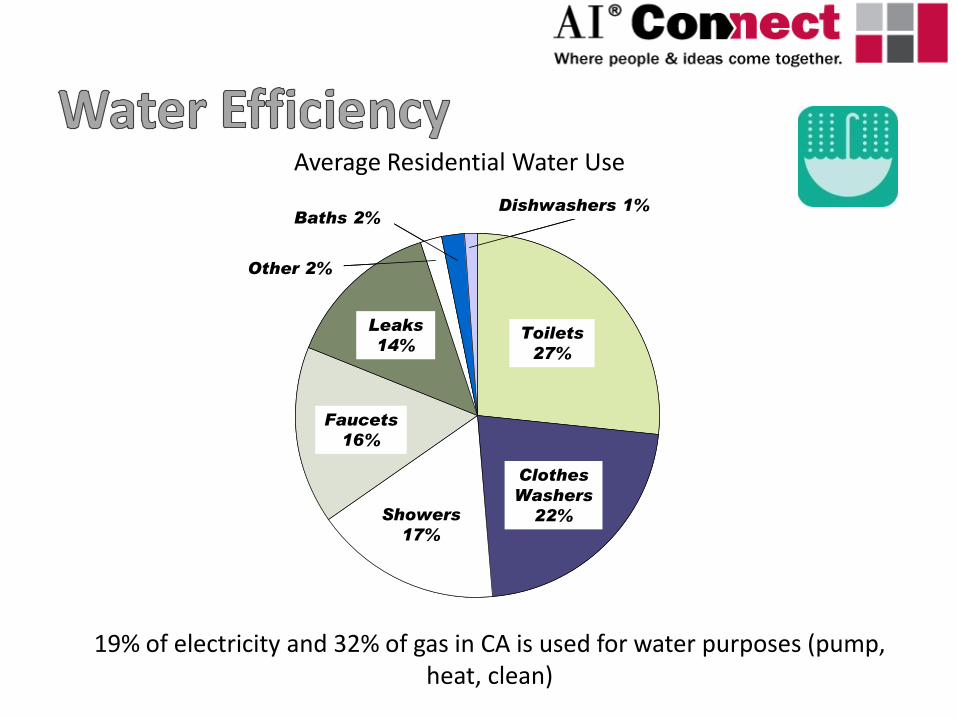
Clothes
Washers
22%
Toilets
27%
Showers
17%
Faucets
16%
Leaks
14%
Other 2%
Baths 2%Dishwashers 1%
Clothes
Washers
22%
Toilets
27%
Showers
17%
Faucets
16%
Leaks
14%
Other 2%
Baths 2%Dishwashers 1%
19% of electricity and 32% of gas in CA is used for water purposes (pump, heat, clean)
Average Residential Water Use
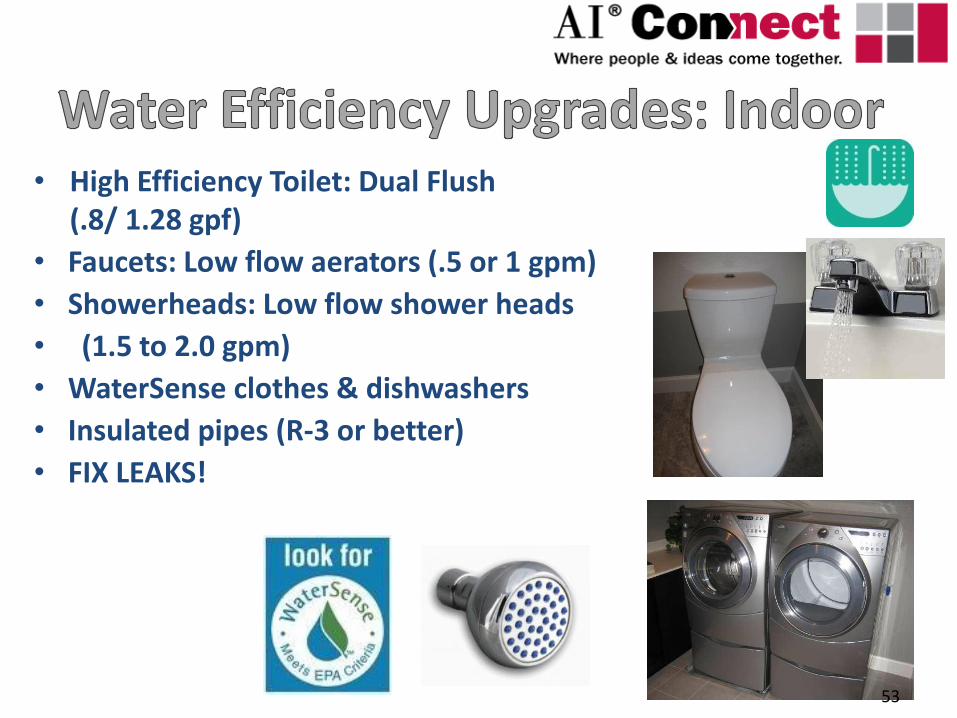
• High Efficiency Toilet: Dual Flush (.8/ 1.28 gpf)
• Faucets: Low flow aerators (.5 or 1 gpm)
• Showerheads: Low flow shower heads
• (1.5 to 2.0 gpm)
• WaterSense clothes & dishwashers
• Insulated pipes (R-3 or better)
• FIX LEAKS!
53
54
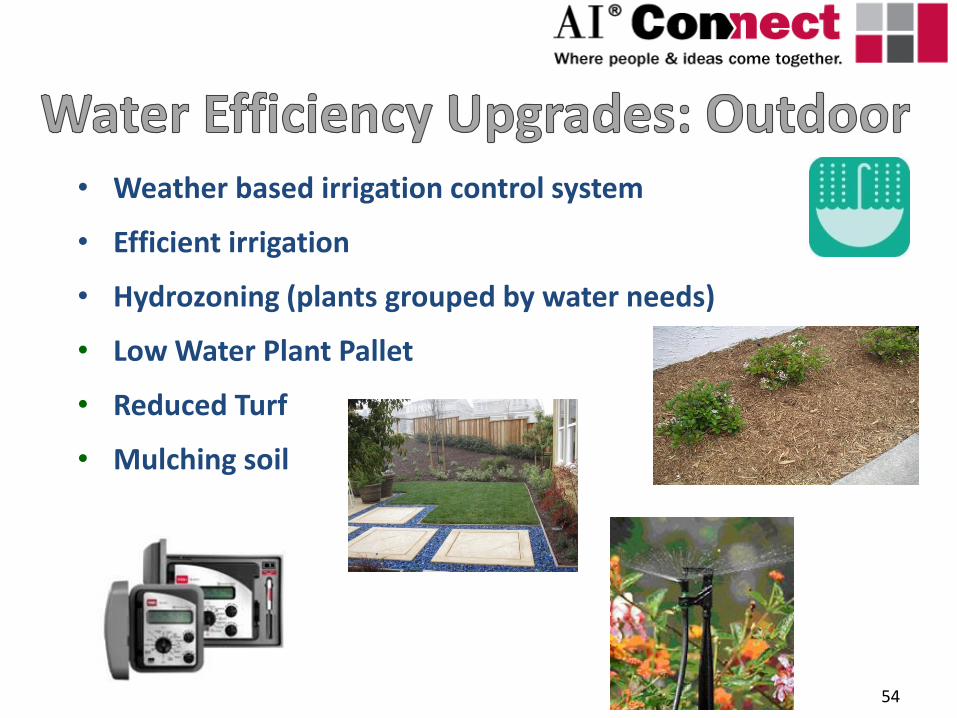
• Weather based irrigation control system
• Efficient irrigation
• Hydrozoning (plants grouped by water needs)
• Low Water Plant Pallet
• Reduced Turf
• Mulching soil
55
Resource Conservation
Resource efficient homes typically: • Are more durable (less maintenance and rehab) • Use less virgin materials (more recycled content) • Use more efficient materials (composite woods) • Reduced waste during construction • Designed for ongoing domestic waste reduction
Follow The Three R’s
Reduce
Reuse
Recycle
56
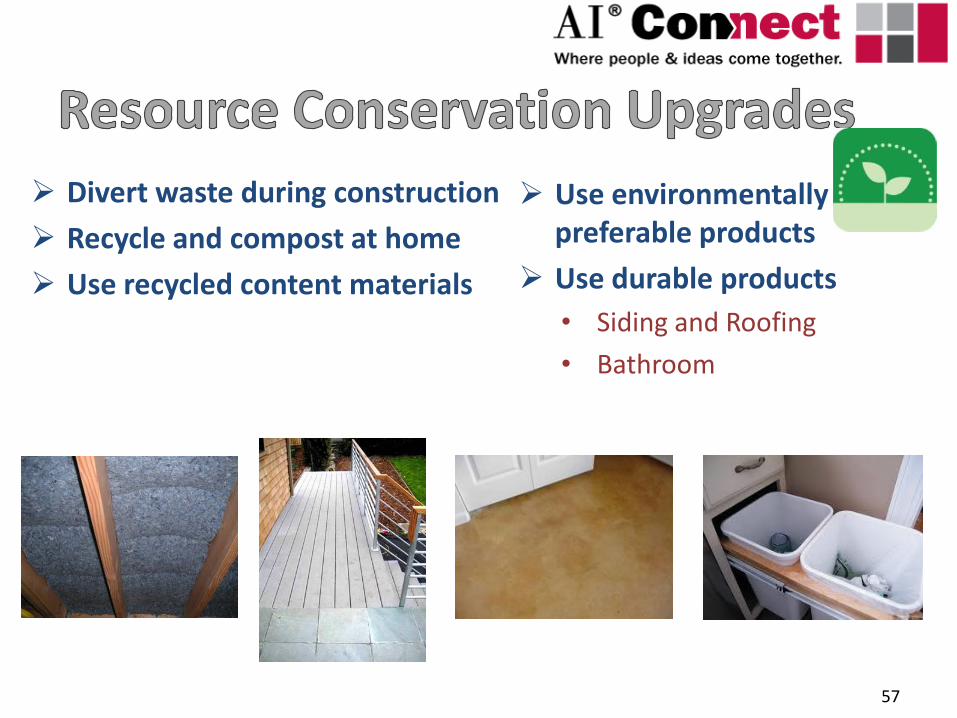
Divert waste during construction
Recycle and compost at home
Use recycled content materials
57
Use environmentally preferable products
Use durable products
• Siding and Roofing
• Bathroom
58
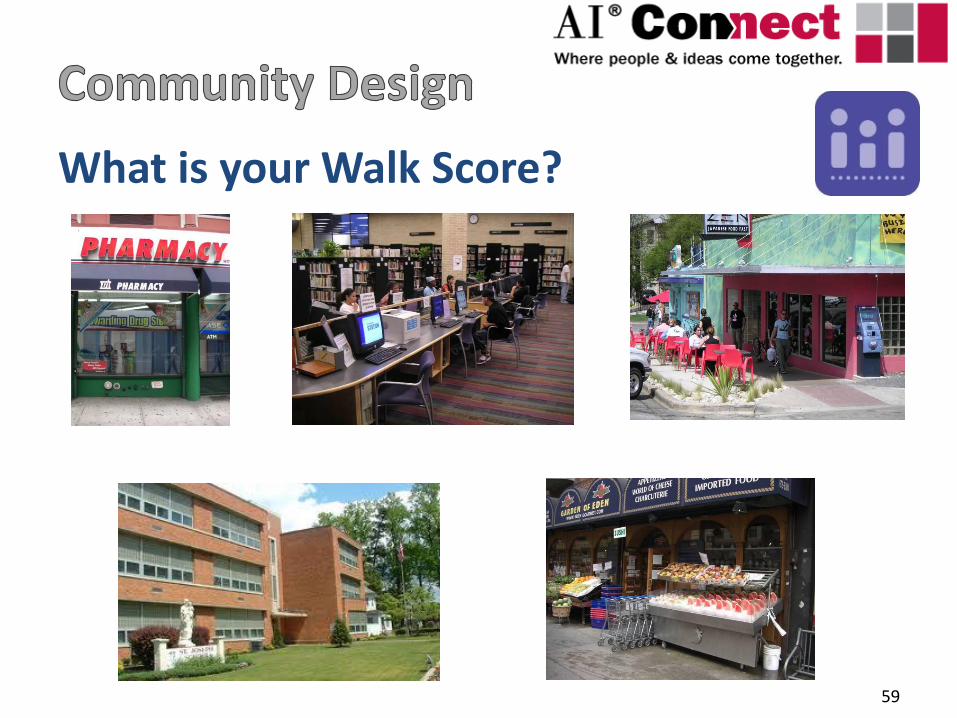
Community Design
Quality of Life Enhancements • Health – walk and bike friendly, proximity to services,
nature and recreation • Family – proximity to services = reduced commute time • Safety – visible home entries • Community - social gathering spaces, front porches Environmentally Friendly • Higher density + proximity to service + proximity to
transportation = reduction of green house gas emissions from cars
59
What is your Walk Score?
61
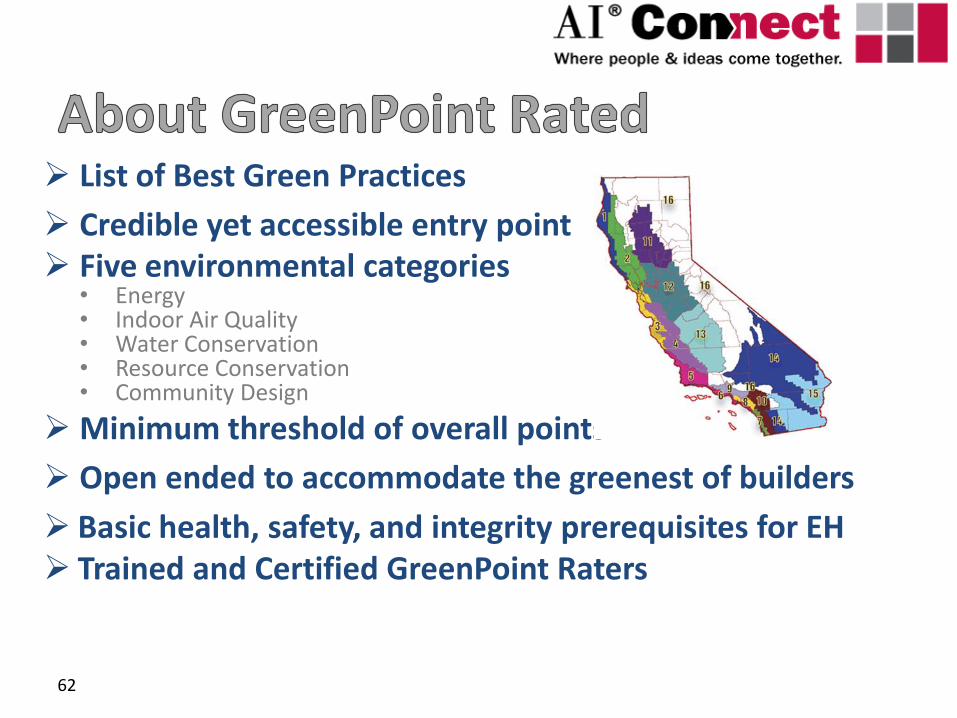
List of Best Green Practices
Credible yet accessible entry point Five environmental categories
• Energy • Indoor Air Quality • Water Conservation • Resource Conservation • Community Design
Minimum threshold of overall points
Open ended to accommodate the greenest of builders
Basic health, safety, and integrity prerequisites for EH Trained and Certified GreenPoint Raters
62
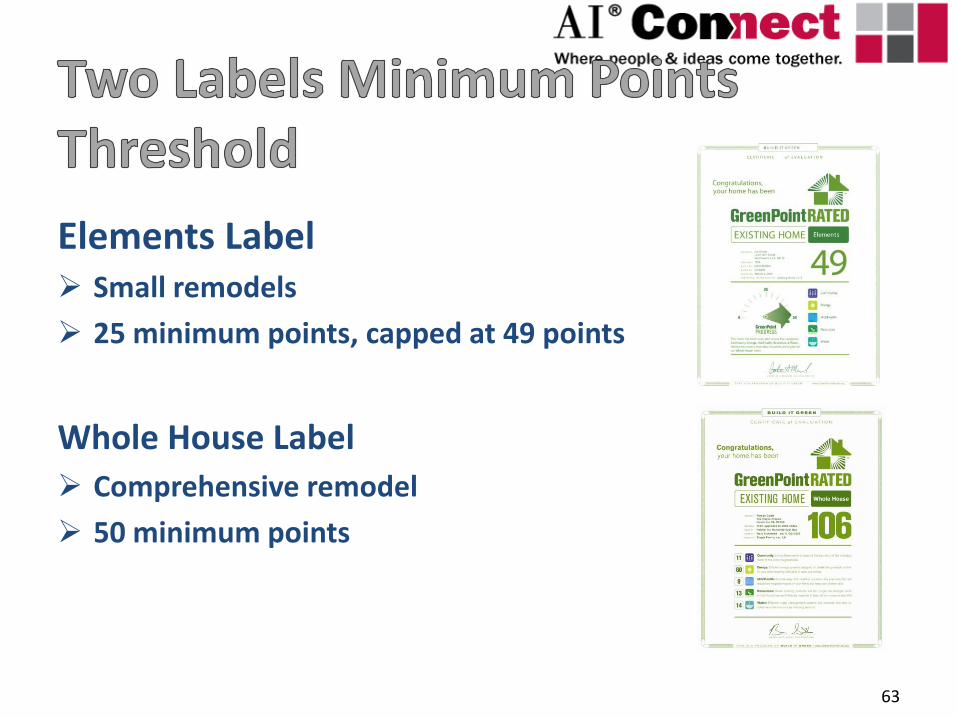
Elements Label Small remodels
25 minimum points, capped at 49 points
Whole House Label
Comprehensive remodel
50 minimum points
63
© Build It Green 2010
64
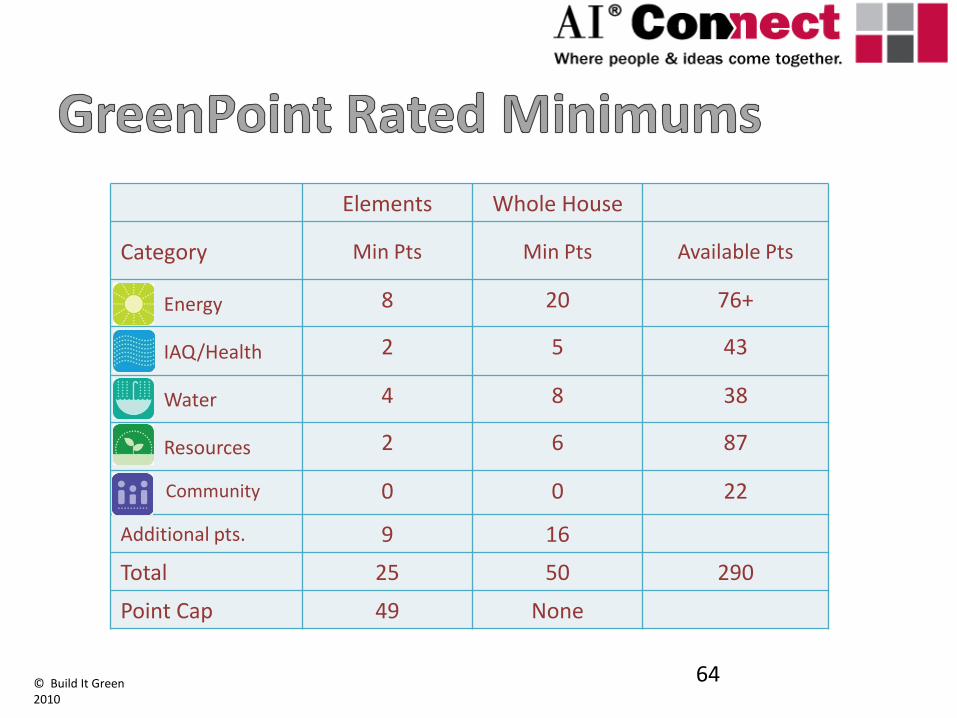
Elements Whole House
Category Min Pts Min Pts Available Pts
Energy 8 20 76+
IAQ/Health 2 5 43
Water 4 8 38
Resources 2 6 87
Community 0 0 22
Additional pts. 9 16
Total 25 50 290
Point Cap 49 None
#
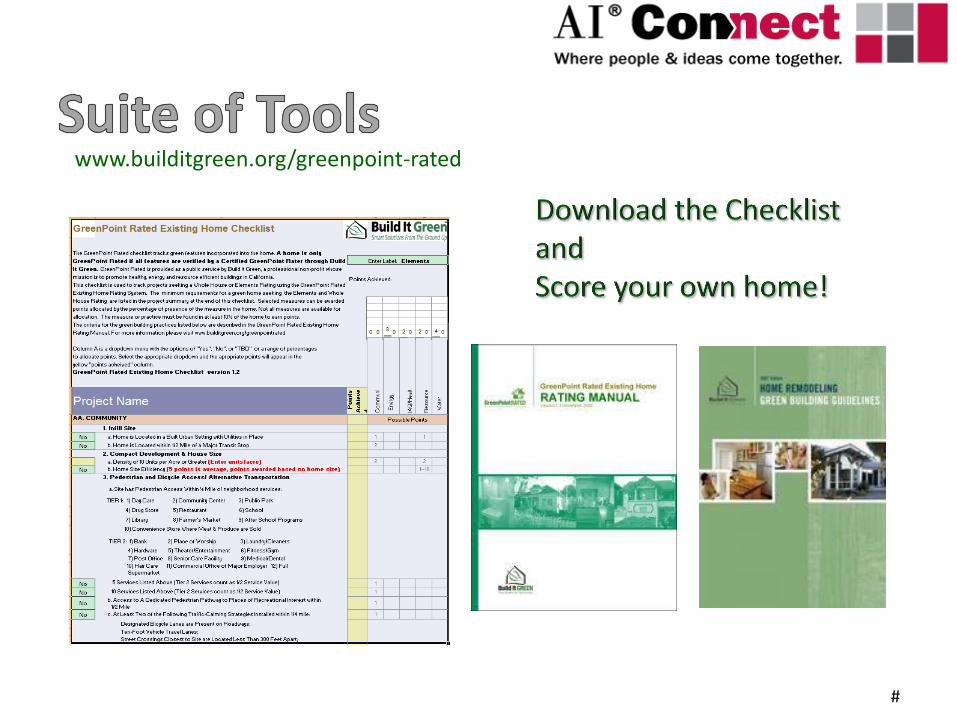
www.builditgreen.org/greenpoint-rated
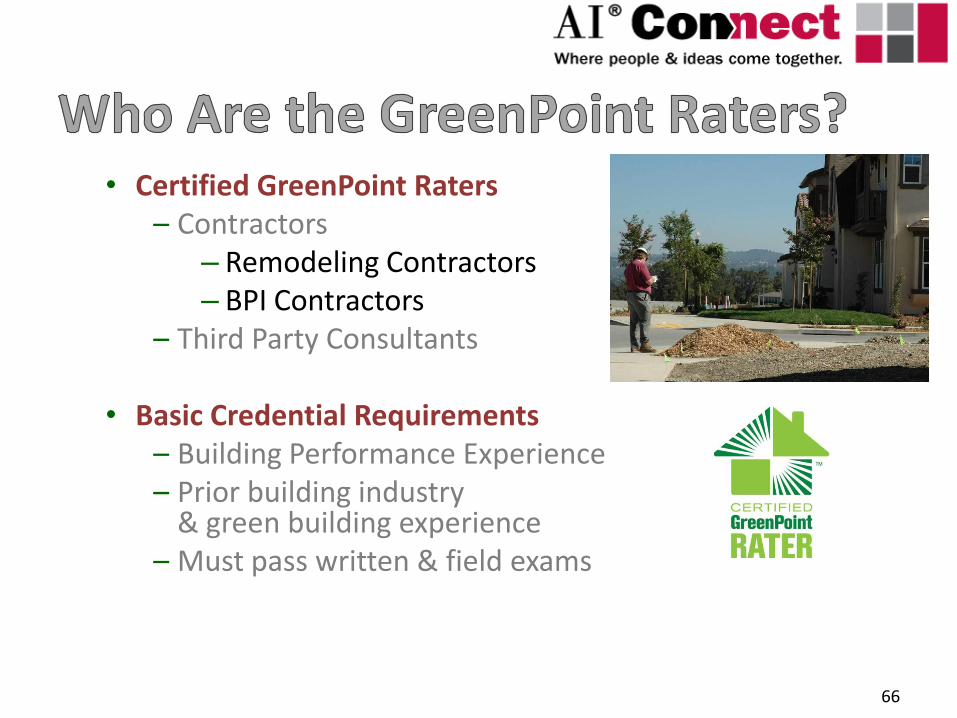
• Certified GreenPoint Raters – Contractors
– Remodeling Contractors – BPI Contractors
– Third Party Consultants
• Basic Credential Requirements – Building Performance Experience – Prior building industry
& green building experience – Must pass written & field exams
66
Managed by Build It Green
California-focused, non-profit organization promoting residential green construction
Offers training and certifications
Performs quality assurance
67
Find a Rater:
• www.BuildItGreen.org/en/directories
GreenPoint Rated Hotline
• www.GreenPointRated.com
• 510-590-3360 x 604
Training Hotline
• 510-590-3360 x 603
68
Section Five
Residential vs. commercial valuation issues
Use same general methodology (determine market SO, apply 4 key tests, look for direct and indirect impacts)
Use GRM for EE and water savings; onsite power generation
Importance of knowing market SO – will buyer or occupant use and value it? Not the same as whether the agent thinks they will
© Timothy P. Runde 2012
Not all studies are created equal
• Is methodology sound?
• How large is the data set?
• Are properties similar?
• How does the data set compare to the subject?
Consider the source/funding for study
Peer-reviewed publications vs. white papers
If you don’t understand it, don’t use it!
© Timothy P. Runde 2012
Scorecard if subject has green label
Historical utilities
• Disaggregate when possible
Cost of any green upgrades
Contact rater/consultant
Copy of performance assessment
© Timothy P. Runde 2012
Must meet 3 criteria:
1) commonly accepted set of features based on the principle of sustainability;
2) features must be independently verifiable;
3) Modeled performance must be verifiable by actual results
© Timothy P. Runde 2012
Market is the first word in value
Check your bias at the door
Think green features not just green labels
Trust, but verify
Stay current
© Timothy P. Runde 2012
Timothy P. Runde, MAI, LEED AP Carneghi-Blum & Partners, Inc. San Francisco, CA Ph (415) 777 -2666 x110 Cell (415) 265-9914
trunde @comcast.net
For More Info on How to Value Green Buildings: “Integrating Sustainability & Green Building into the Appraisal Process” in The Journal of Sustainable Real Estate, Volume 2
http://tinyurl.com/JOSRE-appraisal