special education eligibility and the … · iv special education eligibility and the learning...
TRANSCRIPT

SPECIAL EDUCATION ELIGIBILITY AND THE LEARNING DISABILITY
CATEGORY: EXAMINING ENVIRONMENTAL, CULTURAL,
AND SOCIO-ECONOMIC FACTORS
By
CHRISTOPHER ADAM CHRISTENSON
A dissertation/thesis submitted in partial fulfillment of the requirements for the degree of
DOCTOR OF PHILOSOPHY
WASHINGTON STATE UNIVERSITY College of Education
DECEMBER 2004
© Copyright by CHRISTOPHER ADAM CHRISTENSON, 2004
All Rights Reserved

© Copyright by CHRISTOPHER ADAM CHRISTENSON, 2004 All Rights Reserved
ii
To the Faculty of Washington State University:
The members of the Committee appointed to examine the dissertation of CHRISTOPHER ADAM CHRISTENSON find it satisfactory and recommend that it be accepted.
___________________________________ Chair ___________________________________ ___________________________________

iii
ACKNOWLEDGMENT
There are many people responsible for the successful completion of this project.
While I cannot properly acknowledge everyone who offered assistance, support, and
guidance, this is certainly more than the work of one person.
I wish to acknowledge and thank Dr. Gail Furman for her continuous support,
advice, and encouragement. Her expertise and passion for qualitative research were
invaluable throughout the entire doctoral process, and I am extremely thankful for
everything she has done on my behalf. I also wish to thank the other members of my
dissertation committee, Dr. Don Reed, Dr. Jennifer Beller, and Dr. Michael Trevesan, for
their valuable input into my research.
Thanks also go out to the fine educators who participated in this study. Your
insights provided rich data and guided me down a very interesting path.
A sincere debt of gratitude goes out to my parents, Greg Christenson and Jan
Christenson, both of whom have supported me throughout this entire process, as well as
in previous academic ventures. Without the two of you, I wouldn’t have the drive to
succeed in my academic career. The importance you placed upon education and your
belief in me has really inspired me to do my best and accomplish all of the goals I can
reach.
Most of all, I want to thank my wife, Anne, and my son, Aidan. You have been
extremely encouraging throughout this process, and you never wavered in your support
of this extremely long journey. Anne, you deserve an honorary degree for putting up with
me through it all. Aidan, I hope you understand the doors education can open for you,
and may your thirst for knowledge continue throughout your entire life. You both mean
the world to me.

iv
SPECIAL EDUCATION ELIGIBILITY AND THE LEARNING DISABILITY
CATEGORY: EXAMINING ENVIRONMENTAL, CULTURAL,
AND SOCIO-ECONOMIC FACTORS
Abstract
by Christopher Adam Christenson, Ph.D.
Washington State University December 2004
Chair: Gail Furman The purpose of this investigation was to examine the processes special education
teams engage in when determining student eligibility for special education services under
the learning disabilities category. Of particular interest were the exclusionary factors of
cultural, environmental, and economic deficit, and the role they play with regard to
referral, assessment, and placement decision-making. Previous research indicates that
while both state and federal special education law states that students are not to be
identified as having a learning disability if these exclusionary factors are the primary
cause of a student’s difficulty, processes for addressing these issues are inconsistent and
often not followed.
Qualitative methods were used in this investigation. Research procedures included
observing special education meetings where learning disability eligibilities were
determined, interviewing team members responsible for making these placement
decisions, and collecting documents used in the determination process. Three school
districts of similar size but very different student demographic compositions were
selected as research sites.

v
The results of the investigation indicate that teams face many challenges when
attempting to address exclusionary factors, such as vague state and federal definitions of
terms, severely limited guidance from districts on how to rule out exclusionary factors,
limited time to gather comprehensive data regarding student characteristics, and
discomfort at delving into home- and family-based student issues. While teams generally
make an effort to look into exclusionary factors, how this is accomplished often depends
on the influential members of the team, particularly the school psychologist. There is
little consistency across teams. Differences in student population with regard to
demographic characteristics greatly impact the resources at a district’s disposal. This, in
turn, impacts the role special education plays as a resource for addressing academic needs
in minority and low-income populations.
Recommendations for districts based upon the findings include fostering the
student assistance team process, implementing greater training on eligibility procedures,
revamping required paperwork, and ensuring three-pronged eligibility standards.

vi
TABLE OF CONTENTS Page ACKNOWLEDGEMENTS................................................................................................ iii ABSTRACT.........................................................................................................................iv LIST OF TABLES................................................................................................................x CHAPTER 1. INTRODUCTION TO THE STUDY....................................................................1 Introduction......................................................................................................1 Focus of the Study ...........................................................................................2 Research Problem ............................................................................................3 Purpose.............................................................................................................6 Methodology....................................................................................................7 Validity and Ethics...........................................................................................7 Significance......................................................................................................8 Report of the Study ..........................................................................................9 2. REVIEW OF LITERATURE ..............................................................................10 Introduction....................................................................................................10 Special Education Origins..............................................................................11 Interpretation of IDEA Regulations...............................................................12 Special Education’s Increasing Prominence..................................................15 The Learning Disability Category .................................................................16 Funding and Costs .........................................................................................19 The Impacts of Bureaucracy and Litigation...................................................22

vii
Addressing Potential Ethnic Bias...................................................................24 The Culture of Poverty...................................................................................28 Learning Disability Exclusionary Factors .....................................................31 3. RESEARCH METHODOLOGY.........................................................................33 Rationale ........................................................................................................33 Study Design..................................................................................................34 Research Sites ................................................................................................35 The Districts..........................................................................................36
Aspen School District ..................................................................37 Birch School District....................................................................41 Cedar School District...................................................................44 Participants............................................................................................47 Procedures ......................................................................................................50 Data Collection .....................................................................................50 Data Analysis ........................................................................................52 Validity .................................................................................................53
4. ANALYSIS: DETERMINING ELIGIBILITY FOR SPECIAL
EDUCATION SERVICES UNDER THE LEARNING DISABILITIES CATEGORY........................................................................................................55 Introduction....................................................................................................55 Role of Team Members .................................................................................56 Leadership Roles...................................................................................57
Laws, Regulations, and Procedures: Expert Authority.........................58

viii
Who Makes the Decisions?...................................................................59 Team Member Roles and Exclusionary Factors ...................................63 Role of Special Education..............................................................................64 The Hierarchy of Intervention ..............................................................65 Selecting Appropriate Referrals............................................................67 What Makes An Eligibility Determination Meeting “Successful”? .....68 Social Dynamics of the Decision-Making Process........................................70 Participants............................................................................................71 Commonalities ......................................................................................71
Conflict .................................................................................................73 Considering Exclusionary Factors for LD Eligibility....................................76 The Difficulty with Ruling Out Exclusionary Factors..........................77 Environment..........................................................................................79 Culture...................................................................................................85 Socio-Economic Status .........................................................................94 Formalized Means of Addressing Exclusionary Criteria...............................96 Ethics of Eligibility Determination..............................................................106 District Demographic Composition .............................................................114 Summary ......................................................................................................118
5. SUMMARY AND CONCLUSIONS ................................................................119 Introduction..................................................................................................119 Legal and Conceptual Ambiguities..............................................................120 Procedural Ambiguities ...............................................................................123

ix
Individual Differences .................................................................................124 District Demographics .................................................................................128 Summary of Findings...................................................................................130 Recommendations for Districts....................................................................132 Develop Student Assistance Teams ....................................................132 Training on Special Education Services .............................................133 Develop Appropriate Procedures and Paperwork...............................134 Abide by Three-Pronged Eligibility Requirement..............................134 Increase Early Childhood Intervention ...............................................135 Recommendations for Further Research......................................................136 REFERENCES .................................................................................................................138 APPENDICES A. INTERVIEW PARTICIPANTS ........................................................................144
B. INTERVIEW GUIDE........................................................................................145 C. ASPEN SCHOOL DISTRICT SPECIAL SERVICES DEPARTMENT
REFERRAL MEETING WORKSHEET ..........................................................146
D. ASPEN SCHOOL DISTRICT SPECIAL SERVICES DEPARTMENT EVALUATION REPORT .................................................................................147 E. SPECIFIC LEARNING DISABILITY ELIGIBILITY STATEMENT ............149

x
LIST OF TABLES
1. Washington and District Demographic Statistics, 2002-03..........................................37
2. Aspen School District 2002-03 WASL Performance ...................................................40
3. Birch School District 2002-03 WASL Performance ....................................................43
4. Cedar School District 2002-03 WASL Performance....................................................46

1
CHAPTER I
INTRODUCTION TO THE STUDY
Introduction
This study was an investigation of the decision-making processes engaged in by
public school teams in Washington State when determining student eligibility for special
education under the learning disability category. Specific learning disability is one of the
14 categories described by the Washington Administrative Code (WAC 392-197, 2000)
under which a student may become eligible for special education services. This category
contains specific requirements for assessment, eligibility, and service. This study
examines how these requirements are addressed by special education teams.
For the purposes of this study, eligibility determination is defined as those
procedures mandated by WAC to determine whether or not a student is eligible to receive
special education services. Special education services are defined as those services
delivered by special education staff to address individual student needs as defined
through assessment data and the Individualized Education Plan (IEP) and funded by
special education monies. Disability is defined as one of the 14 categories for which a
student may qualify for special education services under WAC. Disabilities are generally
based upon deficits in cognitive, physical, or processing functioning or sensory-intake.
Special education eligibility is a team-based process. Multi-disciplinary teams,
special education teams, or IEP teams are defined as those groups of public school staff
who are assigned to determining appropriateness of referral, eligibility for service, and
service delivery for a given student. These teams are comprised of staff from diverse
disciplines, such as general education instruction, special education instruction, school

2
psychology, speech-language pathology, administration, counseling, etc. This study
examines the interaction within teams during eligibility determination, as well as the
individual thoughts and feelings of team members regarding the process.
The learning disability category, as described in state and federal legislation, has
specific requirements for eligibility that must be addressed prior to or during the
evaluation process. Exclusionary criteria are defined in this study as those factors that
may make a student ineligible for services under the learning disability category, such as
functioning deficits primarily the result of environmental or cultural factors. Academic
deficit is defined as academic performance or understanding that is significantly below
that of a student’s grade level standard or his/her own intellectual ability. Ruling out non-
disability based contributors to academic deficit is one requirement for special education
team deliberations when considering eligibility under the learning disability category.
Focus of the Study
While knowledge of the legal requirements involved in eligibility determination is
important, the focus of this study is examining the processes teams actually engage in
when determining whether a student is a candidate for special education services. The
guidelines set forth in the federal Individuals with Disabilities Act (P.L. 105-17, 1997)
and the Washington Administrative Code (WAC) lead teams in certain procedural
directions; however, all teams interpret these guidelines in different ways and use their
judgment and discretion in making eligibility decisions. The actual processes used by the
teams were of interest in this study.
Of particular importance in this study are the methods used by teams to address
exclusionary factors listed in WAC 392-172-126, which states that a learning disability

3
cannot be the result of an environmental, cultural, or economic disadvantage. There are
other factors that are clearly defined in the statute, such as those pertaining to academic
functioning versus cognitive ability; but how teams address the environmental, cultural,
and economic exclusionary factors was of particular interest in this study.
It became apparent during the planning of this study that looking solely at the end
result of eligibility determination meetings (student eligibility versus ineligibility) would
not provide adequate explanation of the process by which teams address exclusionary
factors for students. Therefore, a qualitative study was planned to explore what actually
occurs during meetings, and how the education professionals involved think and feel
about such situations.
Research Problem
While the percentages vary from state to state, the nation as a whole is seeing a
steady and consistent growth in the number of students receiving special education
services. According to the Washington State Superintendent of Public Instruction 2004-
2005 Special Education Excess Cost Allocation Report for 10/29/04, over 122,000
students in Washington receive special education services. This figure represents 12.8
percent of the student population age 3-21. Of the fourteen disability conditions
delineated in IDEA, the category of Learning Disability is by far the most frequently used
to qualify students for special services. Over 51 percent of students receiving special
education support do so after having qualified as having a learning disability (Fuchs &
Fuchs, 1998; Worth, 1999).
While IDEA defines what a “learning disability” is at a federal level, each state
has been free to refine and interpret the definition, and the methods the states use to

4
qualify students vary greatly (Matz, 1997; Worth, 1999). This flexibility has created an
inconsistent system of identification, with one state’s regulations potentially much more
liberal or conservative than the next. How a state decides to interpret the IDEA definition
greatly impacts the number of learning disabled students it will serve. Regardless of the
state’s interpretation, many students are being identified as having a learning disability
when they may not actually qualify (Lopez, Forness, MacMillan, Bocian, & Gresham,
1996). By either qualifying students for services who do not meet special education
eligibility, or by serving students under the LD category when in fact they have a
disability other than a true learning disability, LD appears to be a growing catch-all
service category for students with academic deficits.
Special education programs are costly to run and expensive for taxpayers to fund.
Each student in Washington who is enrolled in special education brings nearly $8,000 to
the school district from a combination of state and federal funds (State of Washington
Joint Legislative Audit and Review Committee K-12 Special Education Study, 2000), as
compared to about $4,000 in revenue generated by each general education student. While
special education excess cost allocations add up for districts, the monies generated from
state and federal sources to run special education programs often do not cover the cost.
As all special education students are funded at a flat rate, programs serving highly-
involved students are likely to experience financial problems. Some special education
programs cannot maintain self-sufficiency, and general education dollars are required to
make up for the deficit. The high cost of services, combined with differing philosophies
of how money should be spent, has the potential to result in tension between special
education and general education (Meredith & Westwood, 1995).

5
A significant amount of research has shown that students from minority groups
and from poverty tend to receive special education service in greater proportion than
white, middle class students (eg. Colarusso, Keel, & Dangel, 2001). Many possible
reasons for the phenomenon have been suggested, such as unfair standardized testing
(Larry P. v. Wilson Riles; 1971, 1979, 1984, 1986), biased referral and eligibility
procedures (Coutinho, Oswald, & Best, 2001), and innate deficits in minority and poor
children (Artiles, Aguirre-Munoz, & Abedi, 1998). Payne (1998) describes the culture
with which individuals from poverty live, and describes how low-income and minority
populations frequently overlap. According to Payne, generational poverty has its own
culture, hidden rules, and belief system that are often in direct opposition to the
mainstream culture of schooling. Lack of resources, hidden social class rules, and
dissimilar language registers make educational success for students from poverty very
difficult. However, while the deficits that are a result of poverty are similar to the deficits
associated with disabilities, the causes of the deficits differ. Deficits associated with
poverty are the result of cultural factors, while deficits associated with learning
disabilities are the result of information processing factors.
Mirroring the wording in IDEA, the Washington Administrative Code 392-172-
126 states that, “specific learning disability does not include learning problems that are
primarily the result of visual, hearing, or motor disabilities; of mental retardation; of
emotional disturbance; or of environmental, cultural, or economic disadvantage.”
However, it is difficult for special education teams to rule out the exclusionary factors of
environmental, cultural, or economic disadvantage, given the similarity in learning
problems associated with cultural factors and learning disability factors (Ochoa, Rivera,
6
& Powell, 1997). This difficulty may be an important factor leading to the over-
qualification of minority/low socio-economic status students for special education
services.
School districts who over qualify students for special education programs face the
risk of financial difficulty stemming from the lack of federal funding, increasing cost of
services, increasing cost of litigation, and the costly bureaucracy involved with all aspects
of special education. They are also at risk of placing labels on students they may not truly
deserve. Qualifying students for special education services, particularly under the label of
“learning disabled,” tends to perpetuate the assumption that there are dysfunctions in the
students, when in reality there may be a dysfunction in the educational system that is not
providing general education programs that meet student needs. Other federal and state
programs may be more appropriate to meet these students’ educational needs, or
reformation of the general education program may need to include accommodating a
larger spectrum of student need. Given these issues, the problem addressed in this study
is the need for research on the eligibility decision-making of special education teams,
particularly in regard to the exclusionary factors of cultural, environmental, and
economic status.
Purpose of the Study
In regard to the research problem, the purpose of this study was to describe and
analyze the processes used by special education teams to qualify students for special
education services in the learning disability category, with a particular focus on whether
and how teams take into consideration the exclusionary factors stipulated in IDEA and
WAC. Specifically, the study addresses the following questions:

7
1. Do special education teams consider individual student environment, culture, and
economic factors when determining special education eligibility under the
category of “learning disability”?
2. Do districts from the same geographic area with differing student populations
(with regard to environment, culture, and economic status) treat these issues
differently?
Methodology
Consistent with the purposes of this study, qualitative methods were used to
investigate the processes engaged in by special education teams when addressing student
eligibility for special education services. Qualitative research allows for understanding of
events within a naturalistic context and from the perspectives of the participants (Bogdan
& Biklin, 1998). The qualitative research techniques incorporated in this study include
participant observation (of eligibility determination meetings), semi-structured interviews
(of special education team participants), and document analysis (of district forms and
team notes). A detailed description of the methodology is presented in Chapter III,
Research Methodology.
Validity and Ethics
Maxwell (1996) describes several threats to validity associated with qualitative
research methods. Incomplete or inaccurate data can severely limit the researcher’s
understanding of the phenomenon under investigation. Another validity threat is bias,
which can influence a researcher to select data that fits a pre-existing theory and
disregard discrepant data. Additionally, reactivity, the influence the researcher has on the
environment and individuals studied, is impossible to eliminate, and the impact of the

8
researcher’s presence can never be truly measured. While these validity threats were
present during this study, steps were taken to address these issues and to eliminate or
alleviate the impact of them as much as possible. The researcher audio-taped interviews
and maintained thorough field notes. Triangulated data collection methods were used to
obtain multiple types of information from multiple sources. Additionally, every effort
was made to disregard any theoretical orientation or framework until the data had been
collected. Given these efforts to ensure validity, it is reasonably certain that the
information obtained was accurate for the sample studied at the time it was collected
(Maxwell, 1996). Such certainty was the intent for this study. Chapter III contains a
thorough description the validity threats and the steps taken to ensure validity.
Significance
This study has multiple areas of significance. Substantively, the study provides
description and analysis of the processes special education teams engage in when
determining eligibility for special education programs under the learning disability
category, specifically in regard to the exclusionary factors for qualification. The results
include how and why students are considered for placement into special education
programs that serve students with learning disabilities, and may explain why placement
decisions vary from school to school and team to team. Individual characteristics and
school district characteristics are examined. Information obtained in this study can
provide school districts with options for practice, particularly in the areas of pre-
assessment information gathering, staff training, and process development. Additional
significance of the study is that it adds to the understanding of special education team

9
processes and decision-making factors. This study adds understanding to the growing
body of learning disabilities research.
Report of the Study
This report is divided into five chapters. The first chapter contains the
introduction to the study, describes its purposes, outlines the research problem, and
provides a brief description of the methodology. The second chapter consists of a review
of literature describing previous research significant in guiding this study. The third
chapter contains a detailed description of the research methodology incorporated in this
investigation. The fourth chapter is an in-depth analysis of the data collected from
observations, interviews, and documentation regarding special education eligibility
processes. The final chapter contains the study’s summary and conclusions, including
recommendations for districts and for further research.

10
CHAPTER II
REVIEW OF LITERATURE
Introduction
Special education programs in public schools provide disabled students with the
modifications, adaptations, and specially designed instruction necessary to assist with
their individualized academic needs. From their inception early in the 20th century,
special education programs were intended to afford access to physically and mentally
handicapped students previously denied the experience of public schooling; however,
special education has changed and developed over the years into a massive program
providing assistance to students with a wide range of disabilities. While some students
served by special education programs have significant disabilities impacting their
mobility, sensory intake, or cognition, many students who are served under the special
education umbrella have issues of much less severity. Many students who previously
would have fallen within the range of “normal” are now being referred for special
education testing and scrutinized for flaws in functioning. Identified flaws are then given
a label and listed as a reason for the necessity of services. Special education laws and
regulations are under constant examination and reauthorization, and current wording in
both federal and state law allows for significant freedom of interpretation. This freedom,
along with other factors, has caused the number of students eligible for services to
skyrocket in the last two decades. A particular issue is the over-qualification of minority
and ESL students, whose educational problems may relate to cultural, economic, and
linguistic differences rather than learning problems.
11
In regard to this problem, this review will consider literature related to special
education’s origins, state and special education team interpretations of IDEA regulations,
special education’s increasing prominence, the learning disability category, funding and
costs associated with special education, bureaucracy and litigation, addressing potential
ethnic biases, the culture of poverty, and exclusionary factors.
Special Education’s Origins
Special education is a federally mandated program based upon the premise of
providing education for all students within the United States’ public schools, regardless
of disability or handicapping condition. Greatly impacted by court cases and legislative
actions, special education has changed over the years into a multi-billion dollar school-
based industry. Though special education has fulfilled the hopes of many early advocates,
it is not without critics. In fact, some have said that it has begun to have a negative impact
upon those that it serves (e.g., Worth, 1999), as well as those that it does not serve (e.g.,
Meredith & Underwood, 1996).
Special education’s roots go back to the turn of the twentieth century, when
compulsory education became the norm. School attendance became expected, and there
was a growing realization among educators that a subset of children would need extra
assistance beyond that of the regular classroom experience (Hallahan & Kauffman,
2000). Those with mild or moderate learning or cognitive disabilities were segregated
into special classes, but many students with more severe handicaps were not allowed
within the public school setting (Audette & Algozzine, 1997). The civil rights movement
of the 1950s and 1960s, which originally began as a crusade for equality among races,
soon became a crusade for equality of other marginalized populations, such as those with
12
disabilities. Since the late 1960s, parents and advocacy groups have pursued legal action
and legislation that has ensured the access of students with disabilities to public education
(Friend & Bursuck, 1999). In 1971, a groundbreaking legal decision gave mentally
retarded children in Pennsylvania the right to free public education (Pennsylvania
Association for Retarded Children v. Commonwealth, 1971/1972). The following year
saw Mills v. Board of Education of the District of Columbia expand the Pennsylvania
ruling to include education for all disabled students. This decision delineated a plan that
included provisions for students to receive free appropriate education, individualized
education plans, and due process protection. 1975 saw the passage of Public Law 94-142,
which became known as the Individuals with Disabilities Education Act (IDEA) in 1990,
and this legislative act, along with its various revisions, has modified special education
into the current form.
Interpretation of IDEA Regulations
It is estimated that before the 1975 legislation was passed, one million students
with disabilities were receiving no education at all (Worth, 1999). The intent of PL 94-
142 was to provide every student who had a handicap or disability access to a free and
appropriate public education (Levine & Wexler, 1981). Each of the 50 states, however,
has been given the freedom to determine how they will specifically implement the
regulations of the federal law (Matz, 1997). This made for variance among regulations
from state to state. Gloria Matz, in her 1997 doctoral dissertation, examined the
congruence among the 50 states and the District of Columbia with regard to the
classification of students with disabilities. She determined that there is little
generalizability from state to state, which leads to a series of practical problems. Students

13
can be eligible for special services in one state and not eligible in another, when in fact all
that had changed is their address. This has significant implications for a mobile
population. Less stringent guidelines for eligibility also have the potential to create a
larger population of students labeled as “disabled” who therefore have the right to certain
privileges that other students may not obtain. What we have currently in place appears to
be a “porous system with little clinical utility” (Matz, 1997, p. 85).
According to the 1997 revision of IDEA (PL 105-17), there are 14 disability
categories under which a student can qualify for special education services. These include
learning disabilities, speech or language impairments, mental retardation, emotional
disturbance, hearing impairments, visual impairments, autism, orthopedic impairments,
traumatic brain injury, multiple disabilities, and other health impairments. The
reauthorization of IDEA gives the special education teams within school districts
significantly more freedom when making these determinations than the previous wording
of the law allowed. Instead of meeting a numeric standard for categorical eligibility, such
as requiring a 100-decibel hearing loss in each ear to be eligible as hearing impaired, the
wording of the new regulations allows for more professional discretion to be used when
making decisions. Impairments must “adversely impact the student’s educational
performance” and necessitate that the student receive “specially designed instruction.”
The decision of what adversely impacts a student’s academic performance, however, or
how a disability or condition adversely impacts a student’s academic performance is
determined by the special education team for the given school. Special education teams
(previously called Multidisciplinary Teams and now generally called Individualized
Education Plan Teams) that determine student eligibility are typically comprised of

14
general education teachers, principals, counselors, special education teachers, school
nurses, school psychologists, and the student’s parents (Friend & Bursuck, 1999).
Frequently, the individual who has referred the student for special education is a member
of the team. These teams are mandated by IDEA to take standardized assessment
procedures into account when determining eligibility. The assessments are frequently
comprised of an intellectual measurement, an academic achievement measurement,
social/emotional measurements, classroom observations, hearing and vision screenings,
and evaluation of medical data (Hallahan & Kauffman, 2000). How the results of the
assessment are interpreted and used, however, is not mandated. Research on eligibility
procedures conducted since the change in the law indicates that the data obtained from
standardized assessment tools may not be used as frequently as staff opinions when
determining eligibility for services.
A study conducted by Gresham, MacMillan, and Bocian (1998), which examined
the use of standardized assessment tools by school study teams (SSTs), concluded that
“SSTs are probably making their classification and placement decisions based upon their
perceptions of what is best for a given child in terms of educational needs and supports,
not based upon whether the child meets some equivocal authoritative standard for a mild
disability” (p. 190). Since qualification for special education services is generally an all
or nothing proposition, there are many students who are being judged by their school
evaluation teams to meet the criteria for assistance, when in fact they do not need such
services (Audette & Algozzine, 1992). While students with difficulties can be served with
the help of many programs, such as Title I and Section 504 of the Vocational
Rehabilitation Act, special education is often the primary option sought. The choice of

15
how assistance is rendered frequently depends on the attitudes and training of districts
and parents rather than on the characteristics of the student (Tucker & Champagne,
1996). According to Audette and Algozzine (1997), “Current policies insist that students
either fit a category or be excluded from assistance. These policies produce a perverse
sort of collaboration, whereby ‘bounty hunting’ specialists ‘find’ ways for students to be
eligible” (p. 381). The legal freedom to make eligibility a matter of professional opinion
rather than a matter of meeting stringent criteria has the potential to increase special
education enrollment even beyond where it is now.
Special Education’s Increasing Prominence
A study conducted by the National Center for Educational Statistics indicated that
5,698,757 students in the United States were on an Individualized Education Plan (IEP),
the guiding document for special education placement, during the 1998-1999 school year.
The number of students made eligible for special education varied greatly from state to
state, however. According to Hoffman (2000), 4.9 percent of students in Michigan
received special education services in 1998-1999, while 18.2 percent received services in
New Mexico. Hoffman’s study illustrates Matz’s (1997) findings that individual states
are interpreting IDEA in different ways, and that the individual state regulations greatly
impact the ease with which teams make students eligible for special education services.
While the percentages vary from state to state, the nation as a whole is seeing a
steady and consistent growth in the number of students receiving special education
services. According to the Twenty-second Annual Report to Congress on the
Implementation of the Individuals with Disabilities Education Act (2000), the number of
students receiving services under IDEA is growing faster than both the resident

16
population and school enrollment. 5,541,166 students were served in 1998-99 under
IDEA, which was a 2.7 percent increase over the previous year. In Washington State
alone, the number of students receiving services rose from 106,530 in 1998-1999 to
116,148 in 1999-2000, a marked increase of 9,618 (State of Washington Joint Legislative
Audit and Review Committee K-12 Special Education Study, 2000; Hoffman, 2000).
This raised the percentage of students receiving special education services in Washington
State from 10.7 percent to 11.7.
The Learning Disability Category
Of the fourteen disability conditions delineated in IDEA, the category of Learning
Disability is by far the most frequently used to qualify students for special services. From
1989 to 1999, the number of students placed in the LD category increased by 36.6%
(Coutinho, Oswald, & Best, 2002). Over 51 percent of students receiving special
education support do so after having qualified as having a learning disability, and the
percentage is growing rapidly (Fuchs & Fuchs, 1998; Worth, 1999). IDEA defines
learning disability as, “a disorder in one or more of the basic psychological processes
involved in understanding or in using language, spoken or written, which may manifest
itself in imperfect ability to listen, think, speak, read, write, spell, or do mathematical
calculations.” However, as mentioned previously, each state has been free to create it’s
own definition, and the methods the states use to qualify students vary greatly (Matz,
1997; Worth, 1999). In fact, more than 80 percent of students in the United States could
qualify as learning disabled under one state definition or another (Ysseldyke,
Vanderwood, & Shriner, 1997).

17
Students may be made eligible for services as “learning disabled” when in fact
they may more accurately fall under another disability condition. In a study of 150
students referred for special education, Lopez, Forness, MacMillan, Bocian, and Gresham
(1996) discovered that one-third of students with Attention-Deficit Hyperactivity
Disorder and one-half of students with Emotional/Behavioral Disturbances were placed
in special education programs as learning disabled. Categories exist for the placement of
students with medical or behavioral disorders, but the students were often identified as
LD anyway. This indicates that overqualification may be an issue not only for students
who may not truly be eligible for services, but for those who require services of a
different sort. LD appears to be a catchall for kids with learning difficulties, regardless of
the cause. The positive side of this overrepresentation, however, is that it does not
necessarily make a difference in the nature of the services the students receive.
MacMillan and Reschly (1998) state:
Since the passage of PL 94-142, regardless of whether a specific child is classified
MR, LD, or SED, the specifics of the treatment or program are negotiated on an
individual basis in the formation of the Individualized Education Program, and the
placement is individually determined consistent with the least restrictive
environment mandate. Given that the specific diagnostic category into which a
given child is placed has no specific programmatic or placement consequences,
the tendency on the part of the schools has been to append the “most optimistic
label” (LD) and to avoid those labels that are perceived as pessimistic in
prognosis (e.g., mental retardation). (p. 23)

18
In most state education codes, student eligibility for certain disability categories--
learning disability and mental retardation among them--is based partly upon the child’s
intelligence as measured by IQ testing (MacMillan & Forness, 1998). Learning
disabilities are typically diagnosed by determining that there is a significant discrepancy
between one’s intellectual level (as determined by IQ tests) and academic performance
(Bocian, Beebe, MacMillan, & Gresham, 1999; MacMillan & Forness, 1998; Fuchs &
Fuchs, 1998). However, there exists significant debate about the validity of intelligence
testing (e.g., Elliott & Fuchs, 1997) and its value when making LD diagnoses. MacMillan
and Forness (1998) compare the use of IQ when determining special education eligibility
to the use of a thermometer when determining if a child is ill:
A thermometer may reveal the presence of an infection when an individual’s
temperature is elevated, but it provides no information on the precise source of the
infection and does not provide information to the treating physician regarding the
appropriate treatment. Additional testing is needed to identify the source of the
infection. Similarly, when a child receives a low IQ, it is predictive of school
failure, but additional testing is needed to identify the source of that problem and
to collect information that will permit designing the remedial effort to prevent the
school failure. (p. 241)
Others question the necessity of any testing at all. In studying 76 elementary school
students who were referred for special education services, Bocian, Beebe, MacMillan,
and Gresham (1999) concluded that teachers are quite accurate in identifying the
variables of a child pertaining to classroom performance that are later validated by testing
measures. They felt that teachers may be “imperfect tests,” but their opinions should be

19
fostered and sought-after, rather than continually challenged. Schools seek flexibility in
making placement decisions, and relying upon testing restricts that. Seeking subjective
information from teachers goes against the current testing-reliant modus operandi of
special education law.
Research indicates that many students who are identified by school study teams as
having a learning disability do not actually meet criteria for eligibility. MacMillan and
Spence (in press) noted that 52 to 70% of students who were identified as having a
learning disability did not meet state criteria. While arguments can be made that making
students eligible for assistance meets the “purposes for classifying problem conditions
like learning disability: advocacy, services, and scientific study” (Bocian, et. al, 1999), it
remains true that school districts are receiving funding that they may not technically be
eligible to receive, according to regulatory guidelines.
Funding and Costs
As mentioned previously, the majority of students who are being qualified for
special education are placed in the category of having a learning disability, and this
number is rising each year (Worth, 1999). This has not always been the case, however.
Washington’s recent funding history provides a clear example of how student eligibility
is a product of the regulations on the books. Until 1995, the State of Washington
provided school districts with different amounts of money for students according to the
disability condition in which they were qualified. For example, students who had health
impairments, developmental delays, and multiple disabilities generated significantly more
money for the school district than did students who had learning disabilities or
communication disorders, presumably due to the direct cost of educating students with

20
more severe disabilities. As may be expected, from the years 1985 to 1994, the
percentage of students qualified as health impaired rose by 22 percent, while those who
qualified as learning disabled rose by a mere 2 percent (State of Washington Joint
Legislative Audit and Review Committee K-12 Special Education Study, 2000). It
appears obvious that the category under which a student was qualified for services, and
the amount of money generated by the category, was taken into account when districts
made eligibility determinations. In 1995, however, the state’s new funding formula
delineated only one category for special education funding, thereby providing school
districts with the same amount of money for each special education student. A student
with a communication disorder generated the same amount of money for the school
district as a wheelchair-bound orthopedically impaired student. This change, along with
the 1997 reauthorization of IDEA, altered the pattern of student qualification away from
the health-related categories toward the learning-related categories.
The 1995 Washington State change in formulaic funding also added a new
wrinkle to districts’ qualification of students. Under the new regulations, a school district
could receive special education funds for up to only 12.7 percent of the student
population (State of Washington Joint Legislative Audit and Review Committee K-12
Special Education Study, 2000). If greater than 12.7 percent of the student population
receives special education services, the district has to fund the program implementation
for these additional students with basic education allocation funds. While there are
possible exceptions to this rule (such as “safety net” funding), school districts in
Washington have learned to be cautious when their special education population
approaches 12.7 percent of the student population (the percentage increased to 13 percent

21
in 2002). This funding model, which many states have adopted, is based upon the total
number of students enrolled in a district, and fails to recognize that not all special
education students cost the same to educate (Chambers, 1999).
Serving special education students is a costly venture. Each student in
Washington who was enrolled in special education for the 1999-2000 school year brought
in $7,878 for the school district from a combination of state and federal funds (State of
Washington Joint Legislative Audit and Review Committee K-12 Special Education
Study, 2000). $3,832 of this amount was from the basic education allocation, while the
other $4,046 came as the excess cost for special education. Since special education
students are considered to be eligible for both general education and special education,
the school districts can claim them for funding from both pots. This money comes from
tax revenues, both at the state and federal level. Estimates of yearly national special
education expenditures range from $35 to $60 billion (Worth, 1999).
The extremely high cost of special education may be producing a rift between
those who feel that the right of the individual to an appropriate education is paramount
and those who feel that the common good of educating all children is the first priority.
Meredith and Westwood (1995) argue that “regular and special education have developed
fundamentally different paradigms or assumptions which govern the way teachers relate
to students, parents, governmental bodies, and each other” (p. 196). While those in
special education focus on the rights of the individual, the general education perspective
emphasizes the rights of the whole group. Special education fosters parental
empowerment, while general education focuses upon the community with regard to
decision-making, with the rights of the “taxpayers” paramount. Special education is

22
mired in legal accountability, with the cost being secondary to student outcomes and
parental litigation seen as a legitimate force in ensuring student rights. This is generally
not the focus with general education, as the accountability tends to be more political than
legal. Finally, special education changes are generally driven at the federal level, while
general education has a state and local locus of control. These differences make it
difficult for regular and special education groups to understand, communicate, and
collaborate with each other, and tend to interfere with effective instructional decision-
making and resource allocation. Financial issues are perhaps the main source of tension.
Meredith and Westwood state, “Current state fiscal legislation is increasingly
encouraging an educational ecosystem in which the regular and special education
communities become direct competitors for an increasingly narrow resource basis. This
will bring the competing paradigms into direct conflict” (p. 207). With money being at
the heart of the tension, it is only natural for general education to take a hard look at the
way money is being spent on special education students and to start pointing fingers. “It
is vital that we have a serious debate about both the amount of money we are willing to
spend on the education of our young and how fairly and wisely to spend it” (Molnar,
1995, p. 59).
The Impacts of Bureaucracy and Litigation
One major issue affecting the cost of special education is bureaucracy. School
districts generally employ many individuals to keep the special education process
running. Along with the teachers who provide special education instruction, medium to
large districts also employ psychologists, speech pathologists, physical and occupational
therapists, hearing specialists, vision specialists, and other evaluators (Hallahan &

23
Kauffman, 2000). Small districts generally receive similar services from a regional
educational agency or through contracts for individual services. Having all of these
people involved as assessment and/or service providers, along with the fact that special
education is driven by legal documentation of yearly goals and objectives, makes it easy
to see how the entire process is laden with paperwork. In fact, Kim Reid, a professor at
Columbia Teachers’ College stated (in Worth, 1999), “Special ed. teachers complain
they’re spending 50 to 60 percent of their time filling out forms” (p. 38). Considering the
amount of time that is spent doing paperwork for the multitude of players involved with
special education students, it is not difficult to assume that a considerable proportion of
the money spent on special education goes toward paying for the paperwork process.
Along with the paperwork comes a series of meetings for each student. According
to Washington law, for example, meetings need to be held at the onset of the special
education referral process, the time when assessment has been completed, and when an
IEP is to be implemented. New IEP meetings are held for each student at least yearly, but
are necessary whenever a change is to be made in the placement or the program of the
child or when a new assessment is deemed necessary. Add to that the meetings necessary
for students undergoing the transition from elementary and secondary school or from
school to work, as well as the meetings for disciplinary actions, and time involved away
from actual instruction becomes even greater. It is easy to understand why there is a
shortage of qualified special education teachers. “The job is so stressful, the average shelf
life of special education teachers is three years,” says Reid (in Worth, 1999, p. 36).
Another major issue impacting the cost of special education is litigation. Special
education was born out of heightened social awareness of the unfair treatment of certain

24
populations of children, and persistent use of the courts forced state and city systems to
improve their offerings (Fruchter, Parrish, & Berne, 1999). Recently, the courts have
addressed special education issues by looking at states’ finance systems. Since 1989, ten
states have had their finance system ruled unconstitutional, and litigation is active in a
majority of states (Verstegen, 1999). “The new wave of school finance litigation has
propelled school finance reform to the top of state policy agendas. It is forcing states to
reexamine all the issues concerning educational equity that they have previously dealt
with” (Verstegen, 1999, p.233). While this re-examination of the systems in place is
occurring at the state level, litigation is also impacting education at the district level.
Litigation is a frequently-used method for settling disagreements between parents and
school systems, and findings against school districts can be very costly. It is not
uncommon for punitive damages to reach into the millions of dollars, and districts are
increasingly finding themselves forced to settle cases for somewhat smaller dollar
amounts in order to prevent financial devastation at the hands of a judge or jury.
“Overburdened, underfunded, and without the expert legal advice parents can draw on,
schools tend to give in rather than face a case that could bankrupt them” (Worth, 1999, p.
37). Losing a case also results in the district paying the family’s legal fees. The fear of
litigation will frequently force districts to give in to the wishes of insistent parents, even
though they may disagree with the decision.
Addressing Potential Ethnic Bias
The court case of Larry P. v. Wilson Riles (1971, 1979, 1984, 1986) addressed an
important issue of special education debate. In this case, the California Supreme Court
ruled that intelligence testing was not allowed as a determining factor when placing
25
students in special education due to the culturally biased nature of the assessment
measures. Specifically, it addressed the bias against African-American students, and
made it illegal in California to use IQ testing for student placement in special education
programs. This landmark fourteenth amendment case has had a significant impact upon
how that state is able to identify students for services. MacMillan and Forness (1998)
point out, however, that “existing education code wording still requires assessing
intelligence if the child is to be eligible for special education services on the basis of
qualifying as mentally retarded or learning disabled” (p. 239). This paradox clearly
illustrates the confusion that exists when determining the methodology to be used when
attempting to serve students for learning problems. A long-standing and oft-quoted court
decision makes one practice illegal, while state regulations make that same practice a
necessity.
While the Larry P. case brought to the forefront the issue of assessment equality
among the races, other research points to cultural bias in other areas related to student
placement decisions. It has been known for decades that significantly more minority
students are served in special education than would be expected based upon their
percentage in the general school population (Zhang & Katsiyannis, 2002; Coutinho,
Oswald, & Best, 2002; Colarusso, Keel, & Dangel, 2001; IDEA Amendments, 1997).
Significant research has been done in this area, and many of the learning disabilities
studies directed at minority and poverty student overrepresentation in special education
address inconsistent referral, assessment, and placement methodology. As previously
mentioned, individual states have the freedom of interpretation of IDEA, and thus can
implement their own eligibility determination standards. Coutinho, Oswald, and Best

26
(2001) suggest that public education in this country may “embody cultural biases that
incorrectly and disproportionately target minority students during the referral,
assessment, and eligibility process” (p. 50). They feel that variations in how the states
are defining and implementing learning disabilities legislation represents a potential
source of bias during the referral and eligibility process. For example, many standardized
assessments, both academic and cognitive, have a heavy language emphasis. This puts
students who have learned, or are learning, English as a second language at a significant
disadvantage. When these test scores are a primary determining factor in student
eligibility, a potential for significant bias against minority students has been created.
The Coutinho et al. (2001) research also supports the position that the “underlying
distribution of educational disability may vary across ethnic groups as a result of social
and demographic influences that represent risk factors for disabilities” (p. 50). Therefore,
individual student characteristics (such as gender, ethnicity, and poverty), when
combined with the sociodemographic characteristics of the community, may influence
the likelihood of a student being identified as LD. For example, they found that increased
poverty is associated with increased LD identification among Black, Hispanic, and male
Asian students. Teacher bias may be an important factor in the referral procedure, with
teachers referring students who learn or behave in a different manner from what is
considered the norm, typically that of the white, middle class population. Bias may also
be apparent when looking at the application of the exclusionary provision of the
definition of learning disabilities. Students whose learning deficits are caused by
environmental issues, such as poverty or poor home environment, are not to be identified
as having a learning disability. Since poverty increases the likelihood of African-
27
American, Hispanic, and male Asian students to be found as having a learning disability,
Coutinho states the exclusionary provision of the definition of LD may not be
appropriately or consistently applied.
There is extensive literature illustrating the differences between racial and socio-
economic minorities and white, middle class Americans with regard to educational
achievement, intelligence, and special education placement. Artiles et al. (1998) reported
that there appears to be a continuum of reasons for student disproportionality with regard
to special education qualification, ranging from discriminatory professional practices to
innate deficits of minority children. It appears to be generally agreed, however, that
standardized IQ assessment tools measure most minority groups as having average IQ
levels significantly below that of white Americans. Their academic achievement is
generally lower, and their special education placement rate is generally higher. The same
can be said for individuals of low socio-economic status--they have lower tested IQ
levels than the norm, they perform more poorly in school, and they are more likely to
receive special education assistance. There is also general agreement that there is
considerable overlap in the membership of the minority and low SES groups. What is not
agreed upon is the cause of these achievement and ability discrepancies when comparing
minorities and the poor to the white, middle class norm. A popular statistics expression
states that, “correlation is not causation.” While it is important to understand the broad
trends in performance when comparing groups, it is more important to realize that groups
are comprised of individuals who may or may not be “typical.” There are obviously very
bright, high achieving people from poor families, and there are obviously unintelligent,
low achieving middle class individuals. Understanding the culture of differing groups,

28
however, may help educators understand the students with whom they are working, and
assist in closing the gap for future students.
The Culture of Poverty
Ruby Payne, in her book A Framework for Understanding Poverty (1998),
delineates the culture of individuals from poverty. As opposed to the type of poverty
which is brought on by a situation, such as the death of a family member or a divorce,
generational poverty, which is defined as poverty that has occurred for at least two
generations, has it’s own culture, hidden rules, and belief systems. This culture, which
varies greatly from the culture of the middle class and from the culture of wealth, is often
in direct opposition from the way in which public education is traditionally delivered. It
is the middle class that has been the predominant influence upon instructional delivery,
and overcoming the educational problems for members of the poverty class requires more
of a cultural shift than an educational one. “One of the reasons it is getting more and
more difficult to conduct schools as we have in the past is that the students who bring the
middle class culture with them are decreasing in numbers, and the students who bring the
poverty culture with them are increasing in numbers. As in any demographic switch, the
prevailing rules and policies eventually give way to the group with the largest numbers”
(Payne, 1998, p. 79).
Payne (1998) defines poverty as “the extent to which an individual does without
resources” (p. 16). While financial resources are the most obvious, there are numerous
other types of resources that impact an individual’s well being. They include emotional
(being able to choose and control emotional responses without engaging in self-
destructive behavior); mental (having mental abilities and acquired skills, such as

29
reading, writing, and math, to get through daily life); physical (being healthy and
mobile); support systems (having friends, family, and backup resources available in times
of need); relationships/role model (having frequent access to adults who are appropriate
and nurturing); and knowledge of hidden rules. Lacking in any of these types of resources
can create hardships, and there is an interrelationship between the categories. For
example, lack of physical resources, such as the inability to get around, can lead to lack
of financial resources. Individuals from poverty generally lack resources from more than
one of these categories.
Hidden rules exist in all of the social classes--wealth, middle class, and poverty.
They also exist among cultures and ethnic groups. “Hidden rules are about the salient,
unspoken understandings that cue the members of the group that this individual does or
does not fit” (Payne, 1998, p. 18). Hidden rules amongst those in poverty include the
following according to Payne: the noise level is high; the most important type of
communication is nonverbal; the ability to entertain is highly valued; what is occurring in
the present is much more important than the past or the future; people are one’s primary
possessions; the family tends to be matriarchal; and there is a high belief in fate and
inability to control one’s destiny. Important to realize is that the hidden rules that exist
within the educational setting are of the middle class. This creates conflict for those who
do not fall into the middle class category, as their level of understanding of the basic rules
puts them at a disadvantage.
An important difference between the middle class norm and the poverty norm is
that regarding language. According to Joos (as cited in Payne, 1994), every language in
the world has five registers:

30
1. Frozen- Language that is always the same (Lord’s Prayer, wedding vows);
ceremonial
2. Formal- The standard sentence syntax and word choice of work and school;
complete sentences and specific word choice
3. Consultative- Formal register when used in conversation; discourse pattern not
quite as direct as formal register.
4. Casual- Language between friends; 400 to 800 word vocabulary; word choice
general and not specific; conversation requires non-verbal assists; sentence syntax often
incomplete.
5. Intimate- Language between lovers or twins.
Joos notes that it is socially acceptable to go down one register during a conversation, but
to go down two registers or more in the same conversation is socially offensive.
Montano-Harmon (as cited in Payne, 1994) found that the majority of impoverished
students do not have access to formal register at home. In fact, they cannot use formal
register at all. Unfortunately for them, most standardized tests (ACT, SAT) are in formal
register, and in order to get a well-paying job, one frequently has to use formal register.
Payne described the difficulty for students who do not have access to formal register:
The use of formal register is further complicated by the fact that these students do
not have the vocabulary or the knowledge of sentence structure and syntax to use
formal register. When student conversations in the casual register are observed,
much of the meaning comes not from the word choices, but from the non-verbal
assists. To be asked to communicate in writing without the nonverbal assists is an

31
overwhelming and formidable task, which most of them try to avoid. It has very
little meaning for them (p. 43).
The ability to use formal register is a hidden rule of the middle class. Without direct
instruction relating to the difference in register, students may not understand that there is
a difference in the types of communication. Payne recommends direct instruction that
incorporates the translation of material from casual register to formal register to increase
the level of awareness.
Given the culture that students from poverty bring with them to school and the
differences between this culture and the middle class school culture, it is easy to
understand why students from poverty have a difficult time with academic achievement.
It is also understandable how they are identified as having learning deficits that require
extra assistance. However, is special education the answer?
Learning Disability Exclusionary Factors
As mentioned previously, the vast majority of students receiving special
education do so as the result of being labeled “learning disabled” (Fuchs & Fuchs, 1998;
Worth, 1999). The state of Washington, in Washington Administrative Code 392-172-
126, states that, “specific learning disability does not include learning problems that are
primarily the result of visual, hearing, or motor disabilities, of mental retardation, of
emotional disturbance, or of environmental, cultural, or economic disadvantage”
(emphasis added). This sentiment is mirrored in the federal law in what is known as the
“exclusionary clause” of IDEA, which also uses the phrasing that a child should not be
considered learning disabled if the “discrepancy between ability and achievement is
primarily the result of environmental, cultural, or economic disadvantage” (U.S. Office of

32
Education, 1997, p. 65083). It appears that the intent of the regulations was to exclude
students who have academic difficulties that stem from environmental, cultural, or
economic disadvantage from special education programming, and to focus upon those
students who have a biological or neurological disorder in one or more of the basic
psychological processes. Bias with regard to the exclusionary portion of the law, as
reported by Coutinho, Oswald, and Best (2002), appears to be a factor in school districts
where minority students or students from poverty attend. Ochoa, Rivera, and Powell
(1997) addressed the issue of the exclusionary factor with bilingual and limited-English-
proficient (LEP) students by examining survey responses of 1,507 school psychologists
from around the country. The survey asked how they specifically complied with the
exclusionary clause, and specific areas the psychologists took into account when
determining special education eligibility were identified. While 36 separate methods were
stated, results indicated that a surprisingly low 25 percent of the responding school
psychologists looked at family and home variables. Only 15 percent took the amount of
time students have lived in the United States into account. Six percent looked at the home
language of the student, and 11 percent examined the student’s language proficiency in
English and their native language. While these statistics are startling, it is difficult to say
whether they are truly indicative of what school psychologists and other members of
special education teams do in actual practice. Clearly there is a need for more in-depth
research that explores the decision-making processes engaged in by special education
teams when considering eligibility decisions.

33
CHAPTER III
RESEARCH METHODOLOGY
This chapter presents the rationale for the use of a qualitative methodology in this
study, a detailed description of procedures for data collection and analysis, and a
description of the research sites.
Rationale
The primary purpose of this investigation was to explore the processes undertaken
when school district personnel qualify students for special education services. Along with
examining the behavioral processes involved in qualification, the thought processes of
participants were considered valuable to the purposes of the study. As stated in Chapter I,
special education eligibility is determined by school-based multi-disciplinary teams that
interpret regulations defined by each individual state. This study focuses not only upon
what happens during these team proceedings, but also attempts to explain the proceedings
from the point of view of the participants. A review of literature related to placement
decision-making regarding the learning disability category uncovered a lack of studies,
particularly qualitative studies, focusing on the actions and thinking of team members.
There were several reasons for selecting a qualitative methodology. First,
qualitative methods facilitate the study of phenomena in naturalistic settings (Maxwell,
1996). The researcher immerses him/herself into the environment being studied, and rich,
in-depth data are collected in context. Since a primary purpose for this study was to
examine how special education teams actually think through and engage in eligibility
decision-making in the natural setting of team meetings, qualitative methods were
appropriate. Second, qualitative methods are useful in understanding participant

34
perspectives, as qualitative interviewing can capture participants’ thoughts and
perspectives in their own words (Weiss, 1994). Interviewing methodology is most
appropriate in situations where it is desirable to gain access to the feelings, opinions, and
past experiences of others. The researcher is deferring to the expertise and knowledge
the respondent holds, and looking to gain insight based upon the respondent’s words.
Since another purpose of this study was to understand the thought processes and feelings
of participants in eligibility determination situations, qualitative methods were deemed to
be appropriate. Third, qualitative research is particularly useful for exploring phenomena
about which little is known. This study will be exploring the decision-making processes
that lead to qualification for special education students. There is limited research on this
topic.
Study Design
The procedures developed for this study were used to explore the decision-
making processes special education teams experience when identifying students for
special education services under the category of “learning disability.” A qualitative
design incorporating three phases was used.
The first phase of data collection involved in-depth interviews with a variety of
individuals involved with school-based special education decision-making for student
eligibility and placement. The purpose of the interviews was to elicit participants’
perspectives on their experiences within the decision-making process. Thirty participants
were interviewed in this phase.
The second phase of this study was designed to obtain data by observing the
decision steps and processes associated with determining special education eligibility.

35
Data were collected through observation of multi-disciplinary team meetings as team
members considered special education eligibility decisions. Five team meetings in each
of three school districts were observed (15 meetings total).
The third phase was designed to obtain data by examining written documentation
that resulted from formal eligibility meetings. Certain documentation is prescribed by law
when special education eligibility is determined, and examining this documentation gives
additional perspective on the processes that have taken place and the decisions that were
made. Justification for decisions was concisely summarized at times in written form. This
data collection occurred concurrent with, or in some cases, shortly after the phase two
observations.
Research Sites
The criteria for selecting the research sites were concerned with the presence of
special education programs for students with learning disabilities and the use of special
education teams to determine eligibility for services. In order to be considered as a
research site, the districts needed to have services for special education provided by
district-employed staff in a building-based model. The schools within the districts had to
have school psychologists on site for, minimally, portions of the school week, as well as
special education teachers who served students with disabilities in “resource room”
settings, which can loosely be defined as special education-devoted locations outside of
the general education classroom, to which students are assigned for less than one-third of
the academic day. It was important for the school districts to operate their own programs
for learning disabled students because districts that do not provide such programs (for
example, districts that transport students to another location for service) may not be
36
involved with the eligibility determination process. It was also important that districts
have staff who are employed in distinctive roles, such as that of a principal, school
psychologist, or teacher. Some school districts employ individuals who fill multiple roles,
such as director of special education/school psychologist or teacher/principal, and this
makes it difficult for a researcher examining an organizational process.
Practical considerations were also used when selecting participant school districts.
Among the identified eligible districts, the research sites were selected because they (a)
are within close geographical proximity to each other and the investigator, and (b) serve
very different student populations with regard to demographic data, to allow for
comparison across the sites.
The Districts
This study was conducted with participants from three public school districts in
Eastern Washington State. The districts are within close geographical proximity to each
other, and serve very different student populations with regard to demographic data (data
obtained from Washington State Department of Public Instruction Education Profiles
website, http://www.reportcard.k12.wa.us/Reports, accessed 1/2004.). Demographic
statistics for the districts are listed in Table 1. In this study, the pseudonyms Aspen,
Birch, and Cedar will be used for the districts. The three districts are described more fully
in the following sections.

37
Table 1
Washington and District Demographic Statistics, 2002-03
District Students Minority %
Free/Reduced Lunch %
Special Education
Bilingual Program
Migrant %
State 1,015,968 27.5 35.6 11.7% 6.5% 3.0 Aspen 14,698 25.6 38.3 11.1% 9.0% 7.1 Birch 9,785 72.4 63.3 11.0% 40.1% 32.7 Cedar 9,800 12.4 20.9 12.6% 2.6% 0.0
Aspen School District Aspen is the largest city in this geographic region of Washington, with a diverse
economic infrastructure. While agriculture and agriculture-related businesses are major
employers, many other types of businesses are in evidence. Next door to a major grocery
store can be a field of horses. Aspen still clings to many Old West ideals. While a
predominately middle-class city, a significant percentage of the population suffers from
severe poverty.
Aspen is home to the largest of the three school districts in this study, serving
over 14,000 students in grades K-12. Aspen School District is quite similar to the
Washington State averages in the percentage of minority students served, free/reduced
lunch rates (a poverty indicator), and percentage of transitional bilingual students. The
percentage of migrant students is over twice that of the state average, but below ten
percent of the student population. The largest ethnic minority group is Hispanic,
comprising 21 percent of the student population. Black and Asian students each comprise
approximately two percent, and American Indian students comprise less than half of one
percent.

38
Aspen has fourteen elementary schools, five middle schools, and three high
schools. Each building has its own principal, and special education staff provide services
at each site. There are twelve school psychologists on staff, as well as 83 special
education teachers. Other special education services provided include speech-language
therapy, occupational and physical therapy, audiology, and special assistance for visually
impaired students. Special education programming ranges from consultative services and
in-class assistance to small group therapy to full-day self-contained programming.
Students with severe behavioral needs or mental health intervention receive these
services outside of the district through contracted support services. As a medium-sized
district, however, they meet the needs of the vast majority of their students in one of their
own staffed and run programs.
According to the Report Card published by the Office of the Superintendent of
Public Instruction, Aspen is generally above the median for students passing the reading
and math portions of the fourth, seventh, and tenth grade 2002-2003 Washington
Assessment of Student Learning (WASL) when compared to the closest districts in the
state for size (see table 2). Among districts with similar special education percentages of
11 to 11.2 (thirteen districts state-wide), Aspen was near the middle of the pack for
students passing the WASL, with scores ranging from fourth out of thirteen to eighth out
of thirteen. Aspen’s Hispanic students performed particularly well when compared to
students from the nine other districts with comparable Hispanic population percentages.
A significant portion of the federal No Child Left Behind (NCLB) Act of 2001
(PL 107-110) is concerned with academic accountability for school districts. One way
that NCLB looks at accountability is through measuring Adequate Yearly Progress

39
(AYP) for individual schools and school districts, based on test scores and formulae for
acceptable levels of progress from year-to-year. Data are disaggregated for nine distinct
groups, including all students, five different ethnic groups, special education students,
students with limited English language skills, and low-income students. For each grade
level tested (four, seven, and ten) there are 37 cells for which a district can either meet
the standard, not meet the standard, have fewer than thirty students scores to incorporate
(thereby making the cell not reportable for privacy reasons), or not applicable (no
students in the group). When the grade levels are combined, the district faces 111 distinct
areas in which it can be assessed in terms of meeting adequate yearly progress.
Of those 111 cells, Aspen had 15 areas in which adequate yearly progress was not
achieved in school year 2002-2003 (see Table 2). One of the six special education
proficiency standards was met, and two of the six Hispanic proficiency standards were
met. No limited English standards were met, and half of the low-income standards were
met. White students met all of their standards, as did the student population as a whole.

40
Table 2
Aspen School District 2002-03 WASL Performance
Population Assesses
Grade
Met StandardReading (%)
Rank
AYP Met
Met Standard Math (%)
Rank
AYP Met
All 4 70.9 4/10 Yes 59.8 4/10 Yes All 7 44.8 6/10 Yes 29.8 8/10 Yes All 10 66.7 5/10 Yes 48.0 3/10 Yes
Sp. Ed. 4 -- 7/13 No -- 8/13 Yes Sp. Ed. 7 -- 6/13 No -- 8/13 No Sp. Ed. 10 -- 4/13 No -- 4/13 No
Hispanic 4 -- 3/10 No -- 1/10 Yes Hispanic 7 -- 3/10 Yes -- 3/10 No Hispanic 10 -- 2/10 No -- 2/10 No
White 4 -- -- Yes -- -- Yes White 7 -- -- Yes -- -- Yes White 10 -- -- Yes -- -- Yes
Ltd. English 4 -- -- No -- -- No Ltd. English 7 -- -- No -- -- No Ltd. English 10 -- -- N<30 -- -- N<30 Low Income 4 -- -- No -- -- Yes Low Income 7 -- -- Yes -- -- No Low Income 10 -- -- N<30 -- -- N/A
• Percentages of students who passed the WASL were calculated for entire student populations only. Breakdown percentages were not available.
• ‘Rank’ equals placement among the most similar Washington school districts for that student population. For example, 5/10 in the ‘All Student’ column equates to fifth out of ten districts of similar size, while 7/10 in the ‘Sp. Ed’ column equates to seventh out of the ten school districts with the same or similar special education student percentage.
• ‘AYP’ equals Adequate Yearly Progress. • Percentages of students meeting standards for math and reading and meeting AYP
standards were based upon proficiency, not participation. All participation standards were met.
• ‘N/A’ means no students who took the WASL were classified as belonging in that subgroup.

41
Birch School District
Birch is located in a heavily agricultural area. The area is a major producer of
potatoes, apples, grapes, onions, melons, and asparagus, which in previous decades had
brought in many seasonal workers who came to work the crops and then left when the
weather turned cold. Recently, however, the transient nature of the population has begun
to decline, with many migrants settling down in the Birch area. Of the districts in this
study, Birch has a significantly larger minority population than either Aspen or Cedar,
with less that one third of the students considered white. The district serves 9,785 total
students, and the vast majority of these students (67 percent) are Hispanic. While some of
the students are third or fourth generation Americans, a good percentage of students are
still very new to the country. As would be expected, Birch’s bilingual and migrant
student percentages are significantly greater than the state averages. The free/reduced
lunch rates are also well above the state average. Wealth is very unevenly distributed in
Birch, with some of the poorest families in the state residing there along with some of the
wealthiest. Birch was well below the state average for the 2001-2002 cohort graduation
rate, with only 55.3 percent of students who started kindergarten in the Birch School
District graduating with their cohort. This is a strikingly low figure.
Birch has ten elementary schools, three middle schools, and one high school.
Each building has its own principal, and special education staff provide services at each
site. There are seven school psychologists on staff, as well as 57 special education
teachers. Other special education services provided include speech-language therapy,
occupational therapy, and physical therapy. Audiology and vision services are provided
by the regional Educational Service District. Special education programming ranges from

42
in-class placements with consultative services to full-day self-contained programming.
Many of the services are provided in the Spanish language to accommodate the heavily
Hispanic population. Similar to Aspen, students with severe behavioral needs or mental
health intervention receive these services outside of the district through contracted
support services. Ninety-nine percent of district special education students receive
services in one of Birch’s programs.
According to the Report Card published by the Washington State Office of the
Superintendent of Public Instruction, Birch is generally well below the median for
students passing the reading and math portions of the fourth, seventh, and tenth grade
2002-2003 Washington Assessment of Student Learning (WASL) when compared to the
closest districts in the state for size (see Table 3). Among districts with a similar number
of students, Birch scored tenth out of ten districts for all three grade levels. Birch’s
special education population standard-achievement was also low compared to districts
with similar special education percentages, with rankings ranging from eleventh place out
of sixteen districts to sixteenth place out of sixteen. Rankings for the Hispanic student
population varied significantly by grade level when compared to students from the nine
other districts with similar Hispanic population percentages. Birch’s Hispanic seventh
grade students scored eighth out of the ten districts measured for both reading and math,
while the tenth grade students were ranked fourth out of ten in both areas.

43
Table 3
Birch School District 2002-03 WASL Performance
Population Assesses
Grade
Met Standard Reading (%)
Rank
AYP Met
Met Standard Math (%)
Rank
AYP Met
All 4 39.5 10/10 No 29.8 10/10 No All 7 23.8 10/10 No 15.0 10/10 No All 10 44.2 10/10 No 23.6 10/10 No
Sp. Ed. 4 -- 16/16 No -- 15/16 No Sp. Ed. 7 -- 16/16 No -- 16/16 No Sp. Ed. 10 -- 14/15 No -- 11/15 No
Hispanic 4 -- 7/10 No -- 4/10 No Hispanic 7 -- 8/10 No -- 8/10 No Hispanic 10 -- 4/10 Yes -- 4/10 No
White 4 -- -- Yes -- -- Yes White 7 -- -- Yes -- -- Yes White 10 -- -- Yes -- -- Yes
Ltd. English 4 -- -- No -- -- No Ltd. English 7 -- -- No -- -- No Ltd. English 10 -- -- No -- -- No Low Income 4 -- -- No -- -- No Low Income 7 -- -- No -- -- No Low Income 10 -- -- No -- -- No
• Percentages of students who passed the WASL were calculated for entire student populations only. Breakdown percentages were not available.
• ‘Rank’ equals placement among the most similar Washington school districts for that student population. For example, 5/10 in the ‘All Student’ column equates to fifth out of ten districts of similar size, while 7/10 in the ‘Sp. Ed’ column equates to seventh out of the ten school districts with the same or similar special education student percentage.
• ‘AYP’ equals Adequate Yearly Progress. • Percentages of students meeting standards for math and reading and meeting AYP
standards were based upon proficiency, not participation. All participation standards were met.

44
In the report of Adequate Yearly Progress developed by the State of Washington
to address results of the federal regulation, Birch did not reach AYP in any of the areas
measuring the proficiency standard for special education, limited English, or low-income
students. Hispanic students met the standard for only one proficiency area (tenth grade
reading). The entire student population failed to meet proficiency standards in both
reading and math in all three grades. White students met proficiency standards in all
areas for all grades. In total, 29 cells did not meet adequate yearly progress.
Cedar School District
Cedar is a predominantly white and middle class district. Less than three percent
of the student population is bilingual, and there are no migrant students enrolled.
Free/reduced lunch percentages are just over twenty percent. The city of Cedar is a highly
business-oriented area with many ties to the sciences. A large percentage of the adult
population holds graduate degrees, and many highly-trained professionals have relocated
to the city for work-related purposes.
Cedar serves 9,800 students in eleven elementary schools, three middle schools,
and two high schools. Special education staff provide services at each site. There are
eight school psychologists on staff, as well as 63 special education teachers. Other special
education services provided include speech-language therapy, occupational therapy,
physical therapy, and audiology. Vision services are provided by the regional Educational
Service District, and students with severe hearing impairments are transported to another
district. The full gamut of in-school special education programming is provided, similar
to Aspen and Birch. Students with severe behavioral needs or in need of mental health
intervention receive these services at a contracted agency located within the city.

45
On the State’s Report Card, Cedar students measured up to similar districts’
students in a very inconsistent manner (see Table 4). Cedar fourth graders ranked quite
poorly (eighth out of the ten) in both reading and math when compared to similarly-sized
districts (Birch being one of them), while the seventh and tenth grader groups each
ranked in the middle of the pack (between third and fifth out of ten) in both reading and
math. Similarly, the special education populations were also in the middle range (third to
sixth) when compared to other districts with similar special education populations.

46
Table 4
Cedar School District 2002-03 WASL Performance
Population Assesses
Grade
Met StandardReading (%)
Rank
AYP Met
Met Standard Math (%)
Rank
AYP Met
All 4 70.0 8/10 Yes 59.3 8/10 Yes All 7 59.3 3/10 Yes 40.9 5/10 Yes All 10 70.3 4/10 Yes 50.7 4/10 Yes
Sp. Ed. 4 -- 4/10 No -- 4/10 Yes Sp. Ed. 7 -- 3/10 Yes -- 6/10 No Sp. Ed. 10 -- 3/10 Yes -- 3/10 No
Hispanic 4 -- 5/15 N<30 -- 4/15 N<30 Hispanic 7 -- 3/15 Yes -- 4/15 Yes Hispanic 10 -- 3/15 Yes -- 5/15 Yes
White 4 -- -- Yes -- -- Yes White 7 -- -- Yes -- -- Yes White 10 -- -- Yes -- -- Yes
Ltd. English 4 -- -- N<30 -- -- N<30 Ltd. English 7 -- -- N<30 -- -- N<30 Ltd. English 10 -- -- N<30 -- -- N<30 Low Income 4 -- -- No -- -- No Low Income 7 -- -- N/A -- -- N/A Low Income 10 -- -- N/A -- -- N/A
• Percentages of students who passed the WASL were calculated for entire student populations only. Breakdown percentages were not available.
• ‘Rank’ equals placement among the most similar Washington school districts for that student population. For example, 5/10 in the ‘All Student’ column equates to fifth out of ten districts of similar size, while 7/10 in the ‘Sp. Ed’ column equates to seventh out of the ten school districts with the same or similar special education student percentage.
• ‘AYP’ equals Adequate Yearly Progress. • Percentages of students meeting standards for math and reading and meeting AYP
standards were based upon proficiency, not participation. All participation standards were met.
• ‘N/A’ means no students who took the WASL were classified as belonging in that subgroup.

47
Cedar performed significantly better than Aspen and Birch on the Report of
Adequate Yearly Progress. Whereas Aspen received 15 failing scores and Birch received
29, only five Cedar cells did not meet adequate yearly progress. However, these areas of
failure were somewhat consistent with the other districts. As was common for these three
districts, half of the special education proficiency cells did not meet the standard. Cedar’s
other area of deficit was for the low-income populations. The only two low-income cells
with enough students to report (fourth grade reading and math) resulted in failures. The
student population as a whole and white students met proficiency standards in all areas
for all grades.
Participants
This study was conducted with participants from the three school districts in
Eastern Washington described above. Each school district serves at least 9,500 students
in graders K-12 and provides special education services to 11 to 13 percent of its student
population. Ten participants were selected from each of the three districts: six school
psychologists, three special education teachers, and one elementary general education
teacher. All of the participants are active members of their respective special education
teams. Twenty-five of the participants were female; all five of the male participants were
school psychologists. Years of experience ranged from two to 19 for the special
education teachers and from one to 25 for the school psychologists. General education
teachers ranged from 13 to 20 years of experience.
School psychologists in these districts are generally assigned the role of team
leader when determining eligibility for student special education services. Special
education Resource Room teachers in these districts generally serve students on a part-

48
time basis in their area(s) of identified eligibility as per the goals and objectives on their
Individualized Education Plans (IEPs). Resource Room teachers are also frequently
involved with the academic assessment portion of special education evaluations, while
school psychologists generally assess areas of cognitive development, social skills, and
adaptive behavior. General education teachers typically provide instruction during the
students’ non-special education portion of the day, although some students’ IEPs
designate that they receive specially designed instruction in the general education setting.
The general education teacher typically modifies material and provides reasonable
classroom accommodations, but does not design or implement specially designed
instruction to individual students based upon their disability-related needs. General
education teachers are valuable members of special education teams, however, as they
provide perspective regarding district-approved curricula, student needs in a general
education setting, and information regarding individual student performance in such
areas. The information each of these three participants (psychologists, special education
teacher, classroom teacher) provides is valuable when looking at eligibility determination
and placement in special education programs.
Selection of individuals to interview was based upon theoretical and practical
criteria. The theoretical criteria are similar to the criteria employed to select the districts
to be studied: Individuals needed to be staff members who filled only one role within the
school (no split-role contracts); they needed to work in a building that served students
with “mild” disabilities in a setting such as a Resource Room; they needed to work with
or serve students with learning disabilities; and they needed to be actively involved with
their school’s decision-making process for eligibility determination as members of IEP

49
teams. General education teachers had to have significant experience with referring
students with suspected learning disabilities for special education services. As these
criteria are more likely to be in place at the elementary level, only general education
teachers from grades one through five participated in this study. Similarly, for school
psychologist participation, since decisions regarding initial eligibility for services are
typically made in the elementary years, the majority of psychologists participating in this
study work in elementary buildings. Secondary school perspectives are important,
however, so one school psychologist from the high school level and at least one from the
middle school level participated from each district. See Appendix A for a summary of
information on the study’s participants.
There were two practical criteria for selecting individuals to participate. These
criteria were that they be easily accessible to the researcher, and that they consent to
participate. Openness and cooperation is essential for this type of data collection.
Contacting the special education directors of the three districts allowed the researcher to
obtain information regarding potentially eligible candidates for the study.
As the population from which to draw participants was limited by the hiring
practices of each district, purposeful sampling of participants was incorporated. The goal
for this type of sampling, as stated by Maxwell (1996), was to “achieve
representativeness or typicality of the setting, individuals, or activities selected” (p. 71).
Random sampling is likely to achieve this only with a large sample size, and, especially
in the case of the school psychologist population, large sample sizes were not available.
Selective, purposeful sampling was therefore practiced, with individuals representing the
job positions and the school level (elementary, middle school, high school) selected to

50
participate according to the theoretical criteria. The individuals selected, however, were
felt to be a typical cross-section of the population involved with special education
placement in this region of the state. Consistency across the districts being studied was
sought. As Maxwell (1996) states, “A small sample that has been systematically selected
for typicality and relative homogeneity provides far more confidence that the conclusions
adequately represent the average members of the population than does a sample of the
same size that incorporates substantial random or accidental variation” (p. 71).
Procedures
Data Collection
Three primary methods of data collection were used in the study: semi-structured,
open-ended interviews; observations of special education team meetings; and collection
of documentation related to the topic.
The semi-structured, open-ended interview format was used in order to obtain
data on the thought processes of the educational professionals who determine special
education eligibility for students in public schools. The perceptions, beliefs, and
preferences of these educational professionals were sought and comprised a large portion
of the data. Open-ended, one-on-one interviews were conducted with 30 participants to
ascertain their perceptions about special education eligibility determination and their
understandings of the processes that occur during the meetings where eligibility
determination takes place. The researcher loosely followed an interview guide (see
Appendix B), but the interviews were steered by the respondents’ comments. Interviews
ranged from 35 minutes to 68 minutes. All interviews were audio recorded and
transcribed verbatim.

51
The researcher also observed five special education team meetings in each district
over the course of 12 weeks. The meetings observed were ones where student eligibility
decisions were being made. They lasted between 15 and 40 minutes. Notes were carefully
taken on the proceedings, particularly the processes taking place, the participant
involvement, and the outcomes. The decision-making process was carefully recorded.
Data were comprised of observational notes, notes regarding decisions that were made,
participant comments, and pre- and post-meeting activity. Student names or other
identifying information were not recorded in field notes.
Official and unofficial documentation from the field was collected as a source of
data. These documents consist of official meeting notes, district internal communications,
and communications sent to parents from the school districts. Any identifying student
information was carefully eliminated from all documentation.
Great care was taken to ensure that no harm would come to the participants of this
study. All participants were asked to sign a consent form prior to any information being
collected, and they were informed of their right to decline participation at any point. All
interview responses have been kept strictly confidential, and the respondents’ identities
are known only to the researcher. Respondents’ names were not stated during the
interviews so as not to be included in recordings. During data analysis (described below),
each respondent was identified only as a coded number, and the code was only known to
the researcher. Upon completion of the data analysis, the interview transcripts and
recordings were destroyed.
During the participant observation portion of the study, the job titles of the
individuals observed were stated in lieu of names (for example, school psychologist,

52
resource room teacher, principal, etc.). No names of staff, facilities, or students were
recorded. Identifying information indicating the district and school was recorded as data
only in coded form. As students are not being studied, there has been no data generated
by them. Any documentation collected had all names carefully removed and job titles,
generic locations, or the word “student” inserted. Upon completion of the data analysis,
the documents were destroyed.
Data Analysis
The interview transcripts, participant-observation notes, and documentation
obtained in the field were coded into data units composed of meaningful statements,
descriptions, or concepts. These data were then arranged into primary categories. All
categories were then analyzed and grouped into clusters. The clusters were determined to
be important themes to be discussed in the analysis, and include such topics as social
dynamics of the decision-making process, considering exclusionary factors for LD
eligibility, formalized means of addressing exclusionary criteria, and the ethics of
eligibility decisions. This type of data analysis is consistent with Maxwell’s (1996)
contextualizing analysis, in which the researcher looks for relationships that connect
statements and events within a context into a coherent whole. The issues and themes
identified in the study may not reflect those of all special education team members, but
they are common to the respondents within this study. This type of analysis is inductive,
with the themes generated directly from the data and not in alignment with a preexisting
theoretical framework.
Chapter IV presents the analysis organized according to the themes generated
through the inductive data analysis process.

53
Validity
Maintaining validity is a major concern when conducting qualitative studies.
Validity in qualitative research is defined as “the extent conclusions effectively represent
empirical reality and assessing whether constructs devised by researchers represent or
measure the categories of human experience that occur” (LeCompte and Goetz, 1982, p.
32). Ensuring the researcher reports “an authentic representation of some reality”
(LeCompte and Goetz, p. 32) is highly important, although it is neither prudent nor
realistic to presume that that findings developed from studying a small sample of
individuals in limited settings can be generalized to other similar or dissimilar
populations or settings. The intent of this study was to develop understandings of the
thoughts and actions of this chosen sample in these chosen locations as accurately as
possible.
There are several threats to validity associated with qualitative research methods
(Maxwell, 1996). Incomplete or inaccurate data can severely limit the researcher’s
understanding of the phenomenon under investigation. This issue was addressed in this
study through audio-taping the interviews to ensure accuracy and through detailed field
notes and observations. Careful focus on the data being collected was maintained, with
continual evaluation of the data conducted for accuracy and completeness. In addition,
triangulated data collection methods were used to obtain multiple types of information
from multiple sources. Another threat is bias, which can influence a researcher to select
data that fits a pre-existing theory and disregard discrepant data. To address these issues,
every effort was made to disregard any theoretical orientation or framework until the data

54
had been collected and to “bracket” or set aside the researcher’s own biases about special
education eligibility decisions.
Reactivity, the influence the researcher has on the environment and individuals
studied, is impossible to eliminate. How the researcher’s presence may have impacted the
behavior of special education team members is not known, but there is a reasonable
certainty that reactivity did not affect the team’s eligibility decisions.
Given these efforts to ensure validity, it is reasonably certain that the information
obtained was accurate for the sample studied at the time it was collected (Maxwell,
1996). Such certainty was the intent for this study.
This study was limited in scope. The sample size was relatively small and the
study was conducted in a specific geographic area in the state of Washington. Examining
school districts from within such a small geographic area may have led to similarities in
the characteristics of staff members and their behaviors in team meetings. For example, it
is likely that many of the special education team members from the different districts
have attended the same university training programs. This may have led to a
commonality of behavior due in part to training.

55
CHAPTER IV
ANALYSIS: DETERMINING ELIGIBILITY FOR SPECIAL EDUCATION
SERVICES UNDER THE LEARNING DISABILITIES CATEGORY
Introduction
Assisting students with success in school appears to be the primary goal for the
special education team members interviewed and observed in this study. Understanding
the needs of the individual student is the key to assigning the resources at the disposal of
a special education team, and careful examination of the student’s functioning tends to
bring the scope of the needs into clearer view. Special education teams wield significant
power within public education, and they are often looked upon to “fix” or “solve” student
problem or issues with the resources they have at their disposal. Identifying when a
student has a disability as opposed to an academic or scholastic deficit, however, is as
paramount a task according to state regulations as the assignment of support or resources
to assist in a child’s education. This separation in duties is one that becomes blurry at
times when dealing with students with real problems and real needs, but perhaps not real
disabilities.
As previously stated, the major goal of this chapter was to explore how special
education teams consider the “exclusionary factors” of environmental, cultural, or
economic disadvantage in making eligibility decisions. Seven major themes emerged
from the analysis of the data and were given these titles: role of team members, role of
special education, social dynamics of the decision-making process, considering
exclusionary factors for LD eligibility, formalized means of addressing exclusionary
criteria, the ethics of eligibility decisions, and district demographic composition. These

56
themes are presented and discussed in the following sections. Each theme relates to
factors that impact the processes and procedures used by special education teams when
considering students for special education eligibility and placement.
Role of Team Members
Special education decision-making is a team-based process. As the Washington
Administrative Code 392-172-108 states, “the evaluation of a student with a suspected
disability will be conducted by a group of qualified professionals selected by the district
or other public agency and knowledgeable about the student and the suspected areas of
disabilities.” The multi-disciplinary aspect of special education teams serves a number of
different functions. First, having members with varied specialties present on a team
studying a child allows for the greatest breadth of information to be collected and
disseminated. Second, varied specialties and backgrounds allow for varied perspectives
with regard to student functioning. Third, a multi-disciplinary approach allows for a
delineation of task assignment with regard to student assessment and, if the student is
deemed eligible for support, appropriate service. Each team member has his/her own
expertise, and, based upon that expertise, they bring to the table information regarding
typical and atypical student functioning, individual student performance, and remedial
opportunity.
While the composition of each team is based ultimately upon the individual child
being studied, the law requires that teams assessing for the possibility of a learning
disability include a general education teacher, who has knowledge of grade-level
curriculum and the student’s functioning in the mainstream; a special education teacher,
who is expert in remediation of disability areas and assessing academic functioning; and

57
a school psychologist, who is expert in assessing cognitive and social functioning and
diagnosing areas of deficit. These three professional roles were the focus of this analysis.
On paper, each of these team members has equal say in decisions. With regard to the
eligibility-determination process in these districts, however, there appear to be
differences in the amount of influence across team members.
Team member roles with regard to leadership, expert authority, defining meeting
success, decision-making, and examining exclusionary factors will be discussed in the
following sections.
Leadership Roles In each of the three districts studied, the school psychologist assumed the role of
team facilitator. The psychologist’s responsibilities included scheduling the meetings,
inviting the necessary participants, and collecting necessary information. They also
tended to be the ones guiding the meeting discussions, both in terms of the assessment
and the results. Psychologists in these districts are highly influential in determining what
an assessment should look like, and later in determining what the data indicate. As one
psychologist described it,
I’m primarily a team leader. I communicate with people that are involved with the
evaluation, determine when and if they have their pieces completed, set up
meetings, invite parents and staff. I just take the leadership role for the evaluation,
the team meetings, eligibility issues, and so forth.
Terms used by participants to describe the psychologist role included “team leader,”
“case manager,” “assessment manager,” and “team facilitator.” Both the psychologists
and the teachers used these terms. The role of psychologist as team leader was not

58
challenged throughout he course of this study, although it varied somewhat from person
to person and team to team.
Laws, Regulations, and Procedures: Expert Authority
Few areas within public education are as directly tied in with state and federal
regulation as special education. Legal guidelines regulate how students are to be assessed
for services, who is eligible for services, and what services can be provided. The law is
often complex, and with frequent changes in federal and Washington State guidelines,
keeping abreast of specific legal details can be very challenging. Being knowledgeable of
the law, or knowing how to have legal questions answered, was generally important to
the participants of this study.
Team members exhibited a large degree of variance with regard to their individual
knowledge of special education law. While all had a solid understanding of the areas
directly relating to their every-day positions within schools, the special education laws
that are not used on a regular basis were not as thoroughly known. The special education
teachers tend to defer their knowledge to that of the school psychologist or the district’s
program leader, the special education director. Teachers felt they do not need to have the
level of knowledge a school psychologist does, considering the difference in their
positions. One teacher stated, “I don’t know everything a psych would need to know, but
I know everything I need to know to do my job.” Another claimed,
If I don’t have an answer, I call my school psychologist or my boss and say, “I’m
not sure where we should go with this, tell me.” People out there are supposed to
be up on it more than I am. I’m on the front line, so I have to have people give me

59
that information… If I don’t know, I always ask. I don’t make assumptions
because it doesn’t work.
Where special education teachers’ expertise and comfort does appear to lie is with IEP
development, academic testing, and individual remediation. Within these areas, special
education teachers were much more willing to play a role in guiding others.
General education teachers admittedly were even less up-to-date on the legal
requirements for assessing, qualifying, and serving students with disabilities. They tended
to use a self-perceived special education hierarchy to get their questions answered. One
fifth-grade teacher stated,
I don’t know the ins and outs of special education very well, really. At least,
maybe not as well as I could. Most of the time it doesn’t matter to me, so I don’t
worry about it unless I have to. Then I go to the [special education] resource
teacher and ask her what I need to do, or if I see the psychologist I’ll ask him.
Usually I ask the resource people because they’re always here. If I’m not satisfied
with the answer, though, I’ll call the district office. I’ve done that before.
While admittedly not as knowledgeable as others with whom they may be serving on a
team, the general education teachers took this as a fact of life that was not particularly
troublesome. A third grade teacher illustrated this by saying, “I don’t know as much
about special ed. as they do, and I don’t really have a problem with that. That’s their job.
I know more about teaching third graders than they do.”
Who Makes The Decisions? The WAC regulations relating to eligibility determination intend for schools to
use team-based decision-making when assessing and qualifying students for special

60
education. Practices observed in team meetings and the interview data indicate, however,
that true team-based decisions do not always occur in these districts. It appears, in fact,
that the general education staff often present the students to the attention of the special
education team and relinquish control. Special educators, and frequently the school
psychologist alone, tend to determine unilaterally whether or not the student is assessed.
Following assessment, the same process is followed to determine eligibility for services.
It is unknown how special educators, particularly school psychologists, obtained this
responsibility, but it was a common theme across the teams in this study.
It is often not the intention of the school psychologist to move from a process
facilitation role to a “gatekeeper” role. In many cases, this role is not one they want. One
psychologist stated,
I think the perception of the school psychologist position, and maybe it’s a
historical perspective or perception, is that this person is the one who has the keys
to get in so we have to go with what he or she is saying.
Another psychologist stated, “I think they do see me as the sole decision-maker. I don’t
want that responsibility, to be honest with you.”
How did the psychologist acquire such power? Was it an expected component of
her/his position, or was it individually “earned” based upon the characteristics of the
individual? According to the participants, the answer is some of both.
Some people would say it’s based upon my position. Some people, because
they’ve worked with me for a long period of time and they know, ‘Okay, she
usually has good ideas or she’s always kind of followed through,’ or that sort of
thing. But I think it’s kind of a mix.

61
I would say it’s based a lot on my position, but I also have a stronger personality
and again am the one they look to for the law end of things. The teachers tend to
focus on the emotional end of things because they see the kids struggle every day.
They of course want kids to get more help, so I tend to be the gatekeeper and try
to detach myself from the emotional level to make sure we’re following the law as
well.
The psychologists appear to have this primary decision-making power because of
many factors. Knowledge of the law plays an important role. A school psychologist, by
the nature of the position, puts special education regulations into practice on a regular
basis. Teams look to the psychologist to interpret the assessment results in terms of the
regulations, and this process can build into one person determining for an entire team the
final decision. In this type of situation, disagreement could only be with the law itself, not
with the interpreter of it, as there is seldom enough knowledge to provide a counter
interpretation. An argument based upon the law becomes highly persuasive, and team
members were less likely to challenge a decision if they felt it had a strong legal basis.
Expressing disdain with the law and outcome is common, but expressing disagreement is
not.
Some psychologists temper their participation in order to facilitate a team-based
process and avoid the “gatekeeper” role. One stated,
I truly believe team decisions are better, so I try to be very careful and try to be as
neutral as I can by merely presenting data. There are times when that’s not
possible, but I try to make that the norm rather than the exception.

62
Teachers were mixed in their response to this approach. One indicated that she liked to
have the psychologist be the expert, acknowledging that her intention is to have the
student receive services if at all possible, and someone needs to clearly state whether it is
possible or not. Others liked the democratic approach, saying it led to greater team unity
and fewer hard feelings. Personality, it seems, plays a significant role in style
preferences.
A shared perception among special education staff members in the three districts
is that regular education teachers and parents care far less about the eligibility criteria
than getting the student special education services. This appeared to be a bone of
contention for some psychologists, and a source of frustration for others. One
psychologist stated, “A lot of times teacher are like, ‘Please put them in!’ I’m not the
lawmaker here. I can’t just erase the law and make it go away all of a sudden.” Pressure
to manipulate the regulations or the placement requirements is often present, although
generally very subtle and presented in a manner where the best interest of the student is
the central concern. The more experience the psychologist had, the less he/she seemed to
feel the pressure. New psychologists facing veteran teachers were faced with significant
challenges, but generally ones they were able to overcome without compromising their
principles. At times distancing oneself from the rest of the team and making the
necessary call was required, a challenge that takes a strong personality. One psychologist
stated, “I’m pretty tough, it really has to be a matter of qualification. I don’t think at this
point you do kids any favors by saying ‘oh well, he’s a nice kid and we’re going to put
him in anyway.’”

63
Team Member Roles and Exclusionary Factors Individuals in different IEP team roles looked at the exclusionary factors
differently. Generally speaking, classroom teachers did not take the factors of
environment, culture, and economic status into account when making referrals on behalf
of students to special education teams. That these areas are specifically written into the
WAC regulations was not commonly known by teachers, but the fact did not come as a
surprise. Classroom teachers, however, did not feel that it was their responsibility to
screen out these factors in order to reduce the number of referrals to special education.
One stated,
My job is to teach kids as well as I can, and when one of them is struggling, I do
what I can to help them out. I’m not going to say that because Johnny comes from
a poor home with parents who can’t read or whatever that he cannot be referred to
special ed. That’s not my job. My job is to get him help, and I’m going to start
with special ed. If they say no, that’s fine, but I’m going to ask anyway.
Special education staff, on the other hand, felt intrinsic pressure to address these
issues. They showed a general knowledge level of the exclusionary factors, and they
expressed the need for them to be addressed prior to entrance into special education. How
they addressed the factors of culture, environment, and economic status, however, varied
and were somewhat vague and incomplete at times. Specific methods will be included in
upcoming sections.

64
Role of Special Education
Participants stated that the role of the special education programs within their
schools is to provide academic remediation and support to those students who need it.
While the services provided and the delivery models varied, it is generally accepted that
the programs were in place to help get kids back to the level of expectancy, often stated
as “grade level.” Direct instruction or assistance to general education staff with student
needs were the primary tools mentioned to help kids achieve academic success at the
level of their peers. Students receiving such assistance were described as being
academically behind their peers by quite a significant margin, but only three participants
in the study mentioned that eligibility was based upon the students’ possession of a
disability. While this does not mean that the team members systematically disregard the
legal requirement of a “disability” to qualify for services, it is interesting to note that
presence of a disability is listed well after academic deficit as a reason for services to be
provided for a student, if it is mentioned at all. One psychologist stated it in this manner:
They aren’t coming to me with, “I think this student may have a learning
disability.” They come to me saying, “This kid’s skills are really low and he’s
struggling in the classroom and we need to evaluate him.” I guess they look more
at me or special education as telling them whether they have a learning disability
or not. They can tell me how they’re doing in the classroom.
Not mentioning that special education programs are present to serve students with
disabilities is in sharp contrast to the federal Individuals with Disabilities Education Act
and the Washington Administrative Code, the two primary legal guides for special
educators.

65
The Hierarchy of Intervention
At some schools, special education is seen as a resource to be used when other
interventions are not successful. Seen as a last resort, referrals to special education are
completed when other avenues have been tried but are not working. Often impacting the
referral rate is the presence or absence of remedial programs in the building other than
special education. Buildings with Title I1, Learning Assistance Program (LAP)2 services,
Reading Recovery3, English as a Second Language (ESL)4 programs, or Sheltered
English Techniques (SET)5 classrooms provided viable options to students before or
instead of referral to special education. Success in one of these programs likely
eliminated a student from consideration for a special education slot, whereas a student
who continued to have difficulty after receiving service in one or more of these programs
would be more likely to be considered for special education services.
1 The purpose of Title I of the Elementary and Secondary Education Act of 1965 is to ensure that all children have a fair, equal, and significant opportunity to obtain a high-quality education and reach, at a minimum, proficiency on challenging State academic achievement standards and state academic assessments. This purpose can be accomplished by, among other things, meeting the educational needs of low-achieving children in our Nation's highest-poverty schools, limited English proficient children, migratory children, children with disabilities, Indian children, neglected or delinquent children, and young children in need of reading assistance through federal funding for remedial services. 2 The Learning Assistance Program (LAP) was created in 1987 to provide extra assistance for low-achieving students. LAP is a Washington State program that provides funding to school district based on standardized test scores and above-average student eligibility for federal Free and Reduced Lunch. 3 Reading Recovery is an early intervention program to help low-achieving 6-year-olds learn to read. 4 English as a Second Language (ESL) programs teach students with non-English speaking backgrounds to read, write, and speak in English. 5 Sheltered English is an instructional approach used to make academic instruction in English understandable to limited English proficient students.

66
Many schools mentioned by the participants use student assistance teams to
determine whether a student is appropriate for a special education referral, and these
teams try to have students go through the continuum of interventions prior to a referral to
a significantly more restrictive program such as special education. Special education staff
stated the following about their student assistance teams:
I have pretty good student assistance teams that go through the gamut of “is this a
proper referral, what kinds of interventions have we gone through in terms of
general education, are they succeeding, are they making any growth, what outside
avenues have they explored, have they been beneficial?” If they haven’t or the
child’s not making growth, then we will do special education interventions.
Usually by the time, very honestly, that I see a student here, there have been at
least four other adults beside the classroom teacher who have worked with that
student, and we have a 100 percent qualification rate in the building. Not by
professional judgment-- strictly by the book.
In fact, some special education teams reject referrals where students have not gone
through appropriate prior interventions. Being placed on an IEP is seen as a last resort for
these teams, a restrictive option to be considered only when other options are not
appropriate.
Other schools, however, tend to be freer in their use of special education as a
resource. It is called upon more frequently to look at students, often when a student is
first identified as having difficulties. One participant expressed frustration with this:
We often end up assessing kids who haven’t had enough intervention first. The
teachers come to us when they see the kid struggling or a parent complains about

67
the kid’s grades on the report card. Instead of trying things on their own to make
the kid successful, they want us to fix the problem. Sometimes we tell them to try
some other stuff and come back if it doesn’t work, but sometimes we just test the
kid.
A special education teacher expressed this frustration: “I’ve asked if they have tried this
or that, and the response almost unanimously is ‘I don’t have time for that.’” The schools
expressing these issues tended to be ones without student assistance teams in place or
ones where the team was described as “weak.”
Selecting Appropriate Referrals
When special education services are a viable option for a child seems to depend
on the system and personalities in place at each individual school. Individual team
members have a significant impact upon the approach the team takes to looking at student
deficits, especially when those individuals hold positions of influence, such as that of
school psychologist. One teacher reported:
We used to test everyone, but now we are much more selective on who we look
at for the resource room and who we send back to the teacher with other ideas.
Since [a school psychologist] came on board, we are much more careful in how
we look at kids who are referred.
Building administration also had a significant influence on the referral rate and the
appropriateness of the referrals making it to the special education teams. In two of the
three districts, principals controlled the composition and focus of the student assistance
teams. These teams varied in membership from school to school, with some having a
special education representative and some not. The third district had a standardized

68
student assistance team concept that was consistent across schools, and each team had a
representative from special education present to share opinions on the appropriateness of
referrals. Generally speaking, across the districts, the schools with student assistance
teams saw more appropriate referrals going to special education than those without, and
those teams where the principal assigned special education representation were especially
effective at weeding out referrals that were not appropriate. It is the ultimate
responsibility of the principals to ensure that the referral is appropriate before being
submitted, so her or his perspective on the role of special education impacts the
thoroughness of prior intervention and the number of referrals that make it through.
For special education staff, other building-based remedial programs, student
assistance teams, and conservative principals all save a lot of time spent on conducting
potentially inappropriate evaluations. Time spent assessing students who do not qualify is
time taken away from instruction, intervention, or thoroughness of other assessments. A
special education teacher expressed frustration with the current system:
I really wish there was formal training done in the schools to teach people about
appropriate referrals because then I don’t think we’d be dealing with as much…. I
constantly feel like I’m trying to educate people about appropriate referrals, and
it’s just not getting through. People have different views and different opinions of
what special ed. is for, and I think if they really sat down and looked at the law
they might be able to understand it better.
What Makes An Eligibility Determination Meeting “Successful”?
Team members tended to have differing opinions regarding what made an
eligibility determination meeting successful. The differences were based upon role within

69
the team and individual beliefs regarding the best ways in which to assist students. The
role that one held within a team often guided how he/she measured success during team-
related decision-making processes.
There were three primary criteria people had regarding what made an eligibility
meeting successful. The first was ensuring that the student got the assistance he or she
needed to be successful. Regardless of position or team role, the professionals in this
study were highly concerned with meeting the needs of the students. If it was not possible
to support the student with special education services, other interventions and assistance
were brainstormed and developed. During the observed meetings where students did not
qualify for services, many other options were provided to the teachers and parents to help
address deficit areas. Among the options suggested were 504 plans6, Title I services,
placement within a paraeducator reading program, peer tutoring, and before and after
school assistance. Psychologists and special education teachers often made suggestions
for these services based on testing data, student learning style, strengths and weaknesses,
and processing modalities. It was clear that the meetings were student-centered, and
assisting struggling students was the overall goal.
The second criteria for successful qualifying meetings, according to the
statements and actions of many study participants, was satisfaction of the other members
of the team, including parents. Satisfaction does not necessarily mean that everyone
leaves the meeting happy, but rather that everyone feels satisfied by the process and that
6 Section 504 of the Rehabilitation Act of 1973 requires provision of educational and related aids and services that are designed to meet the individual educational needs of any child who (1) has a physical or mental impairment that substantially limits one or more major life activities, (2) has a record of such an impairment, or (3) is regarded as having such an impairment.

70
it has been done correctly with benefit for the student as a result. This is accomplished by
ensuring that team members have a thorough understanding of the results. Also important
is that some sort of change has been made for the student. For general education teachers,
changing something in the student’s instruction seemed highly important, whether it be a
new program or a new approach. Concluding an extensive process and returning to the
same old unsuccessful program would be very frustrating to the teachers and parents.
Therefore, even though staff may not have liked the eligibility decisions made, other
alternatives were always suggested.
The third criteria for a successful meeting was the maintaining of appropriate
legal procedure, as defined by WAC. This was expressed primarily by school
psychologists, and was less of a concern, at least outwardly, for the teaching staff.
Therefore, maintaining WAC standards became the duty of the psychologists, who took
on the responsibility to their level of comfort and ability. Some of the psychologists
stated that adhering to WAC standards was the most important goal, while others were
more focused on the needs of the student. All psychologists who participated in this
study, however, held both legal guidelines and providing assistance to students as
priorities. Which held greater importance, however, varied from person to person.
Social Dynamics of the Decision-Making Process
People participate in special education meetings, bringing their own beliefs,
thoughts, and ideas to the process. These individual differences ensure that no two
meetings are exactly alike and that no two teams partake in the eligibility determination
process in exactly the same way. This section will address the observed similarities and

71
differences in the decision-making process in terms of the social dynamics among team
members.
Participants In most cases, special education teams convene twice during the process of
determining eligibility for a student. The first is when the referral is submitted and the
team determines its appropriateness, what assessments (if any) are to be done, and who
will be conducting those assessments. The second meeting occurs within 35 school days
of the first, at a time when the team shares information obtained during the assessment
process and determines whether or not the student meets the WAC eligibility criteria for
special education services. As these two meetings are required to reflect multidisciplinary
participation, the teams can become quite large, depending on the needs of the student.
As mentioned previously, team membership is fluid, but certain representatives are
required to be in attendance: a school psychologist, a special education teacher, and the
general education teacher(s). If the referring party is someone other than a general
education teacher, that individual must also be in attendance.
Of the qualifying meetings observed in this study, the number of participants
ranged from four (not including the researcher) to nine. Speech-language pathologists
attended four of the meetings, and an occupational therapist attended one. Principals were
involved with five of the meetings, and assistant principals participated twice. Of the
fifteen meetings observed, ten had parents present.
Commonalities Some commonalities were present across the team meetings observed in the three
school districts. First, the meetings typically began with the psychologist explaining the

72
reason for the meeting and what was going to take place. Introductions were made,
primarily if a parent was in attendance. The educational staff generally knew each other,
with possible exceptions being speech-language pathologists or occupational therapists
who serve schools on an itinerant basis. The psychologist then led the meeting in the
direction it needed to go.
Another commonality was that the psychologist invariably maintained the
documentation of the meeting. Some psychologists came to the meeting with the
Evaluation Report completed, indicating presence or absence of a disability according to
WAC 392-172-108 and recommending special education and related services. Others had
the form partially completed, while still others filled out the entire report at the meeting.
There was never a discussion about the paperwork completion at any of the meetings. It
was assumed to be done properly by the psychologist. Many participants signed the
paperwork without examining what was written.
A third commonality occurred once the information had been presented by the
team members who contributed to the evaluation. After all of the data were presented,
there seemed to be a physical and mental turning to the school psychologist for the
interpretation. Meetings where the eligibility determination was not obvious to the
participants held an air of expectancy similar to that of a courtroom awaiting a judge’s
verdict. Whether made obvious by the data or too close to call, the psychologist presented
the conclusion to the team and made sure it was documented appropriately on the district
paperwork. Varying forms of team participation occurred prior to that conclusion, and
even if the team worked very thoroughly together to examine the qualifying criteria, it

73
was the school psychologist who gave the ultimate stamp of approval for the eligibility
decision.
Conflict
Although, as mentioned previously, team member satisfaction is an important
goal of IEP meetings, some meetings can result in conflict or stress when people have
differing opinions on the right course of action or the interpretation of the law. Three
main types of conflict were discussed and/or observed during this study: conflict based
upon positional influence, conflict based upon sympathy, and conflict based upon anger
at the decision.
Within any organization, there is a hierarchy of power. In a school setting, the
principal is at the top of the hierarchy. When a principal or an assistant principal attends a
qualifying meeting, a dynamic is present that does not exist otherwise. As building
leader, the principal hears a multitude of concerns about problem areas in the school.
When the problem is one of student deficit, the principal is likely to hear from parents as
well as teachers. When a principal attends a qualifying meeting to determine whether or
not a student is eligible for special education, particularly after having heard a lot about
the case from frustrated parents and teachers, that principal’s presence can become
influential toward the side of making the student eligible for services. One psychologist
explained it this way:
We tend to have the principal come to meetings when it’s a high-profile kid, a kid
who has parents who call all the time or teachers who complain a lot. His
presence shows that he is looking for answers. That puts more pressure on us to
try to get the kid in [special education].

74
A special education teacher stated how it occurs at her school.
[The principal] will come to a meeting and try to manipulate the system. She
thinks because she is there that she can influence the decisions. She always makes
sure to mention how few resources the school has, and that we’d be better off if
we had more kids in sped so the district would give us more para support. I’m
really glad [the school psychologist] doesn’t give in to that. I know it’s hard for
the teachers, and I know they complain to her a lot, but sped isn’t a dumping
ground, no matter if you’re a principal or a superintendent. I’d be here 15 hours a
day if all of the kids she wanted in got qualified.
While this phenomenon appears to be rare and based upon this particular principal’s
desire to support children with the most ample resources available, teams have been
challenged to stand firm with their decisions. This, undoubtedly, causes discomfort.
Conflict can also arise in the face of parent or teacher disappointment. Special
education staff expressed feelings of guilt and sorrow over not qualifying students who
obviously need help. While understanding that special education is not the answer for
every student, there appears to be a certain level of emotional dissatisfaction when they
are not able to bring needy students into program. The following comments by special
education staff expressed these feelings:
You sit down and try to describe to a teacher how it works, and when you’re done
with your little spiel you’re going to hear, “Yeah, but they’re not doing that in the
classroom.” And when you’ve got an experienced teacher or you’ve gone back to
the previous teacher and you’re hearing the same thing, you have to put some
credence into what they’re saying. It’s hard.

75
You have teachers that get so frustrated and they’re like, “How can this kid not
qualify for special ed., he needs it so bad,” and you feel like you’re pushed in a
corner and you kind of just go, well, there’s nothing I can really do.
This excerpt illustrates some of the internal personal conflict that leads to or accompanies
the external interpersonal disagreements.
Anger can be exhibited in qualifying meetings. Disillusionment with the system
may build over time, as can anger with experiencing the intricacies and minutia
associated with special education during one’s first experience. An example of the former
involved a rookie psychologist facing off with a veteran teacher.
She got all puffed up and tried to intimidate me. She gave me this nasty look and
said, “I’ve been in this district for 23 years and you’re right out of school, and
you’re going to tell me he can’t get help in the room down the hall because his
numbers didn’t come out right?’ I took my WAC folder out of my bag, slid it
across the table to her, and said, “Here, you look it up. Tell me if you see anything
different.” I got up and left the room. If I didn’t, it might have gotten really ugly.
Situations involving angry outbursts were rare in this study, but they do occur. The
practice of examining IQ and achievement discrepancies seems illogical to many people,
and this can trigger people to become upset when the difference between a child getting
extra, needed assistance is based upon one or two points on a test. Justifying an
emotionally charged decision with dispassionate discrepancy data can lead to negative
feelings toward the system and those responsible for carrying it out. Few, if any, of the
psychologists in this study thought the current WAC methodology for diagnosing a

76
learning disability is valuable or just. Therefore, they are often placed in situations where
they are expected to defend a system of eligibility determination that they do not wholly
endorse. This has the potential to lead to internal conflict.
Considering Exclusionary Factors for LD Eligibility
When asked about qualifying students for special education under the category
“specific learning disability,” which is the most frequently used eligibility category for
providing students with services (Fuchs & Fuchs, 1998; Worth, 1999), the school
psychologists and special education teachers were very aware of the legal necessity for a
student to have a severe discrepancy between cognitive ability and academic
achievement. This category receives the most focus by teams when determining whether
or not to serve a student. What was not mentioned by every participant, however, was the
necessity for a team to rule out certain environmental factors, such as cultural or
economic disadvantage. Generally speaking, participants alluded to the need to identify a
true disability within a student for appropriate classification, but when asked what areas
the WAC specifically listed as exclusionary criteria, inconsistent answers were given.
Attendance was frequently mentioned, and issues of poor English language ability were
of concern to participants in school districts with significant minority populations. Areas
generally not touched upon unless directly probed by the researcher were those pertaining
to student culture, home environment, and poverty. Economic disadvantage, in fact, was
rarely mentioned by the participants without probing.
Those participants who had the greatest awareness of the exclusionary factors in
the WACs were those who reported having had issues arise within their teams in the past
pertaining to the disagreement of whether a student should be served when one or more
77
of these factors were in place. Teams which had gone through the process of ruling out
certain factors, or at least addressing the potential impact, seemed to have a greater grasp
of the importance of looking at these student-centered issues. When the issue arises
infrequently, knowledge of what to look for seemed to be lessened.
When asked how to make sure only those students who truly have a disability are
served in special education, participants consistently mentioned following the WAC code
closely. They were insistent that the law needed to be followed, and that going back to
the data and looking at it in accordance with regulations is a must. Understanding this is a
necessity appears to be well-ingrained with this group of participants. Training, either
through university programs or at the level of the individual school districts (or a
combination of the two), seems to have been provided at a level significant enough for
the special education team participants to see this as a paramount duty when determining
student eligibility. However, knowing the importance of following the law and
understanding what the law actually says may be two different things.
The Difficulty With Ruling Out Exclusionary Factors
Some respondents appeared to be quite aware of the impact student characteristics
have upon their learning. Areas such as lack of school attendance, limited English skills,
and family culture were mentioned as factors that can play a part in how well a student
learns and performs in school. Being involved with or witnessing crime, chemical use,
and changing family dynamics can also impact how successful a student is in school,
either long-term or short-term. The interview data suggested that special education
personnel wanted to address these areas, although they were not always brought into the
conversation without specific probing. They wanted to be able to rule out second
78
language issues, they wanted to rule out a poor home environment, and they wanted to be
able to rule out lack of participation in an appropriate educational setting. Doing so,
however, is extremely difficult for two reasons. First of all, how does a school employee
gather such information? It is extremely unlikely that a person who works in a school can
determine sufficiently that a student’s home life is the cause of her academic problems.
Maybe she doesn’t have a parent who can help her with her homework. Maybe she
doesn’t even have parents who can read. Determining such things is very difficult in a
school environment where teachers may go the entire year without meeting a parent,
much less seeing how they live. Teachers today do not have the time to do home visits to
learn about a student’s life after three o’clock. School staff cannot know a student is
receiving appropriate nutrition, shelter, or health care. There are too many home-based
factors that can impact how a child performs, and there are not enough tools or time for
staff to research them.
The second factor that makes determining students’ quality of care and readiness
to learn difficult is staff member discomfort researching such private areas. A school
psychologist is not likely to feel comfortable asking a parent if the family’s culture is
negatively impacting the child’s ability to learn English. It’s very difficult to broach such
sensitive topics as socioeconomic status and family composition. It’s hard to ask a mother
personal questions while suspecting the father is in prison. Children face many hardships
in life, and discussing them with the family can be difficult. The last thing a school
employee wants to do is come off as accusatory. Differentiating between disability and
environmental, cultural, or socioeconomic disadvantage is very difficult to do, and
special education staff report at times not being up to the task. As a school psychologist

79
reported, “If it’s socioeconomic, if it’s language, if there really is a learning disability—it
just comes down to gathering as much information as you can and making the best
decision you can.”
The following sections will address how the teams considered each of the three
primary exclusionary factors stated in WAC and IDEA—environment, culture ,and socio-
economic status. Also included are how staff addressed these areas.
Environment
The issue of environmental impact was interpreted by participants in three
primary ways: preschool interventions, school attendance, and home support/structure.
Students today are arriving in kindergarten with higher expectations placed upon
them than ever before. Twenty years ago, students were working on letter and number
identification in kindergarten, and today they are expected to be reading basic text by the
end of the year. Kindergarten is no longer primarily play and social time. While these
areas are still very important, academics have become a much greater focus. Given these
expectations, lack of structured preschool academic preparation can place a student at a
deficit compared to kindergarten peers. When a child needs to play catch up to be at a
level equal to peers, questions about disabilities might arise. A psychologist described it
this way:
A lot of kids come without benefit of interventions prior to school, and so they’ve
already got a discrepancy between them and their general ed. peers right from the
start. We try to give them enough time in general education that we can help to
weed out what is experience versus what is a true disability, but they often aren’t
coming here with the reading background and the general health background and

80
all of their basic needs met as well as their peers. It affects how they score on
tests, it affects especially how they do on their academic achievement testing
early on. My cognitive testing can also vary if they’ve had no intervention.
As so much learning takes place in those early years, for a child to not have the
opportunity to experience what other kids do with regard to pre-school instruction places
them behind the pack right from the start. This deficit may take years to make up, and the
struggle may resemble a learning disability. However, as no pre-schooling preparation of
any kind is mandated by law, parents who do not have the means or the ability to provide
an enriching pre-school environment either inside or outside of the home will likely not
receive any assistance in doing so. Tools required to jump right into kindergarten and
first grade will be missed, and valuable learning time used for remediation.
The environmental factor most commonly mentioned as preventing a student from
being placed in special education services was lack of attendance. As this factor is the
most easily quantifiable by school personnel, special education teams are generally
attentive to it. Examples were plentiful of students who were referred for special
education, and it was discovered somewhere during or before the assessment process that
the student had missed a significant amount of school. Across districts, special educators
felt that excessive absences put the student at risk of missing enough material to make
lack of academic exposure an issue. For example, a general education teacher from
Aspen told of the following student:
Juan was this really nice kid I had in a third grade class a few years ago. He
moved into the district before the school year, so I didn’t know anything about
him before getting him. He struggled for the first half of the year, and I was going
81
to refer him [for a special education assessment] after Christmas if it didn’t get
better. I went to the file to get the information for the referral, and I noticed he
was gone from school for over a month each year at this previous school. Sure
enough, he left for California the middle of January and didn’t come back for six
weeks. I obviously couldn’t refer him after that.
From the perspective of the school psychologists in this study, attendance problems often
lead to academic deficits. Since attendance-based deficits are likely to be
indistinguishable during academic testing from disability-based deficits, significant gaps
in attendance generally precluded students from being evaluated for special education
services.
Some school teams used the special education team’s denial of a referral as a
method of getting a parent to ensure student attendance. Teachers have expressed to
parents that the special education team would not assess the student without the
development of a stable attendance record. A Cedar teacher described this scenario:
I’ve told parents that their kid can’t be evaluated for special ed. help because of
lousy attendance. I made sure that they knew he needed the help, and that I
wanted him referred but my hands were tied. Basically, I got them to get the kid
to school by using the referral thing as a motivator. Get the kid to school and
we’ll try to get him into special ed.
Some students have unknown academic backgrounds, with records that are unable
to be located. This is particularly an issue for migrant students, and teams have to be very
careful when looking at a special education placement for these students. Access to

82
schooling is difficult to verify in this type of situation. Other issues involved with
frequent movers are present too, as explained by a general education teacher:
When a child bounces from place to place all of the time, it’s got to be hard to
pick up skills with any consistency. In one place they could be working on the
state capitols, and in the next school you go to they are working on the presidents.
On a more basic level, think about learning fractions. Try to figure out addition of
fractions when you moved the day it was taught to a school where they were past
that and working on converting improper fractions. Talk about being lost all the
time.
Psychologists reported that referrals of this type of student are scrutinized very carefully.
One stated that it’s “kind of like being a private eye and trying to get all of the
information that’s available.”
While attendance is an easily measurable and quantifiable factor, the
environmental factor of home structure and support is definitely not. There are a myriad
of home-based factors that can facilitate the learning process, and another myriad that can
detract from a student’s ability to succeed. Stories abound of children who do not have a
place to do their homework at night because of crowded situations. Some families do not
have consistent electricity, so darkness is an impact on learning at home. Illiteracy of
parents has a negative impact upon children because they cannot be read to at home.
General value of education and the educational process impact how the students are
going to view school. Having a parent who has disdain for the school system because he
or she had a miserable experience in school as a kid, perhaps due to some learning deficit
of their own, can really skew a student’s perspective of the learning environment. As a

83
Birch teacher stated, “Abuse, 14 people living in a trailer, both parents aren’t there, the
girl having to go home to take care of her siblings—stories you hear, all that. Yeah, it
impacts.”
Family structure is a key component. Many students in the participants’ districts
come from single parent homes. Some come from homes where there are no parents
present, with supervision provided by grandparents or another guardian. This works very
well for some students. If the environment is nurturing and caring, non-traditional home
composition can facilitate excellent student growth. Sometimes, however, it doesn’t work
very well, as a single parent may have to be away from home regularly to work or
grandparents who are taking care of children may have long-term medical issues.
An important component of the family structure is the way it came to be. Students
losing parents to the prison system, drugs, crime, alcohol, abandonment, and homicide
were all reported by respondents. Trauma of such an event can weigh heavily on a child,
and schoolwork is bound to take a back seat. One situation described was particularly
heartbreaking.
We had a little girl a few years back, fourth grade, just the nicest thing you could
imagine. Her home life was horrible. Single mom, dad in prison, new boyfriends
every other week. Turned out that CPS [Child Protective Services] learned that
she was spending nights in the car while mom went out and turned tricks. And
we’re supposed to get on her for not turning in her math problems?
Another teacher noticed,

84
I see the same kids here on the playground every day when I leave here at five. I
know they live over by [a local store], so they’re not here because it’s close by. I
don’t think they want to go home.
Children obviously want a stable home life, one where they are accepted and cared for.
They are always hopeful. A Birch special education teacher told a story of a student
bursting into her resource room one day about as happy as she had ever seen him. When
she asked him how he was doing that day, the student loudly replied, “My dad is out of
rehab!”
It was obvious that these issues were difficult for the school staff who had to work
with these children every day. Compassion was plentiful, but some level of withdrawal
seemed to be taking place. Teachers tended to describe student issues in a matter-of-fact
manner that removed a certain level of emotional involvement. Staff members appeared
to choose understanding and empathy over sympathy for their own well-being. A Birch
third grade teacher stated it nicely:
You can’t help but feel sorry for these kids, coming from such miserable homes.
Sometimes it’s like they don’t have a chance, you know? I’ve learned to not take
too much of it to heart though, because there isn’t anything I can do about that
stuff. All I can do is teach them the best I can so they have a shot in the world.
Besides, I have to sleep at night too, you know?
While many students have difficulties that are long-term and worsen from year to
year, student deficits can also arise in a rapid manner. A student may be going along just
fine when suddenly she or he has a dramatic drop off in performance, attendance, or

85
effort. Acute environmental issues, such as change in family composition due to a death,
birth, or divorce; legal issues or incarceration; drug use; or family health issues may have
negative impact upon students and the work they produce. Relationship difficulties, self-
esteem problems, or even puberty have the potential to impact how a student performs in
school. These and other acute problems can look similar to true disabilities and lead to
referrals for special services. Investigating and addressing these issues are further
challenges for special education staff. An Aspen psychologist stated it this way:
If there has been no inkling of a problem and then something has temporarily
changed this child’s circumstances, I think that eliminates them from special
education consideration because that right there is environmental for me. That’s
not to say we won’t revisit it, but I like to try a different intervention first before
we jump into that.
When staff are made aware of the issues that are leading to academic deficits,
they are able to pursue assistance through means other than special education. To assume
that teachers always know when a temporary or sudden problem is at the root of a
student’s poor academic performance, however, is asking for a level of awareness most
educators do not possess. Therefore, some acute environmental impacts are likely to
result in special education referrals.
Culture
The issue of cultural impact was interpreted by participants in three primary ways:
ethnicity and language skills, the culture of poverty, and the value of education.

86
When the majority of participants addressed issues relating to student culture,
they focused upon race and language. Cultural differences were most often interpreted as
being present when a student was from a country of origin other than the United States.
Therefore, skin color and primary language spoken by the student, as the most apparent
indicators of national origin, were the major topics outwardly addressed when the term
“culture” was broached.
For students from families where English is not the primary language, academic
challenges arise that are not experienced by the majority of the student population.
Schools are highly dependent upon verbal communication, and for children who do not
have the capacity to communicate on the same level as native English speakers, difficulty
with academic performance is often present. Conceptual understanding is limited, as is
understanding of procedures and expectations. While each of the three districts in this
study provide services for English language learners (ELL), their varied student
populations necessitate different models and resource allocations. Therefore, the level of
intervention provided for students that specifically addresses language-based issues
varies from school to school, and this impacts the role special education plays as a
remedial resource. This will be addressed more deeply later in this chapter.
There are inconsistencies among the participants regarding their perceptions of
qualifying ELL students for services. While all agree that the impact of language issues
on learning is difficult to quantify for a special education assessment or referral, some
team members feel that they do a good job of differentiating between language issue and
learning disability while others feel that they do not do an adequate job. Those who feel

87
their team does a good job often attributed it to effort on their part to exclude
inappropriate referrals.
I don’t think that a student is placed or not placed because of language. I think
that we try to do our very best to exclude those students that it is a language issue,
and I think we dig to get right down to the bottom line, although sometimes it’s
very difficult to tell.
I maybe have qualified probably four or five ELL students in the last couple
years, so I have done it, but it takes a lot more data to show different kinds of
learning going on. I’m going to look very hard at the kid’s progress and ability,
because if he does get into program it probably won’t be a quick trip to special ed.
Others attributed their perceived success in this area to experience of the team.
I think this team does a really good job of screening out whether it is a learning
disability or it’s a lack of language, and the staff here has been working together a
little bit longer and they have a system that seems to be working on the issues
with the languages, I think those are heavily addressed.
Most of my referrals from one of my buildings were coming from my second
language teams. We had had some people in there with little experience in
working with second language learners prior to the current team we have there
and so we had a lot of referrals that weren’t being met or addressed previously or
were being addressed kind of inappropriately, so for a couple years, they were a
majority of my referrals. Now that we’ve been there for a while, the team has

88
been there for a while, the bilingual education staff have been there, it’s kind of
reducing in terms of numbers.
Some staff members feel uncomfortable, and at times unqualified, to make the
differentiation between LD and ELL issues. This type of student situation causes a
significant amount of stress, with team members questioning their training and their
ability in allocating resources that may not be appropriate. Lack of experience is a
common factor among these individuals, with the psychologists and special education
teachers stating these feelings typically being new to the profession.
I’m just coming out of school, and kind of not having a real good grasp of some
of that stuff I tend to look at how they are doing in class compared to their peers, I
guess, probably more than other things with the second language learners,
because I don’t want to place kids in who don’t need it. I’m not sure I’m always
doing the right thing though.
That’s a real hard one to filter out because we always have those children who
speak English very nicely, but the academic English hasn’t kicked in yet and so,
and you can see it, how do we figure out whether it is a difficulty or whether it’s a
disability?
Some experienced psychologists have difficulty with the issue, however, as they
have been around long enough to see professional practices change. For example, one
psychologist stated:
89
ELL? I still struggle with that in my evaluations. I have a hard time. I see the
pendulum swing all over. First it was there where everybody was qualified and
then nobody was qualified. First we were over-qualifying, and maybe even as MR
(mentally retarded) or something, and then after lawsuits or whatever people said,
“oh no, don’t refer them, don’t qualify them,” and I think even I still struggle with
it. It’s an issue for me and I work really hard at it.
While more students with language issues may be referred for services, the teams
work hard in determining who should be made eligible and who should not. Mentioned
by many psychologists is the fact that learning disabilities and second language issues are
not mutually exclusive.
Yes, there’s a correlation, but I work hard at trying to rule out the factor of second
language influencing a student’s learning, We can never rule those things out
completely, but we just look at as many factors, as much information as we can
and see if there are other issues going on besides second language learning
coming into play, because some of these second language learners, it’s not to say
that they can’t have a learning disability in addition to their difficulty with or not
having English as a primary language
We have a very large population of kids who are second language learners, and
special ed kids are a subset of that large population. Those kids, the ones who
aren’t in special ed, are showing a certain level of capability, a certain rate of
learning a second language, a certain comfort level. Most of the special ed

90
students I see, regardless of whether it’s a first or second language, have poor
language skills. They may be black, pink, orange or yellow, but they have, they
don’t speak in complete sentences, they don’t have a reasonable vocabulary, they
know the meaning of very few words, they have 40 phrases that they use for all
occasions, and they’re not comfortable in the world of language, and that’s
regardless of whether it’s their first language or their second language. Language
has an impact on everybody. I mean, learning a second language is not an easy
thing. If you have a language learning disability, you’re not gonna learn your
second language as efficiently, so it’s very difficult to say this kid just doesn’t
know English because you have to go beyond that. The question has to be why
doesn’t he know English, he’s been here for seven years, he’s had every
opportunity of learning English. His little brother knows English, the other kids
in his class have done fine. You have to be able to compare him with his peers,
his family group and say he doesn’t understand Spanish very well either, so it’s a
complicated thing but you have to ask these questions.
Assessment of ELL students is another issue that challenges special education
teams. The cognitive and academic standardized assessment tools typically used for
learning disabilities eligibility determination are not standardized on non-English
speaking populations. While there are some nonverbal cognitive assessments and Spanish
cognitive and academic assessments available, they have not been approved by the state
for use as eligibility tools. In order to assess ELL students for services, each of the three
districts are using interpreted tests to some degree. This requires an examiner and an

91
interpreter to team up for assessments. While this relieves the test choice issue, it does
not help with standardization, as the tools were not standardized for interpretation or
administration in other than a one-on-one environment. Therefore, when assessments are
delivered in this manner, all results must be taken with a grain of salt. In order to qualify
a student with either a non-approved assessment tool or an approved test that has been
delivered in a non-standardized way, professional judgment has to be used. WAC
provides for this contingency, but examiners must state why the assessment was not
delivered in an approved manner and provide data-based information confirming or
denying the validity of the results. The necessity for professional judgment to be used on
nearly all ELL assessments significantly reduces the objectivity of the current learning
disabilities formula. Testing, the cornerstone for determining if a learning disability
exists, holds much less weight in these situations.
While the language issue was the most discussed cultural issue brought up during
interviews, school staff are also aware of poverty issues and the related cultural aspects.
As mentioned by Payne (1998) in her research on the culture of poverty, language usage
issues are present to varying degrees in the schools that serve students from low SES
families, such as those represented in this study. Particularly in the Aspen and Birch
districts, poverty is an issue that impacts day-to-day activities within the schools, and
lack of solid English language skills upon arrival at school is a significant detriment to
students from generational poverty. Different from the language issues ELL students
face, most of the students from poverty mentioned in this category have only one
language in their home- English.

92
Success in school, especially as one progresses through grade levels, is greatly
dependent upon the accumulation of academic language. Built upon from early ages and
grades, students gradually develop a vocabulary that is enhanced through practice at
school and at home. This repertoire of words, phrases, and linguistic concepts becomes
the basis for academic skills growth and advanced personal communication. Collecting
such a repertoire is greatly benefited by two things, however: coming to school with a
competent background of verbal skills and having an environment at home where words
and phrases learned at school can be utilized. Many kids from homes experiencing
generational poverty do not have either of these two things.
Teachers provided valuable insight into this phenomenon. A fourth grade general
education teacher from Cedar School District described a particular pair of students she
once had.
Three years ago I had a pair of twins in my class, a boy and a girl. They were
black, which was somewhat strange for that school. They moved here from
Tacoma to live with an aunt or grandparent or something, I can’t remember.
These kids weren’t dumb or anything, but they had the worst vocabulary I’d ever
heard. Not like using bad words or anything like that, but they didn’t know the
meanings to basic terminology or concepts. The girl was really shy and almost
never said anything, but the boy would talk a lot, just with a very small amount of
words. He’d use the same words for everything. He couldn’t spell at all, and he
never learned vocabulary things well either. I referred him for special ed a couple
of months after they arrived, thinking he had some sort of processing problem,
and he did qualify for speech, but only because of really, really bad vocabulary. I

93
met with mom at conference time in the spring, and it was like, ‘oh, that’s where
it comes from.’ She was the same way, with very little to say and few words to
say it.
Another student in Aspen was described in this way by a special education teacher:
I had a kid for reading and writing last year who never called anyone by their
names. I was always “teacher” and the other kids were either “him” or “her.” I’m
not sure if he knew all of the kids’ names in our little room by the end of the year.
His reading comp was lousy, but when we started working on labeling things
from the books, he did somewhat better.
These students and others described by the participants were suspected of being from
homes with little interaction and communication taking place. When these kids interacted
with other students during unstructured settings, they used very basic and slang-ridden
vocabulary. They were often loud, but had little to say.
This type of student is frequently referred for special services, and often qualified.
This is significant, because in order to qualify under the learning disabilities category,
one must have a cognitive ability significantly greater than one’s academic achievement.
While cognitive ability, measured by IQ, is supposed to be a stable construct, it was
mentioned by a couple of psychologists in this study that lack of exposure to
environmental experiences will reduce a student’s score, particularly in the verbal area.
Not experiencing a variety of situations or hearing rich vocabulary will prevent a student
from reaching her or his potential, thereby weighing down the IQ score. However, since
the full-scale IQ (a combination of verbal and nonverbal problem solving) is used for
qualification, the nonverbal areas can pull a student’s scores to a level where there is still
94
a significant discrepancy between cognition and academic achievement. Therefore, while
environment may be impacting a student’s ability to perform at the optimal potential, it
still may not prevent the student from meeting LD eligibility criteria by the numeric
formula.
Another area within the culture of poverty that impacts student performance is the
importance placed upon school and learning within the home by adults. Many students
come from homes where little value is placed on academics, often due in part to the
parents’ negative experiences with school. A psychologist from Cedar summed up
exposure and educational importance very nicely in this statement:
I do think it’s hard to identify if it’s just SES (socio-economic status) because
many of those students come from less educated parents who may not have been
good learners themselves, so it’s hard to know if it’s just the SES or if it is just
something the kid is born with. And some parents don’t care much about how
their kids do at school. I think that’s true and I think those people also don’t
necessarily know how to help their kids at home. I mean, you probably notice
with your own child that kids learn really quickly when you talk to them a lot and
you read to them and you do all these things that doesn’t necessarily have to do
with cognitive ability but just exposure.
Socio-Economic Status
The general consensus among special education team members who participated
in this study is that students from low socio-economic status (SES) homes are more likely
to be referred for and served by special education programs. This trend is more easily
recognized in the Aspen and Cedar districts. These districts’ students are generally from

95
middle class families, but those students with a less-advantaged home life can show a
significant disparity in school performance. A Cedar psychologist reported how she saw
the situation at her school.
This school is made up of kids who are usually not economically disadvantaged,
so I get a lot of referrals of kids here that I don’t think are disabled but compared
to their peers they may be academically a little bit slower. The poorer kids do
stand out, though, and it seems like they get referred more.
In contrast, the Birch School District has a high percentage of students from low
SES families, so the effect is less dramatic. A Birch psychologist estimated that about 60
to 70 percent of the referrals she has seen in the previous year were for students who
came from lower SES families. Considering the free and reduced lunch rate for the
district is 63.3 percent, however, the referral number is representative of the general
student population. Poverty was seen to be an issue in all of the schools in the district and
all of the district’s programs had to deal with it on a regular basis. It was just seen as a
fact of life. While poverty may be impacting special education referrals, there were no
strong feelings toward that being an issue. Poverty, when as all-encompassing as it is in
Birch, is just as much a part of the day as the weather. It didn’t seem to garner a lot of
attention unless something out of the ordinary occurred.
There was no shortage of stories relating to student poverty, however, and it’s
impact on the lives of kids. One particular story of a Cedar student struck a teacher
particularly hard. She described an elementary school staff, led by the counselor,
organizing a Christmas clothing and gift drive for needy families of their students. One

96
particular child came to school each day wearing one of two ratty sweatshirts that seldom
seemed to get washed. This family was selected to receive gifts from the school, and the
staff bought four or five new shirts for the boy. The family received the gifts warmly and
happily, but when the student returned to school in January, he was wearing his same two
ratty sweatshirts day in and day out. The teacher asked him why he didn’t wear his new
clothes to school, and the boy replied that mom had sold them and all of the family’s
gifts, presumably for food. Hearing stories like this leads one to easily realize that there
are problems out there that cannot be easily fixed in school.
Taking student environment, cultural, and socio-economic factors into account in
eligibility decisions is very difficult for school teams. There are obviously many factors
at play when looking at the whole child. For one psychologist, challenged students
deserve the benefit of the doubt:
I’m not satisfied that only disabled students are getting the services. I think
despite what we do to rule out environment and other issues, the bottom line is if
those kids were in different families, there's a good chance they wouldn’t be in
special ed, but at the same time when you’ve done everything, there’s nothing
else you could do for these children, having them drop out of school isn’t going to
help them either, so there are a few I think who look disabled who may not be but
there’s no way to prove it one way or the other.
Formalized Means of Addressing Exclusionary Criteria
The Washington Administrative Codes state that districts must exclude the factors
of environment, culture, or economic disadvantage as the primary cause of deficit prior to
97
making a student eligible for special education services under the category of specific
learning disability. This is a strong charge, provided that no other guidelines are set forth
for ruling out such factors. Districts have the challenge of putting procedures in place that
rule these areas out while regulating their employees’ time and maintaining a level of
confidentiality for the students. This section examines the wording of the WAC
regulations pertaining to these issues, the tools the three districts provide for their special
education teams to address the exclusionary criteria, and forms completed during
eligibility determination meetings where these tools were used.
WAC 392-272-126 provides definitions and eligibility criteria for the specific
learning disability category. The regulation states in part that “Specific learning disability
does not include learning problems that are primarily the result of visual, hearing, or
motor disabilities, of mental retardation, of emotional disturbance, or of environmental,
cultural, or economic disadvantage.” While there are definitions included in the 392-172
chapter of WAC for defining visual disabilities, hearing disabilities, motor disabilities,
mental retardation, and emotional disturbance, there are no further specific delineations
listed anywhere else pertaining to the concepts of environmental, cultural, or economic
disadvantage. WAC 392-172-035 defines the State’s three-pronged approach to eligibility
determination, stating that “any student, enrolled in school or not, (i) who has been
identified as having a disability, (ii) whose disability adversely affects the student's
educational performance, (iii) and whose unique needs cannot be addressed exclusively
through education in general education classes with or without individual
accommodations and is determined to be eligible for special education services.” This
WAC chapter places the responsibility on districts to determine that a true disability is

98
evident when considering a child for special education, but while it provides a listing of
exclusionary factors, it fails to provide clear definitions of those terms or ways in which
to identify them. This vagueness is a serious challenge to districts, as they are then
required to determine how to address these areas on their own.
Special education is a highly paperwork-driven enterprise, with legal
requirements for documentation present in every area of the referral, eligibility
determination, and service processes. The State of Washington has developed forms that
may be used by districts if they choose to do so, but it is up to each district to meet the
legal paperwork requirements if they elect to develop and implement their own forms.
The Aspen, Birch, and Cedar school districts developed a committee in 1999 to create
common forms for each of the three districts to use. Since the districts are within a close
geographic area, over the years they have seen many students move from one district to
another. They decided it would be best to have common forms to facilitate easy
transitions for students when they move from district to district. Incorporating
recommendations from the committee, the three districts now use the same paperwork
throughout their special education processes. Therefore, when referring to a particular
form in this section, it will be relevant to each of the three districts under study here.
There are three forms the districts use when they address exclusionary factors.
They are the Referral Meeting Worksheet (see Appendix C), the Evaluation Report (see
Appendix D), and the Specific Learning Disability Eligibility Statement (see Appendix
E).
The Referral Meeting Worksheet is the form completed when the special
education team receives a referral for special education assessment from a parent,
99
teacher, or another person who knows the student. It is completed by the school
psychologist as the team discusses the appropriateness of the referral and the potential of
an assessment taking place. This is a meeting where the following areas are addressed:
(a) review of educational records; (b) current educational performance; (c) review of
behavior, discipline, and attendance issues; (d) physical information; (e) speech,
language, and auditory issues; and (f) resources already provided and alternatives tried.
Following the collection and sharing of this information, the team decides whether a
special education assessment is warranted. If not, other interventions may be
recommended to the teacher and/or parent.
There are numerous areas on this form where exclusionary criteria could be
addressed. The review of educational records could provide clues toward the consistency
of the academic deficits and the more specific areas of deficit (such as language-based
activities, processing areas, etc.). Addressing attendance is an obvious exclusionary factor
area, as attendance is the most quantifiable area that can be measured to show lack of
access to the educational environment. Lack of access should be a big red flag when
looking for a disability. There can obviously be poor attendance occurring simultaneously
with a learning disability, but the attendance is an area to address when investigating
attributing such a label to a student. The speech and language area could also provide
valuable information regarding second language issues, as well as poor language skills
due to lack of exposure to a strongly communicative environment. There are not specific
questions pertaining to the exclusionary factors on this document, but there are
guideposts for special education teams to address the areas that WAC requires them to
consider. Knowledge of what is required by the WAC codes is necessary, however, as it
100
is not specifically spelled out by the document. One can infer meaning in this form
relating to the exclusionary factors, but the definition of them is not present here.
The second form the special education teams use that refers to the exclusionary
criteria is the Evaluation Report, which is completed following an assessment. This
document inquires into the presence or absence of a disability, the impact the disability
(if any) has on the students involvement and progress in the general curriculum, and the
recommended placement and specially designed instruction. It appears that this document
was created to address the three pronged eligibility criteria laid out in WAC 392-172-035.
Attached to this form, and therefore becoming part of the document, are either an
eligibility statement or a statement indicating that the student does not qualify for
services, reports from the professionals who performed portions of the evaluation, and a
professional judgment statement if applicable.
There are two specific statements the special education team must respond to on
this document that address the exclusionary factors. Although the WAC section is not
quoted directly, its influence can be inferred in these lines, to which the team must
indicate either a “yes” or a “no.” These are two “rule out” phrases, and the team must
state yes to both of them in order for the evaluation to be valid and the student made
eligible for services. The first statement says, “Lack of instruction in reading and math
was ruled out as the cause of the student’s difficulties.” It can be inferred from this
wording that school participation is required for eligibility. This points to the often
mentioned influence student attendance has upon special education team decision
making. However, other factors such as mobility and student health can become factors
when addressing this rule out area. The second statement to be addressed states, “Lack of

101
English proficiency was ruled out as the cause of the student’s difficulties.” This seems
to point to the cultural influence exclusionary factor. However, as previously mentioned,
one could make the case for economic disadvantage impacting English proficiency.
While these two statements rule out some areas the WAC exclusionary factors
cover, there are many other situations and scenarios that are not covered here. It appears
the districts attempted to address the major rule out areas they were experiencing. There
is obviously no way for a document to list all of the specific factors a team would have to
rule out to cover the influence of environmental, cultural, and economic disadvantage,
but the few statements made here without addressing the specific exclusionary categories
themselves appear somewhat limited in scope. A catch-all statement is included,
however, that could be seen as a way to address the exclusionary factor issue and all
other evaluation issues. It states, “The student was evaluated in accordance with the
procedures set forth in WAC 392-172-108.” Probably adopted from the State form, this
appears to be a district’s way of covering itself for all contingencies related to assessment
protocol.
The third form actually becomes part of the Evaluation Report when a student is
determined to be eligible for services under the specific learning disabilities category. It
is the Specific Learning Disability Eligibility Statement (see Appendix E), and it reports
the areas of eligibility (basic reading, written expression, math calculations, etc.), the test
scores, and the criterion score (based upon IQ assessment). It also states all of the
requirements that must be met in order to state a student is eligible as LD, including the
lack of visual, hearing, or motor impairment; mental retardation; emotional/behavioral
disability; or environmental, cultural, or economic disadvantage. Nothing regarding these

102
areas needs to be affirmed or denied, and no documentation of effort toward ruling these
areas out needs to be provided. It is a statement that appears on the form that by its mere
presence indicates that these areas have been addressed. Therefore, while no written
explanation of methodology for addressing these areas is necessary, the team, by
attaching the eligibility statement to the evaluation report, is saying that these areas have
been addressed and ruled out. The eligibility statement does provide the option of
addressing the areas that do not apply through the professional judgment statement.
Review of special education team meeting records revealed consistent use of the
Referral Meeting Worksheet among teams in the three districts. As the amount of space
on the form is limited (less than an inch of writing space per line), only very brief
statements were provided for the five areas. For area number one, district-administered
standardized test scores were often included (e.g., Washington Assessment of Student
Learning; Iowa Tests of Basic Skills) as a quantifiable measure of student performance.
Estimates of grade level performance in reading, writing, and math were also common,
particularly in the elementary grades. Amount of time in the district or number of schools
attended, if factors, were listed. Current placements were also listed, including deviations
from the typical education program such as ESL, bilingual, or Sheltered English.
Generally speaking, although the first section is stated to include parent input, there
seemed to be little information provided by parents. The section was dominated by what
appeared to be file review information, including easily-procured test scores, report card
grades and comments, and previous and current school and classroom placements.
On a small percentage of the reports reviewed, a statement was included in
section one referencing an attached pre-referral report. These reports were developed by

103
the Student Assistance Teams (or similar bodies having slightly varied names), and
tended to include information of greater breadth and depth, including family composition,
grades from previous report cards, teacher comments, peer relation skills, transportation
issues (bus referral information, etc.), and documentation of parent contacts. Many of
these areas seemed appropriate for section one of the Referral Meeting Worksheet, but
limited space obviously did not allow for that extent of information to be presented. It
was the Aspen School District teams that provided all but one of the attached SAT
reports. This is consistent with Aspen’s seemingly greater emphasis on pre-referral
intervention than the other two districts. That said, the majority of Aspen’s Referral
Meeting Worksheets still did not include more information than the form provided.
In section two, which asks for “Review of behavior/discipline/attendance,”
psychologists tended to state in very brief terms the behavioral or attendance issues the
student presented. Again, the space provided did not allow for significant elaboration.
Statements such as, “No problems noted,” “Good attendance,” and “Gets along well with
peers and adults” were often used to indicate no perceived issues to be addressed. Some
teams chose to quantify things by listing the number of behavior referrals, absences, and
tardies a student had. Some forms addressed only behavior or only attendance, with the
other left unexplained, seemingly due to the emphasis placed on the issues by the team.
One form reviewed had several copies of discipline referrals (written to the principal by
the classroom teacher, the physical education teacher, and various playground support
staff) stapled to it. This was the only form reviewed with attachments made to section
two.
104
The amount of attention paid to attendance in select cases is unknowable simply
by reviewing the records of the initial multi-disciplinary team meeting. For example, on a
couple of occasions there seemed to be significant attendance issues noted for students
and yet a recommendation for assessment signed by the team. Whether the reason for the
absences were noted or not (in one case they were: student illness), what appeared to a
trained observer to be cause for stopping the referral process was obviously not due cause
for the teams in question. Whether the absences were ignored, explained away, or used
for reason for continuation is not able to be ascertained merely by looking over the
paperwork.
Section four addressing speech, language, and auditory issues tended to lead in
one of three directions: the student had a deficit in articulation or communication that
requires an evaluation by a speech-language pathologist, the student has issues relating to
English not being the primary or only family language, or the student has no issues in
these areas. Birch School District seemed to provide the most comprehensive information
regarding second-language learners, often with BICS (basic interpersonal
communication) and CALP (academic language proficiency) information provided. With
a greater proportion of the student population having second-language issues, Birch
seemed to have greater tools to measure communication available prior to special
education assessment. While the documents reviewed from Birch did lead the reviewer to
believe that limited English impacted some of the students, the referral processes were all
continued. The limited English skills by the student did impact the way in which the
assessment was recommended to occur, however, with bilingual assessments frequently
recommended. In addition, any programmatic remedial assistance, such as through the

105
Learning Assistance Program or Title I, that the student received were likely listed in this
section.
By the time the assessment team got to the point of completing an Evaluation
Report, the paperwork items addressing factors that may exclude a student from SLD
eligibility were an afterthought. There are spaces on the evaluation form where the team
has to indicate either a “yes” or a “no” for having ruled out lack of instruction and limited
English proficiency as a primary cause of the student’s difficulties. However, it is a “yes”
or a “no”, and not a “how,” question. In all of the completed forms examined, these two
spaces were marked “yes.” This is true whether a student qualified for services or not.
For these spaces to not contain an automatic yes would be to admit that the assessment
went on for no reason, or at least that the assessment could not lead to any determination
of special education eligibility. In other words, a team that states that they did not rule out
the lack of instruction or lack of English skills would be admitting to spending several
hours of assessment team time for no placement-based reason. This was unlikely to
happen at this advanced stage of the proceedings.
For those students who are deemed eligible for services as learning disabled, the
Eligibility Statement is to be attached to the Evaluation Report. Again, there are
statements regarding the exclusionary factors of environmental, cultural, and
socioeconomic disadvantage, but no methodology for how they are addressed is required.
Again, it is expected that once a team gets to this stage, those areas are considered as
given.
While the districts, with the above-mentioned forms, provide some formalized
means for addressing exclusionary factors, little guidance is given for how to address

106
them and few tools are given for the official recording of the investigation that is to take
place. The districts have the assessment teams acting on their own, with assumed
knowledge of the exclusionary criteria and assumed skills for addressing and recording
the exclusionary criteria being ruled out. If challenged in a legal proceeding, the districts
have the few documents addressed here to show that environmental, cultural, and
socioeconomic disadvantage are addressed, but an individual team would be hard pressed
to show with this documentation alone that they have in fact done what the WACs say
they are to do. Additional documentation is almost certainly needed to show a team
ruling out exclusionary factors.
The Ethics of Eligibility Determination
Special education teams are made up of individuals. Each person on the team
brings with him or her a complex base of values that influences how they approach their
work. While special education decision-making is highly structured and guided by state
and federal law, there is significant room for individual values and judgments to impact
how a team operates and the decisions that the team makes.
There is little doubt that each individual interviewed and observed during this
study had the best interests of the referred students in mind. How each team member
proceeded to work toward helping students varied, however. It appeared to be an issue of
each individual’s personal ethics guiding their philosophy toward special education.
The ethical differences could be plotted along a spectrum of beliefs. At one end of
the spectrum lay the belief that whatever must be done for the benefit of struggling
students is okay, within the confines of the available options the district offers. Resources
are meant to be used for those students who need them. At the other end of the spectrum

107
is the belief that the rules regarding program eligibility are hard and fast. Only those who
are eligible according to the written rules and regulations may receive services from a
given program, with need considered only after eligibility has been determined. The
former could roughly be associated with an ethic of care, while the latter more closely
resembles the ethic of justice (Starratt, 1994). There appeared to be a correlation between
ethical belief and the position one held within the school district.
General education teachers were much more likely to suggest services for a
student who may not have technically met eligibility according to published regulations.
As the individuals who typically referred the students for special education services due
to deficits observed in their classrooms, the teachers had a vested interest in seeing
services provided. In fact, their interest is two-fold. General education teachers referring
a student are required to go through a significant paperwork process. They also have to
contact parents, collect documentation, and participate in at least one multidisciplinary
team meeting to see the student even make it to the evaluation process. Therefore, a
teacher who refers a student is likely putting in hours of work to see the process
continued. While this is a secondary concern for teachers, the amount of time spent
jumping through special education hoops is a significant and frequently mentioned cost to
the referral process. Obviously a teacher would not like to see this effort and time go for
naught.
The most important concern general education teachers have during this process,
however, is for the well-being of the student they have referred. While there is obviously
a range of special education knowledge and respect for the regulations, general education
staff interviewed and observed were significantly more likely than special education staff

108
to suggest the bending, modification, or ignoring of rules that prevented a student from
meeting eligibility for the learning disability category. For these individuals, the push to
help a struggling student was greater than that which held them in adherence to rules
developed by a far-off legislative body. Resources present but unable to be accessed were
wasted if a student truly had an academic need. Establishing the presence of a disability
and determining eligibility was merely a means to the end product of a specialized
remediation effort. The child comes first, the rules come second. If the rules stand in the
way, it might be worth it to look for ways around them.
The other ethical approach to eligibility determination places emphasis on the
appropriate procedures and rules being followed. Those who subscribe to this type of
thinking seem to feel that the rules are in place for a reason, and that reason is to provide
assistance to a specifically determined population who meet the specific guidelines. For
everyone to access these resources would put an undue strain on the system. Special
education resources are for specific students who meet specific requirements. While this
approach limits the number of students who can access these resources, it does not denote
a decreased level of caring for or commitment to students in general. In fact, these
individuals who approached their profession from this approach seemed to have a
heightened feeling of advocacy for students, the difference being that the advocacy was
for the students who had the greatest barriers to overcome due to a lifelong disability.
There are instances when one’s ethic of caring for students collides with the ethic
of the profession in which one works. Many special educators interviewed explained
having conflicting feelings regarding certain situations where particularly needy students
did not meet the legal SLD guidelines for qualification. In certain situations, there are

109
ways crafty educators can look at the regulations in order to work the system to get
services for students. These methods are perfectly legal, but the ethical confusion they
present was apparent.
One such way around the somewhat rigid mathematical portions of the specific
learning disability criteria is the pursuit of eligibility in another special education
category. Special educators who feel a strong desire to help a certain student receive
services to which he or she may not otherwise be entitled can look at the full range of
eligibility options that may or may not really indicate the student’s cause of deficit. This
is often done through the pursuit of documentation stating that the student has a medical
problem. The eligibility category of Other Health Impairment requires documentation
from a qualified physician that states a student has a medical condition that has the
potential to impact their education. While often used for students who have severe
medical impairments such as epilepsy, cerebral palsy, or any of a variety of syndromes,
other less severe diagnoses have been used to help qualify a student for services.
Attention Deficit Disorder (ADD) or Attention Deficit-Hyperactivity Disorder (ADHD),
one psychologist stated, is the diagnosis du jour for those looking for a way around SLD.
A team looking for a way to make a student eligible for services may have a parent seek
such a diagnosis from a medical provider and use it for the primary piece of evidence to
accompany academic deficit as rationale for the need for service. Clinically subjective
and freely dispensed by some physicians, the ADD diagnosis can be obtained by most
any persistent parent. It doesn’t take long for those working in school systems to learn
which physicians are free with the label. An Aspen special education teacher described it
this way:

110
If they don’t make it by the SLD criteria, and if they’re not at least close enough
to make a case or you can’t really make a good case for professional judgment,
then you’ve got to have a statement from a doctor with ADHD or something like
that. I’ve seen that too, where we’ll reconsider if we can get a statement that says
they’ve got something like that.
This method seems to meet the need of certain individuals, psychologists in
particular, for a structured way to qualify a student for services when the SLD category
cannot be used. Another way around the mathematical formula, one with significantly
less structure, is through the use of the professional judgment clause of the WACs. This
clause allows teams to use their professional judgment to state that the standardized
testing administered did not provide valid data for the particular student. Developing an
argument for why a student truly has a severe discrepancy between academic
achievement and innate ability can be done very effectively by teams that have a strong
desire to see a student receive services. One psychologist described the desire to use
professional judgment in this manner:
We defer professional judgment to the team, the team that knows the student. As
long as we can make a case for it, by presenting our case within our records and
our data and our interpretation of the data, to show that there is some sort of
deficit here that requires intervention, then we don’t have a problem using it.
If teams make the decision to use professional judgment, the student is made
eligible for services and placed on an IEP. The team is giving its word that their
111
procedures were flawed in some way and therefore could not detect the presence of the
student’s specific learning disability using the mathematical formula.
Once a student is in special education, however, she must be evaluated at least
every three years to see if she maintains eligibility. For those students who didn’t meet
criteria by the numbers the first time, and even for some of those who did, the use of
professional judgment can become necessary to keep them in services. It becomes
difficult when a student is receiving assistance to let them go when they still exhibit the
need for help. As explained by a psychologist,
Somebody once decided they had a discrepancy, and to keep the progress going
that they’re making, they’re going to continue to need special help. Maybe they
don’t qualify by the numbers, but we can use professional judgment to keep them
in. I find I’m doing that more.
With districts having high percentages of students receiving special education,
special education administration can step in to curb the use of professional judgment.
This is the case in the Cedar School District, where the special education percentage is
close to the funded thirteen percent cap. These limitations have prevented some teams
from qualifying students through professional judgment in situations where they would
have liked to. A Cedar psychologist described not being able to be as free with
professional judgment as might be desirable:
I don’t want to push professional judgment too far so as to keep using it every
time, but I definitely feel like we should be able to use it more because there are
112
those cases that I think they just need it. For some reason, they (the students)
don’t score the way we wish they would have.
A Birch special education teacher expressed disdain for the restriction by stating, “We are
professionals, we should be able to use our judgment. We do everyday, but now they just
make it more difficult to do so.”
Ethical challenges, many school psychologists explained, occur on a regular basis.
One such individual who serves elementary schools in the Birch School District stated
that at least four or five times a year he is challenged with difficult decisions as to
whether he should help a team determine a student eligible for services when he or she
does not meet the required legal guidelines. It can be a stressful situation for a
psychologist, who tends to be the person responsible for making the final decision. Some
students are presented as particularly needy, and when they fail to meet criteria, they are
sentenced to almost certain failure in the mainstream. While trying to maintain his
resolve, this psychologist does find himself giving in every once in a while. As he states
it, “I’d be lying through my teeth if I said that we have no children in special programs
that aren’t disabled in this building.” Whichever path he chooses, he’s going to live with
some feelings of guilt. He has to decide whether to return a student into a learning
environment where success is highly unlikely, or to look for a way to circumnavigate the
regulations that guide his profession.
This challenge is particularly difficult when a student is facing problems that may
stem from an environmental, cultural, or socioeconomic source. As everyone has a
different ethical perspective, there are many ways to look at these areas. For certain
teachers, the fact that a student comes from an unsupportive home environment is more

113
of a reason to provide him with extra assistance, often in the form of special education.
Others view special education as the remedial program to help a student who has second-
language issues, particularly when the district does not have a particularly large minority
population. These beliefs are contrary to the exclusionary clause. Some team members
from Birch see the floodgates having already been opened, with many students having
previously been made eligible for services when they technically should have been kept
out for exclusionary reasons. The team thought process then involves fairness for this
particular student when a group of similar others are already receiving services. As one
special education teacher states, “It’s hard to keep a kid out when two other kids from the
same class with the same needs from the same neighborhood get help. Teachers see that
and push harder.” Other times, siblings in service can eliminate the exclusionary factors
for a team when they may rightfully have come into play. To state that one sibling is too
impacted by poor home environment is very difficult when a sibling has already been
made eligible for services.
Again, it comes down to the individual team members and their ethical stance
regarding student eligibility. It appears that in the majority of circumstances the ethical
option of following the law prevails, but there are certainly those instances where caring
for a student’s future override the legal issues. It all comes down to the team’s
willingness to cross that line drawn by the WAC regulations. A Cedar psychologist
explained it this way:
We can’t help everybody, and there has to be a line we don’t cross. I want every
kid to be successful too, and I really feel bad when they come from miserable
homes with miserable parents and no money, but I can’t allocate all of our

114
resources to kids who don’t really qualify. It’s really stressful sometimes, and I’ve
seen lots of tears, but I need to stay on my side of the line or else there shouldn’t
even be a line. If you let one qualify, you have to qualify all kids who need the
help. I try to be tough, but sometimes I get weak too. Nobody’s perfect.
District Demographic Composition
The three districts examined in this study are geographically proximate, but have
very different demographic compositions. As mentioned in the Methodology chapter, all
three are medium-sized districts. There are significant differences among the three for
poverty index, percentage of the student population with second-language issues, and
mobility. Each of these areas impact the districts and their uses of special education as a
resource.
One area where student demographics plays a role in special education
determination is with the availability of other resources. Special education, as mentioned
in previous sections, is seen by some as an early intervention for struggling students, and
seen by others as a last resort due to its potentially restrictive nature. The availability of
other options for a district to use to address struggling students likely impacts how special
education is viewed as a remediation option. For example, the Birch School District has a
very high percentage of students who are eligible for free or reduced school lunch due to
limited family income. This allows the district to access Title I services in each of its
buildings. Whether Title I is provided through a school-wide or a targeted assistance
approach, it is a significant option for students who are performing within the bottom
quartile in reading and/or math to receive additional assistance. Title I funding in Birch

115
allows the elementary schools to provide Reading Recovery, which is an intensive
reading program for first graders. Children who are at the lowest reading level in the class
ranking receive intensive training one-on-one with a reading specialist for upward of
thirty sessions. The Title I-Migrant Program, a subset of Title I, provides assistance for
Birch’s significant transient student population. These students receive extra assistance in
the form of pull-out remediation or in-class support to help them address academic
deficits they may have obtained due to moving from one area to another.
Also in Birch, due to the high percentage of students who are second-language
learners, the State Transitional Bilingual Program provides funding for bilingual teachers,
paraeducators, and materials. Birch has used this funding for fully bilingual
programming, interpretation and translation services, and the creation of Sheltered
English Techniques (SET) classrooms. Bilingual Program monies are extensive for Birch,
so the program supplies the buildings with a great deal of resource materials and
personnel allocation.
These programs, along with many other state and federally funded programs,
provide school districts funding based heavily upon student demographics. Aspen, Birch,
and Cedar, with their varied student populations, receive a significantly different
allocation from these programs. While Birch has a heavy ELL population, Cedar’s is
quite low, meaning that they will receive much less money to provide services for these
students. The eligible students do not have any less-significant needs than their
counterparts in Birch, but the services they are provided may be at a greatly reduced level
of intensity due to the lack of Cedar funding. In fact, Cedar provides its ELL students
with pull-out English as a Second Language (ESL) services, a much less-intensive

116
program than Birch can offer. Aspen, with a larger ELL population than Cedar and a
smaller population than Birch, provides services that fall somewhere in the middle, with
services stockpiled where they are needed, depending upon the individual school
populations.
Title I funding is allocated to the three districts in a similar manner. Birch
receives a sizable allocation, Aspen a lesser allocation due to their lesser poverty index,
and Cedar an even smaller allocation due to only one student in five receiving free or
reduced lunch. How the districts choose to use their Title I funds is up to them, but the
amount of money available to the less-wealthy districts will be much greater, providing
them with more service options for their student population.
The districts with more options available for students in special student
populations (e.g., poverty, migrant, bilingual) tended to use these services prior to special
education assessments. As there is a definite possibility that a student can be a member of
a special population and have a disability requiring specially designed instruction, some
students’ services did overlap. Generally speaking, however, one of the less-restrictive
programming options provided through a state or federal program other than special
education was pursued prior to special education being sought. Failure to achieve success
with this type of programming, however, was seen as a good indicator that something
more significant may be impacting the student’s learning, and a special education referral
was then initiated.
For districts or schools with limited services available for transient, minority, or
low SES students, however, special education tended to be sought early on after
determining the student was struggling in the classroom. This was reported regularly in

117
Cedar, as they did not have the funding available for a lot of extraneous service
provision. As stated by a Cedar psychologist,
We don’t have a lot going on in this school to help remediate academic problems
other than what a teacher can do in the classroom. That means we probably send
kids to the special ed. process sooner than we should. It happens a lot with ESL
kids.
While it shouldn’t be labeled as either right or wrong to assess students early after
noticing an academic deficit, it is an unfortunate reality that lack of resources for a school
can mean greater emphasis on special education to meet all remedial needs.
Another impact student demographics has on a district is the perception the
teaching staff has of the concept of “normal.” Characteristics such as lack of educational
exposure or poor English-language usage tend to stand out more to teachers in
classrooms where these characteristics are not the norm. In Cedar and parts of Aspen, for
example, a second grade student who uses words incorrectly or substitutes Spanish words
into sentences would likely stand out more than they would in Birch, where a majority of
the students know some Spanish. Teams in these districts, participants report, see many
referrals for students who stand out from the crowd, and this standing out leads to
suspicion of learning disabilities.
Some schools, however, do not look as closely at particular student
characteristics. For example, participants from Birch reported paying less attention to
student poverty level when assessing them for services. As poverty is the norm, it is not
looked at as a factor in the student’s development. This factor does not make the student
stand out amongst peers.

118
Overall, it appears that demographic composition can impact both how and when
a student is noticed as having difficulty when compared to peers at a classroom level.
Ironically, exclusionary factors of poverty, culture, and lack of exposure can lead to
increased referrals to special education as they make some students catch the eye of
teachers in classrooms where these factors are not the norm. On a district level,
demographic composition can impact the resources available to attempt to remediate
deficits prior to special education involvement.
Summary
The seven themes addressed in this chapter--role of team members, role of special
education, social dynamics of the decision-making process, considering exclusionary
factors for LD eligibility, formalized means of addressing exclusionary criteria, the ethics
of eligibility decisions, and district demographic composition included factors that were
developed through careful analysis of the data and impact the processes and procedures
used by special education teams when considering students for categorical special
education eligibility and placement. While the team approach used in special education is
inherently valuable and necessary for the evaluation process to meet its fullest potential,
the themes described in this chapter make the act of determining eligibility for services
difficult for a team. Interpersonal issues, systemic issues, and regulatory issues may
challenge teams (and the individuals that comprise them) in ways that one would likely
not predict when examining special education law alone. The learning disability category,
with focus on issues such as exclusionary criteria, seems to increase the level of
complexity.

119
CHAPTER V
SUMMARY AND CONCLUSIONS
Introduction
The purpose of this study was to describe and analyze the processes used by
special education teams to qualify students for special education services in the learning
disability category, with a particular focus on whether and how teams take into
consideration the exclusionary factors stipulated in IDEA and WAC. Specifically, the
study addresses the following questions:
1. Do special education teams consider individual student environment, culture, and
economic factors when determining special education eligibility under the
category of “learning disability”?
2. Do districts from the same geographic area with differing student populations
(with regard to environment, culture, and economic status) treat these issues
differently?
This chapter will interpret the findings of this study, as presented in Chapter IV as a
series of themes, to address these questions. However, while the research questions seem
to be straight-forward, the complexities of the issues mitigate against straightforward
answers.
In the following sections, some of the ambiguities of the eligibility process that
impact consideration of exclusionary factors of environmental, cultural, and socio-
economic deficit by special education teams will be discussed. Included will be
legalistic/conceptual and procedural ambiguities and individual differences among team
members. In addition, differences based on district demographics will be discussed. The
120
chapter will conclude with recommendations for districts to allow for increased
efficiency in addressing exclusionary factors.
Legal and Conceptual Ambiguities
Both the Washington Administrative Code (WAC) and the federal Individuals
with Disabilities Education Act (IDEA) have guidelines set forth for the assessment of
students for eligibility into special education. Both contain identical wording with regard
to what is known as the exclusionary clause, which states circumstances where a student
is not to be found to have a learning disability. Specifically, Washington Administrative
Code 392-172-126, states that, “specific learning disability does not include learning
problems that are primarily the result of visual, hearing, or motor disabilities, of mental
retardation, of emotional disturbance, or of environmental, cultural, or economic
disadvantage”. This, however, is the extent of the guidance provided regarding these
exclusionary factors. This ambiguity means that, in order for this portion of the WAC and
IDEA to be addressed, educators are forced to develop their own interpretation of the
meaning of this clause and the procedures for addressing it. Definitions of the terms are
not provided, nor are methods for determining “disadvantage.”
In order to illustrate the ambiguity of the statement, it can be broken down into its
component parts. First, the areas of visual, hearing, and motor disabilities each have their
own category of special education eligibility in the WAC, as do mental retardation and
emotional disturbance. It therefore makes sense that the specific learning disability
category does not include these areas. They are stand-alone eligibility areas in their own
right, and it is relatively straightforward for teams to differentiate them from learning
disabilities. However, environmental, cultural, and economic disadvantage are not special

121
education categories, and therefore are not defined in the WAC, leaving teams to develop
their own definitions and struggle to differentiate these factors from learning disabilities.
Participants in this study tended to see “environment” as home environment, but
that itself held many definitions, depending upon the respondent. Some understood
environment strictly as a physical space, primarily including the student’s dwelling.
Others added physical materials (books, pencils, and a table for homework), the quality
of life in the physical space (enriching television, ample lighting, lack of overburdening
responsibilities), or family dynamics/beliefs (importance a family places on education,
presence of both parents, a safe and nurturing sense of home). The concept of “culture,”
similarly, differed from respondent to respondent. Many focused upon obvious issues
pertaining to nationality, such as language spoken in the home and place of birth. For
others, culture included family-based practices (extensive school absences for travel,
migrating with agricultural work), the family’s vision of family structure (for example, a
dominant father with a subservient mother), and/or non-ethnic aspects (the lifestyle
associated with poverty or wealth) as important. The concept of “economic status” was
generally understood by respondents to mean family financial income and the resources
that could be afforded with it. What varied by participant, however, was the type of
evidence that could be used to infer economic disadvantage. Is a student who seems to
have less money, based upon clothing and material brought from home, at an economic
disadvantage compared to peers? While such observations provide clues about a student’s
economic status, it is difficult to obtain enough information without broaching the topic
with the student’s parents.

122
This leads to the question of what defines “disadvantage.” It’s difficult to
establish a definition of disadvantage that uses statistics or objective data as a measure for
someone being disadvantaged within a school setting. School teams often try, however,
which is why the use of attendance figures are so frequently obtained when students are
referred for special education. When asked about looking into students’ backgrounds
following special education referrals, attendance was quite consistently the first thing
addressed. Number of days absent is hard data that can be looked at objectively, and from
those numbers a percentage of the available education time missed can be determined.
While this works well for attendance figures, other exclusionary areas are not so clean.
Only one of the three districts participating in this study (Birch) commonly used language
assessment information to determine if second-language issues are likely to be impacting
academic proficiency. No districts reported looking at available economic data, such as
free/reduced lunch status for individual students, as poverty indicators. While not
necessarily appropriate means for making special education decisions, these types of
scores may provide insight into a student’s home life. Without standards, the only way
for individual IEP teams to address environmental, cultural, and economic disadvantage
is by hoping to know it when they see it.
With an obvious lack of standardized definitions for exclusionary criteria, does
the subjective perception of difference from the norm denote disadvantage? If so, what is
the norm? It appears obvious that a student with distinctly different characteristics from
his or her peers would stand out in a classroom. While an education professional
detecting an environmental, cultural, or economic disadvantage based upon the student’s
presentation may trigger the need for further investigation, these exclusionary factors are

123
primarily based upon issues developed in or stemming from the student’s home, and there
is no valid way of observing the impacts carried over into the school setting. Observing
what takes place in a student’s home is highly impractical, which leaves school personnel
to make decisions about a student’s environmental, cultural, and economic status with
limited practical data and plenty of observational information. This highly subjective
method is prone to both false negatives and false positives, as those students who do not
stand out from their classmates may be overlooked as possessing factors that make them
inappropriate referrals for special education services and those who do stand out may not
really possess any reason for exclusion. To rely upon knowing them when they see them
is an inconsistent practice with little clinical utility.
Procedural Ambiguities
Lack of clear definitions for what it means to have an environmental,
cultural, or economic disadvantage as opposed to a true learning disability is a
shortcoming on the part of the state and federal special education regulations. With no
guidance from the top, the responsibility then falls to the individual school districts to
develop procedures for IEP teams to use when addressing these areas of IDEA and WAC.
The documents the three districts use provide the appearance of having teams
address exclusionary issues, but there is no substance in their manner for doing so. It
appears that the statements about environmental, cultural, and economic disadvantage are
there as a means of self-protection on the part of the district. The inter-district team that
assembled the forms obviously used the letter of the law in the development process.
What they failed to address, however, was the intent of the law, which requires that teams
take active measures to eliminate some factors that impact student performance other
124
than true learning disabilities. To have a few scattered statements present in a student’s
special education file may curtail any serious legal claim that these factors were not
addressed. The districts must feel that these statements are sufficient to meet any
accountability standard set forth by the state. However, looking at district documentation
does not help identify how special education teams look at exclusionary factors. Using
other means (such as direct observation) would be required.
In addition to the limited nature of the documentation, there was a serious lack of
formal guidelines regarding processes for addressing exclusionary criteria available to
educational staff. The three districts’ special education handbooks did not address the
issue, nor did staff training. This lack of guidance gives significant leeway to the
assessment team, and may, in fact, give them enough clearance to conduct a limited
investigation into exclusionary factors, if any at all.
Individual Differences
Without standardized methods for looking into exclusionary criteria, it becomes
necessary for individual team members to take it upon themselves to determine ways to
gather the appropriate information. The extent to which effort is put into the process,
however, is going to vary by team. Some teams examined look very closely at each
student’s records while trying to glean information that may produce red flags for special
education assessment. Others determine that if a case makes it past the Student
Assistance Team into a full-blown special education referral that it must be necessary to
conduct an assessment. The only consistent aspect is the lack of consistency. Although
teams are guided by the same regulations, their methodologies can be quite different.
Also of note is the phenomenon of inconsistency of the same group over time. The way a

125
team handles one student’s case does not necessitate similar action to be taken on another
student in a few months.
Special education teams are highly guided by individual decision-making. It was
stated earlier that teams are comprised of professionals from various educational
specialties. These team members do not have equal power. School psychologists tend to
reign supreme in the districts studied, and their opinions are much more influential than
those of the rest of the team members. While some people are naturally more influential
than others, the roles individuals play at the meeting table have a significant impact upon
whose voice will be heard the loudest.
In addition to positional power, other individual differences impact decision-
making. They include the level of training one has received from university training
programs, individual ethics, and personality. Experience also plays a part, and can lead to
changes in perspective over time.
District-provided training in Aspen, Birch, and Cedar was sporadic and
insufficient to meet team member needs with regard to the nuance of special education
regulations. In fact, the amount of training devoted to addressing exclusionary factors
seemed negligible. Administrations’ lack of emphasis regarding the more subtle points of
learning disabilities eligibility indicates that this area is not seen as having an impact
upon programming in the three districts. It appears that the leadership from the three
districts does not believe over-qualification of students for special education services to
be occurring, at least not to the point of detriment to the district or the program itself.
Without a push from the top, in-district training addressing learning disabilities
exclusionary factors is not likely to occur.

126
Those who knew their way around the intricacies of learning disabilities
eligibility criteria (primarily school psychologists) exhibited strongly developed gut
instincts regarding what was an appropriate special education referral and what was not.
Training fosters these instincts, as does experience in the field. Having been around the
block a few times with issues of appropriate eligibility seems to hone one’s skills with
identifying who has a true disability and who has deficits special education may not be
suitable to address. Education and experience assist in making decisions that may be
unpopular among a team of colleagues.
Individual ethics come into play often in special education decision-making.
While the scope of this study does not allow for the development of a model regarding
ethical influences on team decision making with regard to the exclusionary clause, a
pattern of behavior led by belief was apparent. On one end of a spectrum lie those who
believe resources should be available to the students who need them, regardless of
classification. If a student needs help, it should be offered as best it can. Individuals
holding this ethic of care tend to be the ones who see the students struggling on a regular
basis while in settings where they are expected to do the same work as their typical peers.
General education teachers typify holders of these beliefs. Many teachers appeared to
find it more appropriate to try to work around special education regulations that may
block a student’s placement than to follow a strict interpretation of the law that would
result in continued struggling for a student amongst their peers.
At the other end of the spectrum are those who believe in the allocation of
resources according to a strict, predetermined system. Resources are scarce, and therefore
need to be spent in a manner that ensures they are not used on students who do not need

127
them. Along with this belief came a sense of greater responsibility for upholding the law,
as defined by WAC and IDEA. This ethical standpoint, perhaps best defined as an ethic
of justice, seems to guide the individuals in the school psychologist role toward
conclusions heavily biased by special education law.
There are obviously many ethical stances between the two ends of the spectrum.
Additionally, the impacts of time, individual student relationships, and interpersonal
factors may lead a professional to stray from his or her typically held beliefs. Even with
this fluidity of the spectrum, participants in this study tended to have similar ethical
values as their peers holding similar positions within the school district.
Issues that cannot be addressed in a quantitative manner often fuel disagreement
between team members. As was previously discussed, most issues that could result in
special education exclusion based upon environmental, cultural, or economic
disadvantage are not easily quantifiable. Not being able to identify the factors in an easy-
to-understand way makes it a difficult situation for professionals trying to implement the
intent of the exclusionary clause. When these vague or unclear issues are regarded as
grounds for excluding a student from an assessment, frustration can develop and conflict
can arise. This frustration and/or conflict may lead to feelings of limited support from the
special education system in some teachers, which may result in a lack of future referrals.
Additionally, influential teachers appeared likely to sway the decision of the team in
instances where the school psychologist was either conflicted herself, new to the system,
or had an unassertive personality. While this study is not necessarily one that focuses on
the interplay between IEP team members during conflict, it is important to note that these
occurrences take place regularly when looking at student eligibility. The overlap between

128
the concepts of IEP team conflict dynamics and IEP team adherence to the exclusionary
clause is an important one.
District Demographics
The second research question addressed in this study inquires as to whether
demographic makeup of the student population impacts how special education teams
regard student environment, culture, and economic status. The short answer to this,
according to the data collected in this study and presented in the previous chapter, is
“yes.” Why this is so, however, is not necessarily related directly to the student factors
themselves. Rather, the impact seems more likely to stem from resources these factors
generate through programs other than special education.
Exclusion from eligibility under the learning disability category for either cultural
or economic reasons eliminates students from receiving one type of service; it opens the
door, however, to other possibilities. State and federal programs have been developed to
level the playing field for students from impoverished homes. By providing districts with
funding for academic remediation, Title I and the Learning Assistance Program (LAP)
can target those students at risk for failure due to low socio-economic status. Districts
such as Birch and, to a lesser extent, Aspen, are given significant financial allocations to
help build the reading and math skills of this portion of the student body. For Birch, the
student population eligible for these services is so high that the programs have made each
elementary building in the district a school-wide service school, meaning that all students
can reap the benefits of the services rather than targeting only those who meet the criteria.
In effect, any student struggling with math or reading can receive additional support.
Similarly, certain cultural disadvantages are addressed through other state and federal

129
programming. The monies received by districts from the Migrant, Title III, and the
Bilingual programs provide significant services to help students who qualify due to
limited English language proficiency, a minority ethnic status, and/or a transient lifestyle.
With these programs in place, districts such as Birch are not solely dependent
upon special education to provide remedial services to needy students. Depending upon
the building, Title I/LAP and Migrant/Bilingual services are frequently used as either
initial remediation resources prior to a referral to special education or as a backup in case
a student does not meet special education eligibility. With so many students eligible for
these services in high minority percentage districts, the programs are quite extensive. The
assistance they provide allows for innovative service delivery that helps keep special
education services focusing on students with disabilities.
In comparison, however, districts such as Cedar do not benefit from this type of
federal and state funding. With limited resources for Migrant and Bilingual programs, the
students who enter the district with deficits based upon culture are not likely to receive
the assistance to bring them to the academic ability level of their peers. While some
students are successful, the likelihood is limited along with the resources. Similarly, the
Title I/LAP programs are quite small, giving the students from impoverished homes little
real assistance in keeping up with the academic standard. Therefore, while the vast
majority of the student population does not require help from a program that addresses
cultural or economic disadvantage, those that do are limited in the help they can receive
by the small district allocation. Being wealthy and white has its disadvantages.
Presence or absence of these programs impact special education directly.
Generally speaking, the fewer resources a school has available to help students, the more

130
likely special education is to be called upon for assistance. The percentage of eligibility
for students may not increase dramatically in these schools, but a significantly greater
time assessing students who do not qualify is likely. The identification rate, which is
defined as the percentage of students who qualify for special education out of total
number of referrals, is likely to be much lower without other programs providing
intervention services prior to special education assessment. While on the surface having
many students assessed who do not qualify may not seem like a large impact to a school
district, the amount of time special educators put into each individual assessment is so
extensive that entire case loads can shift due to testing numbers alone. Large numbers of
assessments prevent teachers from teaching, which was a common complaint voiced by
special educators in this study.
Additional resources spent on student achievement, regardless of the source,
greatly improve the number and quality of interventions likely to keep a student out of
special education. The rules and regulations are written in a manner that expects such
resources to be available. The reality of the situation, however, is that they often are not,
and districts are required to use special education in a way that is not optimal—that of the
first stop and not the end of the intervention line.
Summary of Findings
The findings of this study can be summarized as follows:
1. The professionals interviewed and observed in this study, generally speaking, do
address the exclusionary factors of environmental, cultural, and economic disadvantage
when determining student eligibility for special education under the learning disabilities
category. The thoroughness of the investigation into these factors, however, is

131
inconsistent between individual teams, and is usually determined by the impetus the
school psychologist places upon them.
2. Team member roles are important, as are individual ethics and influence. The
school psychologist is the team leader, and the training, experience, personality, and
ethics he or she has impacts the manner in which a team conducts business. The
psychologists’ ethical persuasion is generally toward that of assisting students while
following the written letter of the law. Other influential team members, such as
positionally powerful principals or unofficially powerful but respected teachers, can also
guide the decision-making process in a way that shifts the balance of power. When a
principal or a respected teacher exerts influence, exclusionary factors are not likely to be
looked at closely, if at all.
3. Ruling out the three exclusionary factors is an extremely difficult process. In
order for school staff to gather information regarding home environment, culture, and
economics, student and family privacy rights would be challenged. The comfort level
educational professionals have in addressing these areas in an in-depth manner is quite
low. Time and resource factors impacted the ability special educators have to delve into
exclusionary factor research.
4. The state and federal law is direct in stating that a cultural, environmental, or
economic disadvantage cannot be the primary source of the student’s deficit, but it is
noticeably lacking in ways to address the issue. Other than restating the law, the
individual school districts do not guide teams in how to meet the regulatory challenge.
5. Student populations do impact how teams proceeded when looking at students for
special education, particularly with regard to additional intervention and resource

132
allocation. Districts with highly mobile, heavily minority, and low socio-economic status
families tend to receive more resources from state and federal programs for student
remedial service, and these programs are likely to be used prior to special education
referral, which decreases the amount of time spent assessing students who may have
issues special education is not meant to address.
Recommendations for Districts
While data collected in this study is obviously limited in scope to the three
districts that participated and the time frame of winter and spring of 2003, findings may
be able to be generalized to like districts experiencing similar issues. It is unlikely that
Aspen, Birch, and Cedar are alone in experiencing difficulties and inconsistencies in
addressing the state and federal learning disabilities exclusionary factors. Therefore, the
following five recommendations are not limited to the three districts discussed here, but
are meant for any district experiencing challenges in this area.
Develop Student Assistance Teams
It is imperative for districts to develop structured student assistance teams (SATs)
across all schools served by special education and/or other remedial programs. SATs
explore assistance opportunities for students prior to special education referrals, which, in
turn, streamlines referral processes. With an SAT that ensures a student has run the gamut
of pre-referral interventions, the special education team can focus on assessment and
placement decisions. An SAT should meet on a regular basis to discuss students who are
having difficulty in academic, behavioral, or social-emotional areas. Teams should be
composed of teaching staff from various grade levels, a counselor, a social worker (if
applicable), a special educator, and a representative from administration. District training

133
should be provided to all team members regarding the processes for special education
referral, eligibility requirements for special education and other district programs,
community resources, and records review processes. Pre-referral strategies and
interventions should be heavily emphasized. In order to be truly effective, the student
assistant team needs training on how to differentiate between a deficit that may be
disability-based and one that is caused by environmental, cultural, or economic deficit.
Referrals to district programs such as special education, Title I, or ESL may be initiated,
as may out-of-district family service referrals. While assisting the student is the primary
goal, the secondary benefit of streamlining the referral process helps all special programs
in the building by reducing the number of inappropriate referrals, providing valuable
information that can be used by the assessment team, and notifying the parents early in
the process that there is an issue that needs attention.
Training on Special Education Services
All educational professionals, including teachers, counselors, and paraeducators,
would benefit from training regarding special education purpose, services, and criteria.
This type of training would give all educational staff greater tools to use when
considering whether a child’s deficits fall under the special education umbrella. Many
teachers live by the credo of “when in doubt, refer,” and specific knowledge regarding
what is an appropriate referral and what is not may reduce the number of unnecessary
evaluations. The amount of time and money it would take for such large-scale training
would be more than offset by the savings in time experienced by inappropriate special
education referrals. Having building administration involved with this training serves to
increase their knowledge of appropriate referrals as well. A building principal is the last

134
evaluator of the appropriateness of a referral before it goes on to the special education
team, so that person holds a significant responsibility. There is no excuse for
administrators to be ignorant of the special education process or eligibility requirements,
as their participation is quite heavily mandated by IDEA and WAC and important for
efficient team functioning.
Develop Appropriate Procedures and Paperwork
Districts would benefit greatly from the development of appropriate procedures
and corresponding paperwork for addressing the exclusionary factors written into state
and federal law. Very strict guidelines are written into the required SLD documentation
for determining a significant difference between a student’s academic and intellectual
abilities, and like guidelines should be developed by the districts for addressing rule-out
factors. At minimum, including a checklist of activities the team has undertaken to look
into each area would give clearer indication of the actions taken. Providing minimum
steps for a team to take, such as interviewing parents, delving into student educational
records, tracking past attendance, administering language proficiency assessments, and
checking for free/reduced lunch eligibility would ensure something is taking place and
the issue is not merely being glossed over as a matter of formality. Teams would need to
document results of this investigation along with other assessment information in order to
satisfy the eligibility requirement. Periodic internal monitoring processes would shore up
this system and promote compliance.
Abide by Three-Pronged Eligibility Requirement
In order to qualify for special education under the specific learning disabilities
category, a three-pronged test must be conducted and the student must meet all three

135
guidelines. The prongs are having a documented disability, having an academic deficit,
and requiring specially designed instruction. Many teams focus their decisions entirely
upon the academic deficit portion of the requirement. If this occurs and a team disregards
other portions of the assessment data or exclusionary factors, the eligibility criterion is
systematically negated. To pick the concept of student need alone opens the doors to
many children who could benefit from the individualized instruction special education
has to offer. While providing this type of service to all needy students would be great, it
is not economically feasible under the current system. To maintain the integrity of the
service developed decades ago to assist needy students with disabilities, the door has to
close somewhere. The three-pronged test allows that to happen. Ensuring that this is
happening at a building level is a necessary project for administration to undertake in
order to make sure only those who truly qualify for services are being served. There is
too much at stake financially to not take steps.
Increase Early Childhood Intervention
Districts need to enhance early childhood intervention. Extensive research has
shown that early intervention is effective in promoting future academic success, and
when districts face significant challenges from students entering the school system with
little or no background in learning, the entire system has to slow down and let them catch
up. Special education is faced with the challenge of not being able to meet the needs of
kids with certain home-based issues, but no one questions that the need for help is there.
With early intervention, targeted preschool students could receive the pre-academic
assistance that promotes success in school. As this training would often mirror that
provided in homes of families with greater resources, the gap between kids entering the

136
districts’ early grades would hopefully be diminished. Early identification of deficits
could then focus upon disabilities and not achievement gaps. In turn, special education
referrals would have a greater likelihood of appropriateness.
Recommendations for Further Research
There appears to be a significant gap in the research literature regarding
methodologies for addressing exclusionary criteria by special education teams. Further
research focusing on school districts in Washington would help shed light upon how
WAC learning disabilities criteria are being interpreted and implemented. Additionally,
as state regulations are based upon interpretation of the federal IDEA, research detailing
the practical differences in state regulations may provide valuable data for those who are
struggling with effective implementation. Information from within each state, as well as
information comparing the language, interpretation, and implementation between states
would help clarify a muddy picture. As thorough understanding of the actions and
thought processes of individual educators provide valuable data for this topic, qualitative
methodologies could be effectively used.
Additionally, continuing to add to the body of research regarding individual ethics
would add to the understanding of special education team processes. Researching
individual ethics, particularly as they pertain to making difficult qualification decisions,
may shed light on the philosophical basis for the stances individuals take. As people enter
special education team situations with varying backgrounds, positions, and ethical
persuasions, understanding the interplay of these factors would help to shed light upon
complex and important educational proceedings.

137
Finally, more research is necessary to investigate the impact of individual roles on
special education proceedings. This study discovered a strong importance placed upon
the role individuals held within their special education team. Research on a larger scale
into the impact of team member role influence would be of great value to special
education administration.

138
References
Artiles, A. J., Aguirre-Munoz, Z., & Abedi, J. (1998). Predicting placement in
learning disabilities programs: Do predictors vary by ethnic group? Exceptional Children,
64, 543-559.
Audette, B., & Algozzine, B. (1992). Free and appropriate education for all
students: Total quality and the transformation of American public education. Remedial
and Special Education, 13, 8-18.
Audette, B., & Algozzine, B. (1997). Re-inventing government? Let’s re-invent
special education. Journal of Learning Disabilities, 30, 378-383.
Bocian, K. M., Beebe, M. E., MacMillan, D. L., & Gresham, F. M. (1999).
Competing paradigms in learning disabilities classification by schools and the variations
in the meaning of discrepant achievement. Learning Disabilities Research and Practice,
14, 1-14.
Bogdan, R. C., & Biklin, S. K. (1998). Qualitative research in education- An
introduction to theory and methods (3rd ed.). Boston: Allyn and Bacon.
Chambers, J. G. (1999). The patterns of expenditures on students with disabilities:
A methodological and empirical analysis. In T. B. Parrish, J. G. Chambers, & C. M.
Guarino (Eds.), Funding Special Education (pp. 89-123). Thousand Oaks, CA: Corwin
Press.
Coutinho, M. J., Oswald, D. P., & Best, A. M. (2002). The influences of
sociodemographics and gender on the disproportionate identification of minority students
as having learning disabilities. Remedial and Special Education, 23, 49-59.
139
Colarusso, R. P., Keel, M. C., & Dangel, H. L. (2001). A comparison of eligibility
criteria and their impact on minority representation in LD programs. Learning
Disabilities Research, 16, 1-7.
Friend, M., & Bursuck, W. D. (1999). Including students with special needs: A
practical guide for classroom teachers (2nd ed.). Boston: Allyn & Bacon.
Gresham, F. M., MacMillan, D. L., & Bocian, K. M. (1998). Agreement between
school study team decisions and authoritative definitions in classification of students at-
risk for mild disabilities. School Psychology Quarterly, 13, 181-191.
Guckenberger et al. v. Trustees of Boston University et al., 974-F. Supp. 106 (D
Mass. 1996).
Joos, M. (1967). The styles of the five clocks. In Abrahams, R. D., & Troike, R.
C. (Eds.). Language and Cultural Diversity in American Education. Englewood Cliffs,
NJ: Prentice-Hall, Inc.
Hallahan, D. P., & Kauffman, J. M. (2000). Exceptional leaders: Introduction to
special education (8th ed.). Boston: Allyn & Bacon.
Hoffman, L. (2000). Overview of public elementary and secondary schools and
districts: school year 1998-1999 (NCES 2000-333 [Revised]).
Individuals with Disabilities Act Amendments of 1997, P.L. 105-17, 105th
Congress, 1st Session.
Larry P. v. Riles. Civil Action No. 71-2270 (N. D. Cal 1971). 495 Suppl 926 (N.
D. Cal. 1979), Decision on Merits, United States Court of Appeals, Ninth Circuit, No. 80-
427, January 23, 1984, Trial Court Decision Affirmed.
140
LeCompte, M. & Goetz, J. (1982). Problems in reliability and validity in
ethnographic research. Review of Educational Research, 52, 31-60.
Lopez, M. F., Forness, S. R., MacMillan, D. L., Bocian, K. M., & Gresham, F. M.
(1996). Children with Attention Deficit Hyperactivity Disorder and emotional or
behavioral disorders in primary grades: Inappropriate placement in the learning disability
category. Education and Treatment of Children, 19, 286-299.
MacMillan, D. L., & Forness, S. R. (1998). The role of IQ in special education
placement decisions: Primary and determinative or peripheral and inconsequential?
Remedial and Special Education, 19, 239-253.
MacMillan, D. L., & Reschly, D. J. (1998). Overrepresentation of minority
students: The case for greater specificity or reconsideration of the variables examined.
The Journal of Special Education, 32, 15-24.
Matz, G. D. (1997). The state education agencies’ definitions and qualifying
criteria for special education categories: A qualitative study. Unpublished doctoral
dissertation, Washington State University, Pullman.
Maxwell, J. A. (1996). Qualitative research design- An interactive approach.
Sage Publications: Thousand Oaks, CA.
Meredith, B., & Underwood, J. (1995). Irreconcilable differences? Defining the
rising conflict between regular and special education. Journal of Law & Education, 24,
195-226.
Mills v. Board of Education of District of Columbia, 348 F.Supp.866 (D.D.C.
1972).

141
Molnar, A. (1995). School funding: The right issue, the wrong logic. Educational
Leadership, 53, 58-59.
Montano-Harmon, M. R. (1991). Discourse features of written Mexican Spanish:
Current research in contractive rhetoric and its implications. Hispania, 74, 417-425.
No Child Left Behind Act of 2001, P.L. 107-110, 107th Congress, 1st Session.
Ochoa, S. H., Rivera, B. D., & Powell, M. P. (1997). Factors used to comply with
the exclusionary clause with bilingual and limited-English- proficient pupils: initial
guidelines. Learning Disabilities Research and Practice, 12, 161-167.
Payne, R. K. (1998). A framework for understanding poverty. Baytown, TX: RFT
Publishing.
Pennsylvania Association for Retarded Children v. Commonwealth, 334 F.Supp.
1257 (E.D.Pa.1971), 343 F.Supp. 279 (E.D.Pa.1972).
Section 504 of the Rehabilitation Act, 29 U. S. C. § 794 (1973).
Starratt, R. J. (1994). Building an ethical school : a practical response to the
moral crisis in schools. Washington DC: Falmer Press.
State of Washington Joint Legislative Audit and Review Committee. K-12 Special
Education Study First Interim Report (Report 00-6), October 2000.
State of Washington Superintendent of Public Instruction. (September 16, 2004).
2004-2005 Special Education Excess Cost Allocation for 9/29/04 (Report 1220).
Retrieved October 1, 2004 from http://www.k12.wa.us/safs/rep/app/0405/00000mb.txt.
Title I of the Elementary and Secondary Education Act, 20 U.S.C. § 6301 et seq.
(1965).

142
Tucker, J. A., & Champagne, J. F. (1996). Where’s the war? A response to
Meredith and Underwood. Journal of Law & Education, 25, 447-452.
U. S. Department of Education (2000). To assure the free appropriate public
education of all children with disabilities: Twenty-second annual report to congress on
the implementation of the Individuals with Disabilities Education Act.
U. S. Department of Labor (2000). Psychologists. In Occupational Outlook
Handbook [On-Line]. Available: http://stats.bls.gov/oco/ocos056.htm.
U.S. Office of Education (1997). Assistance to states for education of
handicapped children: Procedures for evaluating specific learning disabilities. Federal
Register, 42, 65083.
Verstgegen, D. A. (1999). Trends and new developments in special education
litigation. In T. B. Parrish, J. G. Chambers, & C. M. Guarino (Eds.), Funding Special
Education (pp. 230-258). Thousand Oaks, CA: Corwin Press.
Washington Administrative Code, (2000). Rules for the Provision of Special
Education to Special Education Students- Section 392-172 WAC. Olympia, WA
Washington State Department of Public Instruction Education Profiles website,
http://www.k12.wa.us/edprofile/, accessed 11/19/2002.
Weiss, R. S. (1994). Learning from strangers: The art and method of qualitative
interview studies. New York: The Free Press.
Williams, W. M., & Ceci, S. J. (1997). Are Americans more or less alike? Trends
in race, class, and ability differences in intelligence. American Psychologist, 52, 1226-
1235.

143
Worth, R. (1999, June). The scandal of special education. The Washington
Monthly, 31, 34-38.
Ysseldyke, J. E., Vanderwood, M. L., & Shriner, J. (1997). Changes over the past
decade in special education referral to placement probability: An incredibly reliable
practice. Diagnostique, 23, 193-201.

144
Appendix A
Interview Participants
Name District Position Level Experience (years)
Mr. C. W. Aspen School Psychologist K-8 4 Ms. K. A. Aspen School Psychologist K-8 13 Ms. S. J. Aspen School Psychologist Elem. 7 Ms. R. J. Aspen School Psychologist K-8 7 Mr. C. S. Aspen School Psychologist Elem. 8 Ms. S. M. Aspen School Psychologist HS 10 Ms. S. R. Aspen Special Education Teacher Elem. 11 Ms. J. M. Aspen Special Education Teacher Elem. 7 Ms. P. H. Aspen Special Education Teacher Elem. 18 Ms. L. W. Aspen General Education Teacher Elem. 20 Ms. L. L. Birch School Psychologist K-12 2 Mr. J. W. Birch School Psychologist Pre-5 7 Dr. G. M. Birch School Psychologist K-8 12 Mr. D. F. Birch School Psychologist Elem. 1 Ms. B. T. Birch School Psychologist HS 6 Ms. L. F. Birch School Psychologist Elem. 3 Ms. K. W. Birch Special Education Teacher Elem. 12 Ms. M. H. Birch Special Education Teacher Elem. 13 Ms. K. S. Birch Special Education Teacher Elem. 12 Ms. B. F. Birch General Education Teacher Elem. 19 Mr. D. A. Cedar School Psychologist K-12 25 Ms. K. F. Cedar School Psychologist K-12 1 Ms. S. B. Cedar School Psychologist Elem. 5 Ms. H. S. Cedar School Psychologist Elem. 8 Ms. D. G. Cedar School Psychologist MS 3 Ms. A. C. Cedar School Psychologist HS 7 Ms. M. K. Cedar Special Education Teacher Elem. 10 Ms. R. E. Cedar Special Education Teacher Elem. 7 Ms. J. G. Cedar Special Education Teacher Elem. 15 Ms. S. O. Cedar General Education Teacher Elem. 13

145
Appendix B
Interview Guide
What is your position within the school, and how does that position relate to your role as a member of the special education team? What is your level of comfort with special education law? What is your approach to qualification meetings? What role does special education play in assisting the students of your school to learn? What is the function of special education within your school? How much influence do you personally have on the special education team’s decision-making process? What factors do you consider when determining whether a student should be considered “learning disabled?” How closely does your special education team look at a student’s history when determining whether he/she qualifies for services? What steps are taken to make sure only disabled students receive special education services? What factors may prevent a student from entering special education? How does socio-economic status of a student impact their likelihood of entering special education? How does English language ability of a student impact their likelihood of entering special education?

146
Appendix C
Aspen School District Special Services Department
Referral Meeting Worksheet Staffing Date: Name Birthdate School Grade Surrogate Needed: Yes No 1. REVIEW OF EDUCATIONAL RECORDS AND CURRENT EDUCATIONAL
PERFORMANCE: (classroom, observation, parent input)
2. REVIEW OF BEHAVIOR/DISCIPLINE/ATTENDANCE: 3. PHYSICAL INFORMATION:
Vision: Hearing:
4. SPEECH/LANGUAGE/AUDITORY: 5. RESOURCES ALREADY PROVIDED, ALTERNATIVES TRIED: RECOMMENDATIONS: 1. Student is in need of further evaluation in the following areas: 2. Evaluation is not indicated at this time: TEAM MEMBER/POSITION TEAM MEMBER/POSITION
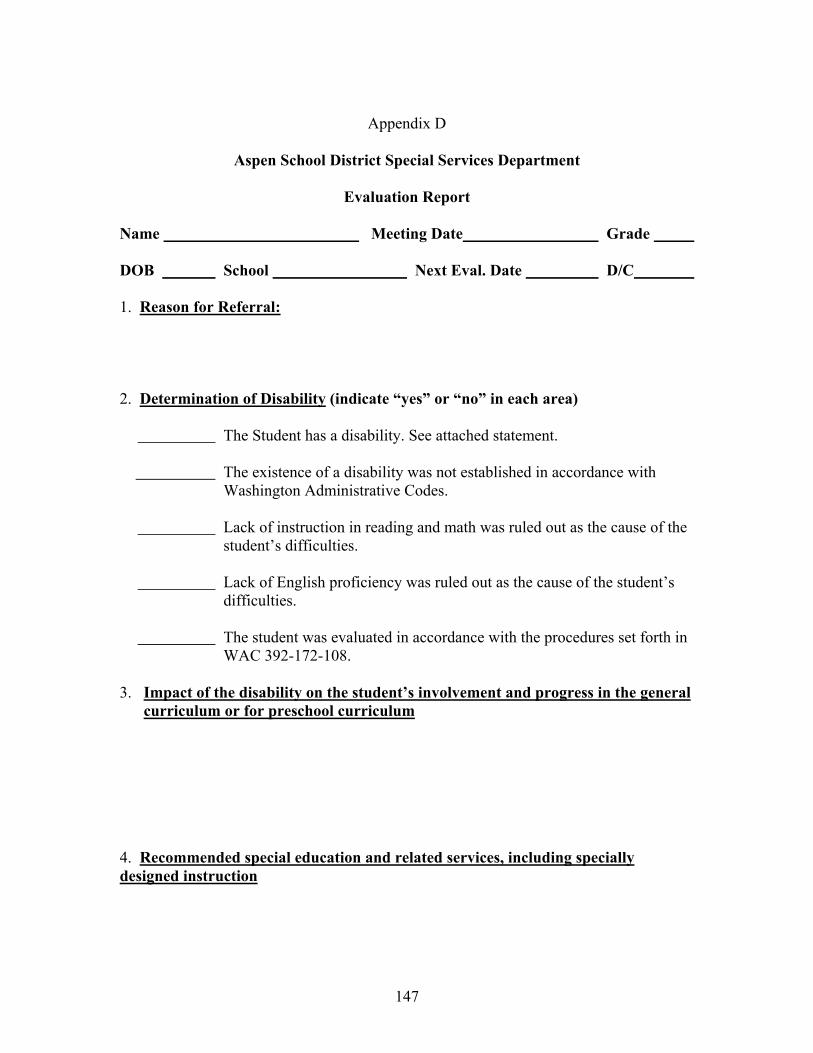
147
Appendix D
Aspen School District Special Services Department
Evaluation Report Name Meeting Date Grade DOB School Next Eval. Date D/C 1. Reason for Referral: 2. Determination of Disability (indicate “yes” or “no” in each area) The Student has a disability. See attached statement. The existence of a disability was not established in accordance with Washington Administrative Codes.
Lack of instruction in reading and math was ruled out as the cause of the student’s difficulties. Lack of English proficiency was ruled out as the cause of the student’s difficulties. The student was evaluated in accordance with the procedures set forth in WAC 392-172-108. 3. Impact of the disability on the student’s involvement and progress in the general
curriculum or for preschool curriculum 4. Recommended special education and related services, including specially designed instruction

148
5. Other information needed to develop the student’s IEP, including input from parents 6. Adherence to evaluation procedures 7. Attachments Professional Evaluations
Eligibility statement Psychological Medical Professional judgment statement Behavioral Observation
Audiological Academic Speech/Language Vision Nursing OT/PT Other
IEP Team Members: Name/Title Agree Disagree Date Name/Title Agree Disagree Date Name/Title Agree Disagree Date Name/Title Agree Disagree Date Name/Title Agree Disagree Date Name/Title Agree Disagree Date Name/Title Agree Disagree Date Name/Title Agree Disagree Date (original in special education master file; one copy to parent, teacher, and special education office)

149
Appendix E
Specific Learning Disability Eligibility Statement The Individualized Education Program Team determined that meets eligibility criteria as a student with a Specific Learning Disability (SLD), and is in need of special education and related services in the areas of: . The basis for making this determination is as follows: 1. The student has been provided with learning experiences appropriate for his/her age and ability levels,
but does not achieve commensurate with his/her age and ability levels in one or more of the areas listed below in 2.
2. Documentation of the existence of a severe discrepancy between achievement and intellectual ability
that is not correctable without special education and related services is: ___ addressed in the attached professional judgment statement and/or as indicated by a checkmark
Achieved Criterion Check those that meet criteria: Standard Score Standard Score
Basic reading skill Reading comprehension Mathematics calculations Mathematics reasoning Written expression Listening comprehension Oral expression See professional judgment statement
3. The severe discrepancy between ability and achievement is not primarily the result of (All must apply or
be addressed in the attached professional judgement statement): • A visual, hearing, or motor impairment; • Mental retardation; • Emotional/ behavioral disability; or • Environmental, cultural, or economic disadvantage 4. At least one team member other than the student’s general education teacher has observed the
student’s academic performance in the general classroom setting, and has documented the relationship of that behavior to the students academic functioning. See attached report.
5. In the case of a student of less than school age or out of school, a team member has observed the
student in an environment appropriate for a student of this age, and has documented the relationship of that behavior to the students academic functioning. See attached report.
6. Written documentation that the student has an academic achievement problem in the general education
program is included as a part of this evaluation; the following data were used:
Check at least one: ___ Student performance on daily classroom work and/or criterion referenced tests, as documented in . ___ Summary of past student performance, as documented in . ___ Group test results, as documented in . ___ Teacher observation and judgments, as documented in . ___ Performance on state established standards, as documented in .
7. Tests used to assess the student’s intellectual ability and academic achievement are (All must apply) or
be addressed in the attached professional judgment statement): • Reliable as demonstrated by a reliability coefficient of .85 or above; • Normed on representative national samples; • Selected and administered is accordance with the general requirements of WAC 392-172-108; and

150
• Individually administered and interpreted by a qualified person (defined in WAC 392-172-108) in accordance with the standardized procedures described in the test manuals.
8. Any medically relevant findings:
___ N/A ___ are addressed in the attached professional judgment statement. ___ are documented in the report. ___ are documented as follows: .