special effects materials
TRANSCRIPT

Science – Year 5/6B Autumn 1
Properties and Changes of Materials
Special Effects Materials
Session 2
Resource Pack
© Original resource copyright Hamilton Trust, who give permission for it to be adapted as wished by individual users. We refer you to our warning, at the foot of the block overview, about links to other websites.
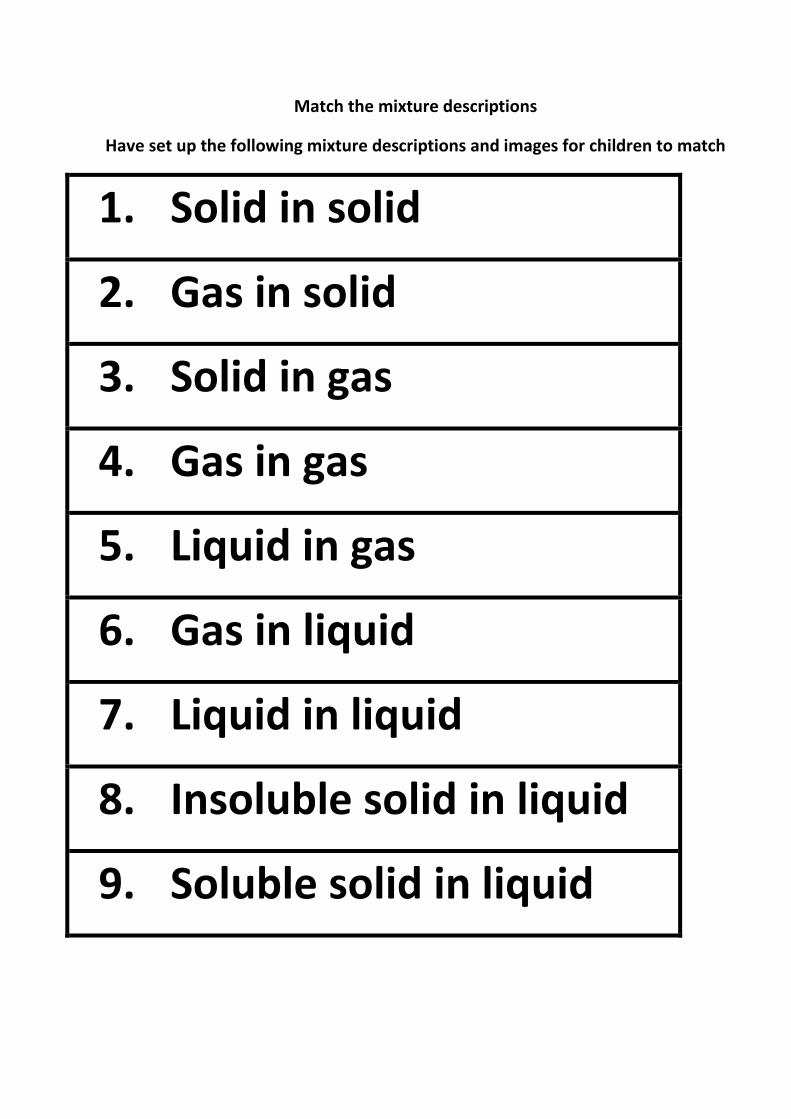
Match the mixture descriptions
Have set up the following mixture descriptions and images for children to match
1. Solid in solid
2. Gas in solid
3. Solid in gas
4. Gas in gas
5. Liquid in gas
6. Gas in liquid
7. Liquid in liquid
8. Insoluble solid in liquid
9. Soluble solid in liquid
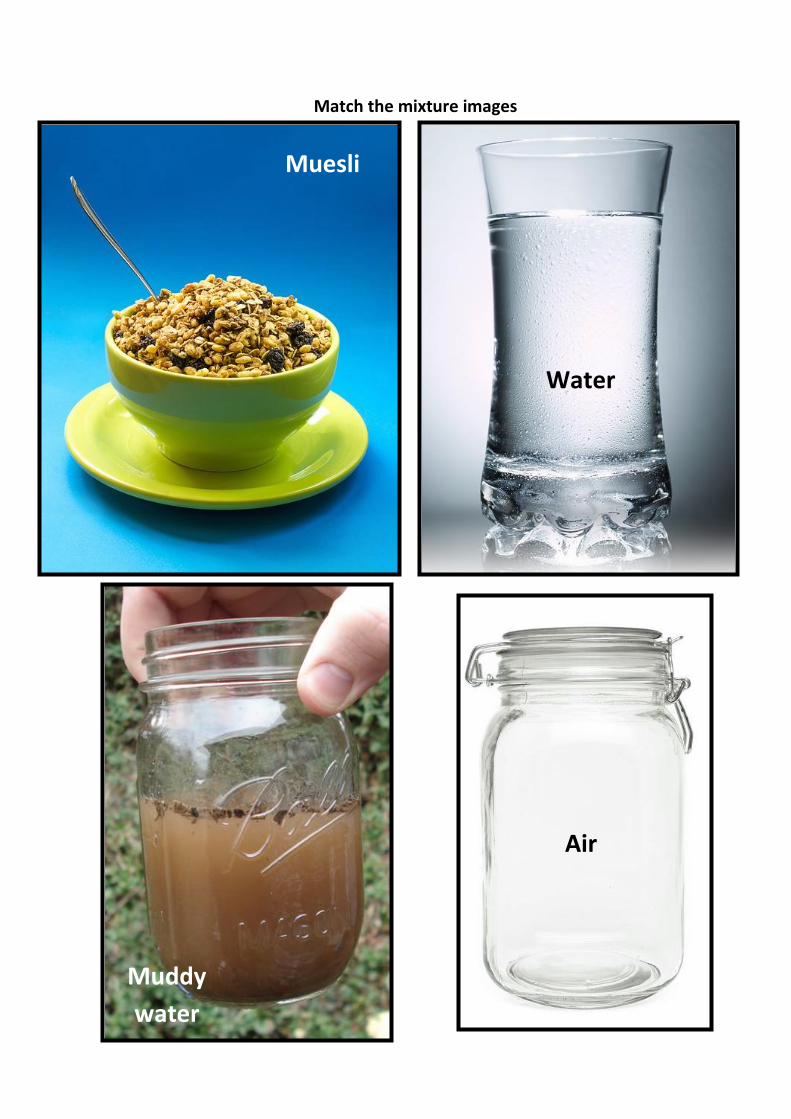
Match the mixture images
Muesli
Water
Air
Muddy
water

Milk
Clouds
Sugar dissolved in
water
Smoke
Pumice
stone

Mixture match (teacher reference)
Solid in solid (muesli)
Gas in solid (pumice stone)
Solid in gas (smoke)
Gas in gas (air)
Liquid in gas (clouds)
Gas in liquid (oxygen in water)
Liquid in liquid (emulsion – milk)
Insoluble solid in liquid (suspension – muddy water)
Soluble solid in liquid (solution – salt water)

Sugar investigations
Sugar investigation (Y5)
Highlight which enquiry question you are exploring:
What happens when I put a range of different solids into a liquid?
What happens to solubility when the temperature of the liquid changes?
Does ‘x’ solute dissolve in multiple solvents?
Do different forms of the same solute dissolve differently in a solvent?
Can you suggest more specific enquiry questions?
Equipment available: Caster sugar; granulated sugar; icing sugar Water Beakers Glass rods or old spoons for stirring Thermometers Scales or measuring spoons/cups Vegetable oil, lemonade
Basic guidance: Explore the sticky-note approach to investigations with your teacher and set up an investigation by filling beakers with a given amount of water in each. Put a teaspoon of each sugar form into a beaker at a time, stir and note what happens. Does the icing sugar dissolve? What has it formed? How many teaspoons for each sugar form can you stir in before it reaches its saturation point? Identify the ‘best’ sugar then test it with other liquids, offering explanations for observations. Ensure children repeat experiments to ensure their results are accurate and trustworthy. Record your findings in the table given and choose a graph form to present your data.
Further investigation: Repeat with the ‘best’ liquid at varying temperatures.

Sugar investigation (Y6)
Can you suggest and overarching enquiry question and some more specific ones?
Equipment available: Caster sugar; Granulated sugar; Icing sugar Water Beakers Glass rods or old spoons for stirring Thermometers Scales or measuring spoons/cups Vegetable oil, lemonade
Basic guidance: Have beakers with water in each and explore how different forms of sugar dissolve and the amount that can be dissolved before reaching a saturation point. Do all of the sugars dissolve? If not what has formed? Identify the ‘best’ sugar then test it with other liquids, identifying reasons for your observations. How can you ensure that your results are accurate and trustworthy? Record your findings. Use the sticky-note approach to investigating to plan and carry out your investigation.
Further investigation: What happens if the temperature of the ‘best’ liquid is changed?
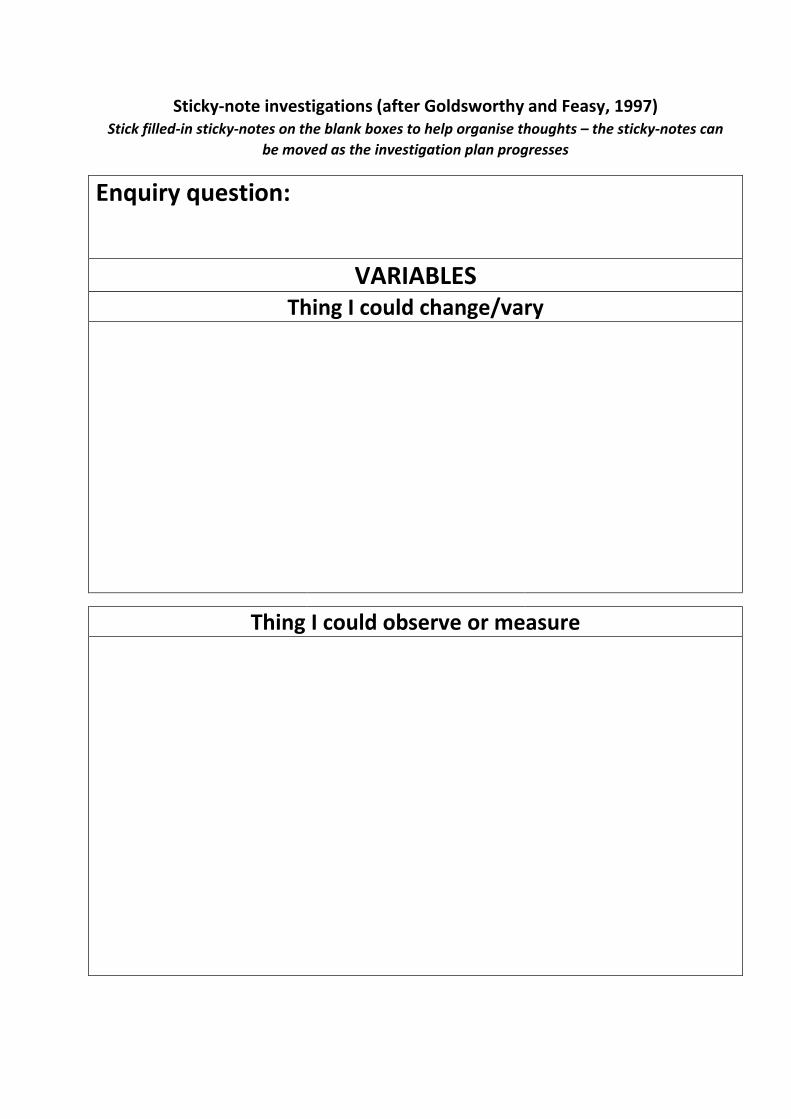
Sticky-note investigations (after Goldsworthy and Feasy, 1997) Stick filled-in sticky-notes on the blank boxes to help organise thoughts – the sticky-notes can
be moved as the investigation plan progresses
Enquiry question:
VARIABLES Thing I could change/vary
Thing I could observe or measure

Ensuring my test is fair I will change
I will observe
I will keep these things the same

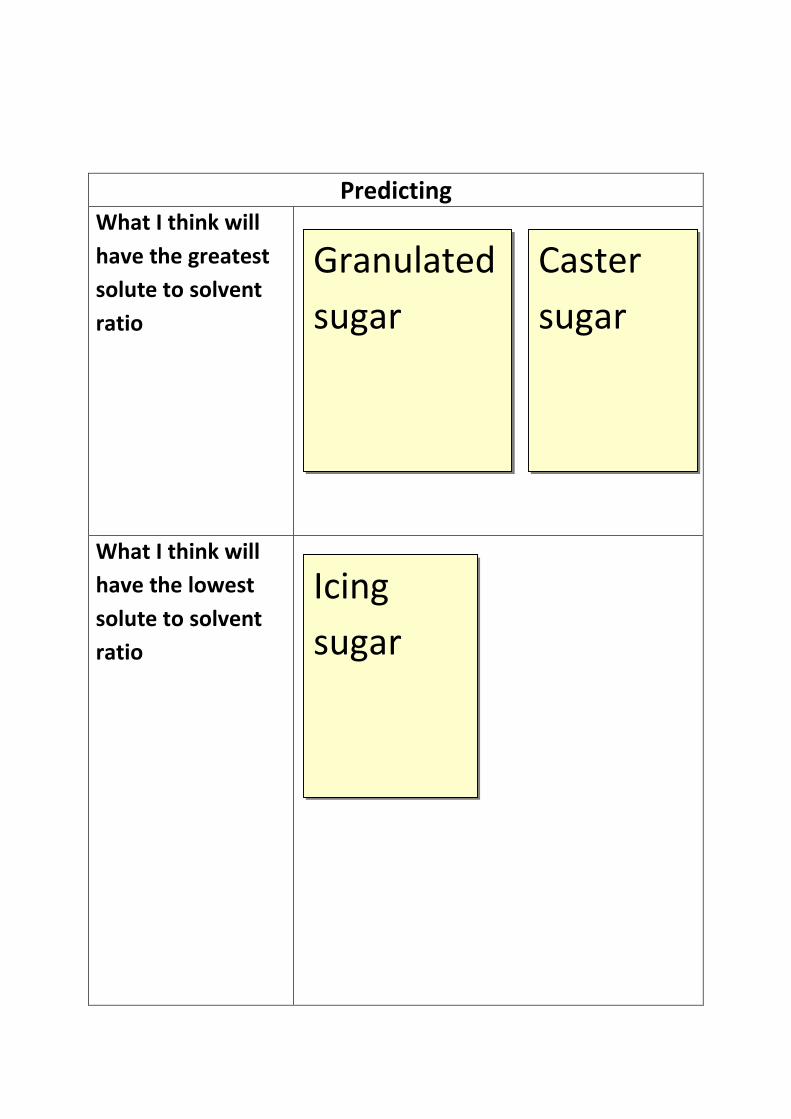
Predicting What I think will
have the greatest
solute to solvent
ratio
What I think will
have the lowest
solute to solvent
ratio

Results and patterns Solute/solvent What I observed
Results and patterns Solute/solvent What I observed

Sticky-note investigation example
(N.B. this is an example, not a competed investigation)
Enquiry question:
How many teaspoons of a given sugar form can be
dissolved in a given volume of water?
VARIABLES Thing I could change/vary
Thing I could observe or measure
The form of
sugar
How many
teaspoons
dissolve before
saturation

Ensuring my test is fair I will change
I will observe
I will keep these things the same
The forms of
sugar
The amount of
sugar that
dissolves
The
volume of
water
The spoon
used for
measuring
Predicting What I think will
have the greatest
solute to solvent
ratio
What I think will
have the lowest
solute to solvent
ratio
Granulated
sugar
Caster
sugar
Icing
sugar
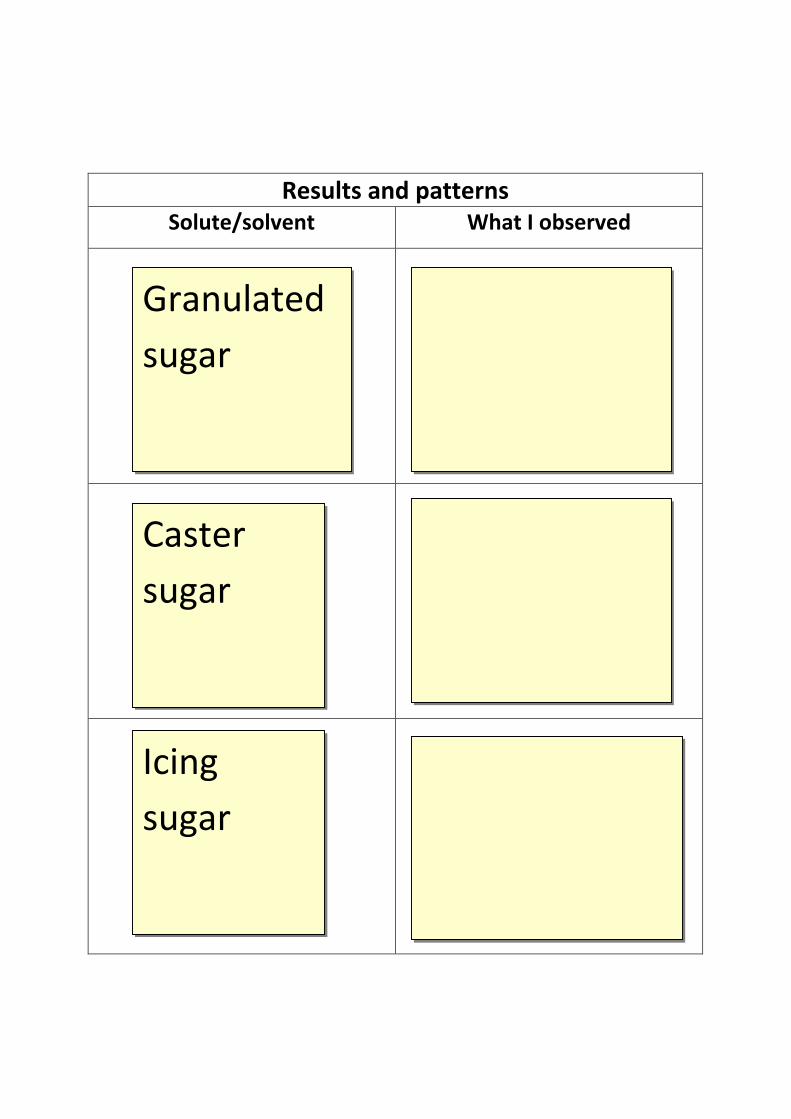
Results and patterns Solute/solvent What I observed
Granulated
sugar
Caster
sugar
Icing
sugar
Results and patterns Material What I observed
Recommendations
(based on solubility)

Results sheet
Temperature of water
Amount of solute (in teaspoons)
Maximum amount of solute that will dissolve in _______ml of water
Icing
Caster
Granulated
Liquid Amount of solute (in teaspoons)

Graphing options
Bar graphs: show numbers that are independent of each other (e.g. the weight of
various rocks).
Pie charts: show you how a whole is divided up (e.g. the proportion of types of
material that are recycled).
Line graphs: show you how something changes over time (e.g. change in
temperature over 24 hours).
Scatter graph: compares two sets of data that are likely to have an impact on
one another (e.g. speed against time).

Diagrams (Y5)
Discuss the following diagrams and note what is happening in each
Can you draw a series of diagrams that show the amount of each sugar form in
water and the impact of temperature?

Diagrams (Y6)
Discuss the following diagram and note what is happening in each.
Can you draw a series of diagrams that show the amount of each sugar form in
water and the impact of temperature?
Can you draw a diagram that shows what happened when the sugar was mixed with
vegetable oil and lemonade?
PMI Ask children to identify positives, minuses and interesting points about the following:
The saturation point of
sugar becomes 1
teaspoon to 1 litre of
water
Sugar will not dissolve in
water
Make your own sugar crystals
Have a go at making your own sugar crystals and bring in your results to share
Ingredients:
1 cup water
3 cups sugar
Pan for boiling water and making solution
Spoon for stirring
Food colouring
Clean glass jar
Pencil or butter knife
String
Kitchen towel
What to do:
1. Tie the string to your pencil or butter knife. The string should be able to hanginto your jar without touching the bottom or sides.
2. Get an adult to help you boil the water in the pan and stir the sugar ingradually making sure that while you have a lot of solute, the solution is notsaturated as your sugar crystals will form on the undissolved sugar ratherthan your string.
3. Add a few drops of food colouring and carefully pour the solution into yourjar.
4. Balance the pencil or table knife (with the string tied to it) on the lip of the jarand let the string dangle into the solution, but not so that it reaches thebottom or sides.
5. Cover your jar with kitchen towel to prevent dust getting in and leave it in asafe place. Check your crystals after a few days and keep checking until theyare fully formed.
6. Record your experiment in photographs and and see if you can describe whathas happened.
http://www.wikihow.com/Make-Edible-Sugar-Crystals

Glossary
Chn – children
Gp/s – group/s
BFI – British Film Institute