special eurobarometer 413 - ec.europa.euec.europa.eu/commfrontoffice/publicopinion/... · the...
TRANSCRIPT

Special Eurobarometer 413
FUTURE OF EUROPE
REPORT
Fieldwork: January 2014
Publication: March 2014
This survey has been requested by the European Commission, Directorate-General for
Communication and co-ordinated by the Directorate-General for Communication
(DG COMM “Strategy, Corporate Communication Actions and Eurobarometer” Unit).
http://ec.europa.eu/public_opinion/index_en.htm
This document does not represent the point of view of the European Commission.
The interpretations and opinions contained in it are solely those of the authors.
Special Eurobarometer 413 / Wave EB81.1 – TNS Opinion & Social
Special Eurobarometer 413
Future of Europe
Conducted by TNS Opinion & Social at the request of the
Directorate-General for Communication
Survey co-ordinated by the Directorate-General for Communication
(DG COMM “Strategy, Corporate Communication Actions and Eurobarometer” Unit)
Project number 2014.3434
Project title Special Eurobarometer 413 “Future of Europe”
Linguistic Version EN
Catalogue Number NA-04-14-342-EN-N
ISBN 978-92-79-36969-8
DOI 10.2775/33476

SPECIAL EUROBAROMETER 413 “Future of Europe”
1
TABLE OF CONTENTS
INTRODUCTION...............................................................................................2
MAIN FINDINGS ..............................................................................................4
1. THE EUROPEAN UNION IN 2014 ..............................................................5
1.1. The EU’s main assets ........................................................................5
1.2. The EU’s main challenges ..................................................................9
2. THE FUTURE OF EUROPE: GENERATIONS AND GEOPOLITICS .................. 13
2.1. Prospects for young Europeans ....................................................... 13
2.2. The EU’s influence on the world stage ............................................. 17
3. TOWARDS 2020: PRIORITIES AND PREFERENCES .................................. 20
3.1. Where should the emphasis lie? ...................................................... 20
3.2. More or less European decision-making? ......................................... 24
3.3. Views on further European integration ............................................ 27
CONCLUSIONS............................................................................................... 32
ANNEXES
Technical specifications
Questionnaire
Tables
SPECIAL EUROBAROMETER 413 “Future of Europe”
2
INTRODUCTION
This is the fifth report in the “Future of Europe” series, following previous surveys in
20061, 20092, 20113 and 20124. It presents a snapshot of the way Europeans perceived
the EU and its future direction in early 2014.
The first chapter focuses on the EU’s present circumstances, with respondents identifying
the EU’s main assets and the main challenges it currently faces.
The second chapter looks ahead to the end of this decade, asking respondents whether
children in today’s EU can expect an easier or more difficult life than people from their
own generation, and whether the EU is likely to be more or less influential than other
world powers in 2020.
In the third and final chapter, the focus shifts towards planning for the Europe of 2020.
Respondents say where they think the policy-making emphasis should lie, and whether
there should be more or less decision-making at EU level in certain key policy domains.
Lastly, they say whether they support or oppose further European integration in three
specific areas.
This survey was carried out by TNS Opinion & Social network in the 28 Member States of
the European Union between 18 and 27 January 2014. Some 27,739 respondents from
different social and demographic groups were interviewed face-to-face at home in their
mother tongue on behalf of the Directorate-General for Communication.
The methodology used is that of Eurobarometer surveys as carried out by the
Directorate-General for Communication (“Strategy, Corporate Communication Actions
and Eurobarometer” Unit)5.
A technical note on the manner in which interviews were conducted by the Institutes
within the TNS Opinion & Social network is appended as an annex to this report. Also
included are the interview methods and confidence intervals6.
1 http://ec.europa.eu/public_opinion/archives/ebs/ebs_251_en.pdf 2 http://ec.europa.eu/public_opinion/archives/eb/eb71/eb713_future_europe.pdf 3 http://ec.europa.eu/public_opinion/archives/ebs/ebs_379_en.pdf 4 http://ec.europa.eu/public_opinion/archives/ebs/ebs_394_en.pdf 5 http://ec.europa.eu/public_opinion/index_en.htm 6 The results tables are included in the annex. It should be noted that the total of the percentages in the
tables of this report may exceed 100% when the respondent has the possibility of giving several answers to the question.
SPECIAL EUROBAROMETER 413 “Future of Europe”
3
Note: In this report, countries are referred to by their official abbreviation. The
abbreviations used in this report correspond to:
ABBREVIATIONS BE Belgium LT Lithuania BG Bulgaria LU Luxembourg CZ Czech Republic HU Hungary DK Denmark MT Malta DE Germany NL The Netherlands EE Estonia AT Austria EL Greece PL Poland ES Spain PT Portugal FR France RO Romania HR Croatia SI Slovenia IE Ireland SK Slovakia IT Italy FI Finland CY Republic of Cyprus* SE Sweden LV Latvia UK The United Kingdom EU28 European Union – 28 Member States
EURO AREA
BE, FR, IT, LU, DE, AT, ES, PT, IE, NL, FI, EL, EE, SI, CY,
MT, SK, LV
NON-EURO AREA
BG, CZ, DK, LT, HU, PL, RO, SE, UK, HR
* Cyprus as a whole is one of the 28 European Union Member States. However, the ‘acquis communautaire’ has
been suspended in the part of the country which is not controlled by the government of the Republic of Cyprus.
For practical reasons, only the interviews carried out in the part of the country controlled by the government of
the Republic of Cyprus are included in the ‘CY’ category and in the EU28 average.
* * * * *
We wish to thank the people throughout the European Union
who have given their time to take part in this survey.
Without their active participation, this study would not have been possible.
SPECIAL EUROBAROMETER 413 “Future of Europe”
4
MAIN FINDINGS
The European Union in 2014
The EU’s economic, industrial and trading power is seen as its biggest asset by a
fifth of Europeans (19%), followed by its respect for democracy, human rights and
the rule of law (17%).
Around one person in seven thinks that the standard of living of EU citizens (14%)
or the good relationship between Member States (13%) is the EU’s biggest asset.
In 15 Member States, the EU’s economic, industrial and trading power is
mentioned most often by respondents as one of its two main assets. The EU’s
respect for democracy, human rights and the rule of law is mentioned most often
in six countries.
Unemployment is regarded as the EU’s main challenge, with more than half of
respondents (53%) placing this among its top two challenges. Around three in ten
respondents rank social inequalities (32%) and the public debt of EU Member
States (29%) as one of the two main challenges facing the EU.
The future of Europe: generations and geopolitics
There has been an increase since 2012 in the proportion of people who expect the
life of today's children to be easier (22% vs. 15% in 2012), while fewer expect it
to be more difficult (56% vs. 64% in 2012).
A majority of respondents think the overall influence of the EU will be greater than
that of Brazil, India, Russia and Japan in 2020. However, most think its influence
will be weaker than that of China and the United States.
Towards 2020: priorities and preferences
To face major global challenges, nearly half of respondents (49%) think society
should focus on social equality and solidarity, up from 43% who said this in 2012.
There is also strong support for emphasis on progress and innovation (34%) and
protecting the environment (31%).
A majority of people still support more EU-level decision-making in a range of
policy areas such as protecting the environment and tackling unemployment .
A narrow majority of people (47% vs. 43%) back the idea of a “two-speed
Europe” that would enable some countries to intensify the development of a
common European policy in certain important areas without having to wait for all
the other Member States to be ready.
There is strong support (69% of respondents) for the President of the European
Commission being elected directly by EU citizens.
A majority of people support the designation of an EU justice minister, with 58%
of respondents in favour of this idea.
However, Europeans are divided about the creation of an EU army (46% in
favour, 47% opposed).
SPECIAL EUROBAROMETER 413 “Future of Europe”
5
1. THE EUROPEAN UNION IN 2014
The focus of this opening chapter is on perceptions of the European Union, both in terms
of its current strengths and also the main challenges it faces.
1.1. The EU’s main assets
– The EU’s economic and trading power is seen as its main asset, followed by its
respect for democracy and human rights –
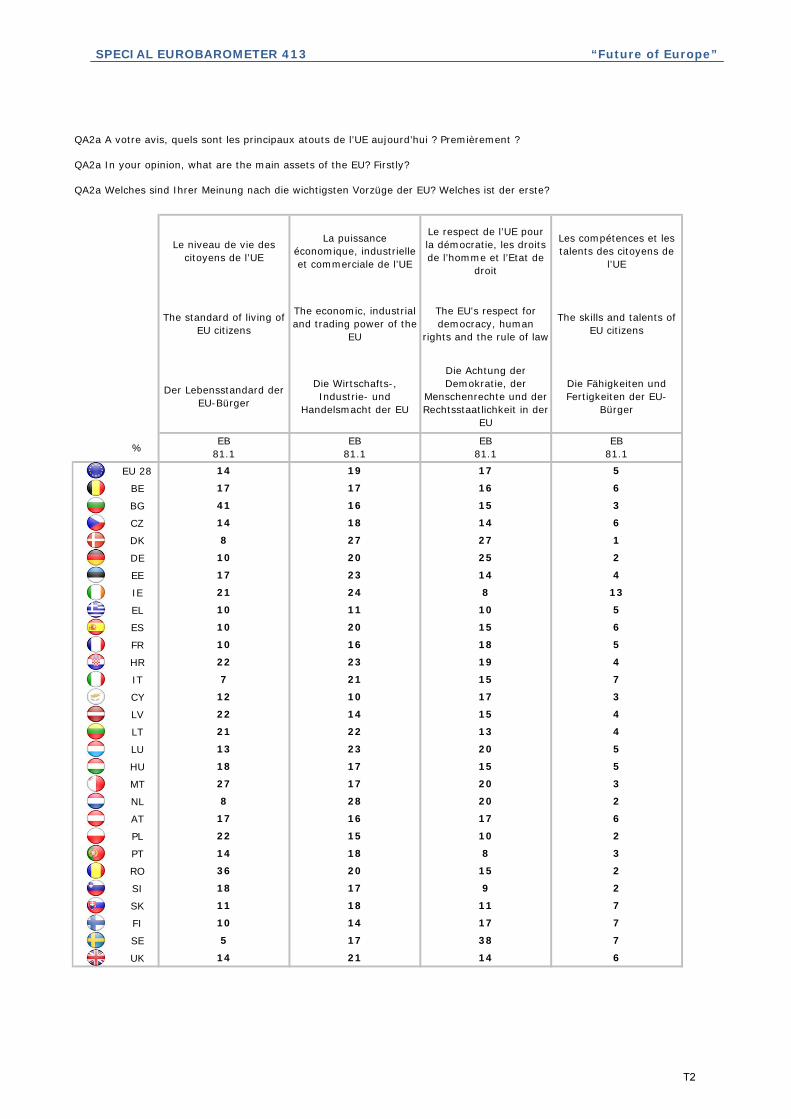
Respondents were asked to name what they regard as the EU’s first main asset, out of a
list of nine options. They were then asked to name its second main asset.
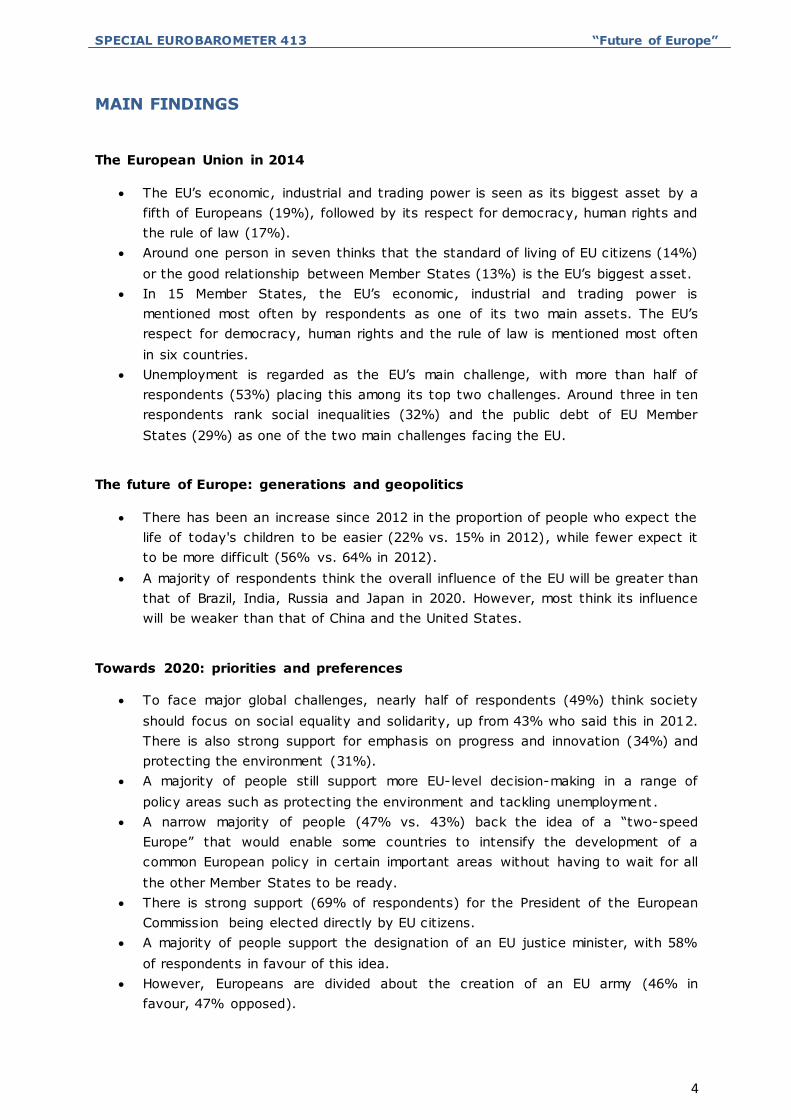
The following chart looks only at respondents’ first choice . Based on these first
answers only, nearly a fifth of people (19%) say that the economic, industrial and
trading power of the EU is its main asset, while 17% mention the EU’s respect for
democracy, human rights and the rule of law.
Around one person in seven thinks that the standard of living of EU citizens (14%) or
the good relationship between the EU’s Member States (13%) is the EU’s biggest
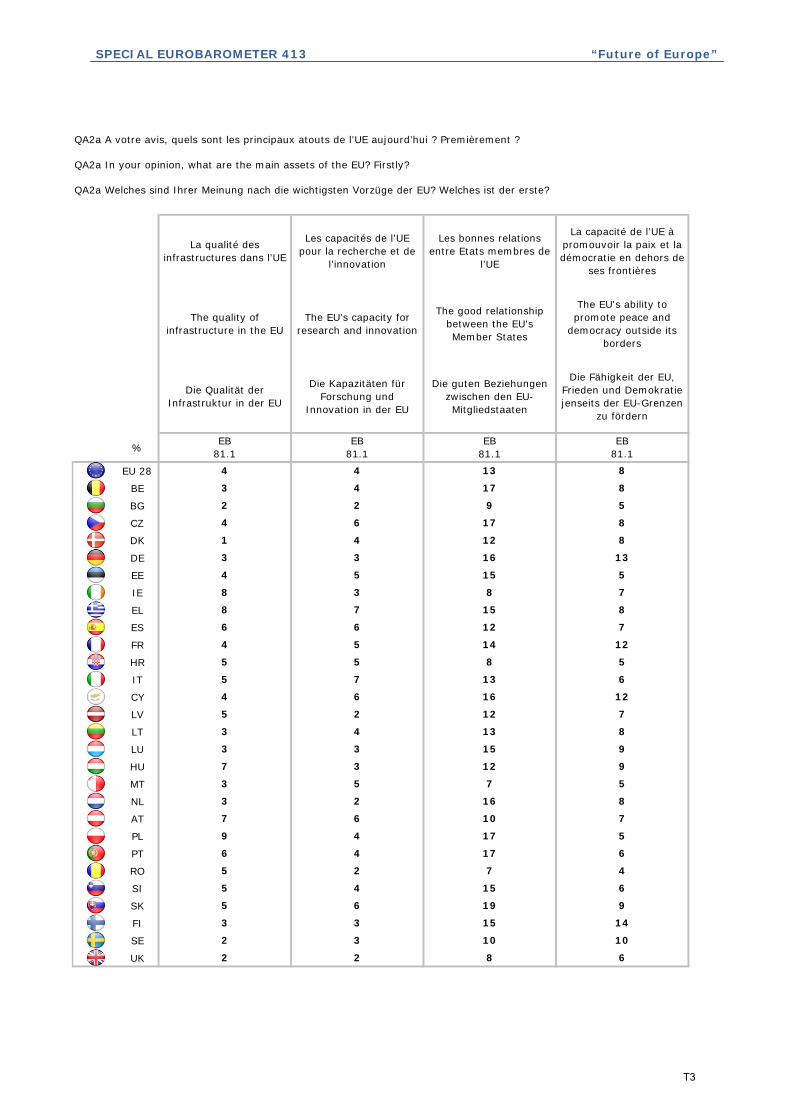
asset, while fewer than one in ten cite the EU’s ability to promote peace and democracy
outside its borders (8%) and one in twenty or less mention the skills and talents of EU
citizens (5%), the quality of infrastructure in the EU (4%), the EU’s capacity for research
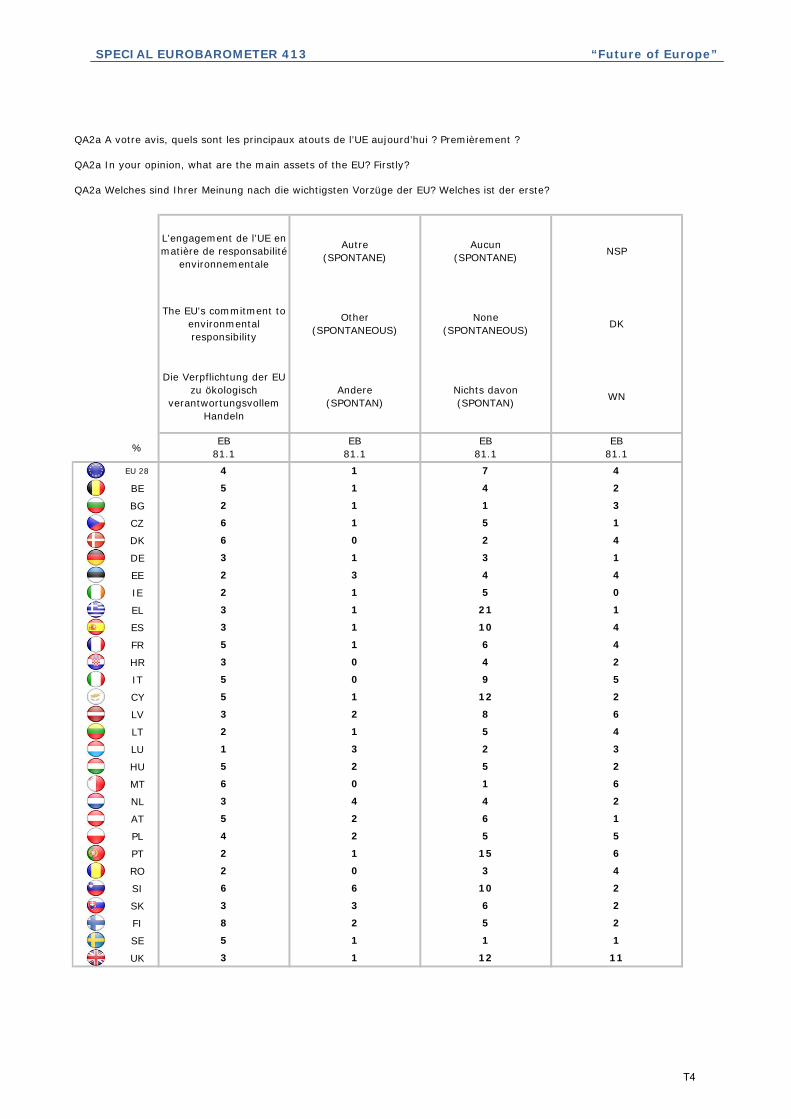
and innovation (4%) and the EU’s commitment to environmental responsibility (4%).
In addition, 7% of respondents say spontaneously that the EU has no main assets, while
4% say they don’t know which of the EU’s assets are the most significant.
SPECIAL EUROBAROMETER 413 “Future of Europe”
6
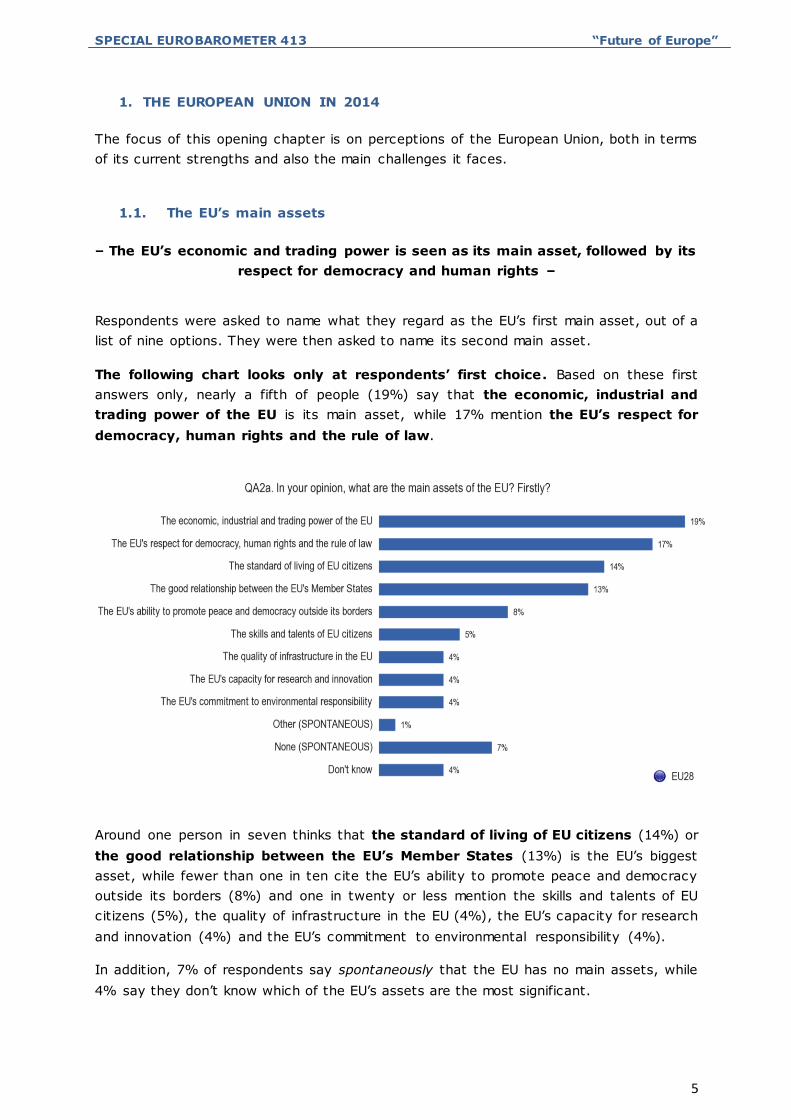
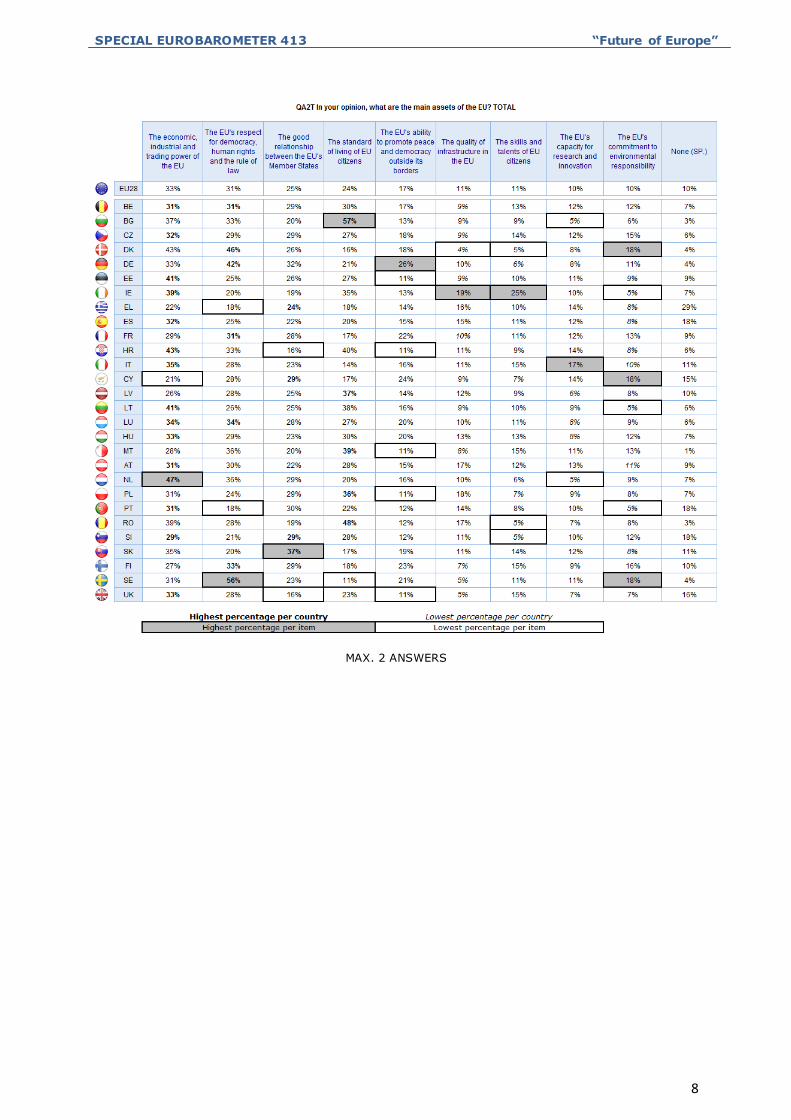
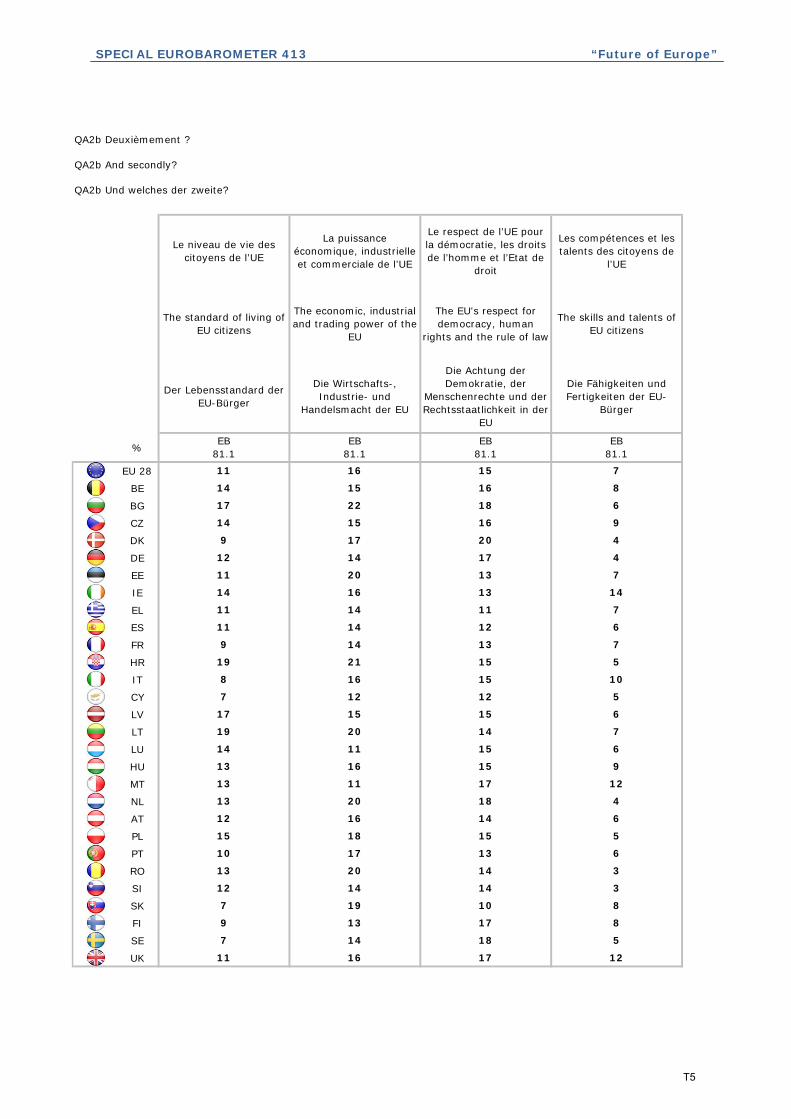
The chart below describes respondents’ combined first and second answers.
MAX. 2 ANSWERS
The hierarchy is very similar to that for first choices only. Overall, a third of respondents
(33%) think that the economic, industrial and trading power of the EU is one of its
two main assets, while around three in ten people (31%) mention the EU’s respect for
democracy, human rights and the rule of law.
Around one in four respondents cite the good relationship between the EU’s
Member States (25%) and the standard of living of EU citizens (24%), while
around one in six (17%) mention the EU’s ability to promote peace and democracy
outside its borders.
About a tenth of respondents cite each of the remaining possibilities as the EU’s first or
second asset, including: the quality of infrastructure in the EU (11%); the skills and
talents of EU citizens (11%); the EU’s commitment to environmental responsibility
(10%); and the EU’s capacity for research and innovation (10%).
A tenth of respondents (10%) also say spontaneously that the EU has no main assets,
while 4% answer “don’t know”.
In 15 Member States, the economic, industrial and trading power of the EU is
mentioned most often by respondents as the EU’s biggest or second biggest asset. The
Netherlands (47%), Croatia (43%) and Denmark (43%) have the highest proportions of
respondents who give this answer, with the lowest proportions in Cyprus (21%) and
Greece (22%).
SPECIAL EUROBAROMETER 413 “Future of Europe”
7
In seven countries, the EU’s respect for democracy, human rights and the rule of
law is mentioned most often as one of its top two assets. Sweden (56%), Denmark
(46%) and Germany (42%) have the highest proportions of people who give this answer,
whereas less than a fifth of respondents in Portugal and Greece (18%) agree.
The good relationship between the EU’s Member States is mentioned most often as
the EU’s first or second asset in four countries: Slovakia (37%), Cyprus (29%), Slovenia
(29%) and Greece (24%). A relatively high proportion of respondents in Germany (32%)
and Portugal (30%) also mention this, while least people do so in Croatia and the UK
(both 16%).
The standard of living of EU citizens is mentioned most often as one of the EU’s two
main assets in five Member States: Bulgaria (57%), Romania (48%), Malta (39%),
Latvia (37%) and Poland (36%). The countries in which fewest respondents give this
answer are Sweden (11%), Italy (14%) and Denmark (16%).
A relatively high proportion of respondents in Germany (26%), Cyprus (24%) and
Finland (23%) think that the EU’s ability to promote peace and democracy outside
its borders is one of its two biggest assets.
Ireland (19%) and Poland (18%) have the most respondents who cite the quality of
infrastructure as one of the EU’s top two assets, while Denmark (4%), Sweden (5%)
and the UK (5%) have the fewest.
A noticeably high proportion of respondents in Ireland (25%) think that the skills and
talents of EU citizens are the EU’s biggest or second biggest asset , whereas only 5% of
respondents agree in Denmark, Romania and Slovenia.
In Italy, 17% of respondents regard the EU’s capacity for research and innovation
as its first or second asset, followed by Croatia, Cyprus and Greece (all 14%). This
contrasts with Bulgaria and the Netherlands, where only 5% of respondents say this.
Lastly, in Denmark, Cyprus and Sweden, 18% of respondents say that the EU’s
commitment to environmental responsibility is its biggest or second biggest asset ,
while in Ireland, Lithuania and Portugal only 5% of respondents share this opinion.
In Greece, more people say spontaneously that the EU has no main assets (29%) than
mention any of the assets in the list. A relatively high proportion of respondents also give
this answer in Portugal, Slovenia and Spain (all 18%). At least a tenth of respondents
take this view in 10 Member States.
SPECIAL EUROBAROMETER 413 “Future of Europe”
8
MAX. 2 ANSWERS
SPECIAL EUROBAROMETER 413 “Future of Europe”
9
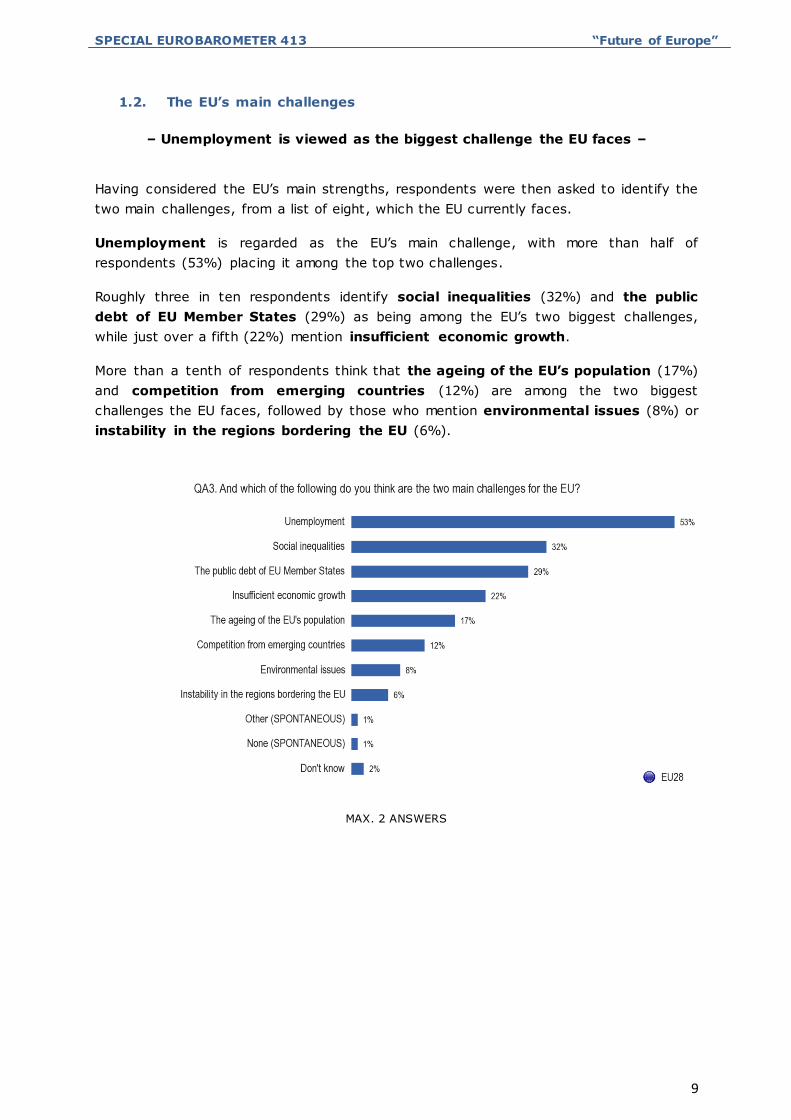
1.2. The EU’s main challenges
– Unemployment is viewed as the biggest challenge the EU faces –
Having considered the EU’s main strengths, respondents were then asked to identify the
two main challenges, from a list of eight, which the EU currently faces.
Unemployment is regarded as the EU’s main challenge, with more than half of
respondents (53%) placing it among the top two challenges.
Roughly three in ten respondents identify social inequalities (32%) and the public
debt of EU Member States (29%) as being among the EU’s two biggest challenges,
while just over a fifth (22%) mention insufficient economic growth.
More than a tenth of respondents think that the ageing of the EU’s population (17%)
and competition from emerging countries (12%) are among the two biggest
challenges the EU faces, followed by those who mention environmental issues (8%) or
instability in the regions bordering the EU (6%).
MAX. 2 ANSWERS
SPECIAL EUROBAROMETER 413 “Future of Europe”
10
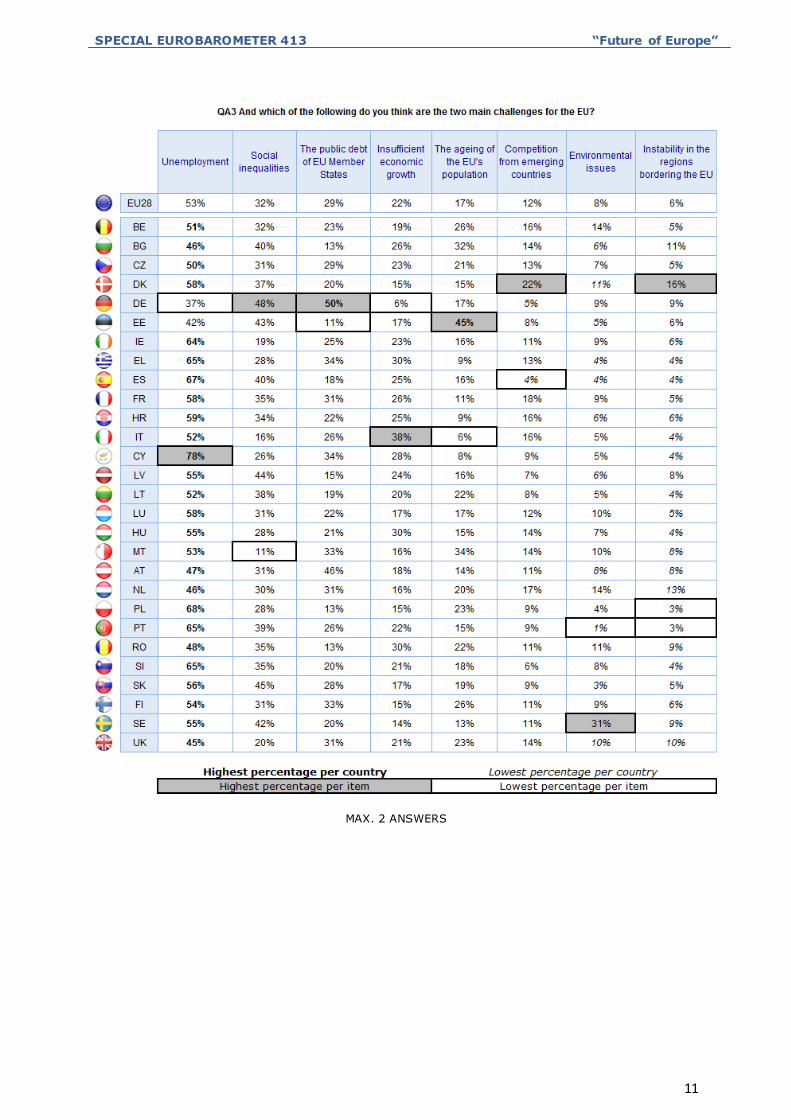
Unemployment is mentioned most often by respondents as one of the EU’s two
greatest challenges in all but two Member States, Estonia and Germany, and at
least 50% of people mention unemployment in 21 out of 28 countries. Cyprus (78%) has
the highest proportion of respondents who say this, followed by Poland (68%) and Spain
(67%), while Germany (37%), Estonia (42%) and the UK (45%) have the lowest.
In Germany (50%), the public debt of EU Member States is mentioned most often as
one of the EU’s two main challenges, with concern about this issue also noticeably high in
Austria (46%). In contrast, only 11% of respondents in Estonia, and 13% of those in
Bulgaria, Poland and Romania, mention this.
In Estonia (45%), the ageing of the population is mentioned most often. A relatively
high proportion of people also mention this factor in Malta (34%) and Bulgaria (32%),
while the lowest proportions are in Italy (6%), Cyprus (8%), Croatia (9%) and Greece
(9%).
At least four out of ten respondents in seven Member States think that social
inequalities are among the two main challenges for the EU. Germany (48%), Slovakia
(45%) and Latvia (44%) have the highest proportions of people who take this view,
whereas Malta (11%), Italy (16%) and Ireland (19%) have the lowest.
In four Member States, at least three out of ten respondents consider insufficient
economic growth to be one of the EU’s two biggest challenges: Italy (38%), Greece
(30%), Hungary (30%) and Romania (30%). Meanwhile, in Germany only 6% of people
share this view – substantially fewer than in any other EU country.
Denmark (22%) is the only Member State where more than a fifth of respondents regard
competition from emerging countries as one of the EU’s two main challenges,
followed by France (18%) and the Netherlands (17%). Denmark (16%) also has the
highest proportion of people who regard instability in the regions bordering the EU
as one of its two greatest challenges, followed by the Netherlands (13%), Bulgaria
(11%) and the UK (10%).
In most countries, very few people think that environmental issues are among the
EU’s two biggest challenges, although in Sweden (31%) an exceptionally high proportion
of respondents give this answer (more than double the proportion in any other EU
Member State).
SPECIAL EUROBAROMETER 413 “Future of Europe”
11
MAX. 2 ANSWERS
SPECIAL EUROBAROMETER 413 “Future of Europe”
12
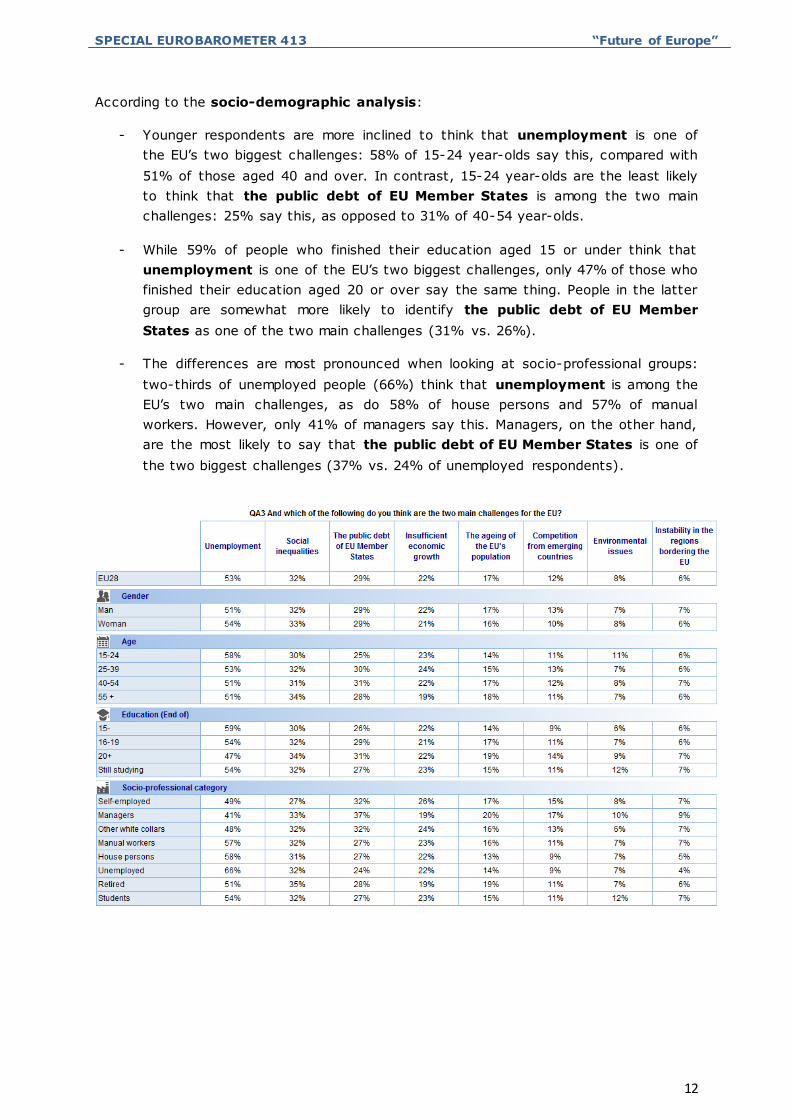
According to the socio-demographic analysis:
- Younger respondents are more inclined to think that unemployment is one of
the EU’s two biggest challenges: 58% of 15-24 year-olds say this, compared with
51% of those aged 40 and over. In contrast, 15-24 year-olds are the least likely
to think that the public debt of EU Member States is among the two main
challenges: 25% say this, as opposed to 31% of 40-54 year-olds.
- While 59% of people who finished their education aged 15 or under think that
unemployment is one of the EU’s two biggest challenges, only 47% of those who
finished their education aged 20 or over say the same thing. People in the latter
group are somewhat more likely to identify the public debt of EU Member
States as one of the two main challenges (31% vs. 26%).
- The differences are most pronounced when looking at socio-professional groups:
two-thirds of unemployed people (66%) think that unemployment is among the
EU’s two main challenges, as do 58% of house persons and 57% of manual
workers. However, only 41% of managers say this. Managers, on the other hand,
are the most likely to say that the public debt of EU Member States is one of
the two biggest challenges (37% vs. 24% of unemployed respondents).
SPECIAL EUROBAROMETER 413 “Future of Europe”
13
2. THE FUTURE OF EUROPE: GENERATIONS AND GEOPOLITICS
This second chapter looks ahead and considers whether children in the EU can expect an
easier, similar or more difficult life than adults living in the EU today. It also addresses
the issue of the EU’s likely future influence on the world stage.
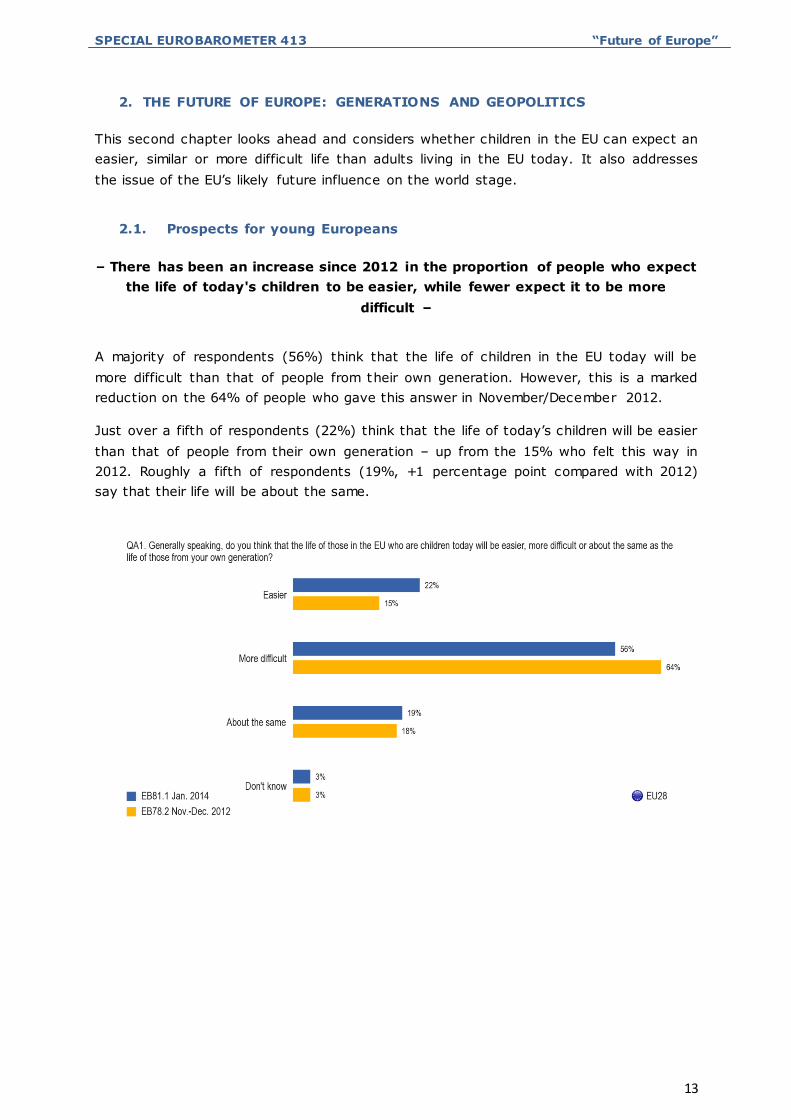
2.1. Prospects for young Europeans
– There has been an increase since 2012 in the proportion of people who expect
the life of today's children to be easier, while fewer expect it to be more
difficult –
A majority of respondents (56%) think that the life of children in the EU today will be
more difficult than that of people from their own generation. However, this is a marked
reduction on the 64% of people who gave this answer in November/December 2012.
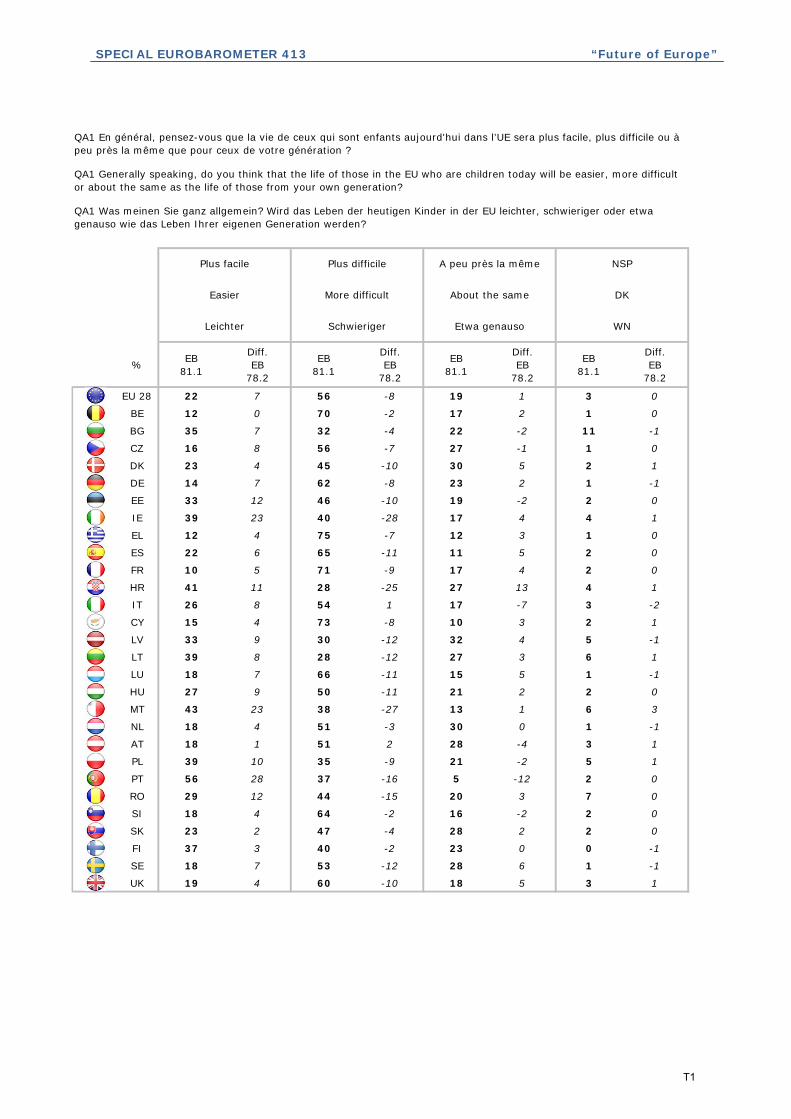
Just over a fifth of respondents (22%) think that the life of today’s children will be easier
than that of people from their own generation – up from the 15% who felt this way in
2012. Roughly a fifth of respondents (19%, +1 percentage point compared with 2012)
say that their life will be about the same.
SPECIAL EUROBAROMETER 413 “Future of Europe”
14
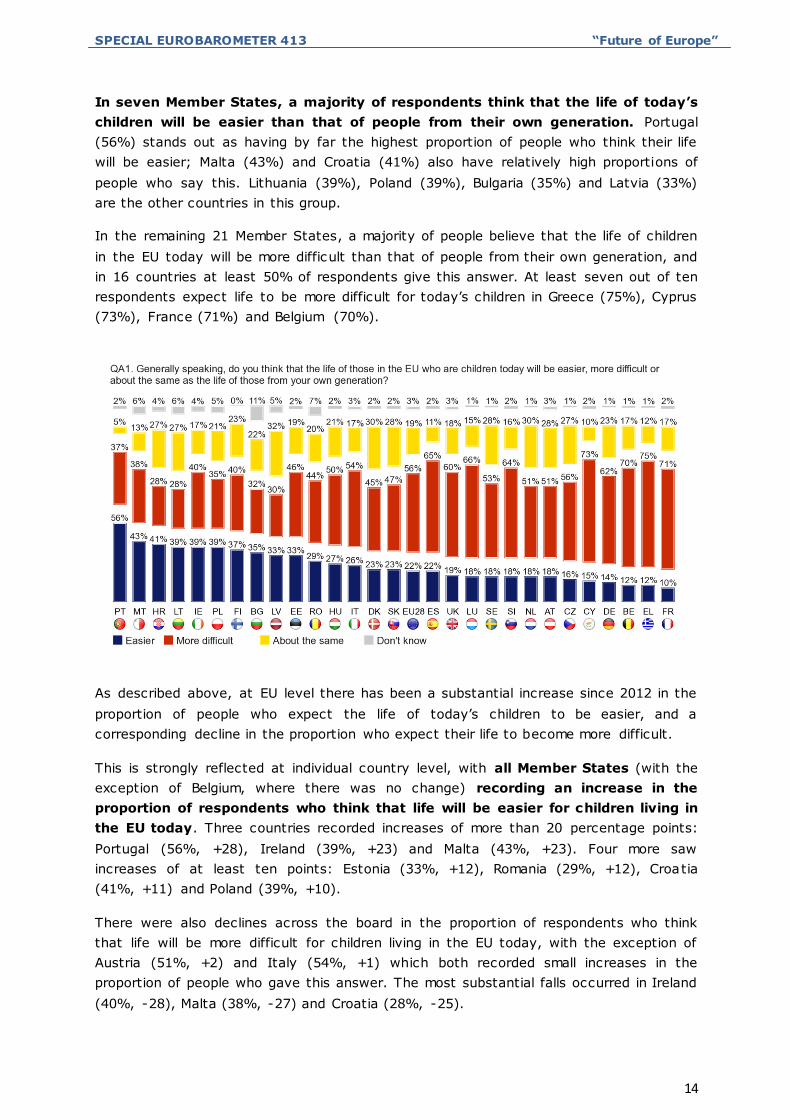
In seven Member States, a majority of respondents think that the life of today’s
children will be easier than that of people from their own generation. Portugal
(56%) stands out as having by far the highest proportion of people who think their life
will be easier; Malta (43%) and Croatia (41%) also have relatively high proportions of
people who say this. Lithuania (39%), Poland (39%), Bulgaria (35%) and Latvia (33%)
are the other countries in this group.
In the remaining 21 Member States, a majority of people believe that the life of children
in the EU today will be more difficult than that of people from their own generation, and
in 16 countries at least 50% of respondents give this answer. At least seven out of ten
respondents expect life to be more difficult for today’s children in Greece (75%), Cyprus
(73%), France (71%) and Belgium (70%).
As described above, at EU level there has been a substantial increase since 2012 in the
proportion of people who expect the life of today’s children to be easier, and a
corresponding decline in the proportion who expect their life to become more difficult.
This is strongly reflected at individual country level, with all Member States (with the
exception of Belgium, where there was no change) recording an increase in the
proportion of respondents who think that life will be easier for children living in
the EU today. Three countries recorded increases of more than 20 percentage points:
Portugal (56%, +28), Ireland (39%, +23) and Malta (43%, +23). Four more saw
increases of at least ten points: Estonia (33%, +12), Romania (29%, +12), Croatia
(41%, +11) and Poland (39%, +10).
There were also declines across the board in the proportion of respondents who think
that life will be more difficult for children living in the EU today, with the exception of
Austria (51%, +2) and Italy (54%, +1) which both recorded small increases in the
proportion of people who gave this answer. The most substantial falls occurred in Ireland
(40%, -28), Malta (38%, -27) and Croatia (28%, -25).

SPECIAL EUROBAROMETER 413 “Future of Europe”
15

SPECIAL EUROBAROMETER 413 “Future of Europe”
16
The socio-demographic results reveal some variations between categories:
- Older respondents are in general more pessimistic than younger respondents on
this issue: while 59-60% of people aged 40 and over believe that life will be more
difficult for today’s children, only 44% of 15-24 year-olds agree.
- Those with a higher level of education are more optimistic about the prospects for
today’s children. While 60-61% of people who finished their education aged 19 or
below say that life will be more difficult for today’s children, 53% of respondents
who finished their education aged 20 or over and just 39% of students think that
this will be the case.
- Socio-professional circumstances also appear to influence perceptions. 61% of
manual workers, but only 53% of managers, expect today’s children to have a
more difficult life than people from their own generation.

SPECIAL EUROBAROMETER 413 “Future of Europe”
17
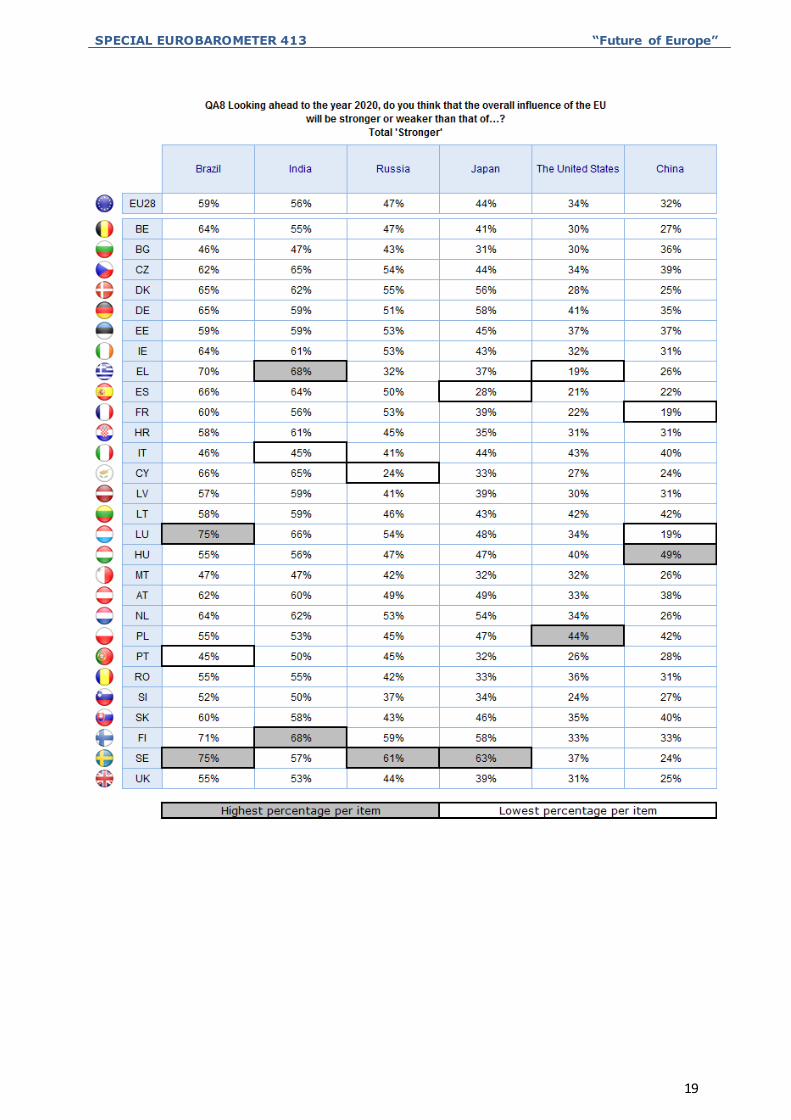
2.2. The EU’s influence on the world stage
– A majority of Europeans think the EU will be more influential in 2020 than
other world powers, with the exception of China and the United States –
Respondents were asked to assess whether the overall influence of the EU at the end of
this decade would be stronger or weaker than that of six non-EU countries.
Over half of respondents think that the EU’s influence will be stronger than that
of Brazil (59% vs. 23% who say it will be weaker) and India (56% vs. 26% who think
it will be weaker).
A majority of people also think that the EU’s influence will be stronger than that
of Russia (47% vs. 35%) and Japan (44% vs. 41%).
However, most respondents think that the EU’s influence will be weaker than
that of China (56% vs. 32% who think it will be stronger) and the United States
(52% vs. 34%).
At least 50% of respondents in all but four Member States think the EU will have a
stronger influence than Brazil in 2020. Over seven out of ten respondents say this in
Luxembourg (75%), Sweden (75%), Finland (71%) and Greece (70%). The four
exceptions, where less than half think the EU’s influence will be stronger, are Portugal
(45%), Bulgaria (46%), Italy (46%) and Malta (47%). In these countries, though, a
majority still think the overall influence of the EU will be stronger.
The results for India are similar to those for Brazil. Finland (68%), Greece (68%) and
Luxembourg (66%) again have the highest proportions of respondents who think the
EU’s influence will be stronger than India’s in 2020. Over 50% of people say this in all
but three Member States - Italy (45%), Bulgaria (47%) and Malta (47%) - although even
in these countries a majority of people think the EU’s influence will be greater.

SPECIAL EUROBAROMETER 413 “Future of Europe”
18
When it comes to Russia, over 50% of respondents in 11 Member States think the EU’s
relative influence will be stronger, led by Sweden (61%), Finland (59%) and Denmark
(55%). At the other extreme, only 24% of people in Cyprus, 32% in Greece and 37% in
Slovenia share this view. In these three Member States, and in Slovakia, a majority of
respondents think the EU’s influence will be weaker than Russia’s in 2020.
In only five Member States do more than 50% of respondents think the EU’s influence
will be stronger than that of Japan: Sweden (63%), Finland (58%), Germany (58%),
Denmark (56%) and the Netherlands (54%). However, a majority of people in 14
Member States think the EU’s influence will be greater. Spain (28%), Bulgaria (31%),
Malta (32%) and Portugal (32%) have the lowest proportions of respondents who share
this view.
In most Member States (24 out of 28), a majority of the population think the EU’s
influence will be weaker than that of the United States in 2020. The four exceptions are
Poland (44% stronger), Italy (43%), Lithuania (42%) and Germany (41%). At the other
end of the scale are Greece (19%), Spain (21%) and France (22%).
Hungary (49%), Lithuania (42%) and Poland (42%) are the only Member States where a
majority of respondents think the EU’s influence will be stronger than that of China in
2020. In all other EU countries, a majority think the EU’s influence will be weaker.
Only in Lithuania and Poland does a majority of respondents think that the EU’s influence
will be stronger than all of these countries in 2020.
SPECIAL EUROBAROMETER 413 “Future of Europe”
19
SPECIAL EUROBAROMETER 413 “Future of Europe”
20
3. TOWARDS 2020: PRIORITIES AND PREFERENCES
The third and final chapter of the report focuses on possible approaches to the EU’s
present and future challenges.
3.1. Where should the emphasis lie?
– Nearly half of Europeans think society should stress social equality and
solidarity in order to face major global challenges –
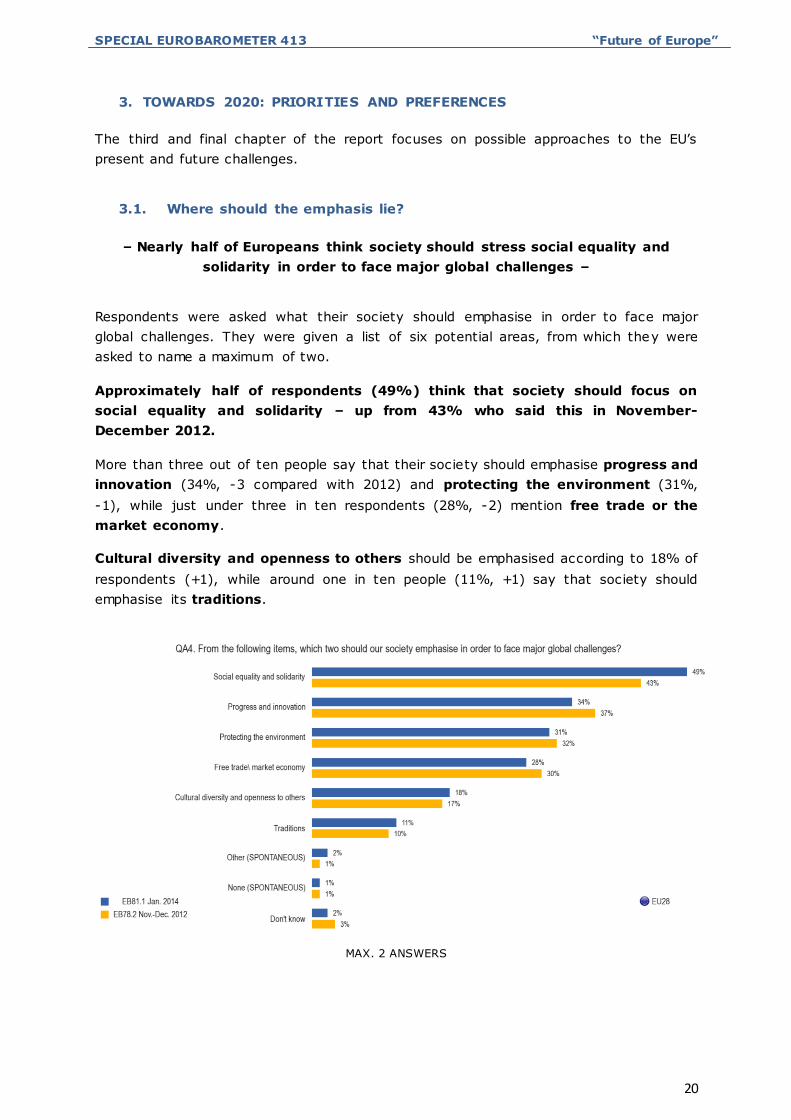
Respondents were asked what their society should emphasise in order to face major
global challenges. They were given a list of six potential areas, from which they were
asked to name a maximum of two.
Approximately half of respondents (49%) think that society should focus on
social equality and solidarity – up from 43% who said this in November-
December 2012.
More than three out of ten people say that their society should emphasise progress and
innovation (34%, -3 compared with 2012) and protecting the environment (31%,
-1), while just under three in ten respondents (28%, -2) mention free trade or the
market economy.
Cultural diversity and openness to others should be emphasised according to 18% of
respondents (+1), while around one in ten people (11%, +1) say that society should
emphasise its traditions.
MAX. 2 ANSWERS
SPECIAL EUROBAROMETER 413 “Future of Europe”
21
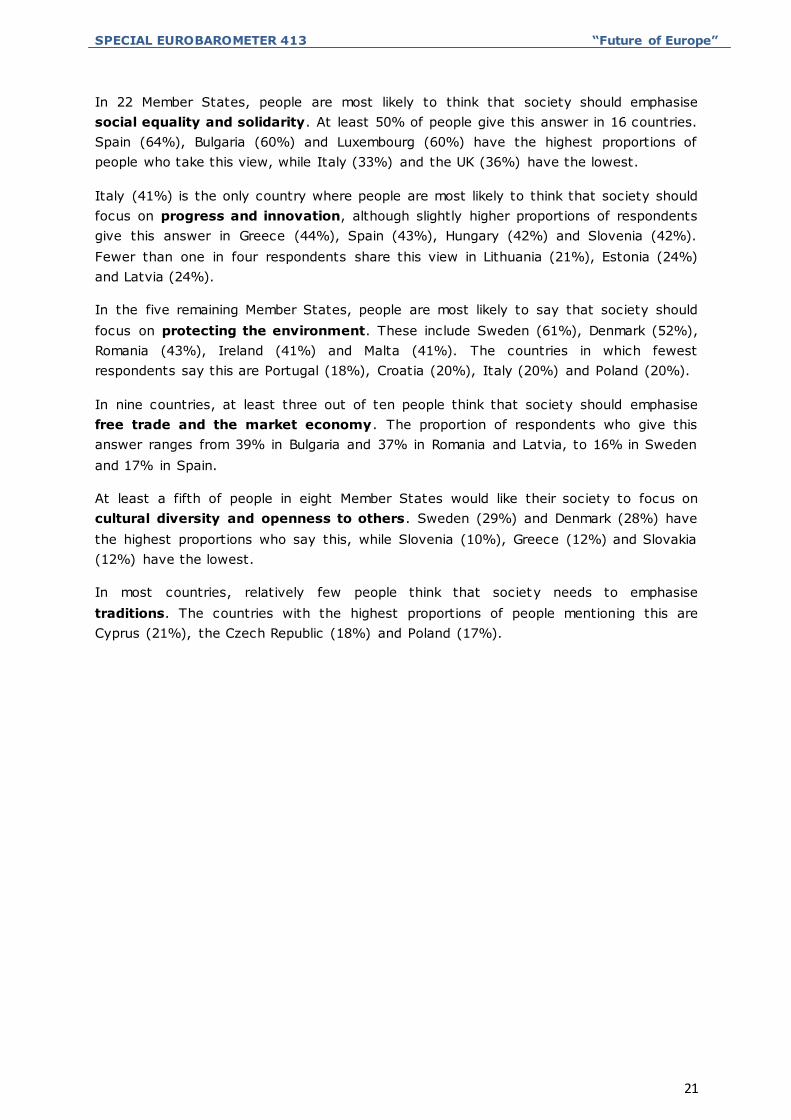
In 22 Member States, people are most likely to think that society should emphasise
social equality and solidarity. At least 50% of people give this answer in 16 countries.
Spain (64%), Bulgaria (60%) and Luxembourg (60%) have the highest proportions of
people who take this view, while Italy (33%) and the UK (36%) have the lowest.
Italy (41%) is the only country where people are most likely to think that society should
focus on progress and innovation, although slightly higher proportions of respondents
give this answer in Greece (44%), Spain (43%), Hungary (42%) and Slovenia (42%).
Fewer than one in four respondents share this view in Lithuania (21%), Estonia (24%)
and Latvia (24%).
In the five remaining Member States, people are most likely to say that society should
focus on protecting the environment. These include Sweden (61%), Denmark (52%),
Romania (43%), Ireland (41%) and Malta (41%). The countries in which fewest
respondents say this are Portugal (18%), Croatia (20%), Italy (20%) and Poland (20%).
In nine countries, at least three out of ten people think that society should emphasise
free trade and the market economy. The proportion of respondents who give this
answer ranges from 39% in Bulgaria and 37% in Romania and Latvia, to 16% in Sweden
and 17% in Spain.
At least a fifth of people in eight Member States would like their society to focus on
cultural diversity and openness to others. Sweden (29%) and Denmark (28%) have
the highest proportions who say this, while Slovenia (10%), Greece (12%) and Slovakia
(12%) have the lowest.
In most countries, relatively few people think that society needs to emphasise
traditions. The countries with the highest proportions of people mentioning this are
Cyprus (21%), the Czech Republic (18%) and Poland (17%).
SPECIAL EUROBAROMETER 413 “Future of Europe”
22
MAX. 2 ANSWERS
Since 2012, there has been an increase in most Member States in the proportion of
respondents who think that society should emphasise social equality and solidarity,
with Lithuania (57%, +12), Estonia (50%, +11), Spain (64%, +10) and Austria (53%,
+10) recording the largest increases. There were only a few exceptions, notably Ireland
(39%, -3) and Romania (40%, -3), where the proportion decreased over this period.
There were noticeable increases in the proportions who believe society should emphasise
progress and innovation in Portugal (37%, +9) and Malta (37%, +8), while the most
significant declines occurred in Luxembourg (25%, -10) and Romania (25%, -8).
In Ireland (41%, +14) and Romania (43%, +8) there was a substantial rise in the
number of respondents who think society should focus on protecting the environment,
while there were marked declines in Sweden (61%, -9), Bulgaria (26%, -9), Luxembourg
(39%, -8) and Finland (36%, -8).

SPECIAL EUROBAROMETER 413 “Future of Europe”
23
Some variations can be seen between socio-demographic categories:
- Women are slightly more likely than men to emphasise social equality and
solidarity (51% vs. 46%), while men are slightly more likely to emphasise free
trade and the market economy (30% vs. 25%), and progress and
innovation (37% vs. 32%).
- 25-39 year-olds (39%) are the most likely to think that society should emphasise
progress and innovation, while people aged 55 and over (30%) are the least
likely to do so. 15-24 year-olds (22%) are the most likely to think that society
should emphasise cultural diversity and openness to others, with
respondents aged 55 and over (16%) again the least likely to think so.
- People who finished their education aged 20 or over are more likely than those
who left school aged 15 or below to emphasise progress and innovation (39%
vs. 29%), protecting the environment (33% vs. 27%), and cultural diversity
and openness to others (22% vs. 13%).
- While around half (50-52%) of manual workers, house persons and retired and
unemployed people would like there to be an emphasis on social equality and
solidarity, only 40% of self-employed people and 44% of managers agree.
SPECIAL EUROBAROMETER 413 “Future of Europe”
24
3.2. More or less European decision-making?
– A majority of people support more decision-making at European level in a
range of policy areas –
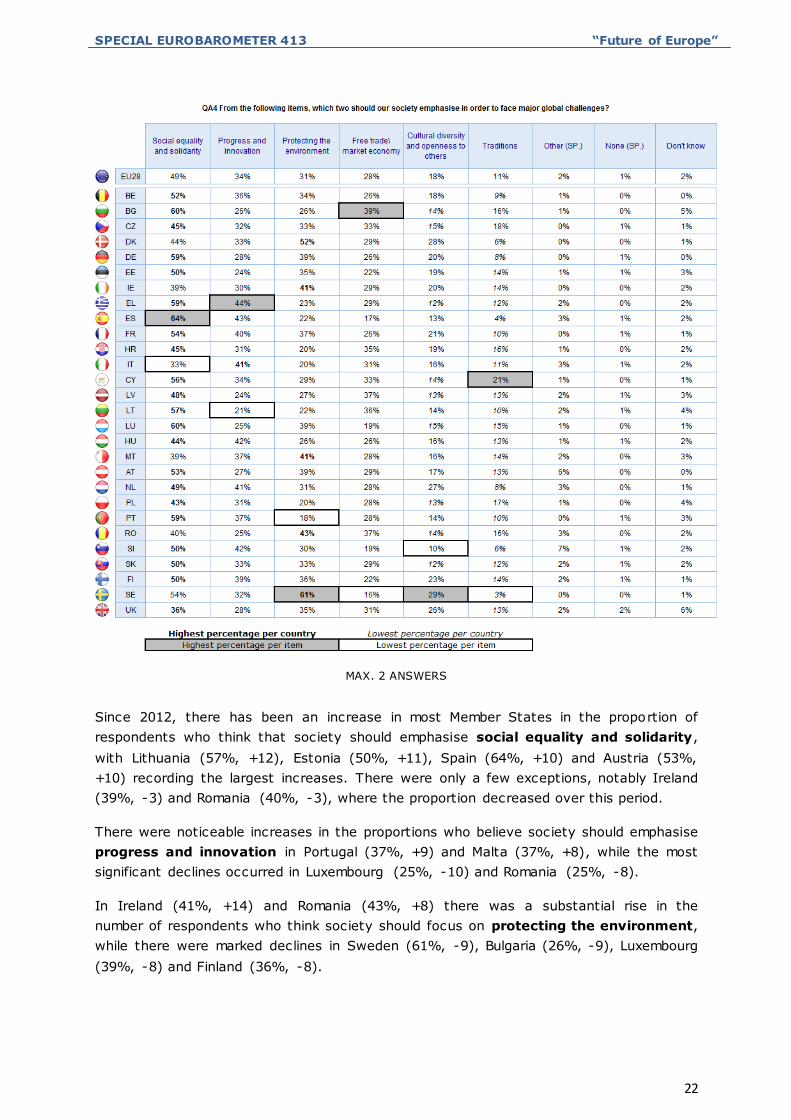
Respondents then addressed the question of whether more or less decision-making
should take place at a European level in order to tackle some of the key issues facing the
EU.
More than seven out of ten people (72%) think that protecting the environment
requires more decision-making at EU level (-8 compared with 2012), while just over
six out of ten (62%) want more EU-level decision-making to help tackle
unemployment (-4).
Almost six out of ten respondents (59%) think that immigration requires more
decision-making at European level, while half (50%) say this with regard to health and
social security.
Opinion is more evenly divided when it comes to economic policy and taxation, with
48% of respondents saying that this area needs more European decision-making and
44% saying it needs less.
SPECIAL EUROBAROMETER 413 “Future of Europe”
25
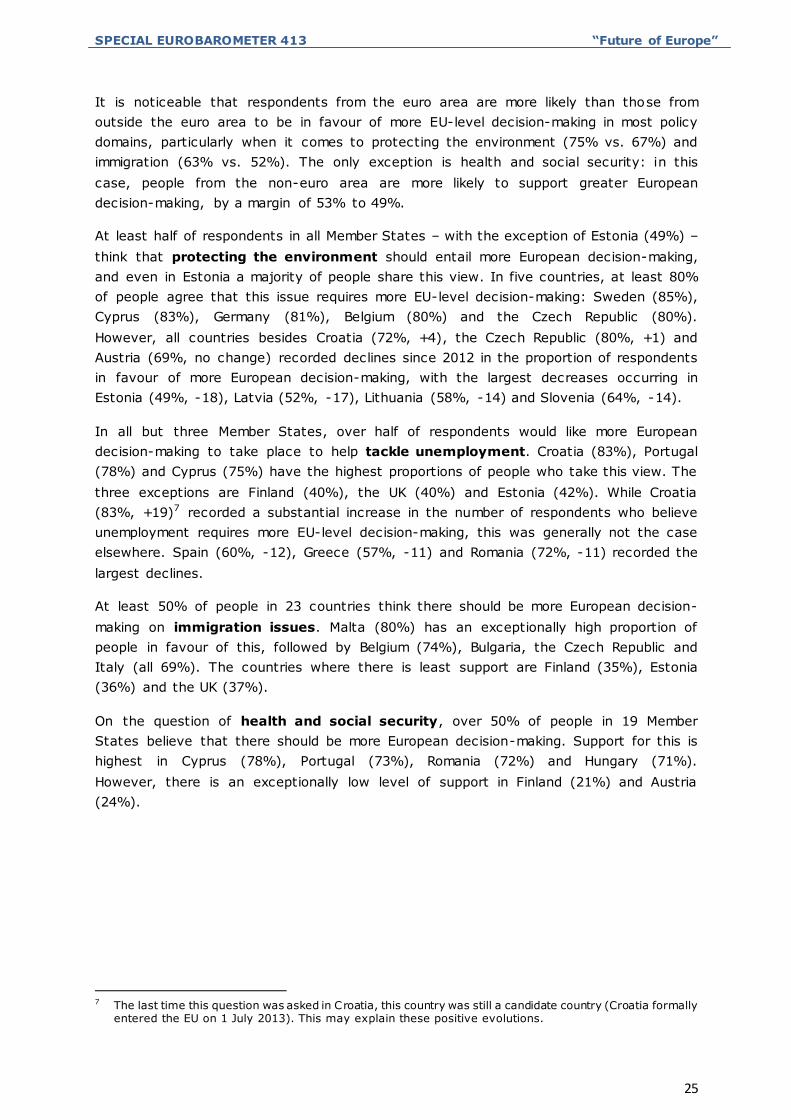
It is noticeable that respondents from the euro area are more likely than those from
outside the euro area to be in favour of more EU-level decision-making in most policy
domains, particularly when it comes to protecting the environment (75% vs. 67%) and
immigration (63% vs. 52%). The only exception is health and social security: in this
case, people from the non-euro area are more likely to support greater European
decision-making, by a margin of 53% to 49%.
At least half of respondents in all Member States – with the exception of Estonia (49%) –
think that protecting the environment should entail more European decision-making,
and even in Estonia a majority of people share this view. In five countries, at least 80%
of people agree that this issue requires more EU-level decision-making: Sweden (85%),
Cyprus (83%), Germany (81%), Belgium (80%) and the Czech Republic (80%).
However, all countries besides Croatia (72%, +4), the Czech Republic (80%, +1) and
Austria (69%, no change) recorded declines since 2012 in the proportion of respondents
in favour of more European decision-making, with the largest decreases occurring in
Estonia (49%, -18), Latvia (52%, -17), Lithuania (58%, -14) and Slovenia (64%, -14).
In all but three Member States, over half of respondents would like more European
decision-making to take place to help tackle unemployment. Croatia (83%), Portugal
(78%) and Cyprus (75%) have the highest proportions of people who take this view. The
three exceptions are Finland (40%), the UK (40%) and Estonia (42%). While Croatia
(83%, +19)7 recorded a substantial increase in the number of respondents who believe
unemployment requires more EU-level decision-making, this was generally not the case
elsewhere. Spain (60%, -12), Greece (57%, -11) and Romania (72%, -11) recorded the
largest declines.
At least 50% of people in 23 countries think there should be more European decision-
making on immigration issues. Malta (80%) has an exceptionally high proportion of
people in favour of this, followed by Belgium (74%), Bulgaria, the Czech Republic and
Italy (all 69%). The countries where there is least support are Finland (35%), Estonia
(36%) and the UK (37%).
On the question of health and social security, over 50% of people in 19 Member
States believe that there should be more European decision-making. Support for this is
highest in Cyprus (78%), Portugal (73%), Romania (72%) and Hungary (71%).
However, there is an exceptionally low level of support in Finland (21%) and Austria
(24%).
7 The last time this question was asked in Croatia, this country was still a candidate country (Croatia formally
entered the EU on 1 July 2013). This may explain these positive evolutions.
SPECIAL EUROBAROMETER 413 “Future of Europe”
26
In 11 countries, over half of respondents think that more European decision-making is
required on economic policy and taxation. Portugal (68%) and Croatia (63%) have
the highest proportions of people who share this view, while Sweden (21%) and
Denmark (24%) have the lowest.
SPECIAL EUROBAROMETER 413 “Future of Europe”
27
3.3. Views on further European integration
– Opinion is divided over the idea of a “two-speed Europe” when it comes to
enacting new policies –
Views on a “two-speed Europe”
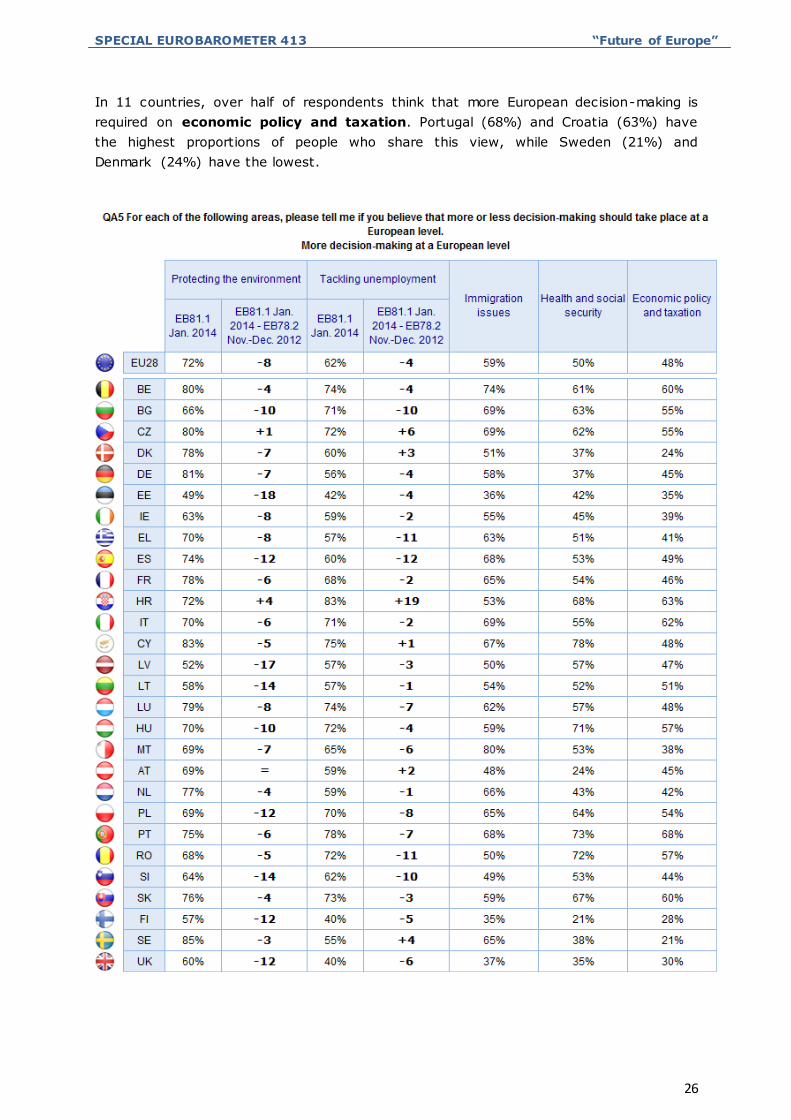
Respondents were asked whether countries which are ready to intensify the development
of a common European policy in certain areas should do so without having to wait for
others, or whether they should wait until all Member States of the EU are ready.
A majority of people (47%, +2 compared with 2012) believe that they should
not have to wait, though a sizeable minority (43%, +1) think that they should have to
wait. A tenth of respondents (10%, -3) say they “don’t know”.
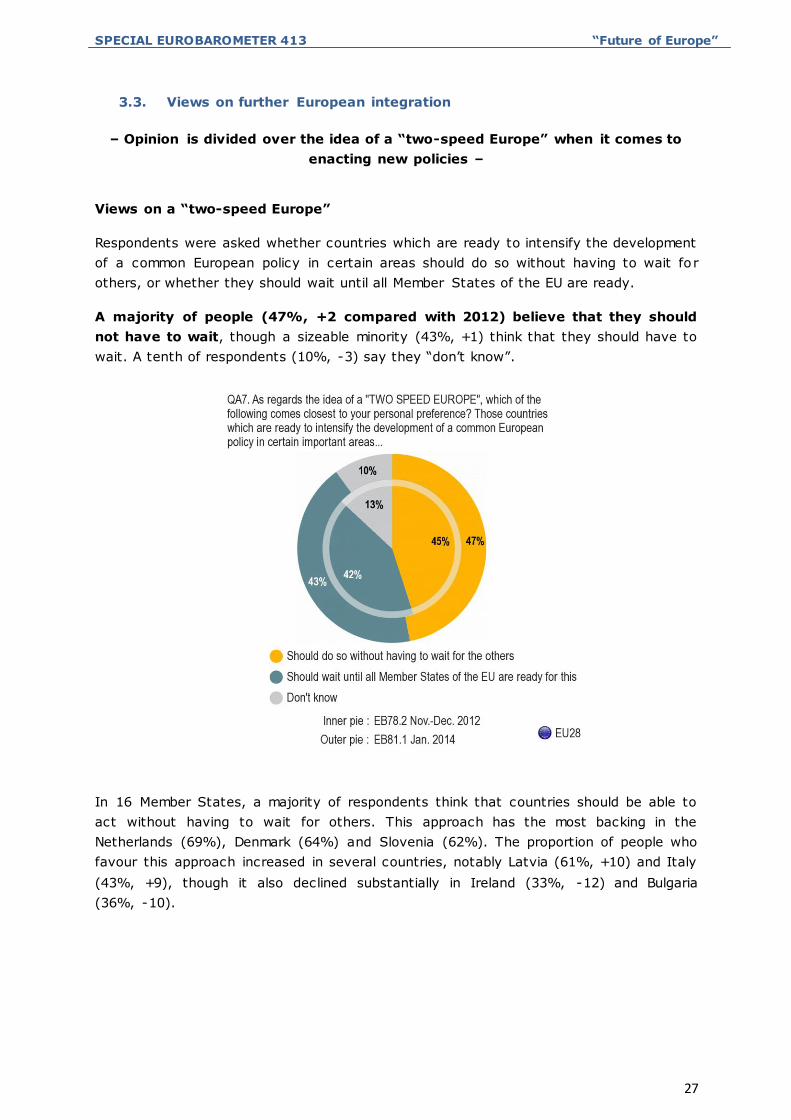
In 16 Member States, a majority of respondents think that countries should be able to
act without having to wait for others. This approach has the most backing in the
Netherlands (69%), Denmark (64%) and Slovenia (62%). The proportion of people who
favour this approach increased in several countries, notably Latvia (61%, +10) and Italy
(43%, +9), though it also declined substantially in Ireland (33%, -12) and Bulgaria
(36%, -10).
SPECIAL EUROBAROMETER 413 “Future of Europe”
28
However, in 12 countries a majority of people think that countries should have to wait
until all Member States are ready. Greece (70%), Spain (63%) and Portugal (60%) have
the highest proportions of people who take this view. There have been significant
increases since 2012 in the numbers of people taking this view in Ireland (52%, +11)
and Malta (44%, +10), while the largest decreases have been in Slovenia (28%, -8) and
Latvia (32%, -7).
SPECIAL EUROBAROMETER 413 “Future of Europe”
29
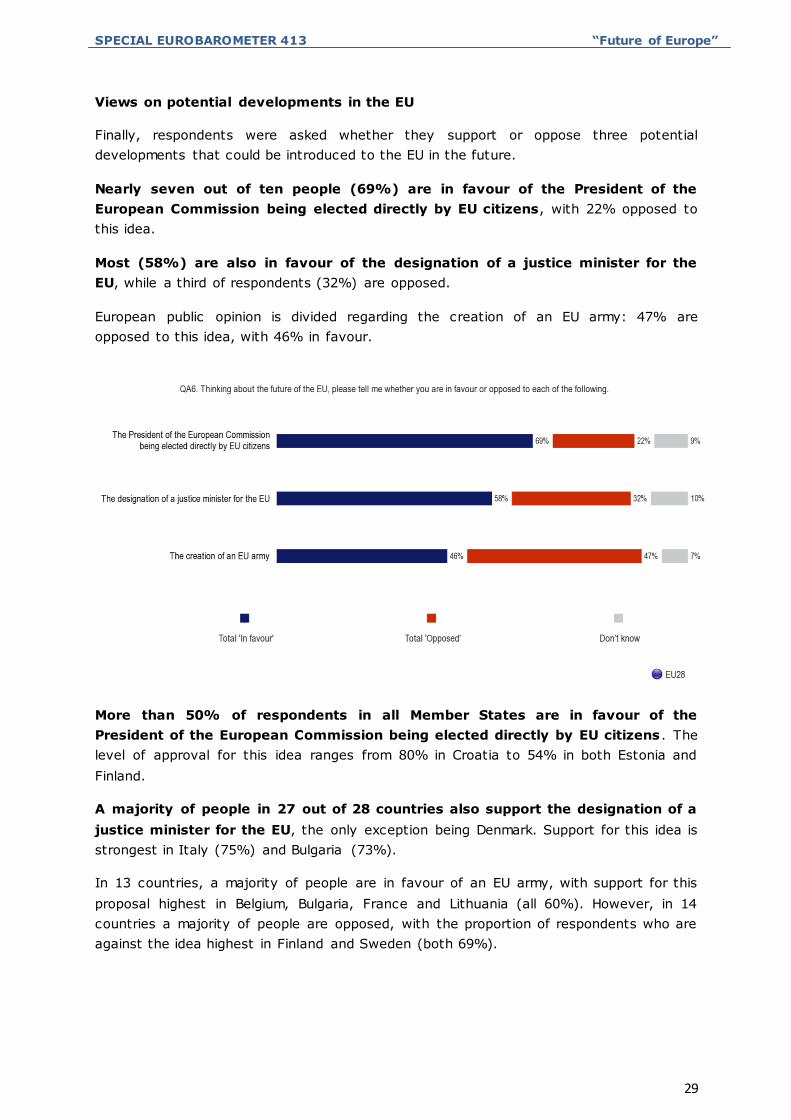
Views on potential developments in the EU
Finally, respondents were asked whether they support or oppose three potential
developments that could be introduced to the EU in the future.
Nearly seven out of ten people (69%) are in favour of the President of the
European Commission being elected directly by EU citizens, with 22% opposed to
this idea.
Most (58%) are also in favour of the designation of a justice minister for the
EU, while a third of respondents (32%) are opposed.
European public opinion is divided regarding the creation of an EU army: 47% are
opposed to this idea, with 46% in favour.
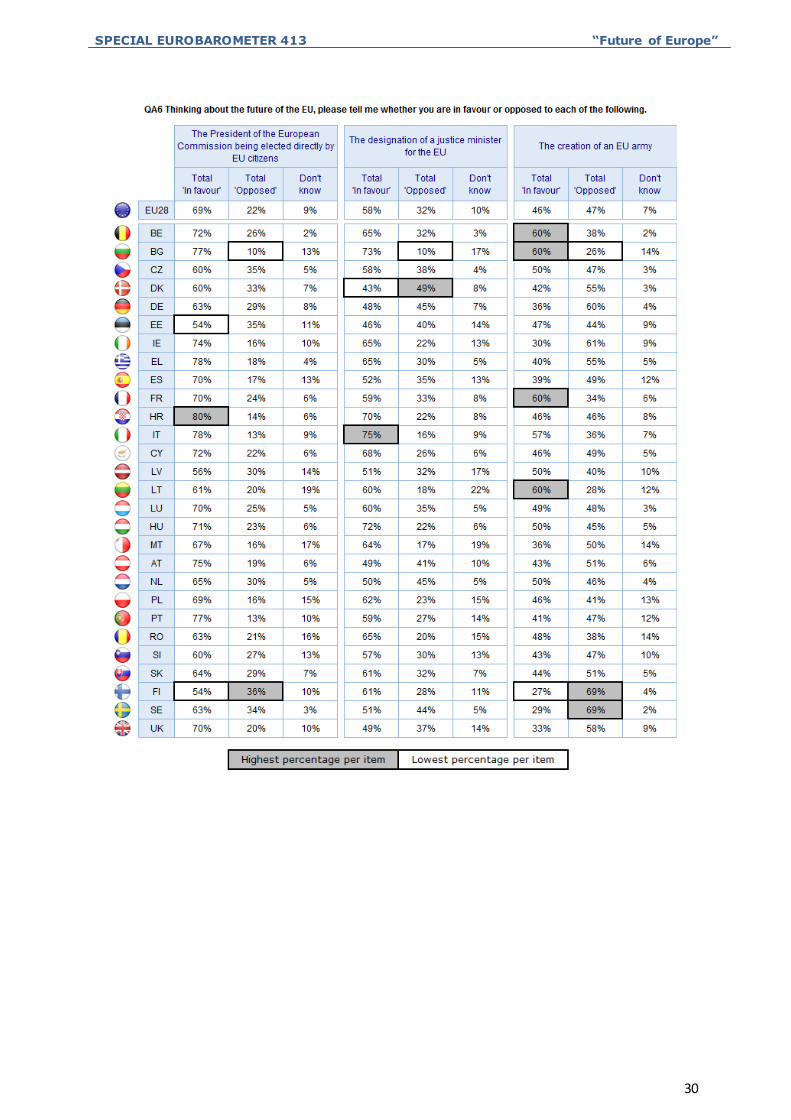
More than 50% of respondents in all Member States are in favour of the
President of the European Commission being elected directly by EU citizens . The
level of approval for this idea ranges from 80% in Croatia to 54% in both Estonia and
Finland.
A majority of people in 27 out of 28 countries also support the designation of a
justice minister for the EU, the only exception being Denmark. Support for this idea is
strongest in Italy (75%) and Bulgaria (73%).
In 13 countries, a majority of people are in favour of an EU army, with support for this
proposal highest in Belgium, Bulgaria, France and Lithuania (all 60%). However, in 14
countries a majority of people are opposed, with the proportion of respondents who are
against the idea highest in Finland and Sweden (both 69%).
SPECIAL EUROBAROMETER 413 “Future of Europe”
30
SPECIAL EUROBAROMETER 413 “Future of Europe”
31
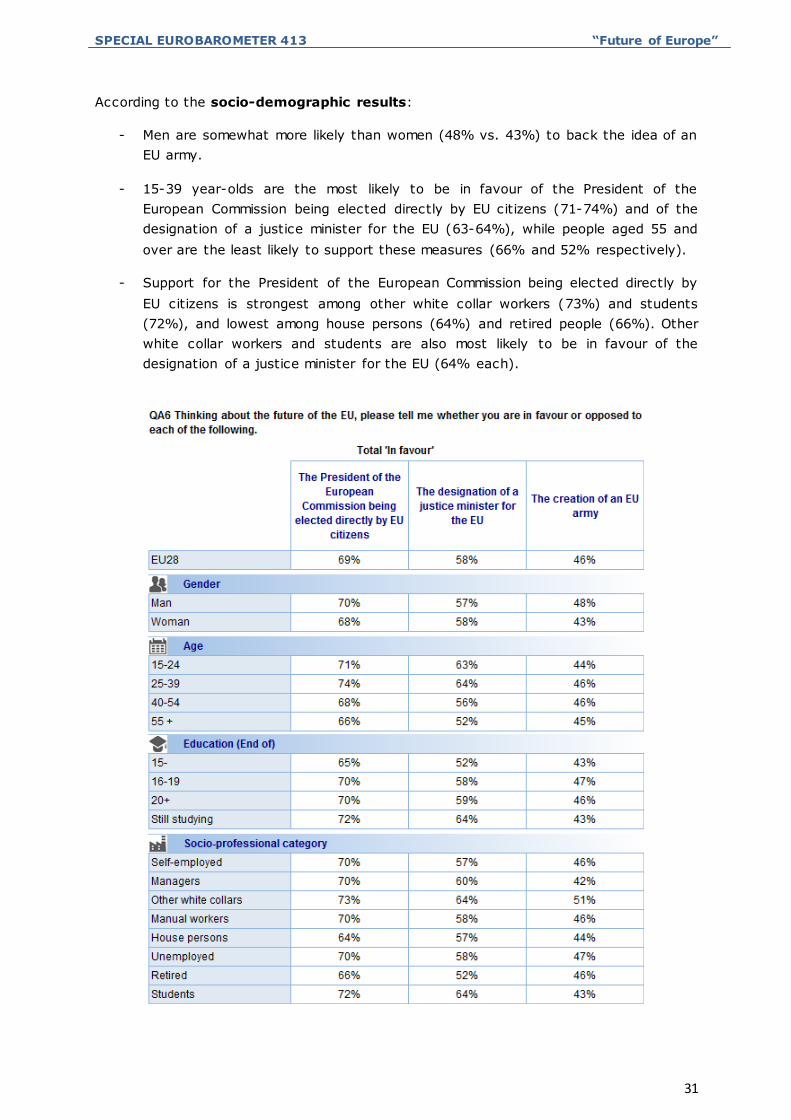
According to the socio-demographic results:
- Men are somewhat more likely than women (48% vs. 43%) to back the idea of an
EU army.
- 15-39 year-olds are the most likely to be in favour of the President of the
European Commission being elected directly by EU citizens (71-74%) and of the
designation of a justice minister for the EU (63-64%), while people aged 55 and
over are the least likely to support these measures (66% and 52% respectively).
- Support for the President of the European Commission being elected directly by
EU citizens is strongest among other white collar workers (73%) and students
(72%), and lowest among house persons (64%) and retired people (66%). Other
white collar workers and students are also most likely to be in favour of the
designation of a justice minister for the EU (64% each).
SPECIAL EUROBAROMETER 413 “Future of Europe”
32
CONCLUSIONS
While the previous wave of this survey was conducted in a period of serious political and
economic uncertainty for the European Union, this latest edition was carried out at a time
when Europe had grown more stable again. Although political and economic concerns
remain, the future of the euro now looks far more secure, and most European economies
have returned to growth.
This state of affairs is reflected in the survey’s findings. In general, respondents still have
concerns about the EU and its future, but these concerns appear less acute than they did
in November-December 2012.
For example, fewer people expect the life of today's children to be more difficult than
that of the people of their generation, and more people expect it to be easier. The mood
varies between countries: for instance, three quarters of people in Greece think that their
children can expect a more difficult life, nearly three times the number who feel this way
in Croatia and Lithuania.
There are also signs of a shift in the way Europeans think society should deal with these
new challenges. Around half now say that the emphasis needs to be on social equality
and solidarity – more than felt this way in 2012 – with fewer people now wishing to
emphasise economic approaches such as free trade, or progress and innovation. This is
an important finding that suggests increasing numbers of people support a change in
direction when it comes to addressing future problems.
Most Europeans also still support more EU-level decision-making on important policy
areas, such as protecting the environment and tackling unemployment.
Nonetheless, it is clear that most respondents still feel the EU needs to play a cent ral role
in addressing Europe’s main problems. A majority of Europeans, for example, identify
unemployment as one of the EU’s top challenges, and over six out of ten people argue
for more EU-level decision-making in order to help tackle it.
Europeans also show flexibility when it comes to adapting to future challenges. A narrow
majority support a “two-speed Europe” that would free Member States to implement new
policies without having to wait until all other EU countries are ready, and there is also
strong support for certain institutional innovations, notably the direct election of the
President of the European Commission and the designation of an EU justice minister.
Europeans are divided about others, such as the creation of an EU army: while some
countries are strongly in favour, others are equally strongly opposed to this idea.

ANNEXES
TECHNICAL SPECIFICATIONS
SPECIAL EUROBAROMETER 413 “Future of Europe”
SPECIAL EUROBAROMETER XXX “Title”
TS1
SPECIAL EUROBAROMETER 413 Future of Europe
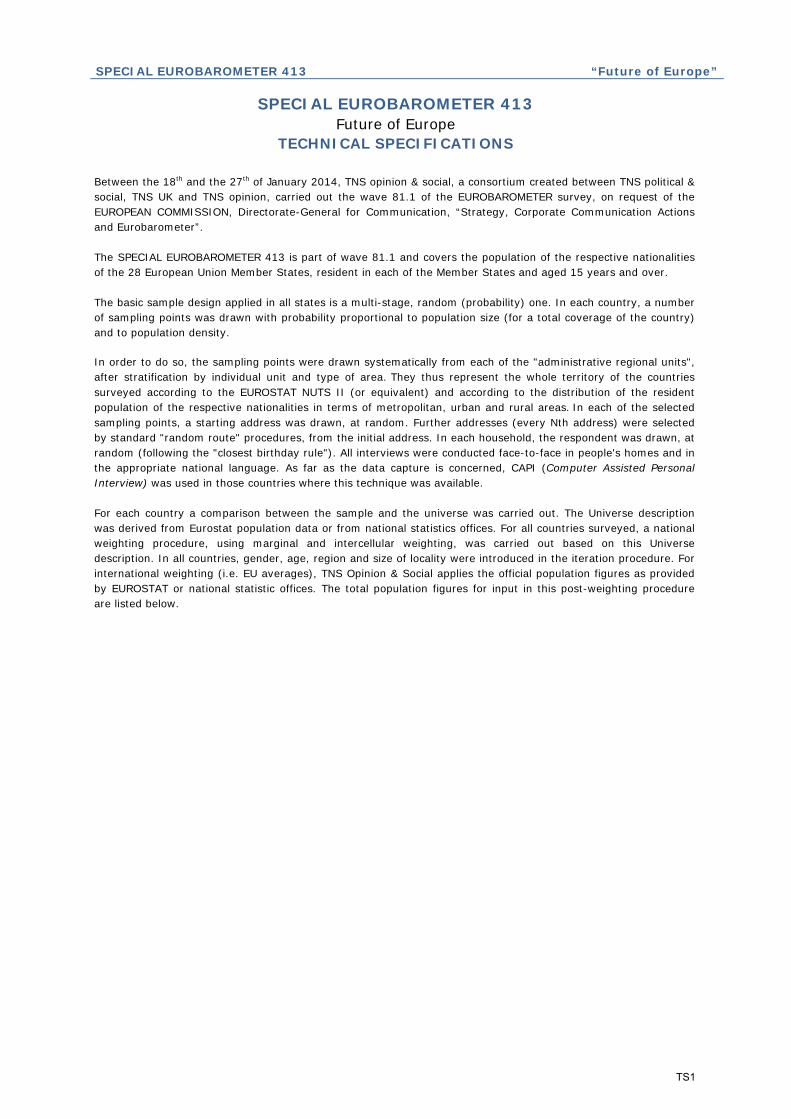
TECHNICAL SPECIFICATIONS Between the 18th and the 27th of January 2014, TNS opinion & social, a consortium created between TNS political & social, TNS UK and TNS opinion, carried out the wave 81.1 of the EUROBAROMETER survey, on request of the EUROPEAN COMMISSION, Directorate-General for Communication, “Strategy, Corporate Communication Actions and Eurobarometer”. The SPECIAL EUROBAROMETER 413 is part of wave 81.1 and covers the population of the respective nationalities of the 28 European Union Member States, resident in each of the Member States and aged 15 years and over. The basic sample design applied in all states is a multi-stage, random (probability) one. In each country, a number of sampling points was drawn with probability proportional to population size (for a total coverage of the country) and to population density.
In order to do so, the sampling points were drawn systematically from each of the "administrative regional units", after stratification by individual unit and type of area. They thus represent the whole territory of the countries surveyed according to the EUROSTAT NUTS II (or equivalent) and according to the distribution of the resident population of the respective nationalities in terms of metropolitan, urban and rural areas. In each of the selected sampling points, a starting address was drawn, at random. Further addresses (every Nth address) were selected by standard "random route" procedures, from the initial address. In each household, the respondent was drawn, at random (following the "closest birthday rule"). All interviews were conducted face-to-face in people's homes and in the appropriate national language. As far as the data capture is concerned, CAPI (Computer Assisted Personal Interview) was used in those countries where this technique was available. For each country a comparison between the sample and the universe was carried out. The Universe description was derived from Eurostat population data or from national statistics offices. For all countries surveyed, a national weighting procedure, using marginal and intercellular weighting, was carried out based on this Universe description. In all countries, gender, age, region and size of locality were introduced in the iteration procedure. For international weighting (i.e. EU averages), TNS Opinion & Social applies the official population figures as provided by EUROSTAT or national statistic offices. The total population figures for input in this post-weighting procedure are listed below.
TS1

SPECIAL EUROBAROMETER 413 “Future of Europe”
SPECIAL EUROBAROMETER XXX “Title”
TS2
TS2
SPECIAL EUROBAROMETER 413 “Future of Europe”
SPECIAL EUROBAROMETER XXX “Title”
TS3
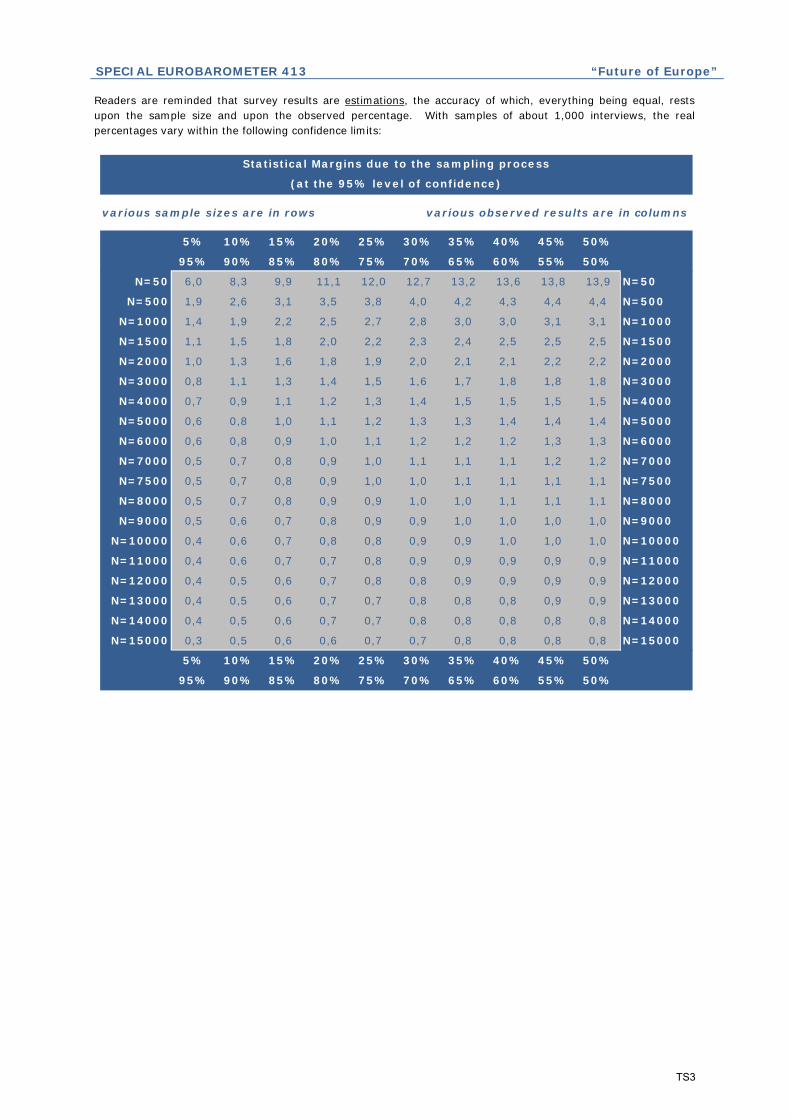
Readers are reminded that survey results are estimations, the accuracy of which, everything being equal, rests upon the sample size and upon the observed percentage. With samples of about 1,000 interviews, the real percentages vary within the following confidence limits:
various sample sizes are in rows various observed results are in columns
5% 10% 15% 20% 25% 30% 35% 40% 45% 50%
95% 90% 85% 80% 75% 70% 65% 60% 55% 50%
N=50 6,0 8,3 9,9 11,1 12,0 12,7 13,2 13,6 13,8 13,9 N=50
N=500 1,9 2,6 3,1 3,5 3,8 4,0 4,2 4,3 4,4 4,4 N=500
N=1000 1,4 1,9 2,2 2,5 2,7 2,8 3,0 3,0 3,1 3,1 N=1000
N=1500 1,1 1,5 1,8 2,0 2,2 2,3 2,4 2,5 2,5 2,5 N=1500
N=2000 1,0 1,3 1,6 1,8 1,9 2,0 2,1 2,1 2,2 2,2 N=2000
N=3000 0,8 1,1 1,3 1,4 1,5 1,6 1,7 1,8 1,8 1,8 N=3000
N=4000 0,7 0,9 1,1 1,2 1,3 1,4 1,5 1,5 1,5 1,5 N=4000
N=5000 0,6 0,8 1,0 1,1 1,2 1,3 1,3 1,4 1,4 1,4 N=5000
N=6000 0,6 0,8 0,9 1,0 1,1 1,2 1,2 1,2 1,3 1,3 N=6000
N=7000 0,5 0,7 0,8 0,9 1,0 1,1 1,1 1,1 1,2 1,2 N=7000
N=7500 0,5 0,7 0,8 0,9 1,0 1,0 1,1 1,1 1,1 1,1 N=7500
N=8000 0,5 0,7 0,8 0,9 0,9 1,0 1,0 1,1 1,1 1,1 N=8000
N=9000 0,5 0,6 0,7 0,8 0,9 0,9 1,0 1,0 1,0 1,0 N=9000
N=10000 0,4 0,6 0,7 0,8 0,8 0,9 0,9 1,0 1,0 1,0 N=10000
N=11000 0,4 0,6 0,7 0,7 0,8 0,9 0,9 0,9 0,9 0,9 N=11000
N=12000 0,4 0,5 0,6 0,7 0,8 0,8 0,9 0,9 0,9 0,9 N=12000
N=13000 0,4 0,5 0,6 0,7 0,7 0,8 0,8 0,8 0,9 0,9 N=13000
N=14000 0,4 0,5 0,6 0,7 0,7 0,8 0,8 0,8 0,8 0,8 N=14000
N=15000 0,3 0,5 0,6 0,6 0,7 0,7 0,8 0,8 0,8 0,8 N=15000
5% 10% 15% 20% 25% 30% 35% 40% 45% 50%
95% 90% 85% 80% 75% 70% 65% 60% 55% 50%
Statistical Margins due to the sampling process
(at the 95% level of confidence)
TS3

QUESTIONNAIRE
SPECIAL EUROBAROMETER 413 “Future of Europe”
QA1
1234
QA2a
QA2b
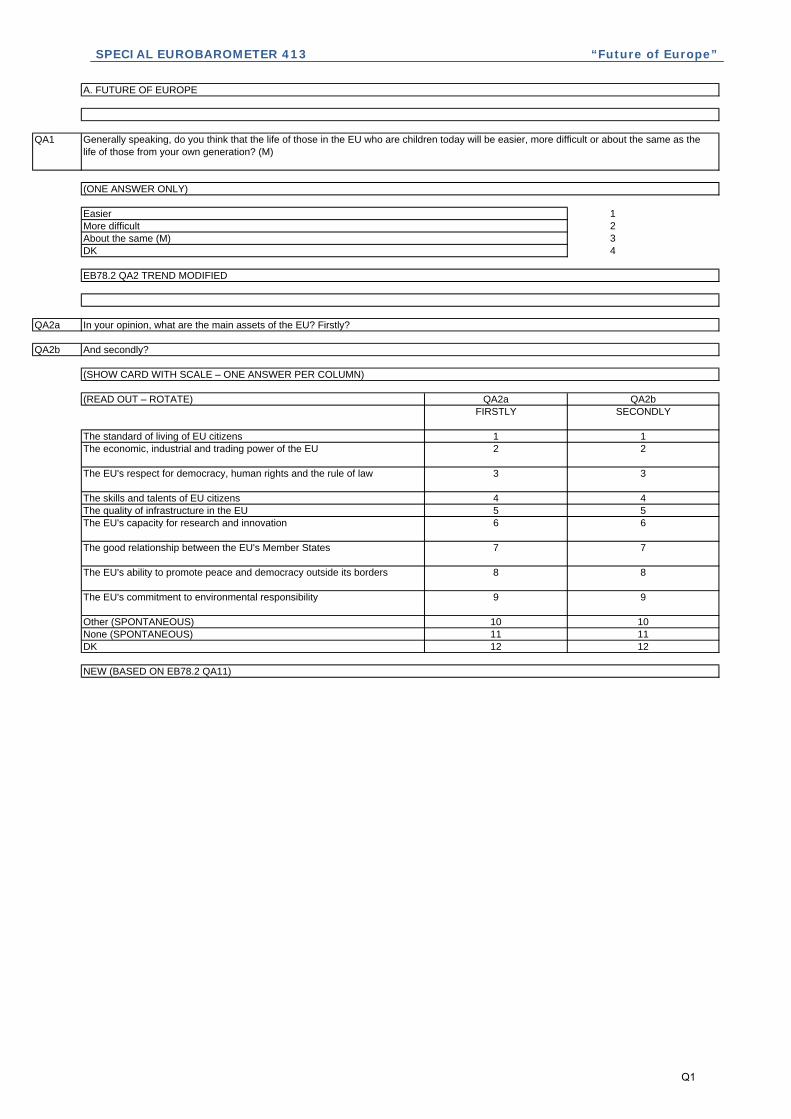
A. FUTURE OF EUROPE
Generally speaking, do you think that the life of those in the EU who are children today will be easier, more difficult or about the same as the life of those from your own generation? (M)
(ONE ANSWER ONLY)
Easier More difficultAbout the same (M)DK
EB78.2 QA2 TREND MODIFIED
In your opinion, what are the main assets of the EU? Firstly?
And secondly?
(SHOW CARD WITH SCALE – ONE ANSWER PER COLUMN)
(READ OUT – ROTATE) QA2a QA2bFIRSTLY SECONDLY
The standard of living of EU citizens 1 1The economic, industrial and trading power of the EU 2 2
The EU's respect for democracy, human rights and the rule of law 3 3
The skills and talents of EU citizens 4 4The quality of infrastructure in the EU 5 5The EU's capacity for research and innovation 6 6
The good relationship between the EU's Member States 7 7
The EU's ability to promote peace and democracy outside its borders 8 8
The EU's commitment to environmental responsibility 9 9
Other (SPONTANEOUS) 10 10None (SPONTANEOUS) 11 11DK 12 12
NEW (BASED ON EB78.2 QA11)
Q1
SPECIAL EUROBAROMETER 413 “Future of Europe”
QA3
1,2,3,4,5,6,7,8,9,
10,11,
QA4
1,2,3,4,5,6,7,8,9,
And which of the following do you think are the two main challenges for the EU?
(SHOW CARD – READ OUT – MAX. 2 ANSWERS)
The ageing of the EU's populationSocial inequalitiesCompetition from emerging countriesInsufficient economic growthThe public debt of EU Member StatesUnemploymentInstability in the regions bordering the EUEnvironmental issuesOther (SPONTANEOUS) None (SPONTANEOUS) DK
NEW (BASED ON EB78.2 QA13)
From the following items, which two should our society emphasise in order to face major global challenges?
(SHOW CARD – READ OUT – ROTATE – MAX. 2 ANSWERS)
Protecting the environmentSocial equality and solidarityFree trade\ market economyCultural diversity and openness to othersProgress and innovationTraditionsOther (SPONTANEOUS)None (SPONTANEOUS)DK
EB78.2 QA12
Q2
SPECIAL EUROBAROMETER 413 “Future of Europe”
QA5
12345
QA6
1
2
3
For each of the following areas, please tell me if you believe that more or less decision-making should take place at a European level. (M)
(SHOW CARD WITH SCALE – ONE ANSWER PER LINE)
(READ OUT – ROTATE) More decision-making at a
European level
Less decision-making at a
European level
No change is needed
(SPONTANEOUS)
DK
Economic policy and taxation (N) 1 2 3 4Health and social security (N) 1 2 3 4Tackling unemployment 1 2 3 4Immigration issues (N) 1 2 3 4Protecting the environment 1 2 3 4
EB78.2 QA15 TREND MODIFIED
Thinking about the future of the EU, please tell me whether you are in favour or opposed to each of the following.
(SHOW CARD WITH SCALE – ONE ANSWER PER LINE)
(READ OUT – ROTATE) Totally in favour Somewhat in favour Some-what opposed Totally opposed DK
The creation of an EU army 1 2 3 4 5
The President of the European Commission being elected directly by EU citizens
1 2 3 4 5
The designation of a justice minister for the EU
1 2 3 4 5
NEW
Q3
SPECIAL EUROBAROMETER 413 “Future of Europe”
QA7
1
23
QA8
Much stronger
Some-what
stronger
Some-what
weaker
Much weaker
The same (SPONTA-NEOUS)
DK
1 1 2 3 4 5 62 1 2 3 4 5 63 1 2 3 4 5 64 1 2 3 4 5 65 1 2 3 4 5 66 1 2 3 4 5 6
As regards the idea of a "TWO SPEED EUROPE", which of the following comes closest to your personal preference? Those countries which are ready to intensify the development of a common European policy in certain important areas...
(READ OUT – ONE ANSWER ONLY)
Should do so without having to wait for the othersShould wait until all Member States of the EU are ready for this
DK
EB78.2 QA22
Looking ahead to the year 2020, do you think that the overall influence of the EU will be stronger or weaker than that of…?
(SHOW CARD WITH SCALE – ONE ANSWER PER LINE)
(READ OUT)
The United StatesJapanChinaIndiaBrazil Russia
NEW (BASED ON EB78.2 QA5)
Q4

TABLES
SPECIAL EUROBAROMETER 413 “Future of Europe”
% EB81.1
Diff.EB
78.2
EB81.1
Diff.EB
78.2
EB81.1
Diff.EB
78.2
EB81.1
Diff.EB
78.2
EU 28 22 7 56 -8 19 1 3 0
BE 12 0 70 -2 17 2 1 0
BG 35 7 32 -4 22 -2 11 -1
CZ 16 8 56 -7 27 -1 1 0
DK 23 4 45 -10 30 5 2 1
DE 14 7 62 -8 23 2 1 -1
EE 33 12 46 -10 19 -2 2 0
IE 39 23 40 -28 17 4 4 1
EL 12 4 75 -7 12 3 1 0
ES 22 6 65 -11 11 5 2 0
FR 10 5 71 -9 17 4 2 0
HR 41 11 28 -25 27 13 4 1
IT 26 8 54 1 17 -7 3 -2
CY 15 4 73 -8 10 3 2 1
LV 33 9 30 -12 32 4 5 -1
LT 39 8 28 -12 27 3 6 1
LU 18 7 66 -11 15 5 1 -1
HU 27 9 50 -11 21 2 2 0
MT 43 23 38 -27 13 1 6 3
NL 18 4 51 -3 30 0 1 -1
AT 18 1 51 2 28 -4 3 1
PL 39 10 35 -9 21 -2 5 1
PT 56 28 37 -16 5 -12 2 0
RO 29 12 44 -15 20 3 7 0
SI 18 4 64 -2 16 -2 2 0
SK 23 2 47 -4 28 2 2 0
FI 37 3 40 -2 23 0 0 -1
SE 18 7 53 -12 28 6 1 -1
UK 19 4 60 -10 18 5 3 1
A peu près la même
About the same
Etwa genauso
NSP
DK
WN
Plus facile
Easier
Leichter
Plus difficile
More difficult
Schwieriger
QA1 En général, pensez-vous que la vie de ceux qui sont enfants aujourd'hui dans l’UE sera plus facile, plus difficile ou à peu près la même que pour ceux de votre génération ?
QA1 Generally speaking, do you think that the life of those in the EU who are children today will be easier, more difficult or about the same as the life of those from your own generation?
QA1 Was meinen Sie ganz allgemein? Wird das Leben der heutigen Kinder in der EU leichter, schwieriger oder etwa genauso wie das Leben Ihrer eigenen Generation werden?
T1
SPECIAL EUROBAROMETER 413 “Future of Europe”
%
EU 28
BE
BG
CZ
DK
DE
EE
IE
EL
ES
FR
HR
IT
CY
LV
LT
LU
HU
MT
NL
AT
PL
PT
RO
SI
SK
FI
SE
UK 14 21 14 6
5 17 38 7
10 14 17 7
11 18 11 7
18 17 9 2
36 20 15 2
14 18 8 3
22 15 10 2
17 16 17 6
8 28 20 2
27 17 20 3
18 17 15 5
13 23 20 5
21 22 13 4
22 14 15 4
12 10 17 3
7 21 15 7
22 23 19 4
10 16 18 5
10 20 15 6
10 11 10 5
21 24 8 13
10 20 25 2
17 23 14 4
16 6
8 27 27 1
14 18 14 6
14 19 17 5
41 16 15 3
17 17
La puissance économique, industrielle et commerciale de l’UE
The economic, industrial and trading power of the
EU
Die Wirtschafts-, Industrie- und
Handelsmacht der EU
EB81.1
Les compétences et les talents des citoyens de
l’UE
The skills and talents of EU citizens
Die Fähigkeiten und Fertigkeiten der EU-
Bürger
EB81.1
Le niveau de vie des citoyens de l’UE
The standard of living of EU citizens
Der Lebensstandard der EU-Bürger
EB81.1
Le respect de l’UE pour la démocratie, les droits de l’homme et l’Etat de
droit
The EU's respect for democracy, human
rights and the rule of law
Die Achtung der Demokratie, der
Menschenrechte und der Rechtsstaatlichkeit in der
EU
EB81.1
QA2a A votre avis, quels sont les principaux atouts de l’UE aujourd’hui ? Premièrement ?
QA2a In your opinion, what are the main assets of the EU? Firstly?
QA2a Welches sind Ihrer Meinung nach die wichtigsten Vorzüge der EU? Welches ist der erste?
T2
SPECIAL EUROBAROMETER 413 “Future of Europe”
%
EU 28
BE
BG
CZ
DK
DE
EE
IE
EL
ES
FR
HR
IT
CY
LV
LT
LU
HU
MT
NL
AT
PL
PT
RO
SI
SK
FI
SE
UK
QA2a A votre avis, quels sont les principaux atouts de l’UE aujourd’hui ? Premièrement ?
QA2a In your opinion, what are the main assets of the EU? Firstly?
QA2a Welches sind Ihrer Meinung nach die wichtigsten Vorzüge der EU? Welches ist der erste?
La qualité des infrastructures dans l’UE
Les capacités de l’UE pour la recherche et de
l’innovation
Les bonnes relations entre Etats membres de
l’UE
La capacité de l’UE à promouvoir la paix et la démocratie en dehors de
ses frontières
The quality of infrastructure in the EU
The EU's capacity for research and innovation
The good relationship between the EU's Member States
The EU's ability to promote peace and
democracy outside its borders
Die Qualität der Infrastruktur in der EU
Die Kapazitäten für Forschung und
Innovation in der EU
Die guten Beziehungen zwischen den EU-Mitgliedstaaten
Die Fähigkeit der EU, Frieden und Demokratie jenseits der EU-Grenzen
zu fördern
EB81.1
EB81.1
EB81.1
EB81.1
4 4 13 8
3 4 17 8
2 2 9 5
4 6 17 8
1 4 12 8
3 3 16 13
4 5 15 5
8 3 8 7
8 7 15 8
6 6 12 7
4 5 14 12
5 5 8 5
5 7 13 6
4 6 16 12
5 2 12 7
3 4 13 8
3 3 15 9
7 3 12 9
3 5 7 5
3 2 16 8
7 6 10 7
9 4 17 5
6 4 17 6
5 2 7 4
5 4 15 6
5 6 19 9
3 3 15 14
2 3 10 10
2 2 8 6
T3
SPECIAL EUROBAROMETER 413 “Future of Europe”
%
EU 28
BE
BG
CZ
DK
DE
EE
IE
EL
ES
FR
HR
IT
CY
LV
LT
LU
HU
MT
NL
AT
PL
PT
RO
SI
SK
FI
SE
UK 3 1 12 11
5 1 1 1
8 2 5 2
3 3 6 2
6 6 10 2
2 0 3 4
2 1 15 6
4 2 5 5
5 2 6 1
3 4 4 2
6 0 1 6
5 2 5 2
1 3 2 3
2 1 5 4
3 2 8 6
5 1 12 2
5 0 9 5
3 0 4 2
5 1 6 4
3 1 10 4
3 1 21 1
2 1 5 0
2 3 4 4
3 1 3 1
6 0 2 4
6 1 5 1
2 1 1 3
5 1 4 2
4 1 7 4
EB81.1
EB81.1
EB81.1
EB81.1
Die Verpflichtung der EU zu ökologisch
verantwortungsvollem Handeln
Andere (SPONTAN)
Nichts davon (SPONTAN) WN
The EU's commitment to environmental responsibility
Other (SPONTANEOUS)
None (SPONTANEOUS) DK
L’engagement de l’UE en matière de responsabilité
environnementale
Autre (SPONTANE)
Aucun (SPONTANE) NSP
QA2a A votre avis, quels sont les principaux atouts de l’UE aujourd’hui ? Premièrement ?
QA2a In your opinion, what are the main assets of the EU? Firstly?
QA2a Welches sind Ihrer Meinung nach die wichtigsten Vorzüge der EU? Welches ist der erste?
T4
SPECIAL EUROBAROMETER 413 “Future of Europe”
%
EU 28
BE
BG
CZ
DK
DE
EE
IE
EL
ES
FR
HR
IT
CY
LV
LT
LU
HU
MT
NL
AT
PL
PT
RO
SI
SK
FI
SE
UK 11 16 17 12
7 14 18 5
9 13 17 8
7 19 10 8
12 14 14 3
13 20 14 3
10 17 13 6
15 18 15 5
12 16 14 6
13 20 18 4
13 11 17 12
13 16 15 9
14 11 15 6
19 20 14 7
17 15 15 6
7 12 12 5
8 16 15 10
19 21 15 5
9 14 13 7
11 14 12 6
11 14 11 7
14 16 13 14
11 20 13 7
12 14 17 4
9 17 20 4
14 15 16 9
17 22 18 6
14 15 16 8
11 16 15 7
Die Fähigkeiten und Fertigkeiten der EU-
Bürger
EB81.1
La puissance économique, industrielle et commerciale de l’UE
The economic, industrial and trading power of the
EU
Die Wirtschafts-, Industrie- und
Handelsmacht der EU
EB81.1
Les compétences et les talents des citoyens de
l’UE
The skills and talents of EU citizens
Le niveau de vie des citoyens de l’UE
The standard of living of EU citizens
Der Lebensstandard der EU-Bürger
EB81.1
Le respect de l’UE pour la démocratie, les droits de l’homme et l’Etat de
droit
The EU's respect for democracy, human
rights and the rule of law
Die Achtung der Demokratie, der
Menschenrechte und der Rechtsstaatlichkeit in der
EU
EB81.1
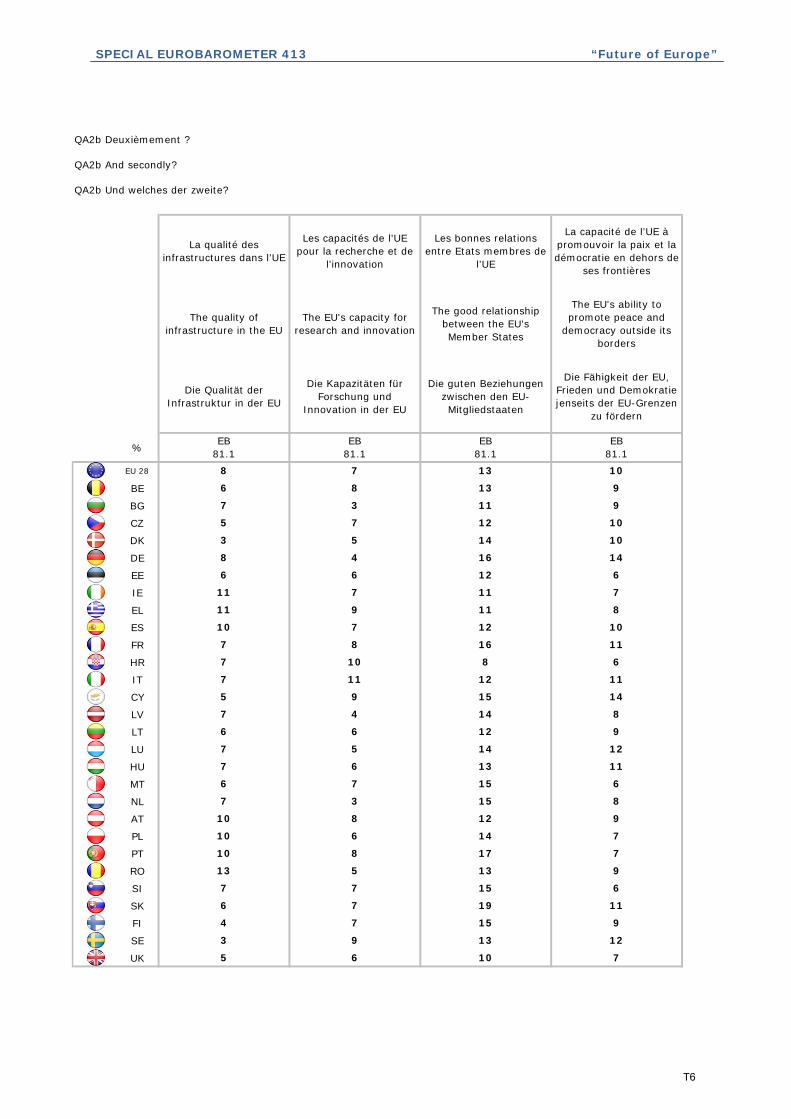
QA2b Deuxièmement ?
QA2b And secondly?
QA2b Und welches der zweite?
T5
SPECIAL EUROBAROMETER 413 “Future of Europe”
%
EU 28
BE
BG
CZ
DK
DE
EE
IE
EL
ES
FR
HR
IT
CY
LV
LT
LU
HU
MT
NL
AT
PL
PT
RO
SI
SK
FI
SE
UK 10 75 6
13 123 9
15 94 7
19 116 7
15 67 7
13 913 5
17 710 8
14 710 6
12 910 8
15 87 3
15 66 7
13 117 6
14 127 5
12 96 6
14 87 4
15 145 9
12 117 11
8 67 10
16 117 8
12 1010 7
11 811 9
11 711 7
12 66 6
16 148 4
14 103 5
12 105 7
11 97 3
13 96 8
13 108 7
EB81.1
EB81.1
EB81.1
EB81.1
Die guten Beziehungen zwischen den EU-Mitgliedstaaten
Die Fähigkeit der EU, Frieden und Demokratie jenseits der EU-Grenzen
zu fördern
Die Qualität der Infrastruktur in der EU
Die Kapazitäten für Forschung und
Innovation in der EU
The good relationship between the EU's Member States
The EU's ability to promote peace and
democracy outside its borders
The quality of infrastructure in the EU
The EU's capacity for research and innovation
La qualité des infrastructures dans l’UE
Les capacités de l’UE pour la recherche et de
l’innovation
Les bonnes relations entre Etats membres de
l’UE
La capacité de l’UE à promouvoir la paix et la démocratie en dehors de
ses frontières
QA2b Deuxièmement ?
QA2b And secondly?
QA2b Und welches der zweite?
T6
SPECIAL EUROBAROMETER 413 “Future of Europe”
%
EU 28
BE
BG
CZ
DK
DE
EE
IE
EL
ES
FR
HR
IT
CY
LV
LT
LU
HU
MT
NL
AT
PL
PT
RO
SI
SK
FI
SE
UK 5 0 6 5
14 1 3 1
9 2 6 1
5 2 5 1
7 3 9 3
6 0 1 3
4 2 4 2
4 1 2 3
7 2 3 1
6 2 3 1
8 0 1 4
7 0 2 1
8 2 4 2
3 1 2 1
6 1 3 4
14 1 4 2
6 1 2 1
5 0 2 2
9 0 3 3
6 1 9 2
6 1 10 1
3 0 2 2
7 2 5 5
8 1 1 1
13 1 2 2
9 0 2 1
4 0 2 1
7 1 3 0
7 1 3 2
EB81.1
EB81.1
EB81.1
EB81.1
Die Verpflichtung der EU zu ökologisch
verantwortungsvollem Handeln
Andere (SPONTAN)
Nichts davon (SPONTAN) WN
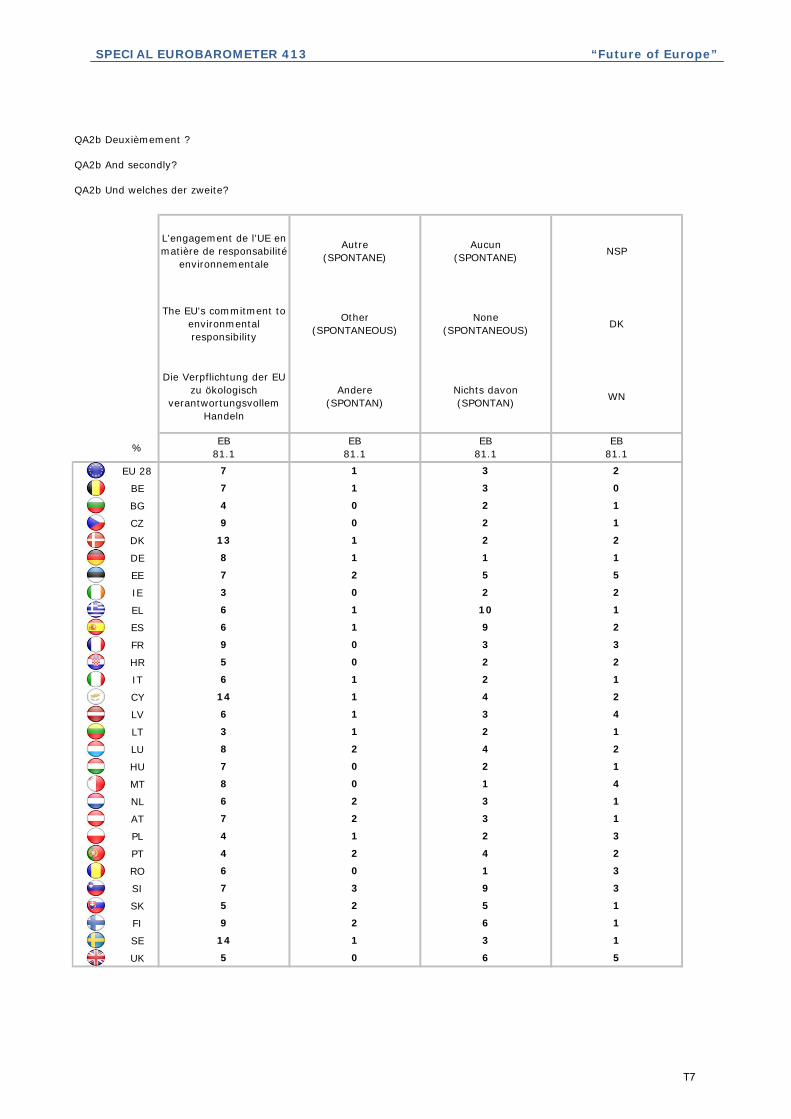
The EU's commitment to environmental responsibility
Other (SPONTANEOUS)
None (SPONTANEOUS) DK
L’engagement de l’UE en matière de responsabilité
environnementale
Autre (SPONTANE)
Aucun (SPONTANE) NSP
QA2b Deuxièmement ?
QA2b And secondly?
QA2b Und welches der zweite?
T7

SPECIAL EUROBAROMETER 413 “Future of Europe”
%
EU 28
BE
BG
CZ
DK
DE
EE
IE
EL
ES
FR
HR
IT
CY
LV
LT
LU
HU
MT
NL
AT
PL
PT
RO
SI
SK
FI
SE
UK 23 33 28 15
11 31 56 11
18 27 33 15
17 35 20 14
28 29 21 5
48 39 28 5
22 31 18 8
36 31 24 7
28 31 30 12
20 47 36 6
39 28 36 15
30 33 29 13
27 34 34 11
38 41 26 10
37 26 28 9
17 21 28 7
14 35 28 15
40 43 33 9
17 29 31 11
20 32 25 11
18 22 18 10
35 39 20 25
27 41 25 10
21 33 42 6
16 43 46 5
27 32 29 14
57 37 33 9
30 31 31 13
24 33 31 11
Die Fähigkeiten und Fertigkeiten der EU-
Bürger
EB81.1
La puissance économique, industrielle et commerciale de l’UE
The economic, industrial and trading power of the
EU
Die Wirtschafts-, Industrie- und
Handelsmacht der EU
EB81.1
Les compétences et les talents des citoyens de
l’UE
The skills and talents of EU citizens
Le niveau de vie des citoyens de l’UE
The standard of living of EU citizens
Der Lebensstandard der EU-Bürger
EB81.1
Le respect de l’UE pour la démocratie, les droits de l’homme et l’Etat de
droit
The EU's respect for democracy, human
rights and the rule of law
Die Achtung der Demokratie, der
Menschenrechte und der Rechtsstaatlichkeit in der
EU
EB81.1
QA2T - A votre avis, quels sont les principaux atouts de l'UE aujourd'hui ? Deuxièmement ?
QA2T - In your opinion, which are the main assets of the EU? And secondly?
QA2T - Welches sind Ihrer Meinung nach die wichtigsten Vorzüge der EU? Und welches der zweite?
T8

SPECIAL EUROBAROMETER 413 “Future of Europe”
%
EU 28
BE
BG
CZ
DK
DE
EE
IE
EL
ES
FR
HR
IT
CY
LV
LT
LU
HU
MT
NL
AT
PL
PT
RO
SI
SK
FI
SE
UK 16 115 7
23 215 11
29 237 9
37 1911 12
29 1211 10
19 1217 7
30 1214 10
29 1118 9
22 1517 13
29 1610 5
20 118 11
23 2013 8
28 2010 8
25 169 9
25 1412 6
29 249 14
23 1611 17
16 1111 14
28 2210 12
22 1515 12
24 1416 14
19 1319 10
26 119 11
32 2610 8
26 184 8
29 189 12
20 139 5
29 179 12
25 1711 10
EB81.1
EB81.1
EB81.1
EB81.1
Die guten Beziehungen zwischen den EU-Mitgliedstaaten
Die Fähigkeit der EU, Frieden und Demokratie jenseits der EU-Grenzen
zu fördern
Die Qualität der Infrastruktur in der EU
Die Kapazitäten für Forschung und
Innovation in der EU
The good relationship between the EU's Member States
The EU's ability to promote peace and
democracy outside its borders
The quality of infrastructure in the EU
The EU's capacity for research and innovation
La qualité des infrastructures dans l’UE
Les capacités de l’UE pour la recherche et de
l’innovation
Les bonnes relations entre Etats membres de
l’UE
La capacité de l’UE à promouvoir la paix et la démocratie en dehors de
ses frontières
QA2T - A votre avis, quels sont les principaux atouts de l'UE aujourd'hui ? Deuxièmement ?
QA2T - In your opinion, which are the main assets of the EU? And secondly?
QA2T - Welches sind Ihrer Meinung nach die wichtigsten Vorzüge der EU? Und welches der zweite?
T9
SPECIAL EUROBAROMETER 413 “Future of Europe”
%
EU 28
BE
BG
CZ
DK
DE
EE
IE
EL
ES
FR
HR
IT
CY
LV
LT
LU
HU
MT
NL
AT
PL
PT
RO
SI
SK
FI
SE
UK 7 1 16 11
18 1 4 1
16 3 10 2
8 4 11 2
12 9 18 2
8 1 3 4
5 2 18 6
8 2 7 5
11 3 9 1
9 5 7 2
13 0 1 6
12 2 7 2
9 3 6 3
5 2 6 4
8 2 10 6
18 1 15 2
10 1 11 5
8 1 6 2
13 1 9 4
8 2 18 4
8 2 29 1
5 1 7 0
9 3 9 4
11 2 4 1
18 1 4 3
15 1 6 1
6 1 3 2
12 1 7 1
10 2 10 4
EB81.1
EB81.1
EB81.1
EB81.1
Die Verpflichtung der EU zu ökologisch
verantwortungsvollem Handeln
Andere (SPONTAN)
Nichts davon (SPONTAN) WN
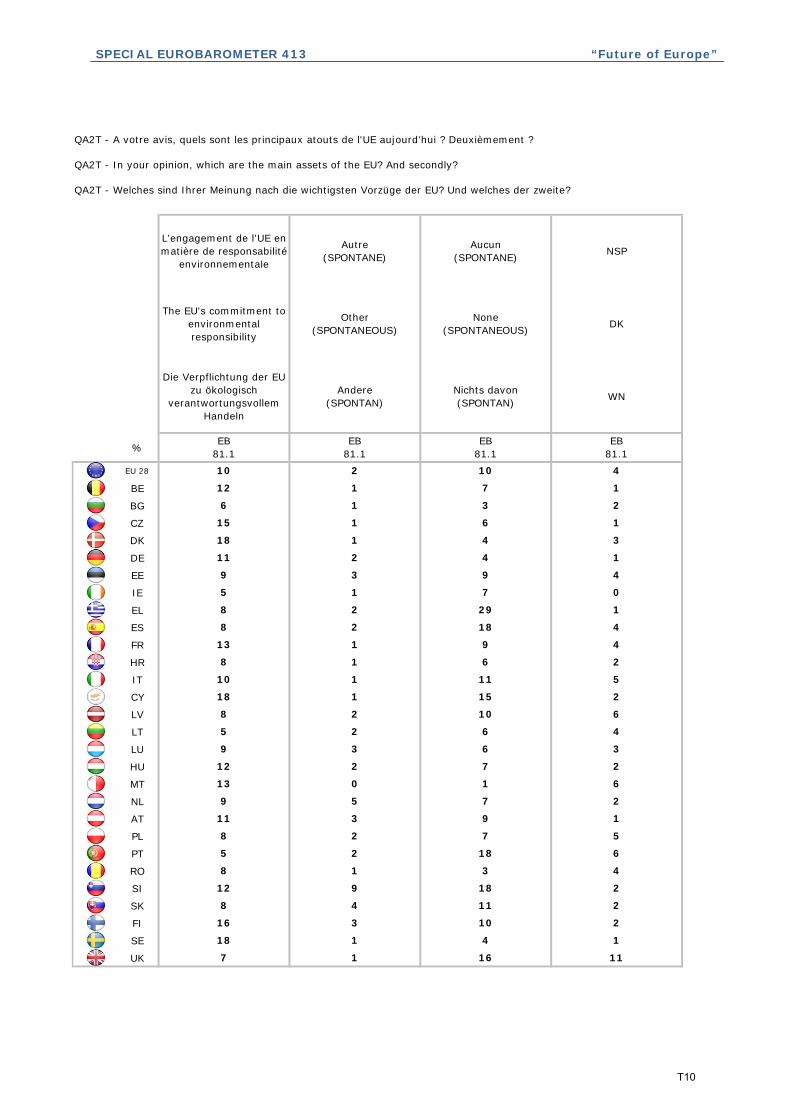
The EU's commitment to environmental responsibility
Other (SPONTANEOUS)
None (SPONTANEOUS) DK
L’engagement de l’UE en matière de responsabilité
environnementale
Autre (SPONTANE)
Aucun (SPONTANE) NSP
QA2T - A votre avis, quels sont les principaux atouts de l'UE aujourd'hui ? Deuxièmement ?
QA2T - In your opinion, which are the main assets of the EU? And secondly?
QA2T - Welches sind Ihrer Meinung nach die wichtigsten Vorzüge der EU? Und welches der zweite?
T10
SPECIAL EUROBAROMETER 413 “Future of Europe”
%
EU 28
BE
BG
CZ
DK
DE
EE
IE
EL
ES
FR
HR
IT
CY
LV
LT
LU
HU
MT
NL
AT
PL
PT
RO
SI
SK
FI
SE
UK 23 20 14 21
13 42 11 14
26 31 11 15
45 9 17
18 35 6 21
19
35 11 30
15 39 9 22
22
28 9 15
14 31 11 18
23
30 17 16
34 11 14 16
20
28 14 30
17 31 12 17
15
38 8 20
16 44 7 24
22
26 9 28
6 16 16 38
8
34 16 25
11 35 18 26
9
40 4 25
9 28 13 30
16
19 11 23
45 43 8 17
16
17 48 5 6
15 37 22 15
31 13 23
32 40 14 26
21
32 16 19
17 32 12 22
26
Mangelhaftes Wirtschaftswachstum
EB81.1
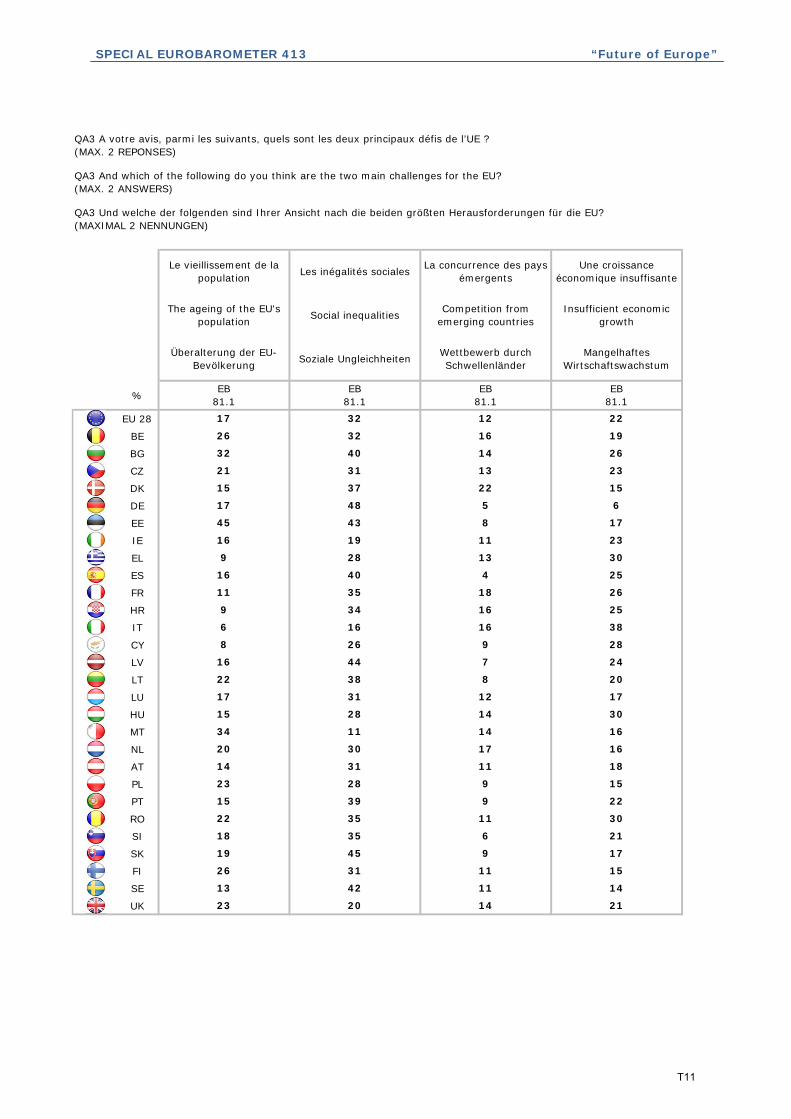
Les inégalités sociales
Social inequalities
Soziale Ungleichheiten
EB81.1
Une croissance économique insuffisante
Insufficient economic growth
Le vieillissement de la population
The ageing of the EU's population
Überalterung der EU-Bevölkerung
EB81.1
La concurrence des pays émergents
Competition from emerging countries
Wettbewerb durch Schwellenländer
EB81.1
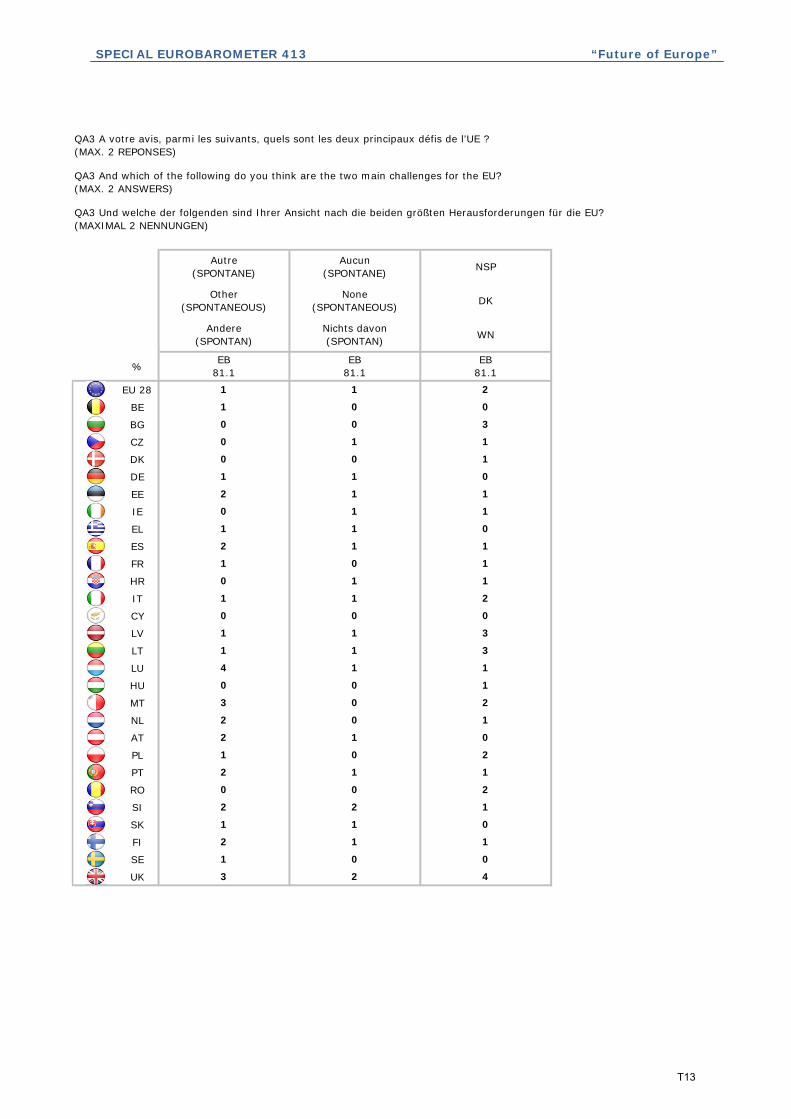
QA3 A votre avis, parmi les suivants, quels sont les deux principaux défis de l’UE ? (MAX. 2 REPONSES)
QA3 And which of the following do you think are the two main challenges for the EU? (MAX. 2 ANSWERS)
QA3 Und welche der folgenden sind Ihrer Ansicht nach die beiden größten Herausforderungen für die EU? (MAXIMAL 2 NENNUNGEN)
T11

SPECIAL EUROBAROMETER 413 “Future of Europe”
%
EU 28
BE
BG
CZ
DK
DE
EE
IE
EL
ES
FR
HR
IT
CY
LV
LT
LU
HU
MT
NL
AT
PL
PT
RO
SI
SK
FI
SE
UK 10 1031 45
55 9 31
6 9
20
33 54
56 5 3
4 8
28
20 65
48 9 11
3 1
13
26 65
68 3 4
8 8
13
46 47
46 13 14
8 10
31
33 53
55 4 7
5 10
21
22 58
52 4 5
8 6
19
15 55
78 4 5
4 5
34
26 52
59 6 6
5 9
22
31 58
67 4 4
4 4
18
34 65
64 6 9
6 5
25
11 42
37 9 9
16 11
50
20 58
50 5 7
11 6
29
13 46
51 5 14
6 8
23
29 53
EB81.1
EB81.1
EB81.1
Die Instabilität in den an die EU angrenzenden
RegionenUmweltfragen
EB81.1
Environmental issues
Die Staatsschulden von EU-Mitgliedstaaten Arbeitslosigkeit
The public debt of EU Member States Unemployment Instability in the regions
bordering the EU
La dette publique des Etats membres de l'UE Le chômage
L’instabilité dans les régions frontalières de
l’UE
Les problèmes environnementaux
QA3 A votre avis, parmi les suivants, quels sont les deux principaux défis de l’UE ? (MAX. 2 REPONSES)
QA3 And which of the following do you think are the two main challenges for the EU? (MAX. 2 ANSWERS)
QA3 Und welche der folgenden sind Ihrer Ansicht nach die beiden größten Herausforderungen für die EU? (MAXIMAL 2 NENNUNGEN)
T12
SPECIAL EUROBAROMETER 413 “Future of Europe”
%
EU 28
BE
BG
CZ
DK
DE
EE
IE
EL
ES
FR
HR
IT
CY
LV
LT
LU
HU
MT
NL
AT
PL
PT
RO
SI
SK
FI
SE
UK
QA3 A votre avis, parmi les suivants, quels sont les deux principaux défis de l’UE ? (MAX. 2 REPONSES)
QA3 And which of the following do you think are the two main challenges for the EU? (MAX. 2 ANSWERS)
QA3 Und welche der folgenden sind Ihrer Ansicht nach die beiden größten Herausforderungen für die EU? (MAXIMAL 2 NENNUNGEN)
3 2 4
1 0 0
2 1 1
1 1 0
2 2 1
0 0 2
2 1 1
1 0 2
2 1 0
2 0 1
3 0 2
0 0 1
4 1 1
1 1 3
1 1 3
0 0 0
1 1 2
0 1 1
1 0 1
2 1 1
1 1 0
0 1 1
2 1 1
1 1 0
0 0 1
0 1 1
0 0 3
1 0 0
DK
1 1 2
EB81.1
EB81.1
EB81.1
Andere (SPONTAN)
Nichts davon (SPONTAN) WN
Other (SPONTANEOUS)
None (SPONTANEOUS)
Autre (SPONTANE)
Aucun (SPONTANE) NSP
T13
SPECIAL EUROBAROMETER 413 “Future of Europe”
% EB81.1
Diff.EB
78.2
EB81.1
Diff.EB
78.2
EB81.1
Diff.EB
78.2EU 28 31 -1 49 6 28 -2
BE 34 2 52 3 26 1
BG 26 -9 60 9 39 1
CZ 33 1 45 6 33 2
DK 52 -5 44 9 29 7
DE 39 1 59 8 26 -6
EE 35 0 50 11 22 -6
IE 41 14 39 -3 29 -9
EL 23 0 59 8 29 2
ES 22 3 64 10 17 -7
FR 37 -4 54 5 26 4
HR 20 -5 45 -2 35 -10
IT 20 0 33 2 31 1
CY 29 -6 56 0 33 4
LV 27 -4 48 8 37 1
LT 22 -2 57 12 36 -6
LU 39 -8 60 9 19 -4
HU 26 0 44 5 26 -1
MT 41 -3 39 7 28 -2
NL 31 0 49 7 28 -6
AT 39 5 53 10 29 -5
PL 20 -1 43 5 28 -5
PT 18 1 59 7 28 5
RO 43 8 40 -3 37 -2
SI 30 -2 50 6 19 -3
SK 33 2 50 4 29 -7
FI 36 -8 50 9 22 0
SE 61 -9 54 9 16 0
UK 35 -3 36 3 31 0
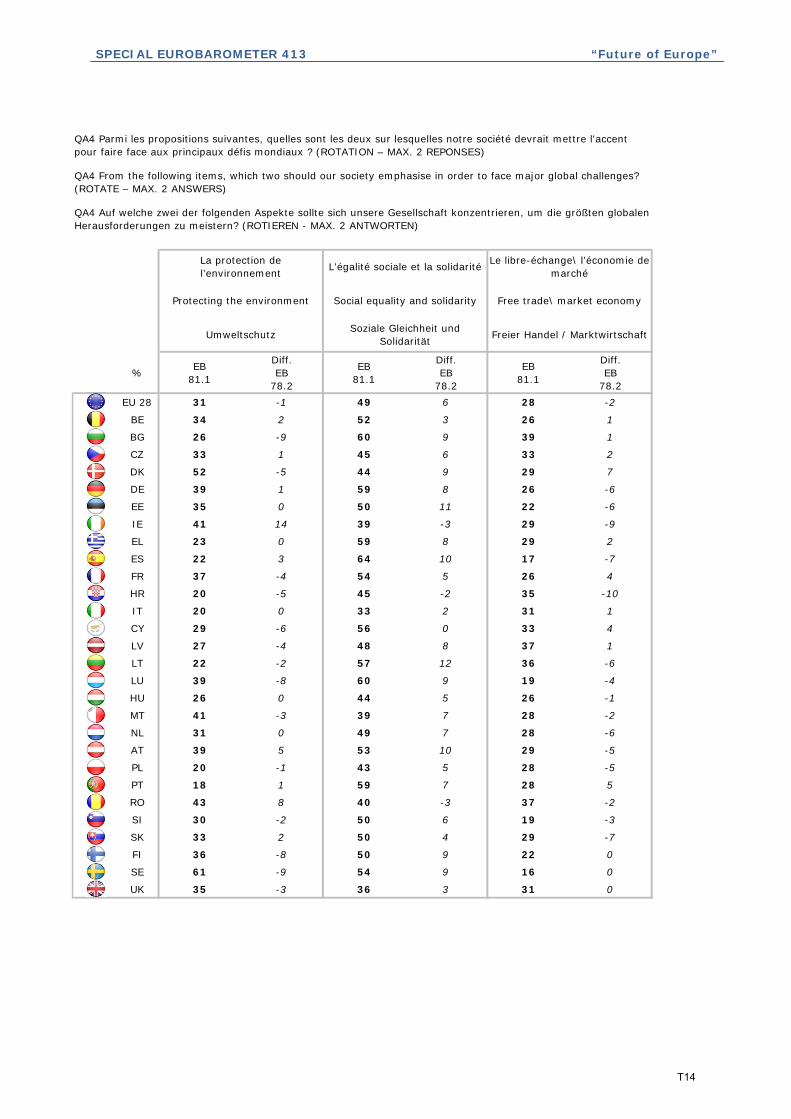
Le libre-échange\ l’économie de marché
Free trade\ market economy
Freier Handel / Marktwirtschaft
La protection de l’environnement
Protecting the environment
Umweltschutz
L’égalité sociale et la solidarité
Social equality and solidarity
Soziale Gleichheit und Solidarität
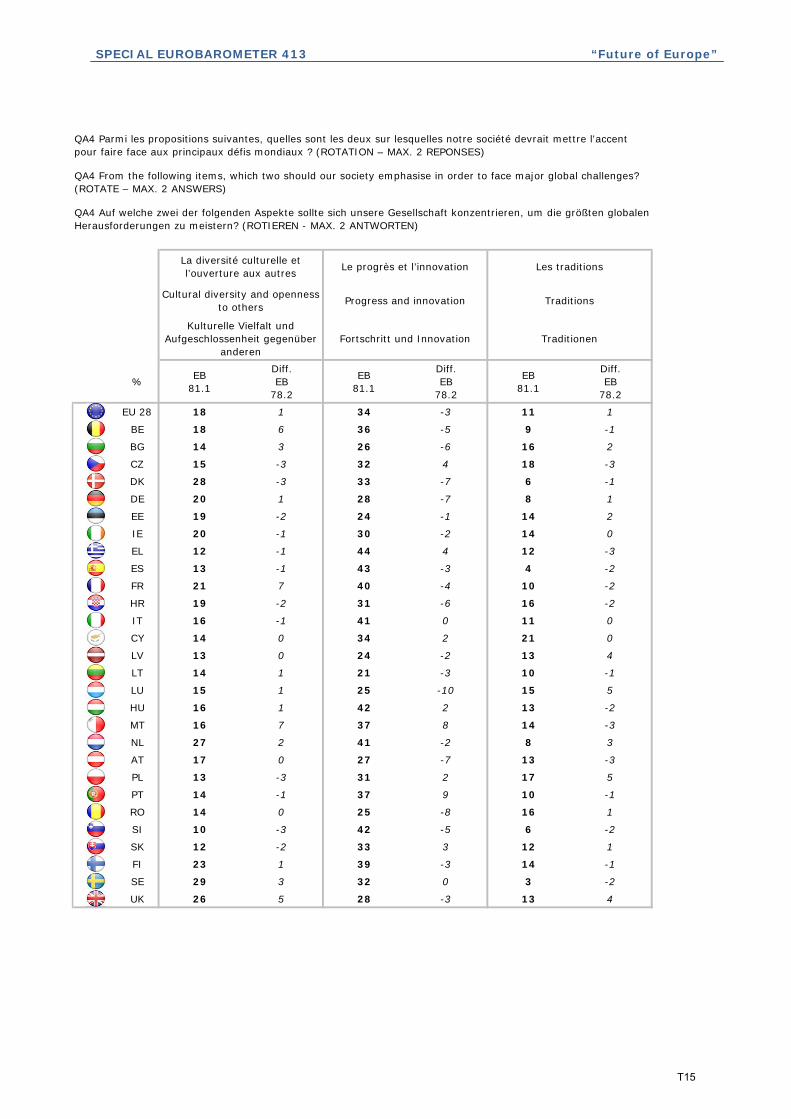
QA4 Parmi les propositions suivantes, quelles sont les deux sur lesquelles notre société devrait mettre l'accent pour faire face aux principaux défis mondiaux ? (ROTATION – MAX. 2 REPONSES)
QA4 From the following items, which two should our society emphasise in order to face major global challenges? (ROTATE – MAX. 2 ANSWERS)
QA4 Auf welche zwei der folgenden Aspekte sollte sich unsere Gesellschaft konzentrieren, um die größten globalen Herausforderungen zu meistern? (ROTIEREN - MAX. 2 ANTWORTEN)
T14
SPECIAL EUROBAROMETER 413 “Future of Europe”
% EB81.1
Diff.EB
78.2
EB81.1
Diff.EB
78.2
EB81.1
Diff.EB
78.2
EU 28 18 1 34 -3 11 1
BE 18 6 36 -5 9 -1
BG 14 3 26 -6 16 2
CZ 15 -3 32 4 18 -3
DK 28 -3 33 -7 6 -1
DE 20 1 28 -7 8 1
EE 19 -2 24 -1 14 2
IE 20 -1 30 -2 14 0
EL 12 -1 44 4 12 -3
ES 13 -1 43 -3 4 -2
FR 21 7 40 -4 10 -2
HR 19 -2 31 -6 16 -2
IT 16 -1 41 0 11 0
CY 14 0 34 2 21 0
LV 13 0 24 -2 13 4
LT 14 1 21 -3 10 -1
LU 15 1 25 -10 15 5
HU 16 1 42 2 13 -2
MT 16 7 37 8 14 -3
NL 27 2 41 -2 8 3
AT 17 0 27 -7 13 -3
PL 13 -3 31 2 17 5
PT 14 -1 37 9 10 -1
RO 14 0 25 -8 16 1
SI 10 -3 42 -5 6 -2
SK 12 -2 33 3 12 1
FI 23 1 39 -3 14 -1
SE 29 3 32 0 3 -2
UK 26 5 28 -3 13 4
Traditions
QA4 Parmi les propositions suivantes, quelles sont les deux sur lesquelles notre société devrait mettre l'accent pour faire face aux principaux défis mondiaux ? (ROTATION – MAX. 2 REPONSES)
QA4 From the following items, which two should our society emphasise in order to face major global challenges? (ROTATE – MAX. 2 ANSWERS)
Kulturelle Vielfalt und Aufgeschlossenheit gegenüber
anderenFortschritt und Innovation Traditionen
Cultural diversity and openness to others Progress and innovation
QA4 Auf welche zwei der folgenden Aspekte sollte sich unsere Gesellschaft konzentrieren, um die größten globalen Herausforderungen zu meistern? (ROTIEREN - MAX. 2 ANTWORTEN)
La diversité culturelle et l’ouverture aux autres Le progrès et l’innovation Les traditions
T15
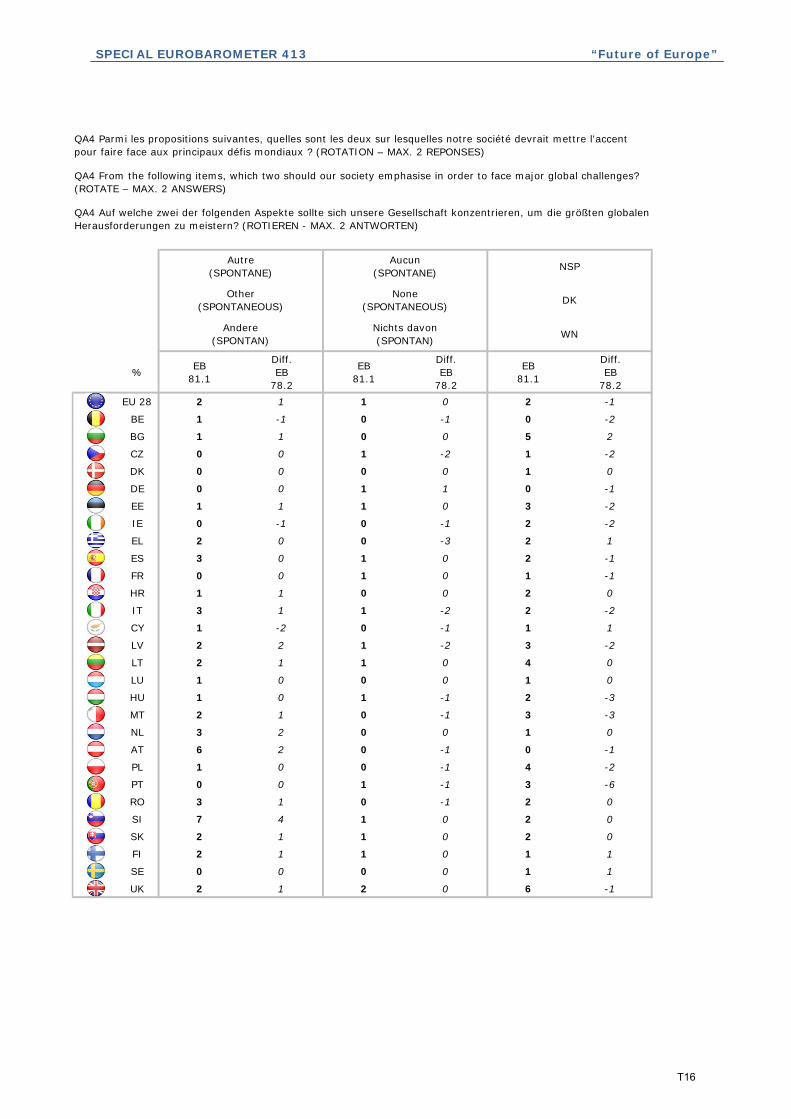
SPECIAL EUROBAROMETER 413 “Future of Europe”
% EB81.1
Diff.EB
78.2
EB81.1
Diff.EB
78.2
EB81.1
Diff.EB
78.2EU 28 2 1 1 0 2 -1
BE 1 -1 0 -1 0 -2
BG 1 1 0 0 5 2
CZ 0 0 1 -2 1 -2
DK 0 0 0 0 1 0
DE 0 0 1 1 0 -1
EE 1 1 1 0 3 -2
IE 0 -1 0 -1 2 -2
EL 2 0 0 -3 2 1
ES 3 0 1 0 2 -1
FR 0 0 1 0 1 -1
HR 1 1 0 0 2 0
IT 3 1 1 -2 2 -2
CY 1 -2 0 -1 1 1
LV 2 2 1 -2 3 -2
LT 2 1 1 0 4 0
LU 1 0 0 0 1 0
HU 1 0 1 -1 2 -3
MT 2 1 0 -1 3 -3
NL 3 2 0 0 1 0
AT 6 2 0 -1 0 -1
PL 1 0 0 -1 4 -2
PT 0 0 1 -1 3 -6
RO 3 1 0 -1 2 0
SI 7 4 1 0 2 0
SK 2 1 1 0 2 0
FI 2 1 1 0 1 1
SE 0 0 0 0 1 1
UK 2 1 2 0 6 -1
Andere (SPONTAN)
Nichts davon (SPONTAN) WN
NSP
Other (SPONTANEOUS)
None (SPONTANEOUS) DK
Autre (SPONTANE)
Aucun (SPONTANE)
QA4 Parmi les propositions suivantes, quelles sont les deux sur lesquelles notre société devrait mettre l'accent pour faire face aux principaux défis mondiaux ? (ROTATION – MAX. 2 REPONSES)
QA4 From the following items, which two should our society emphasise in order to face major global challenges? (ROTATE – MAX. 2 ANSWERS)
QA4 Auf welche zwei der folgenden Aspekte sollte sich unsere Gesellschaft konzentrieren, um die größten globalen Herausforderungen zu meistern? (ROTIEREN - MAX. 2 ANTWORTEN)
T16

SPECIAL EUROBAROMETER 413 “Future of Europe”
%
EU 28
BE
BG
CZ
DK
DE
EE
IE
EL
ES
FR
HR
IT
CY
LV
LT
LU
HU
MT
NL
AT
PL
PT
RO
SI
SK
FI
SE
UK 30 63 2 5
21 75 3 1
28 64 6 2
60 35 3 2
44 48 4 4
57 25 7 11
68 24 3 5
54 39 2 5
45 43 9 3
42 51 4 3
38 45 7 10
57 32 8 3
48 40 11 1
51 42 2 5
47 45 4 4
48 44 5 3
62 30 3 5
63 31 2 4
46 44 5 5
49 44 0 7
41 56 2 1
39 46 11 4
45 49 3 3
35 57 5 3
24 69 4 3
55 42 1 2
55 30 6 9
60 30 8 2
3 5
No change is needed (SPONTANEOUS)
Keine Veränderung nötig (SPONTAN)
EB81.1
EB81.1
EB81.1
EB81.1
Moins de prises de décisions au niveau
européen
Less decision-making at a European level
Weniger Entscheidungen auf europäischer Ebene
Plus de prises de décisions au niveau
européen
48 44
More decision-making at a European level
Pas de changement nécessaire
(SPONTANE)NSP
DK
WN
QA5.1 Bitte sagen Sie mir für jeden der folgenden Bereiche, ob Sie glauben, dass mehr oder weniger Entscheidungen auf europäischer Ebene getroffen werden sollten.
Wirtschafts- und Steuerpolitik
Mehr Entscheidungen auf europäischer Ebene
QA5.1 Pour chacun des domaines suivants, dites-moi si vous pensez que plus ou moins de prises de décisions devraient avoir lieu au niveau européen.
La politique économique et les impôts
QA5.1 For each of the following areas, please tell me if you believe that more or less decision-making should take place at a European level.
Economic policy and taxation
T17
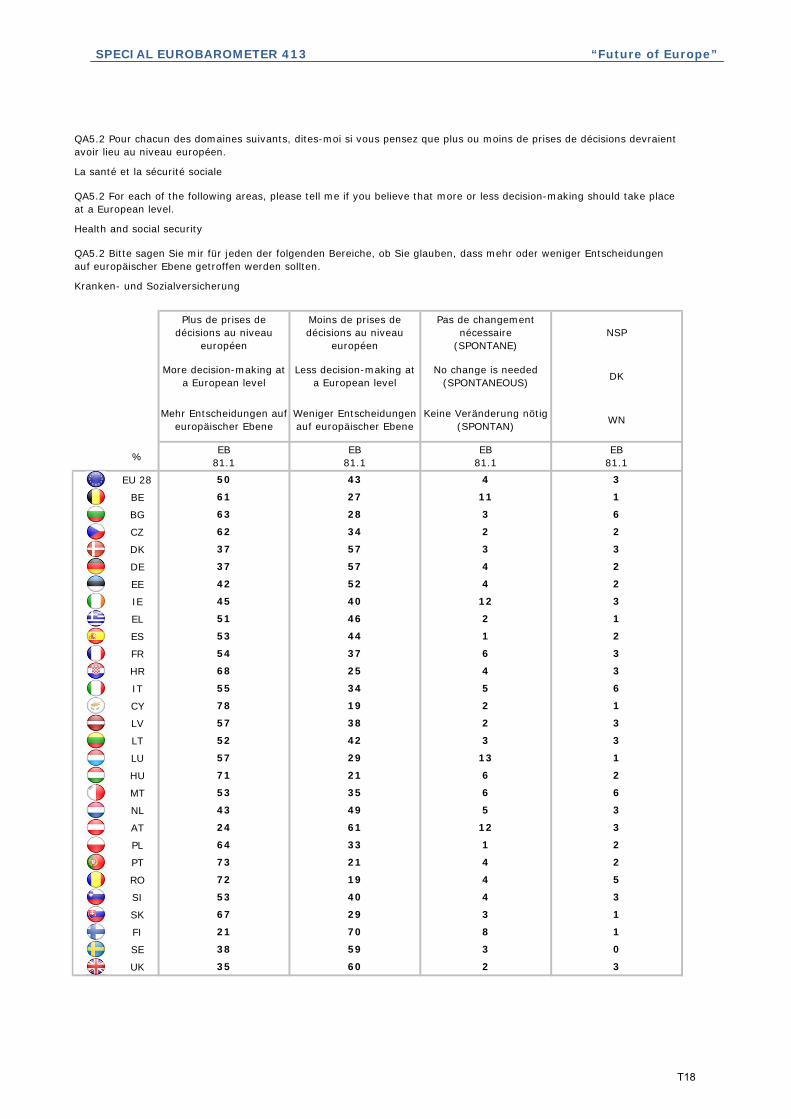
SPECIAL EUROBAROMETER 413 “Future of Europe”
%
EU 28
BE
BG
CZ
DK
DE
EE
IE
EL
ES
FR
HR
IT
CY
LV
LT
LU
HU
MT
NL
AT
PL
PT
RO
SI
SK
FI
SE
UK 35 60 2 3
38 59 3 0
21 70 8 1
67 29 3 1
53 40 4 3
72 19 4 5
73 21 4 2
64 33 1 2
24 61 12 3
43 49 5 3
53 35 6 6
71 21 6 2
57 29 13 1
52 42 3 3
57 38 2 3
78 19 2 1
55 34 5 6
68 25 4 3
54 37 6 3
53 44 1 2
51 46 2 1
45 40 12 3
37 57 4 2
42 52 4 2
37 57 3 3
62 34 2 2
63 28 3 6
61 27 11 1
4 3
No change is needed (SPONTANEOUS)
Keine Veränderung nötig (SPONTAN)
EB81.1
EB81.1
EB81.1
EB81.1
Moins de prises de décisions au niveau
européen
Less decision-making at a European level
Weniger Entscheidungen auf europäischer Ebene
Plus de prises de décisions au niveau
européen
50 43
More decision-making at a European level
Pas de changement nécessaire
(SPONTANE)NSP
DK
WN
QA5.2 Bitte sagen Sie mir für jeden der folgenden Bereiche, ob Sie glauben, dass mehr oder weniger Entscheidungen auf europäischer Ebene getroffen werden sollten.
Kranken- und Sozialversicherung
Mehr Entscheidungen auf europäischer Ebene
QA5.2 Pour chacun des domaines suivants, dites-moi si vous pensez que plus ou moins de prises de décisions devraient avoir lieu au niveau européen.
La santé et la sécurité sociale
QA5.2 For each of the following areas, please tell me if you believe that more or less decision-making should take place at a European level.
Health and social security
T18
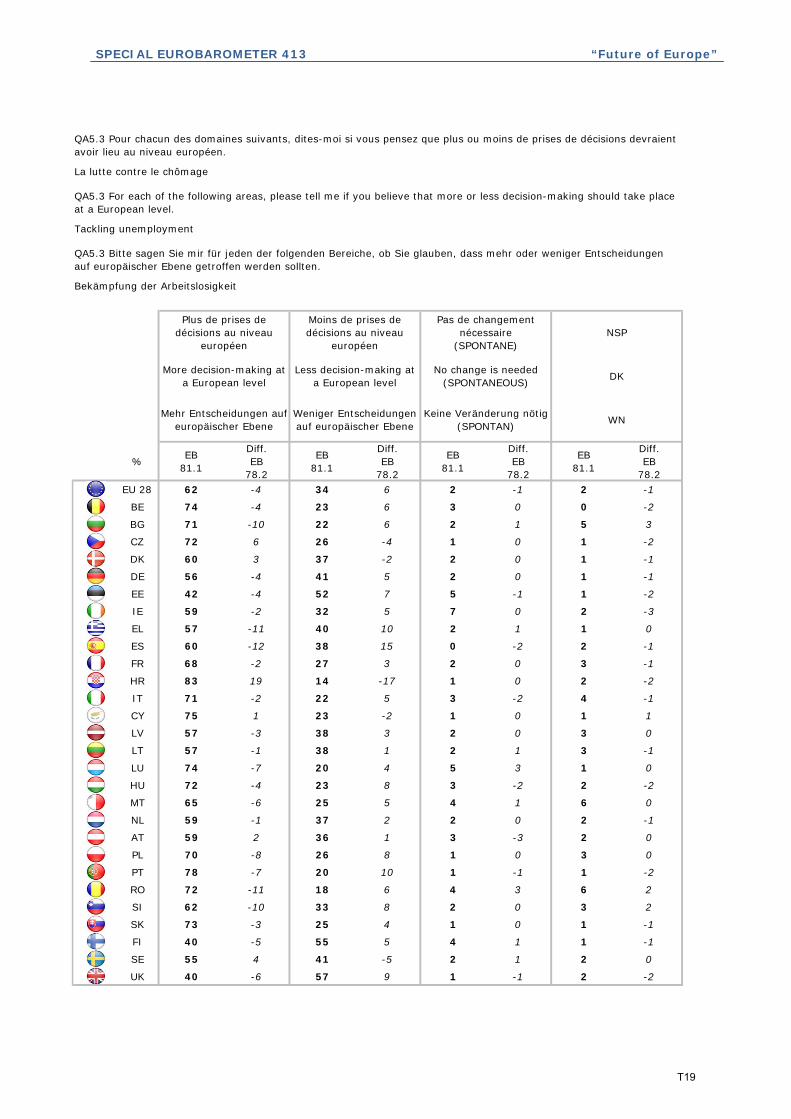
SPECIAL EUROBAROMETER 413 “Future of Europe”
% EB81.1
Diff.EB
78.2
EB81.1
Diff.EB
78.2
EB81.1
Diff.EB
78.2
EB81.1
Diff.EB
78.2EU 28 62 -4 34 6 2 -1 2 -1
BE 74 -4 23 6 3 0 0 -2
BG 71 -10 22 6 2 1 5 3
CZ 72 6 26 -4 1 0 1 -2
DK 60 3 37 -2 2 0 1 -1
DE 56 -4 41 5 2 0 1 -1
EE 42 -4 52 7 5 -1 1 -2
IE 59 -2 32 5 7 0 2 -3
EL 57 -11 40 10 2 1 1 0
ES 60 -12 38 15 0 -2 2 -1
FR 68 -2 27 3 2 0 3 -1
HR 83 19 14 -17 1 0 2 -2
IT 71 -2 22 5 3 -2 4 -1
CY 75 1 23 -2 1 0 1 1
LV 57 -3 38 3 2 0 3 0
LT 57 -1 38 1 2 1 3 -1
LU 74 -7 20 4 5 3 1 0
HU 72 -4 23 8 3 -2 2 -2
MT 65 -6 25 5 4 1 6 0
NL 59 -1 37 2 2 0 2 -1
AT 59 2 36 1 3 -3 2 0
PL 70 -8 26 8 1 0 3 0
PT 78 -7 20 10 1 -1 1 -2
RO 72 -11 18 6 4 3 6 2
SI 62 -10 33 8 2 0 3 2
SK 73 -3 25 4 1 0 1 -1
FI 40 -5 55 5 4 1 1 -1
SE 55 4 41 -5 2 1 2 0
UK 40 -6 57 9 1 -1 2 -2
Plus de prises de décisions au niveau
européen
Pas de changement nécessaire
(SPONTANE)
No change is needed (SPONTANEOUS)
Keine Veränderung nötig (SPONTAN)
NSP
DK
WN
More decision-making at a European level
Mehr Entscheidungen auf europäischer Ebene
QA5.3 Bitte sagen Sie mir für jeden der folgenden Bereiche, ob Sie glauben, dass mehr oder weniger Entscheidungen auf europäischer Ebene getroffen werden sollten.
Bekämpfung der Arbeitslosigkeit
Moins de prises de décisions au niveau
européen
Less decision-making at a European level
Weniger Entscheidungen auf europäischer Ebene
QA5.3 Pour chacun des domaines suivants, dites-moi si vous pensez que plus ou moins de prises de décisions devraient avoir lieu au niveau européen.
La lutte contre le chômage
QA5.3 For each of the following areas, please tell me if you believe that more or less decision-making should take place at a European level.
Tackling unemployment
T19

SPECIAL EUROBAROMETER 413 “Future of Europe”
%
EU 28
BE
BG
CZ
DK
DE
EE
IE
EL
ES
FR
HR
IT
CY
LV
LT
LU
HU
MT
NL
AT
PL
PT
RO
SI
SK
FI
SE
UK 37 58 2 3
65 32 2 1
35 58 6 1
59 33 5 3
49 40 7 4
50 27 13 10
68 23 5 4
65 28 2 5
48 46 5 1
66 30 2 2
80 12 1 7
59 27 11 3
62 25 11 2
54 36 4 6
50 42 4 4
67 29 2 2
69 22 4 5
53 34 7 6
65 27 3 5
68 28 1 3
63 35 1 1
55 34 9 2
58 40 1 1
36 57 5 2
51 45 2 2
69 28 1 2
69 18 5 8
74 20 5 1
3 4
No change is needed (SPONTANEOUS)
Keine Veränderung nötig (SPONTAN)
EB81.1
EB81.1
EB81.1
EB81.1
Moins de prises de décisions au niveau
européen
Less decision-making at a European level
Weniger Entscheidungen auf europäischer Ebene
Plus de prises de décisions au niveau
européen
59 34
More decision-making at a European level
Pas de changement nécessaire
(SPONTANE)NSP
DK
WN
QA5.4 Bitte sagen Sie mir für jeden der folgenden Bereiche, ob Sie glauben, dass mehr oder weniger Entscheidungen auf europäischer Ebene getroffen werden sollten.
Einwanderungsthematik
Mehr Entscheidungen auf europäischer Ebene
QA5.4 Pour chacun des domaines suivants, dites-moi si vous pensez que plus ou moins de prises de décisions devraient avoir lieu au niveau européen.
Les questions d’immigration
QA5.4 For each of the following areas, please tell me if you believe that more or less decision-making should take place at a European level.
Immigration issues
T20

SPECIAL EUROBAROMETER 413 “Future of Europe”
% EB81.1
Diff.EB
78.2
EB81.1
Diff.EB
78.2
EB81.1
Diff.EB
78.2
EB81.1
Diff.EB
78.2
EU 28 72 -8 22 8 3 0 3 0
BE 80 -4 14 4 6 1 0 -1
BG 66 -10 20 3 6 2 8 5
CZ 80 1 18 0 1 0 1 -1
DK 78 -7 19 6 2 1 1 0
DE 81 -7 17 8 1 0 1 -1
EE 49 -18 43 17 6 0 2 1
IE 63 -8 28 10 7 1 2 -3
EL 70 -8 25 6 4 2 1 0
ES 74 -12 23 13 0 -2 3 1
FR 78 -6 17 5 3 1 2 0
HR 72 4 22 -4 4 1 2 -1
IT 70 -6 22 8 4 -1 4 -1
CY 83 -5 14 3 2 1 1 1
LV 52 -17 38 14 7 3 3 0
LT 58 -14 35 11 2 1 5 2
LU 79 -8 11 2 9 6 1 0
HU 70 -10 17 8 11 3 2 -1
MT 69 -7 22 6 4 1 5 0
NL 77 -4 19 3 3 1 1 0
AT 69 0 24 0 5 -1 2 1
PL 69 -12 26 12 2 0 3 0
PT 75 -6 19 8 3 -2 3 0
RO 68 -5 19 3 6 1 7 1
SI 64 -14 28 9 5 3 3 2
SK 76 -4 20 2 3 2 1 0
FI 57 -12 37 10 5 3 1 -1
SE 85 -3 13 1 1 1 1 1
UK 60 -12 36 13 1 -1 3 0
Plus de prises de décisions au niveau
européen
Pas de changement nécessaire
(SPONTANE)
No change is needed (SPONTANEOUS)
Keine Veränderung nötig (SPONTAN)
NSP
DK
WN
More decision-making at a European level
Mehr Entscheidungen auf europäischer Ebene
QA5.5 Bitte sagen Sie mir für jeden der folgenden Bereiche, ob Sie glauben, dass mehr oder weniger Entscheidungen auf europäischer Ebene getroffen werden sollten.
Schutz der Umwelt
Moins de prises de décisions au niveau
européen
Less decision-making at a European level
Weniger Entscheidungen auf europäischer Ebene
QA5.5 Pour chacun des domaines suivants, dites-moi si vous pensez que plus ou moins de prises de décisions devraient avoir lieu au niveau européen.
La protection de l’environnement
QA5.5 For each of the following areas, please tell me if you believe that more or less decision-making should take place at a European level.
Protecting the environment
T21
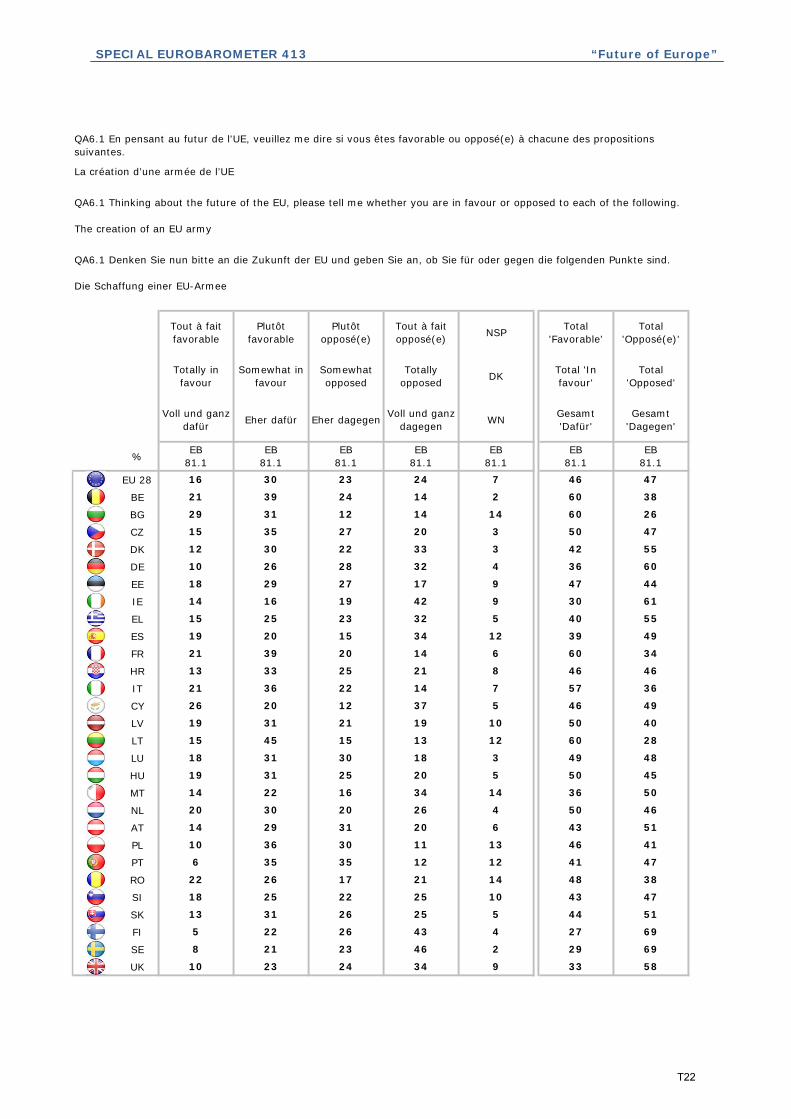
SPECIAL EUROBAROMETER 413 “Future of Europe”
%
EU 28
BE
BG
CZ
DK
DE
EE
IE
EL
ES
FR
HR
IT
CY
LV
LT
LU
HU
MT
NL
AT
PL
PT
RO
SI
SK
FI
SE
UK
69
10 23 24 34 9 33 58
8 21 23 46
5 4426 25
2 29
51
5 22 26 43 4 27 69
13 31
38
18 25 22 25 10 43 47
22 26 17 21
13 4630 11
14 48
41
6 35 35 12 12 41 47
10 36
46
14 29 31 20 6 43 51
20 30 20 26
5 5025 20
4 50
45
14 22 16 34 14 36 50
19 31
28
18 31 30 18 3 49 48
15 45
20
15 13
5 4612 37
12 60
33
49
19 31 21 19 10 50 40
26
46 46
21 36 22 14 7 57 36
13
34
19 20
25 21
12 3915 34
8
55
14 16
49
21 39 20 14 6 60
15 25 23 32 5 40
19 42 9 30
36 60
44
61
18 29 27 17 9 47
35 3 5027 20
10 26 28 32 4
26
47
12 30 22 33 3 42 55
15
29 31 12 14 14 60
Gesamt 'Dagegen'
EB81.1
16 30 23
2 60 38
47
EB81.1
DK
WN
EB81.1
EB81.1
21 39 24 14
Somewhat opposed
Eher dagegen
Total 'Opposed'
Tout à fait opposé(e)
Totally opposed
Voll und ganz dagegen
24 7 46
Total 'In favour'
Gesamt 'Dafür'
EB81.1
Totally in favour
Voll und ganz dafür
EB81.1
Plutôt favorable
Somewhat in favour
Eher dafür
EB81.1
QA6.1 Denken Sie nun bitte an die Zukunft der EU und geben Sie an, ob Sie für oder gegen die folgenden Punkte sind.
Die Schaffung einer EU-Armee
Tout à fait favorable
Plutôt opposé(e) NSP Total
'Opposé(e)'Total
'Favorable'
QA6.1 En pensant au futur de l'UE, veuillez me dire si vous êtes favorable ou opposé(e) à chacune des propositions suivantes.
La création d’une armée de l’UE
QA6.1 Thinking about the future of the EU, please tell me whether you are in favour or opposed to each of the following.
The creation of an EU army
T22
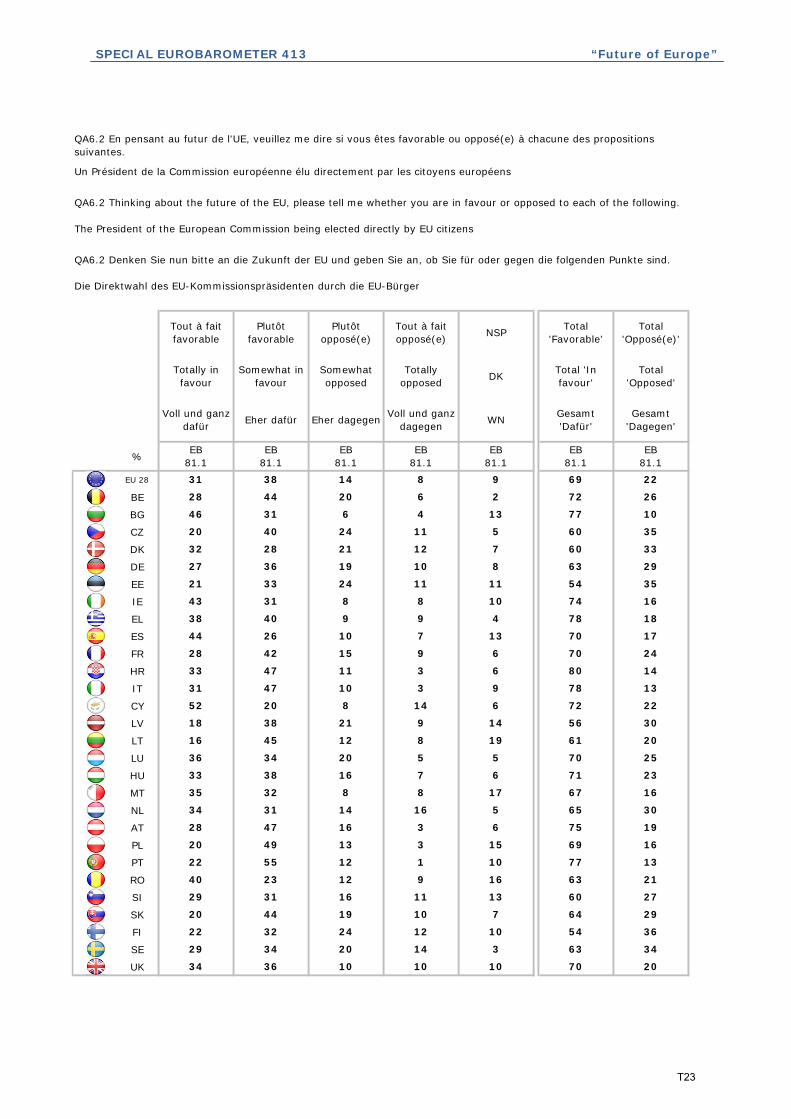
SPECIAL EUROBAROMETER 413 “Future of Europe”
%
EU 28
BE
BG
CZ
DK
DE
EE
IE
EL
ES
FR
HR
IT
CY
LV
LT
LU
HU
MT
NL
AT
PL
PT
RO
SI
SK
FI
SE
UK
34
34 36 10 10 10 70 20
29 34 20 14
7 6419 10
3 63
29
22 32 24 12 10 54 36
20 44
21
29 31 16 11 13 60 27
40 23 12 9
15 6913 3
16 63
16
22 55 12 1 10 77 13
20 49
30
28 47 16 3 6 75 19
34 31 14 16
6 7116 7
5 65
23
35 32 8 8 17 67 16
33 38
20
36 34 20 5 5 70 25
16 45
20
12 8
6 728 14
19 61
47
22
18 38 21 9 14 56 30
52
80 14
31 47 10 3 9 78 13
33
24
44 26
11 3
13 7010 7
6
18
43 31
17
28 42 15 9 6 70
38 40 9 9 4 78
8 8 10 74
63 29
35
16
21 33 24 11 11 54
40 5 6024 11
27 36 19 10 8
10
35
32 28 21 12 7 60 33
20
46 31 6 4 13 77
Gesamt 'Dagegen'
EB81.1
31 38 14
2 72 26
22
EB81.1
DK
WN
EB81.1
EB81.1
28 44 20 6
Somewhat opposed
Eher dagegen
Total 'Opposed'
Tout à fait opposé(e)
Totally opposed
Voll und ganz dagegen
8 9 69
Total 'In favour'
Gesamt 'Dafür'
EB81.1
Totally in favour
Voll und ganz dafür
EB81.1
Plutôt favorable
Somewhat in favour
Eher dafür
EB81.1
QA6.2 Denken Sie nun bitte an die Zukunft der EU und geben Sie an, ob Sie für oder gegen die folgenden Punkte sind.
Die Direktwahl des EU-Kommissionspräsidenten durch die EU-Bürger
Tout à fait favorable
Plutôt opposé(e) NSP Total
'Opposé(e)'Total
'Favorable'
QA6.2 En pensant au futur de l'UE, veuillez me dire si vous êtes favorable ou opposé(e) à chacune des propositions suivantes.
Un Président de la Commission européenne élu directement par les citoyens européens
QA6.2 Thinking about the future of the EU, please tell me whether you are in favour or opposed to each of the following.
The President of the European Commission being elected directly by EU citizens
T23
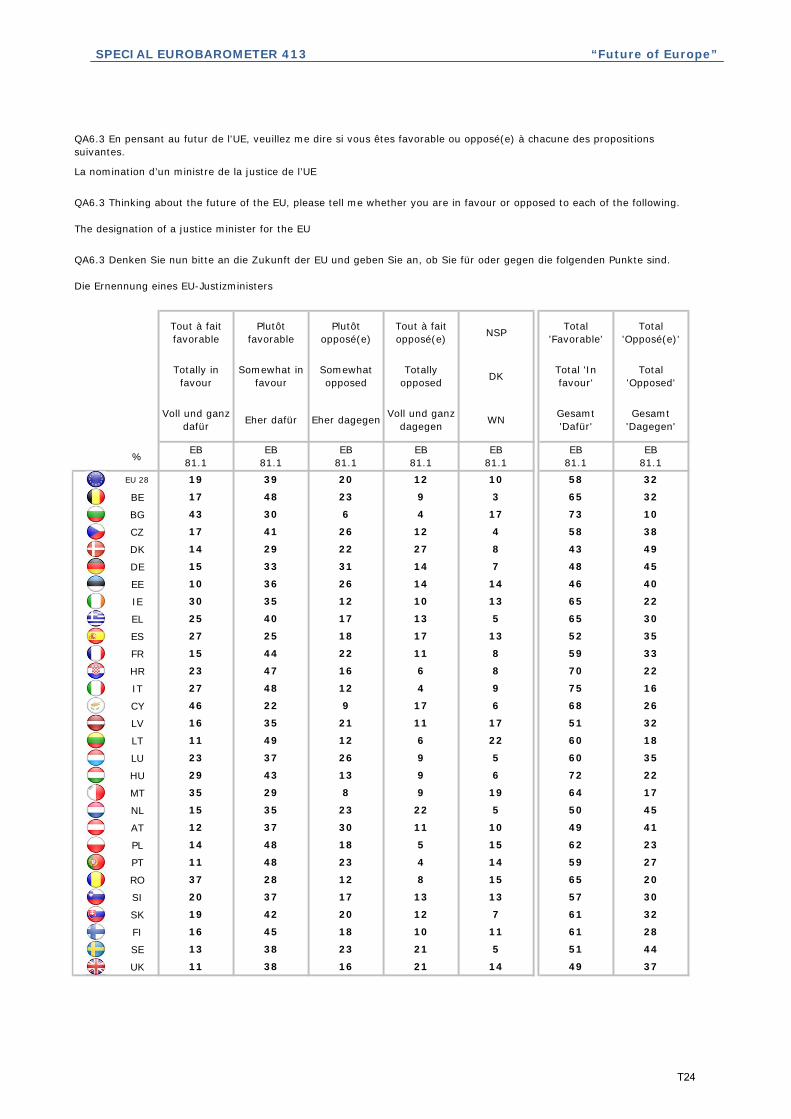
SPECIAL EUROBAROMETER 413 “Future of Europe”
%
EU 28
BE
BG
CZ
DK
DE
EE
IE
EL
ES
FR
HR
IT
CY
LV
LT
LU
HU
MT
NL
AT
PL
PT
RO
SI
SK
FI
SE
UK
44
11 38 16 21 14 49 37
13 38 23 21
7 6120 12
5 51
32
16 45 18 10 11 61 28
19 42
20
20 37 17 13 13 57 30
37 28 12 8
15 6218 5
15 65
23
11 48 23 4 14 59 27
14 48
45
12 37 30 11 10 49 41
15 35 23 22
6 7213 9
5 50
22
35 29 8 9 19 64 17
29 43
18
23 37 26 9 5 60 35
11 49
22
12 6
6 689 17
22 60
47
26
16 35 21 11 17 51 32
46
70 22
27 48 12 4 9 75 16
23
33
27 25
16 6
13 5218 17
8
30
30 35
35
15 44 22 11 8 59
25 40 17 13 5 65
12 10 13 65
48 45
40
22
10 36 26 14 14 46
41 4 5826 12
15 33 31 14 7
10
38
14 29 22 27 8 43 49
17
43 30 6 4 17 73
Gesamt 'Dagegen'
EB81.1
19 39 20
3 65 32
32
EB81.1
DK
WN
EB81.1
EB81.1
17 48 23 9
Somewhat opposed
Eher dagegen
Total 'Opposed'
Tout à fait opposé(e)
Totally opposed
Voll und ganz dagegen
12 10 58
Total 'In favour'
Gesamt 'Dafür'
EB81.1
Totally in favour
Voll und ganz dafür
EB81.1
Plutôt favorable
Somewhat in favour
Eher dafür
EB81.1
QA6.3 Denken Sie nun bitte an die Zukunft der EU und geben Sie an, ob Sie für oder gegen die folgenden Punkte sind.
Die Ernennung eines EU-Justizministers
Tout à fait favorable
Plutôt opposé(e) NSP Total
'Opposé(e)'Total
'Favorable'
QA6.3 En pensant au futur de l'UE, veuillez me dire si vous êtes favorable ou opposé(e) à chacune des propositions suivantes.
La nomination d’un ministre de la justice de l’UE
QA6.3 Thinking about the future of the EU, please tell me whether you are in favour or opposed to each of the following.
The designation of a justice minister for the EU
T24

SPECIAL EUROBAROMETER 413 “Future of Europe”
% EB81.1
Diff.EB
78.2
EB81.1
Diff.EB
78.2
EB81.1
Diff.EB
78.2EU 28 47 2 43 1 10 -3
BE 56 -3 42 8 2 -5
BG 36 -10 29 -5 35 15
CZ 58 5 36 1 6 -6
DK 64 3 31 -4 5 1
DE 59 8 33 -3 8 -5
EE 51 -1 41 3 8 -2
IE 33 -12 52 11 15 1
EL 26 -1 70 3 4 -2
ES 28 2 63 0 9 -2
FR 54 2 39 0 7 -2
HR 46 0 42 3 12 -3
IT 43 9 45 -2 12 -7
CY 41 2 50 -4 9 2
LV 61 10 32 -7 7 -3
LT 43 -1 44 2 13 -1
LU 50 -3 46 3 4 0
HU 42 2 47 1 11 -3
MT 37 3 44 10 19 -13
NL 69 -1 27 3 4 -2
AT 61 0 31 1 8 -1
PL 43 -2 46 3 11 -1
PT 32 6 60 0 8 -6
RO 37 -4 39 8 24 -4
SI 62 5 28 -8 10 3
SK 60 -1 32 1 8 0
FI 56 1 39 0 5 -1
SE 56 0 35 1 9 -1
UK 40 -5 48 8 12 -3
NSP
DK
WN
Devraient le faire sans devoir attendre les autres pays
Should do so without having to wait for the others
dies tun sollten, ohne auf die anderen Länder warten zu
müssen.
Devraient attendre que tous les Etats membres de l’UE soient
prêts à le faire
Should wait until all Member States of the EU are ready for
this
warten sollten, bis alle Mitgliedsländer der
Europäischen Union dazu bereit sind.
QA7 En ce qui concerne l’idée d’une "EUROPE A DEUX VITESSES", laquelle des opinions suivantes se rapproche le plus de la vôtre ? Les pays qui sont prêts à intensifier le développement d’une politique européenne commune dans certains domaines importants …
QA7 As regards the idea of a "TWO SPEED EUROPE", which of the following comes closest to your personal preference? Those countries which are ready to intensify the development of a common European policy in certain important areas...
QA7 Wenn Sie an die Idee eines "Europas der zwei Geschwindigkeiten" denken: Welche der folgenden Aussagen kommt Ihrer persönlichen Meinung am nächsten? Dass die Länder, die bereit sind, die Entwicklung einer gemeinsamen europäischen Politik in bestimmten wichtigen Bereichen voranzutreiben, ...
T25
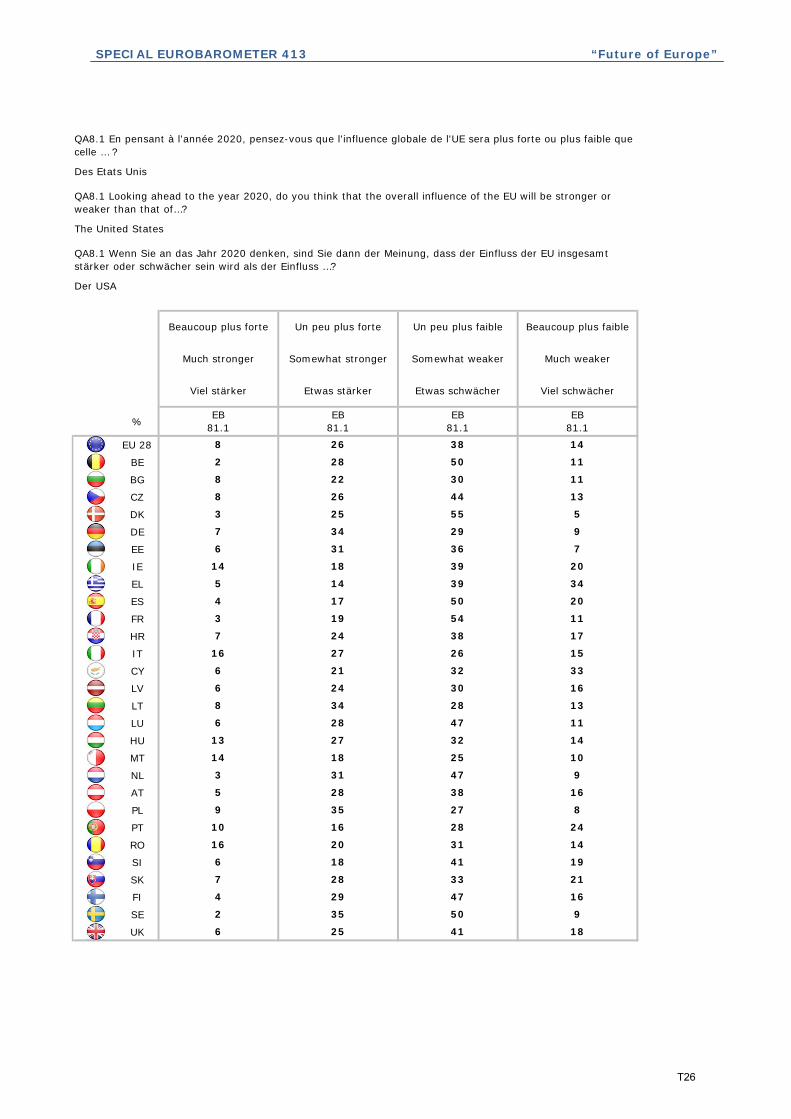
SPECIAL EUROBAROMETER 413 “Future of Europe”
%
EU 28
BE
BG
CZ
DK
DE
EE
IE
EL
ES
FR
HR
IT
CY
LV
LT
LU
HU
MT
NL
AT
PL
PT
RO
SI
SK
FI
SE
UK 6 25 41 18
2 35 50 9
4 29 47 16
7 28 33 21
6 18 41 19
16 20 31 14
10 16 28 24
9 35 27 8
5 28 38 16
3 31 47 9
14 18 25 10
13 27 32 14
6 28 47 11
8 34 28 13
6 24 30 16
6 21 32 33
16 27 26 15
7 24 38 17
3 19 54 11
4 17 50 20
5 14 39 34
14 18 39 20
6 31 36 7
7 34 29 9
3 25 55 5
8 26 44 13
8 22 30 11
2 28 50 11
8 26 38 14
EB81.1
EB81.1
QA8.1 Wenn Sie an das Jahr 2020 denken, sind Sie dann der Meinung, dass der Einfluss der EU insgesamt stärker oder schwächer sein wird als der Einfluss …?
Un peu plus forte
Somewhat stronger
Etwas stärker
EB81.1
Somewhat weaker
Etwas schwächer
EB81.1
Beaucoup plus forte Un peu plus faible
Much stronger
Viel stärker
Beaucoup plus faible
Much weaker
Viel schwächer
Der USA
QA8.1 En pensant à l'année 2020, pensez-vous que l'influence globale de l'UE sera plus forte ou plus faible que celle … ?
Des Etats Unis
QA8.1 Looking ahead to the year 2020, do you think that the overall influence of the EU will be stronger or weaker than that of…?
The United States
T26
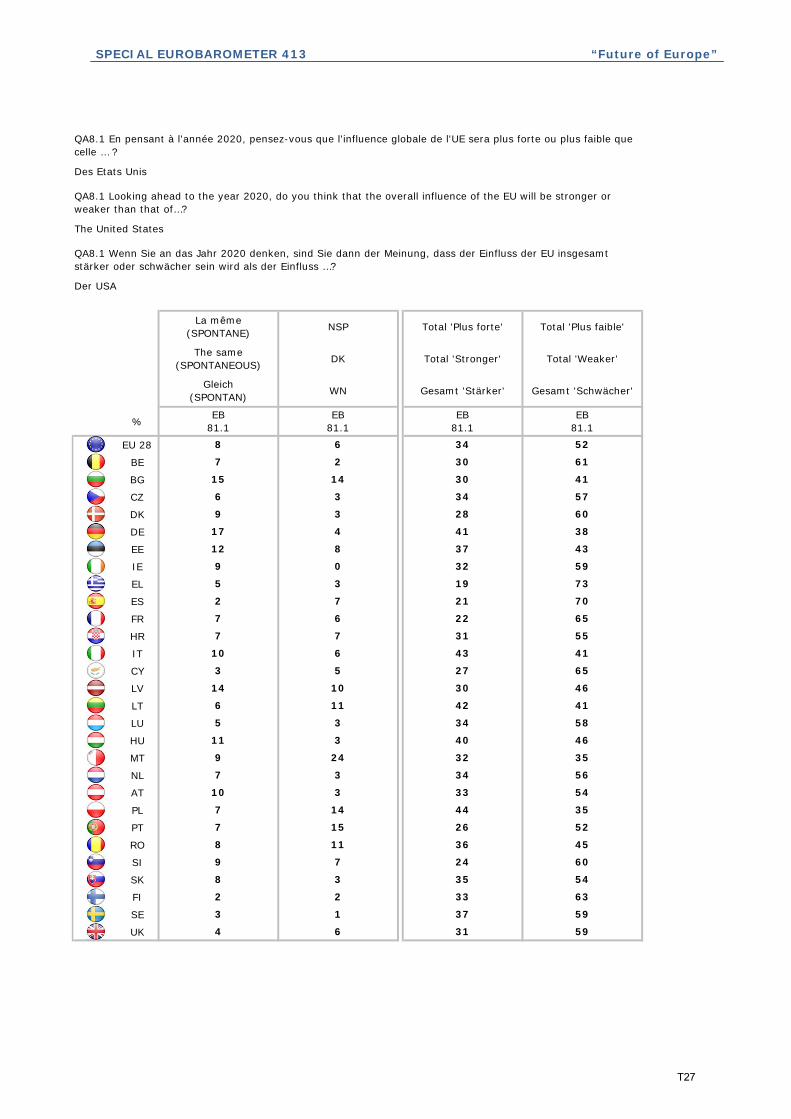
SPECIAL EUROBAROMETER 413 “Future of Europe”
%
EU 28
BE
BG
CZ
DK
DE
EE
IE
EL
ES
FR
HR
IT
CY
LV
LT
LU
HU
MT
NL
AT
PL
PT
RO
SI
SK
FI
SE
UK
37 59
4 6 31 59
3 1
35 54
2 2 33 63
8 3
36 45
9 7 24 60
8 11
44 35
7 15 26 52
7 14
34 56
10 3 33 54
7 3
40 46
9 24 32 35
11 3
42 41
5 3 34 58
6 11
27 65
14 10 30 46
3 5
31 55
10 6 43 41
7 7
21 70
7 6 22 65
2 7
32 59
5 3 19 73
9 0
41 38
12 8 37 43
17 4
34 57
9 3 28 60
6 3
30 61
15 14 30 41
7 2
EB81.1
EB81.1
8 6 34 52
EB81.1
EB81.1
Gleich (SPONTAN) WN Gesamt 'Stärker' Gesamt 'Schwächer'
NSP Total 'Plus forte' Total 'Plus faible'
The same (SPONTANEOUS) DK Total 'Stronger'
QA8.1 Wenn Sie an das Jahr 2020 denken, sind Sie dann der Meinung, dass der Einfluss der EU insgesamt stärker oder schwächer sein wird als der Einfluss …?
Der USA
La même (SPONTANE)
Total 'Weaker'
QA8.1 En pensant à l'année 2020, pensez-vous que l'influence globale de l'UE sera plus forte ou plus faible que celle … ?
Des Etats Unis
QA8.1 Looking ahead to the year 2020, do you think that the overall influence of the EU will be stronger or weaker than that of…?
The United States
T27

SPECIAL EUROBAROMETER 413 “Future of Europe”
%
EU 28
BE
BG
CZ
DK
DE
EE
IE
EL
ES
FR
HR
IT
CY
LV
LT
LU
HU
MT
NL
AT
PL
PT
RO
SI
SK
FI
SE
UK 8 31 35 12
10 53 29 4
9 49 24 12
13 33 32 11
8 26 36 14
11 22 31 14
9 23 28 19
8 39 26 6
12 37 29 10
11 43 30 5
11 21 22 10
12 35 25 13
14 34 33 7
10 33 27 9
11 28 25 10
6 27 29 26
15 29 25 17
7 28 36 16
5 34 36 12
4 24 44 16
10 27 35 18
17 26 30 15
8 37 30 5
14 44 17 5
8 48 29 4
7 37 36 12
8 23 28 13
7 34 43 9
10 34 30 11
EB81.1
EB81.1
QA8.2 Wenn Sie an das Jahr 2020 denken, sind Sie dann der Meinung, dass der Einfluss der EU insgesamt stärker oder schwächer sein wird als der Einfluss …?
Un peu plus forte
Somewhat stronger
Etwas stärker
EB81.1
Somewhat weaker
Etwas schwächer
EB81.1
Beaucoup plus forte Un peu plus faible
Much stronger
Viel stärker
Beaucoup plus faible
Much weaker
Viel schwächer
Japans
QA8.2 En pensant à l'année 2020, pensez-vous que l'influence globale de l'UE sera plus forte ou plus faible que celle … ?
Du Japon
QA8.2 Looking ahead to the year 2020, do you think that the overall influence of the EU will be stronger or weaker than that of…?
Japan
T28

SPECIAL EUROBAROMETER 413 “Future of Europe”
%
EU 28
BE
BG
CZ
DK
DE
EE
IE
EL
ES
FR
HR
IT
CY
LV
LT
LU
HU
MT
NL
AT
PL
PT
RO
SI
SK
FI
SE
UK
63 33
3 11 39 47
31
46 43
1 5 58 36
47
33 45
6 10 34 50
166
47 32
4 17 32 47
156
54 35
8 4 49 39
56
47 38
5 31 32 32
510
43 36
5 7 48 40
165
33 55
11 15 39 35
102
35 52
7 7 44 42
94
28 60
4 9 39 48
93
43 45
5 5 37 53
012
58 22
9 11 45 35
614
44 48
5 6 56 33
35
41 52
12 16 31 41
25
EB81.1
EB81.1
6 9 44 41
EB81.1
EB81.1
Gleich (SPONTAN) WN Gesamt 'Stärker' Gesamt 'Schwächer'
NSP Total 'Plus forte' Total 'Plus faible'
The same (SPONTANEOUS) DK Total 'Stronger'
QA8.2 Wenn Sie an das Jahr 2020 denken, sind Sie dann der Meinung, dass der Einfluss der EU insgesamt stärker oder schwächer sein wird als der Einfluss …?
Japans
La même (SPONTANE)
Total 'Weaker'
QA8.2 En pensant à l'année 2020, pensez-vous que l'influence globale de l'UE sera plus forte ou plus faible que celle … ?
Du Japon
QA8.2 Looking ahead to the year 2020, do you think that the overall influence of the EU will be stronger or weaker than that of…?
Japan
T29
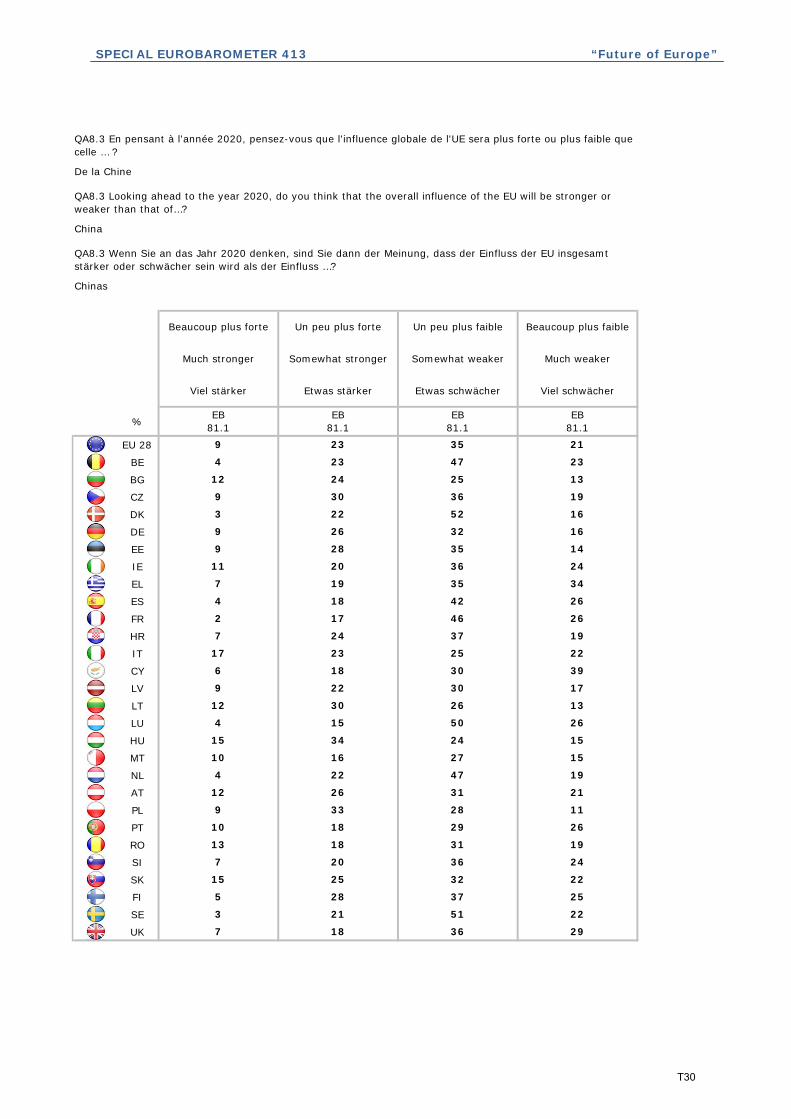
SPECIAL EUROBAROMETER 413 “Future of Europe”
%
EU 28
BE
BG
CZ
DK
DE
EE
IE
EL
ES
FR
HR
IT
CY
LV
LT
LU
HU
MT
NL
AT
PL
PT
RO
SI
SK
FI
SE
UK 7 18 36 29
3 21 51 22
5 28 37 25
15 25 32 22
7 20 36 24
13 18 31 19
10 18 29 26
9 33 28 11
12 26 31 21
4 22 47 19
10 16 27 15
15 34 24 15
4 15 50 26
12 30 26 13
9 22 30 17
6 18 30 39
17 23 25 22
7 24 37 19
2 17 46 26
4 18 42 26
7 19 35 34
11 20 36 24
9 28 35 14
9 26 32 16
3 22 52 16
9 30 36 19
12 24 25 13
4 23 47 23
9 23 35 21
EB81.1
EB81.1
QA8.3 Wenn Sie an das Jahr 2020 denken, sind Sie dann der Meinung, dass der Einfluss der EU insgesamt stärker oder schwächer sein wird als der Einfluss …?
Un peu plus forte
Somewhat stronger
Etwas stärker
EB81.1
Somewhat weaker
Etwas schwächer
EB81.1
Beaucoup plus forte Un peu plus faible
Much stronger
Viel stärker
Beaucoup plus faible
Much weaker
Viel schwächer
Chinas
QA8.3 En pensant à l'année 2020, pensez-vous que l'influence globale de l'UE sera plus forte ou plus faible que celle … ?
De la Chine
QA8.3 Looking ahead to the year 2020, do you think that the overall influence of the EU will be stronger or weaker than that of…?
China
T30

SPECIAL EUROBAROMETER 413 “Future of Europe”
%
EU 28
BE
BG
CZ
DK
DE
EE
IE
EL
ES
FR
HR
IT
CY
LV
LT
LU
HU
MT
NL
AT
PL
PT
RO
SI
SK
FI
SE
UK
24 73
2 8 25 65
1 2
40 54
1 4 33 62
3 3
31 50
5 8 27 60
5 14
42 39
3 14 28 55
4 15
26 66
6 4 38 52
4 4
49 39
4 28 26 42
7 5
42 39
2 3 19 76
4 15
24 69
9 13 31 47
1 6
31 56
6 7 40 47
4 9
22 68
3 6 19 72
2 8
31 60
2 3 26 69
9 0
35 48
5 9 37 49
13 4
39 55
3 4 25 68
3 3
27 70
9 17 36 38
2 1
EB81.1
EB81.1
5 7 32 56
EB81.1
EB81.1
Gleich (SPONTAN) WN Gesamt 'Stärker' Gesamt 'Schwächer'
NSP Total 'Plus forte' Total 'Plus faible'
The same (SPONTANEOUS) DK Total 'Stronger'
QA8.3 Wenn Sie an das Jahr 2020 denken, sind Sie dann der Meinung, dass der Einfluss der EU insgesamt stärker oder schwächer sein wird als der Einfluss …?
Chinas
La même (SPONTANE)
Total 'Weaker'
QA8.3 En pensant à l'année 2020, pensez-vous que l'influence globale de l'UE sera plus forte ou plus faible que celle … ?
De la Chine
QA8.3 Looking ahead to the year 2020, do you think that the overall influence of the EU will be stronger or weaker than that of…?
China
T31

SPECIAL EUROBAROMETER 413 “Future of Europe”
%
EU 28
BE
BG
CZ
DK
DE
EE
IE
EL
ES
FR
HR
IT
CY
LV
LT
LU
HU
MT
NL
AT
PL
PT
RO
SI
SK
FI
SE
UK 12 41 25 7
13 44 32 5
19 49 18 7
20 38 21 6
13 37 20 11
22 33 14 9
21 29 16 11
16 37 19 5
23 37 20 7
19 43 24 4
19 28 12 5
15 41 16 11
21 45 21 6
29 30 14 8
33 26 9 8
28 37 14 9
11 34 24 14
20 41 17 8
11 45 23 7
21 43 18 5
29 39 13 9
24 37 18 8
25 34 16 6
22 37 17 6
12 50 23 4
19 46 19 7
20 27 12 7
11 44 31 8
17 39 20 8
EB81.1
EB81.1
QA8.4 Wenn Sie an das Jahr 2020 denken, sind Sie dann der Meinung, dass der Einfluss der EU insgesamt stärker oder schwächer sein wird als der Einfluss …?
Un peu plus forte
Somewhat stronger
Etwas stärker
EB81.1
Somewhat weaker
Etwas schwächer
EB81.1
Beaucoup plus forte Un peu plus faible
Much stronger
Viel stärker
Beaucoup plus faible
Much weaker
Viel schwächer
Indiens
QA8.4 En pensant à l'année 2020, pensez-vous que l'influence globale de l'UE sera plus forte ou plus faible que celle … ?
De l’Inde
QA8.4 Looking ahead to the year 2020, do you think that the overall influence of the EU will be stronger or weaker than that of…?
India
T32
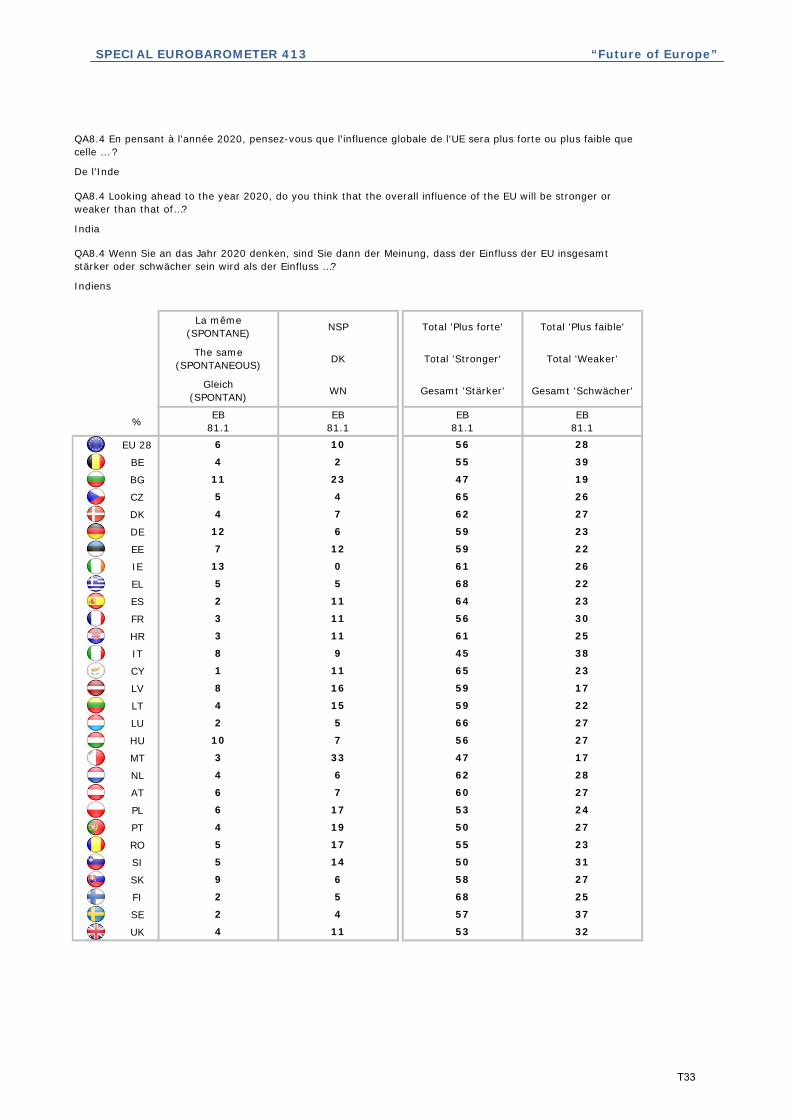
SPECIAL EUROBAROMETER 413 “Future of Europe”
%
EU 28
BE
BG
CZ
DK
DE
EE
IE
EL
ES
FR
HR
IT
CY
LV
LT
LU
HU
MT
NL
AT
PL
PT
RO
SI
SK
FI
SE
UK
57 37
4 11 53 32
2 4
58 27
2 5 68 25
9 6
55 23
5 14 50 31
5 17
53 24
4 19 50 27
6 17
62 28
6 7 60 27
4 6
56 27
3 33 47 17
10 7
59 22
2 5 66 27
4 15
65 23
8 16 59 17
1 11
61 25
8 9 45 38
3 11
64 23
3 11 56 30
2 11
61 26
5 5 68 22
13 0
59 23
7 12 59 22
12 6
65 26
4 7 62 27
5 4
55 39
11 23 47 19
4 2
EB81.1
EB81.1
6 10 56 28
EB81.1
EB81.1
Gleich (SPONTAN) WN Gesamt 'Stärker' Gesamt 'Schwächer'
NSP Total 'Plus forte' Total 'Plus faible'
The same (SPONTANEOUS) DK Total 'Stronger'
QA8.4 Wenn Sie an das Jahr 2020 denken, sind Sie dann der Meinung, dass der Einfluss der EU insgesamt stärker oder schwächer sein wird als der Einfluss …?
Indiens
La même (SPONTANE)
Total 'Weaker'
QA8.4 En pensant à l'année 2020, pensez-vous que l'influence globale de l'UE sera plus forte ou plus faible que celle … ?
De l’Inde
QA8.4 Looking ahead to the year 2020, do you think that the overall influence of the EU will be stronger or weaker than that of…?
India
T33
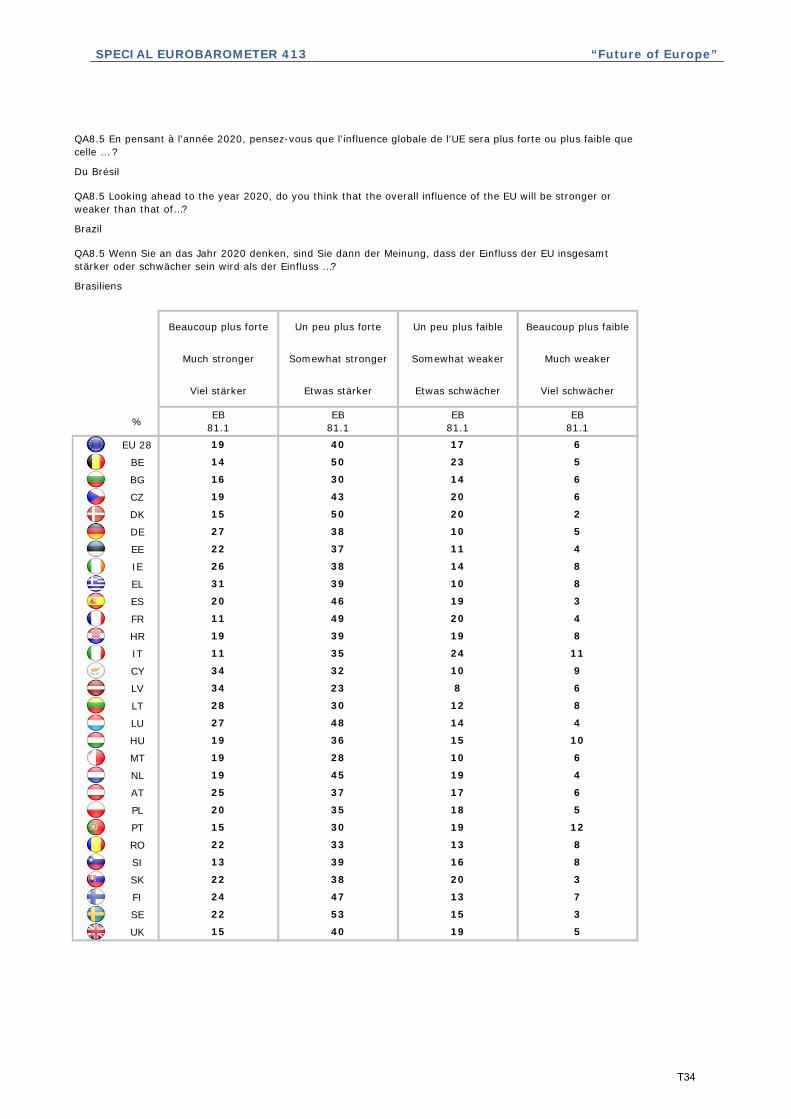
SPECIAL EUROBAROMETER 413 “Future of Europe”
%
EU 28
BE
BG
CZ
DK
DE
EE
IE
EL
ES
FR
HR
IT
CY
LV
LT
LU
HU
MT
NL
AT
PL
PT
RO
SI
SK
FI
SE
UK 15 40 19 5
22 53 15 3
24 47 13 7
22 38 20 3
13 39 16 8
22 33 13 8
15 30 19 12
20 35 18 5
25 37 17 6
19 45 19 4
19 28 10 6
19 36 15 10
27 48 14 4
28 30 12 8
34 23 8 6
34 32 10 9
11 35 24 11
19 39 19 8
11 49 20 4
20 46 19 3
31 39 10 8
26 38 14 8
22 37 11 4
27 38 10 5
15 50 20 2
19 43 20 6
16 30 14 6
14 50 23 5
19 40 17 6
EB81.1
EB81.1
QA8.5 Wenn Sie an das Jahr 2020 denken, sind Sie dann der Meinung, dass der Einfluss der EU insgesamt stärker oder schwächer sein wird als der Einfluss …?
Un peu plus forte
Somewhat stronger
Etwas stärker
EB81.1
Somewhat weaker
Etwas schwächer
EB81.1
Beaucoup plus forte Un peu plus faible
Much stronger
Viel stärker
Beaucoup plus faible
Much weaker
Viel schwächer
Brasiliens
QA8.5 En pensant à l'année 2020, pensez-vous que l'influence globale de l'UE sera plus forte ou plus faible que celle … ?
Du Brésil
QA8.5 Looking ahead to the year 2020, do you think that the overall influence of the EU will be stronger or weaker than that of…?
Brazil
T34

SPECIAL EUROBAROMETER 413 “Future of Europe”
%
EU 28
BE
BG
CZ
DK
DE
EE
IE
EL
ES
FR
HR
IT
CY
LV
LT
LU
HU
MT
NL
AT
PL
PT
RO
SI
SK
FI
SE
UK
75 18
3 18 55 24
2 5
60 23
1 8 71 20
10 7
55 21
6 18 52 24
6 18
55 23
7 17 45 31
6 16
64 23
7 8 62 23
5 8
55 25
3 34 47 16
11 9
58 20
2 5 75 18
4 18
66 19
9 20 57 14
2 13
58 27
10 9 46 35
3 12
66 22
3 13 60 24
1 11
64 22
6 6 70 18
14 0
65 15
7 19 59 15
12 8
62 26
5 8 65 22
6 6
64 28
10 24 46 20
5 3
EB81.1
EB81.1
6 12 59 23
EB81.1
EB81.1
Gleich (SPONTAN) WN Gesamt 'Stärker' Gesamt 'Schwächer'
NSP Total 'Plus forte' Total 'Plus faible'
The same (SPONTANEOUS) DK Total 'Stronger'
QA8.5 Wenn Sie an das Jahr 2020 denken, sind Sie dann der Meinung, dass der Einfluss der EU insgesamt stärker oder schwächer sein wird als der Einfluss …?
Brasiliens
La même (SPONTANE)
Total 'Weaker'
QA8.5 En pensant à l'année 2020, pensez-vous que l'influence globale de l'UE sera plus forte ou plus faible que celle … ?
Du Brésil
QA8.5 Looking ahead to the year 2020, do you think that the overall influence of the EU will be stronger or weaker than that of…?
Brazil
T35
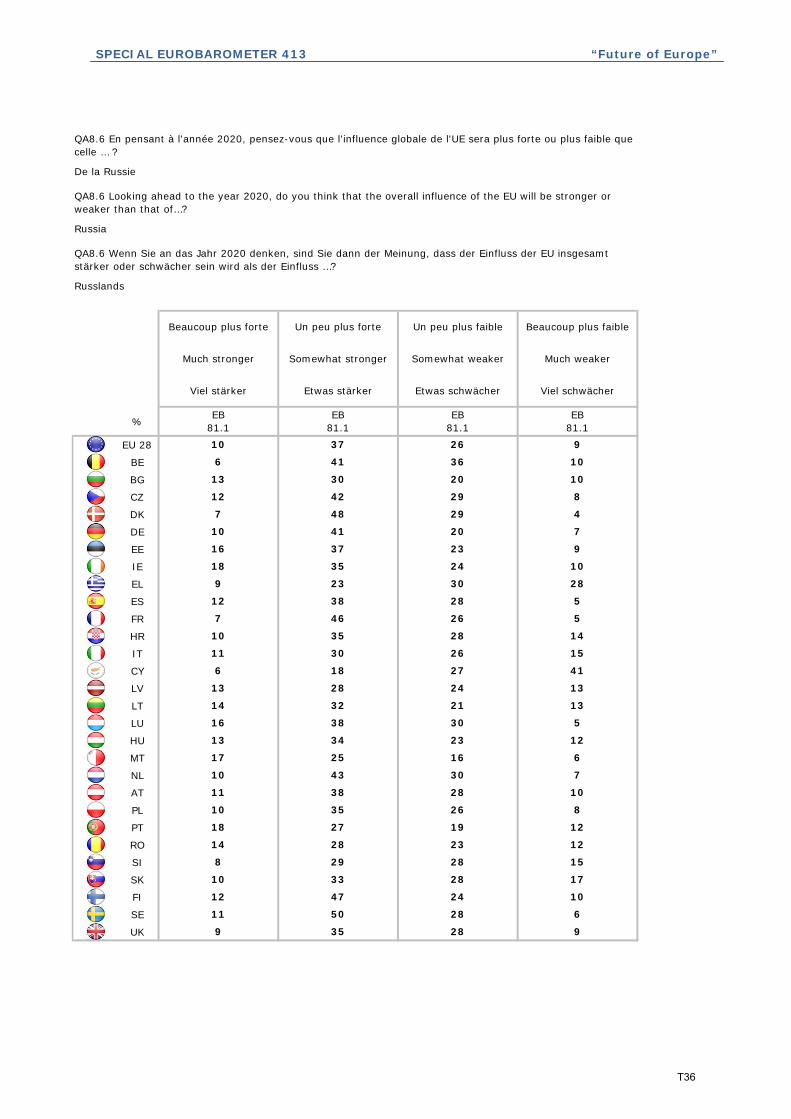
SPECIAL EUROBAROMETER 413 “Future of Europe”
%
EU 28
BE
BG
CZ
DK
DE
EE
IE
EL
ES
FR
HR
IT
CY
LV
LT
LU
HU
MT
NL
AT
PL
PT
RO
SI
SK
FI
SE
UK 9 35 28 9
11 50 28 6
12 47 24 10
10 33 28 17
8 29 28 15
14 28 23 12
18 27 19 12
10 35 26 8
11 38 28 10
10 43 30 7
17 25 16 6
13 34 23 12
16 38 30 5
14 32 21 13
13 28 24 13
6 18 27 41
11 30 26 15
10 35 28 14
7 46 26 5
12 38 28 5
9 23 30 28
18 35 24 10
16 37 23 9
10 41 20 7
7 48 29 4
12 42 29 8
13 30 20 10
6 41 36 10
10 37 26 9
EB81.1
EB81.1
QA8.6 Wenn Sie an das Jahr 2020 denken, sind Sie dann der Meinung, dass der Einfluss der EU insgesamt stärker oder schwächer sein wird als der Einfluss …?
Un peu plus forte
Somewhat stronger
Etwas stärker
EB81.1
Somewhat weaker
Etwas schwächer
EB81.1
Beaucoup plus forte Un peu plus faible
Much stronger
Viel stärker
Beaucoup plus faible
Much weaker
Viel schwächer
Russlands
QA8.6 En pensant à l'année 2020, pensez-vous que l'influence globale de l'UE sera plus forte ou plus faible que celle … ?
De la Russie
QA8.6 Looking ahead to the year 2020, do you think that the overall influence of the EU will be stronger or weaker than that of…?
Russia
T36

SPECIAL EUROBAROMETER 413 “Future of Europe”
%
EU 28
BE
BG
CZ
DK
DE
EE
IE
EL
ES
FR
HR
IT
CY
LV
LT
LU
HU
MT
NL
AT
PL
PT
RO
SI
SK
FI
SE
UK
61 34
5 14 44 37
2 3
43 45
3 4 59 34
8 4
42 35
9 11 37 43
7 16
45 34
5 19 45 31
5 16
53 37
8 5 49 38
6 4
47 35
4 32 42 22
12 6
46 34
5 6 54 35
6 14
24 68
13 9 41 37
3 5
45 42
10 8 41 41
4 9
50 33
5 11 53 31
3 14
53 34
6 4 32 58
13 0
51 27
8 7 53 32
17 5
54 37
6 6 55 33
6 3
47 46
11 16 43 30
5 2
EB81.1
EB81.1
8 10 47 35
EB81.1
EB81.1
Gleich (SPONTAN) WN Gesamt 'Stärker' Gesamt 'Schwächer'
NSP Total 'Plus forte' Total 'Plus faible'
The same (SPONTANEOUS) DK Total 'Stronger'
QA8.6 Wenn Sie an das Jahr 2020 denken, sind Sie dann der Meinung, dass der Einfluss der EU insgesamt stärker oder schwächer sein wird als der Einfluss …?
Russlands
La même (SPONTANE)
Total 'Weaker'
QA8.6 En pensant à l'année 2020, pensez-vous que l'influence globale de l'UE sera plus forte ou plus faible que celle … ?
De la Russie
QA8.6 Looking ahead to the year 2020, do you think that the overall influence of the EU will be stronger or weaker than that of…?
Russia
T37