specialty-batch chemicals | us epa archive · pdf filespecialty-batch chemicals 77 ... not a...
TRANSCRIPT

Specialty-Batch Chemicals
77
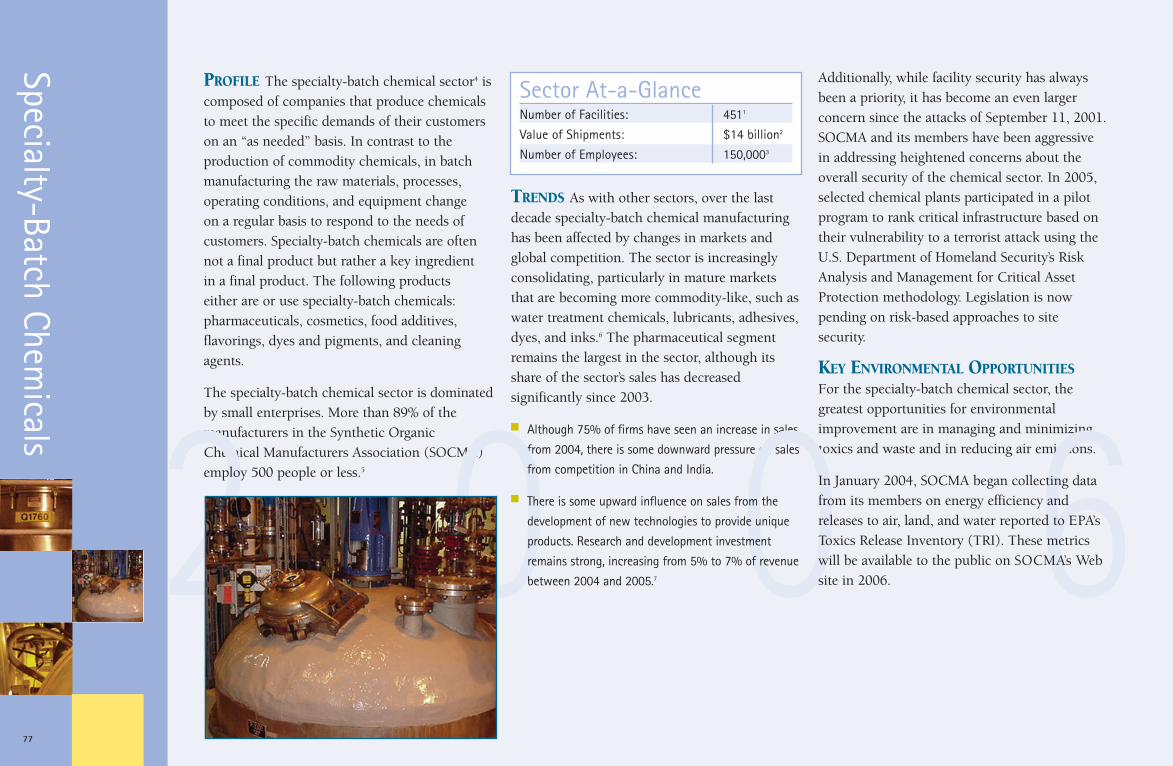
PROFILE The specialty-batch chemical sector4 is composed of companies that produce chemicals to meet the specific demands of their customers on an “as needed” basis. In contrast to the production of commodity chemicals, in batch manufacturing the raw materials, processes, operating conditions, and equipment change on a regular basis to respond to the needs of customers. Specialty-batch chemicals are often not a final product but rather a key ingredient in a final product. The following products either are or use specialty-batch chemicals: pharmaceuticals, cosmetics, food additives, flavorings, dyes and pigments, and cleaning agents.
The specialty-batch chemical sector is dominated by small enterprises. More than 89% of the
Sector At-a-Glance Number of Facilities: 4511
Value of Shipments: $14 billion2
Number of Employees: 150,0003
TRENDS As with other sectors, over the last decade specialty-batch chemical manufacturing has been affected by changes in markets and global competition. The sector is increasingly consolidating, particularly in mature markets that are becoming more commodity-like, such as water treatment chemicals, lubricants, adhesives, dyes, and inks.6 The pharmaceutical segment remains the largest in the sector, although its share of the sector’s sales has decreased significantly since 2003.
Additionally, while facility security has always been a priority, it has become an even larger concern since the attacks of September 11, 2001. SOCMA and its members have been aggressive in addressing heightened concerns about the overall security of the chemical sector. In 2005, selected chemical plants participated in a pilot program to rank critical infrastructure based on their vulnerability to a terrorist attack using the U.S. Department of Homeland Security’s Risk Analysis and Management for Critical Asset Protection methodology. Legislation is now pending on risk-based approaches to site security.
KEY ENVIRONMENTAL OPPORTUNITIES For the specialty-batch chemical sector, the greatest opportunities for environmental
manufacturers in the Synthetic Organic ■ Although 75% of firms have seen an increase in sales improvement are in managing and minimizing
Chemical Manufacturers Association (SOCMA) from 2004, there is some downward pressure on sales toxics and waste and in reducing air emissions. 2 0 0 6 employ 500 people or less.5 from competition in China and India. In January 2004, SOCMA began collecting data
■ There is some upward influence on sales from the from its members on energy efficiency and
development of new technologies to provide unique releases to air, land, and water reported to EPA’s
products. Research and development investment Toxics Release Inventory (TRI). These metrics
remains strong, increasing from 5% to 7% of revenue will be available to the public on SOCMA’s Web
between 2004 and 2005.7 site in 2006.

MANAGING AND MINIMIZING TOXICS Specialty-batch chemical facilities use a variety of chemicals and report on the release and management of many of those materials through TRI.
In 2003, 313 facilities in the sector reported 2.7 billion pounds of chemicals released (including disposal) or otherwise managed through treatment, energy recovery, or recycling. Of this quantity, 96% was managed, while the remaining 4% was disposed or released to the environment, as shown in the TRI Waste Management pie chart. Of those chemicals disposed or released to the environment, 65% were disposed and 35% were released into air or water.
TRI Waste Management by the Specialty-Batch Chemicals SectorEnergy
Recovery Treatment 14%
Releases 4%
Air Releases
39%
Water Releases
Disposal 65%
Recycling 6% 29% 43%
Source: U.S. EPA, 2003.
As shown in the Total TRI Disposal or Other Releases line graph, the annual normalized quantity of chemicals released by the specialty-batch chemical sector decreased by 6% from 1994 to 2003, including a continuous decline in recent years. During the same 10-year period, normalized releases to air and water decreased by 35%, remaining fairly steady from 2000 to 2003.
In 2003, the releases by the sector were made up of many chemicals. Nitrate compounds accounted for 20% of the total pounds, while ammonia, methanol, ethylene, and acrylonitrile accounted for another 32%.8
Total TRI Disposal or Other Releases by the Specialty-Batch Chemicals Sector
* Normalized by annual value of shipments for all of SIC code 28. Sources: U.S. EPA, U.S. Census Bureau.
Poun
ds (
mill
ions
)*
Year Disposal or Releases, total Air and Water Releases, only
0
20
40
60
80
100
120
140
1994 1995 1996 1997 1998 1999 2000 2001 2002 2003
Data from TRI allow comparisons of the total quantities of a sector’s reported chemical releases across years, as presented below. However, this comparison does not take into account the relative toxicity of each chemical. Chemicals vary greatly in toxicity, meaning they differ in how harmful they can be to human health. To account for differences in toxicities, each chemical can be weighted by a relative toxicity weight using EPA’s Risk-Screening Environmental Indicators (RSEI) model.
The TRI Air and Water Releases line graph presents trends for the sector’s air and water releases in both reported pounds and toxicity-weighted results. When weighted for toxicity, the sector’s normalized air and water releases decreased by 33% between 1994 and 2003, despite an increase in 2003.
TRI Air and Water Releases by the Specialty-Batch Chemicals Sector
* Normalized by annual value of shipments for all of SIC code 28. Sources: U.S. EPA, U.S Census Bureau.
Poun
ds (
mill
ions
)*
Toxi
city
-Wei
ghte
d Re
sults
(bi
llion
s)*
Year Pounds Toxicity-Weighted Results
0
10
20
30
40
50
60
70
80
1994 1995 1996 1997 1998 1999 2000 2001 2002 2003 0
2
4
6
8
10
12
14
16
18
Specialty-Batch Chemicals
78
Specialty-Batch Chemicals
79
The table below presents a list of the chemicals released that accounted for 90% of the sector’s total toxicity-weighted releases to air and water in 2003. More than 98% of the sector’s toxicity-weighted results were attributable to air releases, while discharges to water accounted for less than 2%. Therefore, reducing air emissions of these chemicals represents the greatest opportunity for the sector to make progress in reducing the toxicity of its releases.
2 0 0 6 Top TRI Chemicals Based on Toxicity-Weighted Results
AIR RELEASES (98%) WATER RELEASES (<2%) Chlorine Diaminotoluene
Diisocyanates Sulfuric Acid
Diaminotoluene Manganese
NickelDicyclopentadiene
1,3-ButadienePropyleneimine
Polycyclic Aromatic— Compounds
AnilineBromine
NaphthaleneHydrochloric Acid
Toluene Diisocyanate
1,2,3-Trichloropropane Certain Glycol Ethers
CopperLead
S o u r c e : U . S . E P A oxides, 24,201 tons of carbon monoxide, and 22,438 tons of volatile organic compounds.12
Air Toxics Air toxics, also called hazardous air pollutants, are a subset of the TRI chemicals presented above. The Clean Air Act designates 188 chemicals (182 of which are included in TRI) that can cause serious health and
Criteria Air Pollutants EPA’s National environmental effects as air toxics. Emissions Inventory estimates that, in 1999, the specialty-batch chemical sector released 44,260 tons of sulfur dioxide, 42,399 tons of nitrogen
For air releases, chlorine, diisocyanates, and sulfuric acid have consistently been the sector’s top-ranked chemicals based on toxicity-weighted results. These three substances accounted for 68% of the sector’s toxicity-weighted results for air releases in 2003. From 2000 to 2003, normalized releases to air of chlorine, diisocyanates, and sulfuric acid increased by 11%, 9%, and 84% respectively.9
REDUCING AIR EMISSIONS The specialty-batch chemical sector releases both air toxics and criteria air pollutants. Although emissions of air toxics during the manufacturing process are largely captured in the TRI air releases discussed above, this section takes a closer look at both of these chemical categories.
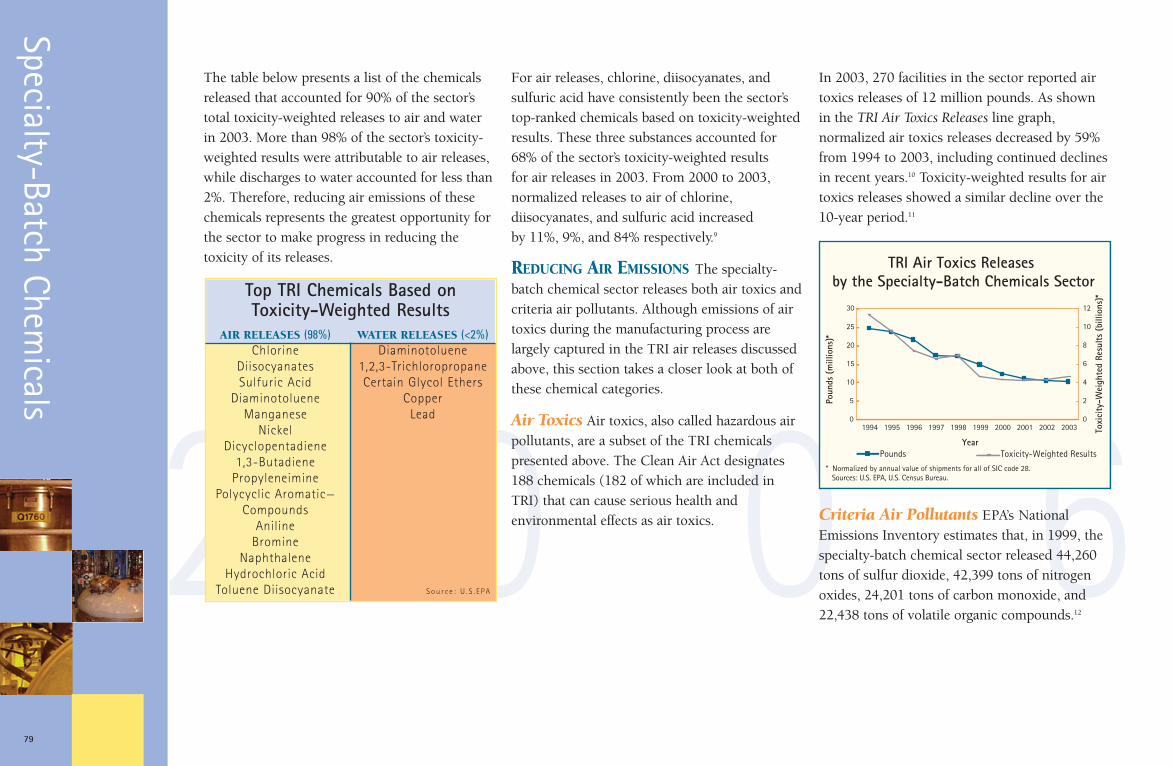
In 2003, 270 facilities in the sector reported air toxics releases of 12 million pounds. As shown in the TRI Air Toxics Releases line graph, normalized air toxics releases decreased by 59% from 1994 to 2003, including continued declines in recent years.10 Toxicity-weighted results for air toxics releases showed a similar decline over the 10-year period.11
TRI Air Toxics Releases by the Specialty-Batch Chemicals Sector
Poun
ds (
mill
ions
)*
Toxi
city
-Wei
ghte
d Re
sults
(bi
llion
s)*
5
10
15
20
25
30
2
4
6
8
10
12
* Normalized by annual value of shipments for all of SIC code 28. Sources: U.S. EPA, U.S. Census Bureau.
Year Pounds Toxicity-Weighted Results
0 1994 1995 1996 1997 1998 1999 2000 2001 2002 2003
0
MANAGING AND MINIMIZING WASTE EPA hazardous waste data on large quantity generators, as reported in the National Biennial RCRA Hazardous Waste Report, indicate that the specialty-batch manufacturing sector accounted for 9% of the hazardous waste generated nationally in 2003.
In 2003, 253 specialty-batch chemical facilities reported 2.6 million tons of hazardous waste generated, although one facility accounted for 74% of this total. Approximately 70% of the waste generated by this sector was from
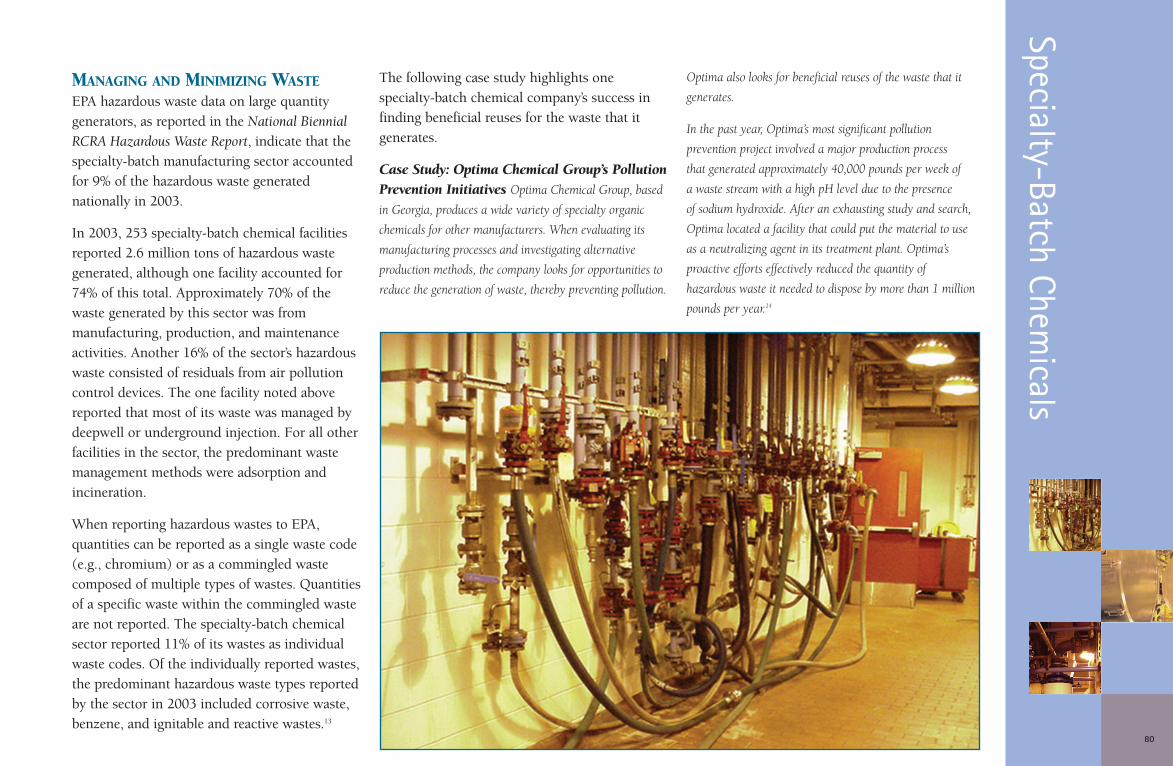
The following case study highlights one specialty-batch chemical company’s success in finding beneficial reuses for the waste that it generates.
Case Study: Optima Chemical Group’s Pollution Prevention Initiatives Optima Chemical Group, based
in Georgia, produces a wide variety of specialty organic
chemicals for other manufacturers. When evaluating its
manufacturing processes and investigating alternative
production methods, the company looks for opportunities to
reduce the generation of waste, thereby preventing pollution.
Optima also looks for beneficial reuses of the waste that it
generates.
In the past year, Optima’s most significant pollution
prevention project involved a major production process
that generated approximately 40,000 pounds per week of
a waste stream with a high pH level due to the presence
of sodium hydroxide. After an exhausting study and search,
Optima located a facility that could put the material to use
as a neutralizing agent in its treatment plant. Optima’s
proactive efforts effectively reduced the quantity of
hazardous waste it needed to dispose by more than 1 million
pounds per year.14
manufacturing, production, and maintenance activities. Another 16% of the sector’s hazardous waste consisted of residuals from air pollution control devices. The one facility noted above reported that most of its waste was managed by deepwell or underground injection. For all other facilities in the sector, the predominant waste management methods were adsorption and incineration.
When reporting hazardous wastes to EPA, quantities can be reported as a single waste code (e.g., chromium) or as a commingled waste composed of multiple types of wastes. Quantities of a specific waste within the commingled waste are not reported. The specialty-batch chemical sector reported 11% of its wastes as individual waste codes. Of the individually reported wastes, the predominant hazardous waste types reported by the sector in 2003 included corrosive waste, benzene, and ignitable and reactive wastes.13
Specialty-Batch Chemicals
80