speciation analysis of arsenic and selenium by hplc and
TRANSCRIPT

University of Plymouth
PEARL https://pearl.plymouth.ac.uk
04 University of Plymouth Research Theses 01 Research Theses Main Collection
2003
Speciation Analysis of Arsenic and
Selenium by HPLC and Mass
Spectrometry
Fitzpatrick, Sarah Anne
http://hdl.handle.net/10026.1/2702
University of Plymouth
All content in PEARL is protected by copyright law. Author manuscripts are made available in accordance with
publisher policies. Please cite only the published version using the details provided on the item record or
document. In the absence of an open licence (e.g. Creative Commons), permissions for further reuse of content
should be sought from the publisher or author.

Speciation Analysis of Arsenic and Selenium by HPLC
and Mass Spedrometry
By
Sarah Anne Fitzpatrick
A thesis submitted to the University of Plymouth
in partial fulfilment for the degree of
Doctor of Philosophy
Deparbnent of Environmental Sciences
University of Plymouth
In collaboration with
European Community 'Competitive and Sustainable Growth' Programme
June2003

UNIVEW;ITV (, . . ' I OUTH
nem No. 9ioo5b9b ~-~';}._
Date i 7 NOV :::J ~ Class.No.~~j~_ 61 !f. Cont. No. · ., u '+lo.~~$~~
PLYMOv ~:~ ~.f'_•; ~lV _ __.
LIBRARY STORE

Abstract
New methodologies have been developed for the determination of arsenic and selenium species in a variety of environmentally important matrices. A simple liquid chromatographic separation technique based upon mini-column technology was developed to obtain a simultaneous, fast, efficient and reliable separation of relatively toxic from relatively non-toxic arsenic and selenium species. The relatively toxic arsenic and selenium species studied were inorganic Asv, As111
, Se vt and SeiV. The relatively non-toxic species of arsenic and selenium studied were AsBet, DMA and Se Met. Optimum conditions were found to be the use of a Hamilton PRP XIOO 12-20 J.lm anion-exchange resin with column dimensions of lOO x 3 mm. The mobile phase utilized a 10 mM K2S04 solution at pH 10.2 with a flow rate of 1 ml min·1 and a sample injection loop of I 00 1-1'- Total analysis time was under 7 minutes with limits of detection in the range of 2.0 - 10 11g kg·1 for arsenic and selenium species, respectively.
Work was undertaken, using HPLC-ICP-MS instrumentation, as part of a feasibility study, into the production and certification of six new reference materials; these being analyzed for the species of arsenic, in chicken, fish, rice and soil samples, and selenium, in wheat and yeast samples. Enzyme extraction techniques were used throughout, except for soil where a microwave H3P04 extraction was used. Efficiencies were in the range 90-100%. The results obtained provided speciation information as well as total elemental concentrations with no operationally defined limits.
Speciation analysis requires that the endogenous species are extracted without modification of their chemical form or disturbance to the equilibrium existing between the various species present. Work was undertaken to identify and quantify the selenium species present in two samples of novel, previously unstudied, bio-natured nutrients, these nutrients being: i) a selenized yeast from a new process and: ii) a probiotic bacteria-based dried milk sample (Biogurt®). Specific interest was directed towards enzyme, MeOH and KOH and TMAH extraction efficiencies together with retention of species information. Selenium speciation was performed using ion-exchange HPLC-ICP-MS. It was found that the selenium content, in the form of SeMet, was adequately extracted from the yeast (Pharma Nord) that was used for method validation using protease, which yielding 90% of the total selenium. However, the determination of selenium and selenium species in the bionatured nutrients proved to be quite problematic. Methods that avoided species conversion with the highest extraction efficiencies were found to be: i) the use of protease for the yeast sample (19"/o) and; ii) the use ofO.OI M HCI for the Biogurt® (71%). Information obtained from speciation of these samples by anion and cation-exchange HPLC-ICP-MS was limited due to the low extraction efficiencies of any procedure undertaken for the samples, by the retention of the analyte on-column and by the lack of standards available for matching of retention times.
HPLC-ICP-MS has proved an efficient tool for the identification and determination of arsenic and selenium species providing detection limits at J.lg kg·' levels. However, a major concern with this instrumentation is the unambiguous assignment of peaks which relies on the chromatographic purity ofthe signal and the availability of standards. Anion-exchange chromatography employing Hamilton PRP XIOO resin with ~HC03 (10 mM, pH 10.2 for arsenic and 10-50 mM, pH 5 for selenium species) with methanol (10 %, v/v) as the mobile phase allowed separation of the arsenic and selenium speci~ investigated under conditions that were compatible for both HPLC-ICP-MS and HPLC-ESMS. Molecular ions and structural fragmentation patterns of these by tandem MS have facilitated the identification of chromatographic peaks obtained using HPLC-ICP-MS. In the analysis of marine algae, arsenosugars were the major species found, and in yeast the dominant species was found to be selenomethionine.

Contents
CHAPTER ONE 1
1 IN'TRODUCTION . .......................... ................................... . . 2
1.1 TRACE ELEMENT SPECIATION ............ ....... . .. . ................................... .... ........ 2
1.2 ARSENIC COMPOUNDS .............................. .......... ......................................... 3
1.2.1 Occurrence of arsenic in the environment .. ............. ..... ........ .. .. ... ...... 3
1. 2. 2 Distribution of arsenic in the marine environment ........................... . 5
1.2.3 Biotransformations of arsenic compounds ... ........................... .... ...... 8
1.2.4 Toxicology of arsenic compounds ................................................. ... 11
1.3 SELENIUM COMPOUNDS .... .... .. ... . ........ ... .......... ....................... ...... . . .. ......... 12
1. 3.1 Occurrence of selenium in the environment .................................. ... 12
1. 3. 2 Biotransformations of selenium in plants and humans ........ ... ........ 16
1.3.3 Selenium as an essential element in the diet .................................... 19
1.4 METHODS FOR TilE SPEClA TTON OF ARSENIC AND SELENIUM ... . .......... .. ... .. 23
1.4.1 High performance liquid chromatography ........ ....... .... .. ....... .......... 24
1.4.1.1 Ion-exchange chromatography ... ... ... .............. . ....... ..... ... ...... 24
1.4.2 Inductively coupled plasma-mass spectrometry (ICP-MS) ........ . ... 26
1.4.3 Electrospray ionization mass spectrometry (ES-MS) ......... ............. 31
1.5 THE SPEClATION OF ARSENIC AND SELENIUM ... . ... . .. ........... • . ...... . .. .. . 35
1.5.1 The use ofHPLC-ICP-MSfor speciation analysis ....... ................... 35
1. 5. 2 The use of HP LC-ESMS in speciation analysis ...................... ......... 41
1.6 AIMS OF THE STUDY .....••.•... ........•...•....•.•...•...••............. . .... ............... .. ...... 44
ii

2 DEVELOPMENT OF A NOVEL LC-ICP-MS SYSTEM FOR THE
SIMULTANEOUS SEPARATION AND DETERMINATION OF ARSENIC
AND SELENIUM SPECIES BASED UPON TOXICITY .••.•••••••••••..•••••. 48
2.1 INTRODUCfiON ..... ....... ...... ........ .. .......................... ... ....... ... ................. ...... 48
2.2 EXPERIMENTAL ..... ... ......................... ....... ...... ... ... ..................................... 52
2. 2.1 Instrumentation ............. ....... ........ ............................................ .... .... 52
2.2.2 Chemicals and Reagents ........ .......................................................... 54
2.2.3 Reference materials and samples ................. .. .. ........................ ........ 55
2.2.4 Sample digestion procedures ........................................................... 55
2.3 RESULTS AND DISCUSSION ..................................... ...... ........ ........ ........ ..... 59
2.3.1 Choice of chromatographic conditions ........... ..... ......................... ... 59
2.3.2 Speciation ofCRMs and real samples using LC-ICP-MS ............... 70
2.4 CONCLUSIONS ................ ... .... .................... ................................................ 74
3 FEASffiiLITY STUDY FOR THE SPECIATION OF ARSENIC AND
SELENIUM IN CANDIDATE REFERENCE MATERIALS •.......•.••.•.•.• 77
3.1 INTRODUCTION ......... ........................................................ ..... .... ... ............. 77
3.2 PREUMINARY SURVEY OF A VARIETY OF POSSIBLE FISH TYPES WITH
SUBSEQUENT HOMOGENEITY AND STABILITY STUDfES USING PLAICE ............ .... 80
3. 2. 1 Instrumentation ................................................... ......... .................... 80
3.2.2 Chemicals and reagents ....... .. .. ............. ................................. .......... 82
3. 2. 3 Chromatographic conditions for the determination of arsenic species83
3.2.4 Mass balance calculation ........................................................ .... ..... 84
iii

3.2.5 Sample preparation procedures for determination using ICP-MS and
HPLC-ICP-MS ............ ............ .. ........... ......... .... .............. ..... .. ........ ......... ..... 86
3. 2. 6 Sample preparation procedures for determination of reducible arsenic
in plaice samples using HG-AAS .. .......... ........................ .... .. ...... .... ........ .. ... 88
3.2. 7 Preparation of plaice samples for homogeneity and stability studies88
3.3 RESULTS AND DISCUSSION . .... ................................ ...... .. ........... ... ........ .. .. . 91
3. 3.1 Preliminary fish survey .............. ...................................................... 91
3.3.2 Homogeneity and stability studies .................................. ................. 98
3.4 INTER-LABORATORY COMPARISON OF ARSENIC AND SELENIUM SPECTES rN ALL
CANDIDATE REFERENCE MATERIALS ......... ........ ................. .......... . ... ............ ... 107
3. 4.1 Instrumentation ...................... ..................... ......................... .......... 107
3.4. 2 Chemicals and reagents ....................... ........................ ..... ... .... .. .... 107
3.4.3 Chromatographic conditions ...................... .. ........ ........ .... ....... ... ... 109
3.4.4 Sample preparation procedures .... .. ......... .......................... .. .......... 111
3. 4. 4.1. Microwave digestion for 'total' elemental concentration of arsenic in
fish, rice, chicken and soil and selenium in yeast and wheat... .. . .. . ... . . . .111
3.4.4.2. Enzymolysis extraction of arsenic (in fish, rice and chicken) and
selenium (in yeast and wheat) species ... ... .................. ... ................... . 112
3.4.4. 3. H3P04 microwave extraction for arsenic speciation in soi/.. ... 114
3.5 RESULTSAND DrSCUSSION ............. .. . ................. ..... ................ .. .......... ... llS
3.5.1 Results for total arsenic and arsenic species in fish, rice, chicken and
soil candidate reference materials ............................................................. 116
iv

3.5.2 Results for total selenium and selenium species in yeast and wheat
candidate reference materials ............ .. ...... .................... ............ .... ............ 135
3.6 CONCLUSIONS .. .. .. ................. .................... .. ...... .. .. .. .... .. ......... ... ....... ...... . 145
4 THE EXTRACTION AND SPECIATION OF SELENIUM
COMPOUNDS IN RIO-NATURED NUTRIENTS ...................•.......... 150
4.1 INTRODUCTION ............................. ......... .............. .... .... .... ................ .... .... 150
4.2 EXPERlMENTAL .. ......... ........ ....... . ....... ......... ..... . ... .......... .... .. .. ..... . .......... . 154
4. 2.1 Instrumentation .. ... .... ......... ...... .. ........ ...... ... ........ ......... ................. . 154
4.2.2 Scanning electron microscopy ............ ... .............. .......... .. .............. 155
4.2.3 Chemicals and reagents ...... ....................................... ....... ..... ........ 155
4.2.4 Chromatographic conditions for selenium speciation ... .... ... ....... .. 156
4.2.5 Sample preparation procedures ................. ............ ... ......... ......... .. . 157
4.3 R.ESUL TS AND DISCUSSION ...... ...... ... ... ... . ....... . ................. .. .. ....... ... .. ... .... 165
4.4 CONCLUSIONS ... ... . ....... ...... ... . ........................ ..... .. .. .... .. . ....... ..... .. ..... ...... 185
5 SPECIA TION OF ARSENIC AND SELENIUM USING IDGH
PERFORMANCE LIQUID CHROMATOGRAPHY WITH INDUCTIVELY
COUPLED PLASMA MASS SPECTROMETRY AND ELECTROSPRA Y
MASS SPECTROMETRY . ........................................................ .. 188
5.1 lNTRODUCfiON .. ................. .... .... ...... .. ....... ................... ......... .... ......... . .... 188
5.2 EXPERIMENTAL ........... .......... . .... ..... ........ .. .... ..... .................. .. ... ... ... ... ... . . 193
V

5.2.1 Speciation of arsenic compounds using HPLC-ICP-MS and HPLC-
ESMS .................................... ........ ....... ... ...... ......... ...... ............ ... 193
5.2.1.1. Instrumentation ................................................ ... ... ......... 193
5. 2.1. 2. Chemicals and reagents... ... .. . ... ... ... ... ... ... ... ... ... ... ... .. . .. . .. .. 195
5.2.1.3. HN03 digestion for total element determination ......... ........... 196
5. 2.1. 4. Enzymatic digestion procedures for extraction of arsenic species
from marine algae... .. . ...... ......... ... ... ...... ...... ... ..................... ...... .... 197
5. 2.1. 5. Chromatographic conditions for the determination of arsenic species
using HPLC-ICP-MS and HPLC-ESMS.. . ... ... ... ... ... ... ... ... ... ... ... ... . .. 197
5. 2.1. 6. Solid phase extraction (SP E) techniques... ... . .. .. . . .. . .. . .. .. . .. .. 198
5.3 RESULTS AND DISCUSSION ............ ........... ............................................... 199
5.3.1 Speciation of selenium compounds using HPLC-ICP-MS and HPLC-
ESMS ... ......... ........ ..... ... ..... .. ......... ......... ..... ............................. ....... ....... . ... 227
5.3.1.1. Instrumentation.. . . ..... ... ............... ... ... ............ .. ............ ... 227
5.3.1.2. Chemicals and reagents ...... ........ . ...... ....................... . ......... 228
5.3.1.3. HN03 digestion/or total element determination ... ... ................ 228
5.3.1.4. Enzymatic digestion procedure for extraction of selenium species in
yeast ..... .......... ......... ............... ..................... ........................ ... ...... 229
5.3.1.5. Chromatographic conditions for the determination of selenium
species using HPLC-ICP-MS and HPLC-ESMS. ... ... ............... ... ... ... .... 230
5.4 RESULTS AND DISCUSSION ...................................................................... 231
5.5 CONCLUSIONS ........... ........ .. .......................................... .......................... 241
vi

6 CONCLUSIONS AND FUTURE WORK ••.••..••••••.••.....••.•.•.••••.••..• 244
6.1 CONCLUSIONS .........•.••••.•......•................• .. . . ........ .• . .•....•...... 244
6.2 FUTURE WORK ... ... . .... . .. . ............ ... ..... . .. ... . .... ..... ...... . .... .. ... . 254
REFERENCES ••••••••••••••••••••••••••••••••••••••••••••••••••••••••••••••••.•••••••• 258
CONFERENCES, COURSES AND SEMINARS ATIENDED ........... . ............. 277
PUBLISHED WORK •..•••••.•••.•••...•••...•.•..•.•••••.••....•..•••....•.••..•••... 279
vii

List of tables
TABLE 1-1 COMMON USES OF ARSENIC COMPOUNDS ........ ....... ............................... 4
TABLE 1-2 .ARSENIC LEVELS DETERMINED IN ENVIRONMENTAL COMPARTMENTS . 4
TABLE 1-3 .ARSENICALS IN DIFFERENT MARINE COMPARTMENTS ..••.•....... .•.•. .•.... ..• 7
TABLE 1-4 LEVELS OF SELENIUM FOUND IN DIFFERENT ENVIRONMENTAL
COMPARTMENTS .. •...• ... .• ••.••.•. .. ...••.••..•...••. . ..•.....•....•. •.•..••.•... . •. 13
TABLE 1-5 SPECTROSCOPIC INTERFERENCES OF ARSENIC AND SELENIUM IN ICP-MS .
......... .... .. ... .. . ...................... . ... . .. ... ..... .... ......... .. ... .......... ... 29
TABLE 2-1 LDso VALUES FOR ARSENIC AND SELENfUM SPECIES UNDER
INVESTIGATION .. ••.. .......... •. ......... ... ..... .. .. .. . •....• ..... . ...... ..• ....•... 51
TABLE 2-2 ICP-MS OPERATING CONDITIONS USED FOR THE DETERMINATION OF
ARSENIC AND SELENIUM IN ALL SAMPLES •. ..•...•. ....... ....•.. .• .•......•..... ...•.. .... . . . . 53
TABLE 2-3 RANGE OF EXPERIMENTAL CHROMATOGRAPHIC CONDITIONS USED FOR THE
SEPARATION OF INORGANIC FROM ORGANIC ARSENIC AND SELENIUM
SPECIES ........•.............•...............•..... . ..•••.••..........•....•..•...••.•• 54
TABLE 2-4 PKA VALUES FOR ARSENIC AND SELENIUM COMPOUNDS .•................•. 60
TABLE 2-5 RESULTS OF SAMPLES ANALYZED USING LC-ICP-MS. ALL VALUES ARE
GIVEN IN MG KG· l, AS THE ELEMENT •... .•.•.••.•..•...•.•.••.•... .•.•••.. ..••••.••... .•........ .• 71
TABLE 3-1 ICP-MS OPERATING CONDITIONS USED FOR THE DETERMINATION OF TOTAL
AND ARSENIC SPECIES IN FISH SAMPLE EXTRACTS ............•...........•................ 81
viii

TABLE 3-2 OPERATING CONDITIONS FOR DETERMTNA TION OF REDUCffiLE ARSENIC IN
THE PLAICE SA.MPLE USING HG-AAS .... ..... ............................................ .. ..... 82
TABLE 3-3 ELUTION PROGRAMME FOR ANION-EXCHANGE HPLC OF ARSENIC SPECIES
USING A HAMILTON PRP Xl00 COLUMN .............. ....... ................................. 84
TABLE 3-4 ARsENIC SPECIATION FOR ALL FISH SA.MPLES. RESULTS GIVEN AS MO KG·I
IN TERMS OF THE ELEMENT AT 95 % CONFIDENCE INTER V AL. N = 3 .............. 92
TABLE 3-5 WITHIN AND BETWEEN - BOTTLE HOMOGENEITY FOR TOTAL AS AND
AsBET IN PLAICE ............................................................. ... ................ ... ...... lOO
TABLE 3-6 STABILITY STUDY OF TOTAL As IN PLAICE. VALUES OF RT ± UT OVER A 7
MONTH PERIOD AT TEMPERATURES OF 4°C, 20 °C AND 40 °C (BASELINE SET AT -
20°C VALUES) ............................................................................................ 104
TABLE 3-7 STABILITY STUDY OF AsBET IN PLAICE. VALUES OF RT ±UT OVER A 7
MONTH PERIOD AT TEMPERATURES OF 4°C, 20 °C AND 40 °C (BASELINE SET AT -
20°C VALUES) .................................................................................. .......... 106
TABLE 3-8 ELUTION PROGRAMME FOR ANION-EXCHANGE HPLC OF SELENIUM SPECIES
IN YEAST AND WHEAT CANDIDATE REFERENCE MATERIALS USING A IC SEP ANI
COLUMN ...................................................................................................... 110
TABLE 3-9 ELUTION PROGRAMME FOR ANION EXCHANGE HPLC OF ARSENIC SPECIES
IN SOIL USING A HAMILTON PRP Xl00 COLUMN ........................................ 111
TABLE 3-10 RESULTS FOR SA.MPLE TYPES IN DETERMINATION OF TOTAL ARSENIC AND
SPECIES. RESULTS GIVEN IN MG KG-1
AS THE ELEMENT ............. ....... .. .. 117
ix

TABLE 3-11 CRMS USED FOR TOTAL ELEMENT AND SPEC rES FOR SAMPLE TYPES UNDER
INVESTfGATION FOR ARSENIC. RESULTS GIVEN IN MG KG-I AS THE
ELEMENT ............ .. ..... . .. . .. ..... .... .. .... . . . ...•. . ... .. .... •.... . .... ........... 118
TABLE 3-12 LODs FOR ALL SAMPLES UNDER INVESTIGATION FOR ARSENIC
SPECIATION. RESULTS GIVEN IN J.lG KG-1
AS THE ELEMENT. RECOVERIES
CALCULATED FROM SPIKING EXPERIMENTS WITH x2 AND X4 EXPECTED SPEC rES
CONCENTRATIONS ............... . ............... . .......•.................. 0 0 • •• o o. 0119
TABLE 3-13 RESULTS FOR THE DETERMINATION OF TOTAL SELENIUM AND SPECIES IN
YEAST AND WHEAT. RESULTS GIVEN IN MG KG-1
AS THE
ELEMENT .. .. o •• o. o. o. 0 o . ..... ........ . .... o •••• o •••••• o •• •• ••••• o 0 ... . . .. . ....... 0 •• 13 5
TABLE 3-14 CRMs USED FOR TOTAL ELEMENT AND SPECIES FOR SAMPLE TYPES UNDER
INVESTIGATION FOR SELENIUM. RESULTS GIVEN IN MG KG-I AS THE ELEMENT
oo •••••••••oo oooO oOO oOOo Ooo oo OoOOOo OO oO o OoOOooOoooo o oOo OoOOOO OoOOo OOOOOOO oO o OO oOoO OO OOo136
TABLE 3-15 LODS FOR WHEAT AND YEAST SAMPLES UNDER INVESTIGATION FOR
SELENIUM SPECIES. RESULTS GIVEN IN f.!G KG-I AS THE ELEMENT. RECOVERIES
CALCULATED FROM SPIKING EXPERIMENTS WITH x2 AND X4 EXPECTED SPEC rES
CONCENTRATIONS . . o• 0. o • • o o o o o• • • o o. o o o. o .. .... ..... .. .. .......... .. . . ...... .. .. 0 0137
TABLE 3-16 RESULTS FROM PARTICIPATING LABORATORIES FOR 'TOTAL' SELENIUM
AND SEMET IN THE YEAST SAMPLKE- LAB NO. 1 =PLYMOUTH ..• . . . . o •••• •• 144
TABLE 4-1 ICP-MS OPERATING CONDITlONS FOR THE DETERMINATION OF ' TOTAL'
SELENIUM AND SELENIUM SPECIES IN YEAST AND BIOGURT® BY HPLC-ICP-MS,
USING ISOTOPES 77, 78 AND 82 ................ ........................................ .... 00 ••••• 154
X

TABLE 4-2 ELUTION PROGRAMME FOR ANION-EXCHANGE HPLC OF SELENIUM SPECIES
USING A DIONEX AS 11 COLUMN ............................... ...... . .................... ...... 156
TABLE 4-3 TOTAL SELENIUM DETERMINATION BY ALL EXTRACTION TECHNIQUES.
RESULTS GIVEN IN MO KG-I AS THE ELEMENT, SE, AND RSDs IN PARENTHESES .
...................................................................................... ............................. . 167
TABLE 4-4 EXTRACTION EFFICIENCIES AND MASS BALANCE DATA FOR SAMPLES UNDER
INVESTIGATION. RESULTS GIVEN IN MO KG-I AS THE ELEMENT, SE ....... . ..... 168
TABLE 4-5 R.ESUL TS FOR THE SPECIA TION OF SELENIUM IN THE THREE SAMPLES UNDER
INVESTIGATION. RESULTS GIVEN IN MO KG-I AS THE ELEMENT ............... 182
TABLE 5-1 ICP-MS OPERATING CONDITIONS FOR THE DETERMINATION OF 'TOTAL'
ARSENIC AND SPECIES fN SAMPLE EXTRACTS OF MARINE ALGAE USING HPLC-
ICP-MS, USING Miz 75 FOR ARSENIC MEASUREMENT ........................... .. .... 194
TABLE 5-2 INSTRUMENTAL OPERATING PARAMETERS FOR THE LDENTJFICATION OF
ARSENIC SPECIES PRESENT IN MARINE ALGAE USING DIRECT INJECTION ESMS
AND HPLC-ESMS ...................................................................................... 195
TABLE 5-3 FRACTION COLLECTION PROGRAMME FOR FUCUS SP. SAMPLES USING A
HAMILTON PRP X100 ANION-EXCHANGE COLUMN WITH A MOBILE PHASE OF 10
MM NRtHC03 + 10% MEOH. FLOW RATE OF 1 ML MIN-I AND A SAMPLE LOOP
VOLUME OF 200 1-tL ..................................................................................... 199
TABLE 5-4 COMPARISON OF RETENTION TIMES OF ARSENIC STANDARDS USING HPLC-
ICP-MS AND HPLC-ESMS UNDER THE SAME CHROMATOGRAPHIC CONDITIONS
(AS DESCRIBED IN SECTION 5.2.1.5) ............................................................ 203
xi

TABLE 5-5' TOTAL' As DETERMINED IN HN03/H202 AND ENZYMOLYSIS EXTRACTS
OF FUCUS SP. AND ASCOPHYLLUM NODOSUM USING ICP-MS. RESULTS ARE GrYEN
IN MG KG-I AS THE ELEMENT .................. ....... ....................................... ... ..... 208
TABLE 5-6 PEAK TIMES FOR FUCUS SP. SAMPLE USING HPLC-ESMS. RETENTION
RANGE AND PEAK POINTS ARE OBTAINED IN THE FULL ESMS MODE. TIME IS
GrvEN IN MlNUTES ....................................... ... .. .... .... ............. ...................... 218
TABLE 5-7 INSTRUMENTAL OPERATING PARAMETERS FOR THE IDENTIFICATION OF
SELENIUM SPECIES PRESENT IN YEAST USING DIRECT INJECTION ESMS AND
HPLC-ESMS ...................................... ..............•......................................... 227
TABLE 5-8 ELUTION PROGRAM FOR SELENIUM SPECIA TION USING HPLC-ICP-MS230
TABLE 5-9 TOTAL SELENIUM IN HN03/H202 AND ENZYME DIGESTS OF YEAST USING
ICP-MS. RESULTS ARE GIVEN IN MG KG-1
AS THE ELEMENT ....................... 232
TABLE 5-10 SELENIUM ISOTOPES AND THEIR NATURAL ABUNDANCE ... . ... . ..... 234
x.ii

List of figures
FIGURE 1-1 COMMON ORGANOARSENIC COMPOUNDS .... ... .. ..... .. .... ... ....... ... ..... .... .. 6
FIGURE 1-2 PROPOSED PATHWAY FOR THE BIOGENESIS BY ALGAE OF ARSENIC
CONTAINING RffiOSIDES FROM ARSENATE. THE KEY INTERMEDIATE (COMPOUND
13) UNDERGOES GLYCOSIDATION WITH AVAILABLE ALGAE METABOLITES TO GfVE
THE RANGE OF DIMETHYLARSINYLRmOSIDES FOUND IN MARINE ALGAE ........ 9
FIGURE 1-3 PROPOSED ARSENIC CYCLE IN THE MARINE ENVIRONMENT . .•......... ..• 11
FIGURE 1-4 STRUCTURES OF SOME ENVIRONMENTALLY IMPORTANT SELENIUM
COMPOUNDS ... . . ... ........ ... . . .... .... . ..•. .•.. ... .. . ..... . ......... . ....... . . . . . .. 15
FIGURE 1-5 SELENIUM METABOLIC PATHWAY. GS-SE-SG = SELENODIGLUTATHIONE,
GS-SEH = GLUTATHIONE SELENOPERSULPHlDE . .... ... . .... ... .. . . . . .. .. ... .. ... ...... 19
FIGURE 1-6 SCHEMATIC OF AN ICP-MS INSTRUMENT... .... .......... .... .. ......... . 27
FIGURE 1-7 SCHEMA TIC OF MAJOR PROCESSESS OCCURRING IN ELECTROSPRA Y .. . .. 33
FIGURE 2-1 PROTOCOL SHOWING PROGRESS THROUGH A SPECIATION ANALYSIS WHICH
DEMONSTRATES INHERENT SCREENING STEPS ............................................... 50
FIGURE 2-2 STRUCTURE OF AS BET ................................... ..... ............................. 59
FIGURE 2-3 PREDOMINANCE DIAGRAM OF As V AS A FUNCTION OF PH .... ......... ... 61
F IGURE 2-4 PREDOMINANCE DIAGRAM OF SE1v AS A FUNCTION OF PH .............. .. 61
FIGURE 2-5 CHROMATOGRAM OF 4 ARSENIC STANDARDS (250 j.lG L-1) OBTAJNED
USJNG A HAMILTON PRP Xl00 COLUMN, 100 X 3 MM DIMENSIONS, WITH A 10
MM K2S04, PH 10.2, MOBILE PHASE DEMONSTRATING THE SEPARATION OF
xili

ORGANlC FROM INORGANIC SPECIES. PEAK 1, AsBET AND DMA; PEAK 2, Asm
(OXIDIZED TO As V) AND AS V ••••••.••........•••••••.••••••••••••••.•••.•.•.•••••.•••• 63
FIGURE 2-6 CHROMATOGRAM OF THREE SELENfUM STANDARDS (250 J.!G L-1)
OBTAINED USING A HAMILTON PRP X100 COLUMN, 100 X 3 MM DlMENSIONS,
WITH A 10 MM K2S04, PH 10.2, MOBILE PHASE DEMONSTRATING THE
SEPARATION OF ALL SPECIES. PEAK 1, SEMET; PEAK 2, SErv; PEAK 3, 8Ev1 ... 67
FIGURE 2-7 CHROMATOGRAM DEMONSTRATING THE SfMULTANEOUS SEPARATION OF
FOUR ARSENIC AND THREE SELENTUM SPECIES UNDER THE SAME EXPERIMENTAL
CONDITIONS- HAMILTON PRP XlOO (100 X 3 MM) COLUMN, 10 MM K2S04
MOBILEPHASE, PH 1 0 .2, ,ELUENT FLOW RATE OF 1.25 ML MIN-I. PEAKS: 1 ,AS BET
... ...... 68
FIGURE 2-8 GRAPH DEMONSTRATING THE LINEARITY OBTAINED FOR THE SELENIUM
SPECIES ON SIMULTANEOUS SEPARATION TOGETHER WITH ARSENIC SPECIES USING
A HAMILTON PRP XIOO MINl-COLUMN (100 x3 MM I.D.) . .. ... ...... . .. 69
FIGURE 2-9 GRAPH DEMONSTRATING THE LINEARITY OBTAINED FOR THE ARSENIC
SPECIES ON STMULTANEOUS SEPARATION TOGETHER WITH SELENIUM SPECIES
USING A HAMLLTONPRP Xl00 MINI-COLUMN(lOO x3 MM 1.0.)...... ..70
FIGURE 2-10 CHROMATOGRAM OF TORT-2 DEMONSTRATING THE SIMULTANEOUS
SEPARATION OF ORAGIC ARSENIC (MASS 75) AND SEMET (MASS 82) USING
OPTIMUM MINI-COLUMN LC-ICP-MS CONDITIONS... . . ... ........ . .. ... 73
x.iv

'
FIGURE 3-1 FLOW DIAGRAM FOR ACQU1SITJON OF MASS BALANCE DATA .... ........ . 85
FIGURE 3-2 FLOWCHART FOR THE PREPARATION OF FISH SAMPLES BY THE UNNERSITY
OF PLYMOUTH AND IRMM. ····················· ·············································· ··· ···· 89
FIGURE 3-3 CHROMATOGRAM OBTAINED USING ANION-EXCHANGE HPLC-ICP-MS OF
ARSENIC STANDARDS AT 250 f.lG L-1, l =AsBET; 2 = DMA; 3=MMA; 4=Asv.
CONDITIONS AS SHOWN IN TABLE 3-3 ........ ..... .•. .. ...... .......•..•.. ..•..... ....... ...... . 94
FIGURE 3-4 CHROMA TOO RAM OF PLAICE USING ANION-EXCHANGE HPLC-ICP-MS,
USING CONDITIONS SHOWN IN TABLE 3 -3. PEAKS: 1, AsBET; 2, Asv/
ARTEFACT ....... . . . .•....•.. . ..........•...... .. . ..... .. •....... .... ... .•..•.. ... .... 94
FIGURE 3-5 CHROMATOGRAM OBTAINED USING CATION-EXCHANGE HPLC-ICP-MS,
USING A PARTISIL SCX 10 COLUMN WITH 20 MM PYRIDINE AT PH 3, OF ARSENIC
STANDARDS AT250 f.lG L-1 OF: 1, DMA; 2, ASBET; 3,TMA0 .....•... ... ... 96
FIGURE 3-6 CHROMATOGRAM OF PLAICE SAMPLE USING CATION-EXCHANGE HPLC
ICP-MS, USING A PARTISIL SCX 10 COLUMN AND ELUENT OF 20 MM PYRIDINE,
PH 3. P EAK I = As BET .... ... . . ... .. . .... ............. ...... . ..... ... .... . ..... 96
FIGURE 3-7 STABILITY STUDY OF 'TOTAL' AS IN PLAICE AT TEMPERATURES SET AT
4°C, 20°C AND 40)C (BASELINE SET AT -20°C VALUES) TO IDENTIFY ANY
CHANGES OVER TIME ...... . ......................... . ..... . ...... . . . .. ........ 1 03
FIGURE 3-8 STABILITY STUDY OF ASBET IN PLAICE AT TEMPERATURES SET AT 4°C,
20°C AND 40)C (BASELINE SET AT -20°C VALUES) TO IDENTIFY ANY CHANGES
OVER TIME ...•... •.. ... •.... .. •...... ..• .. ......•...... . . .. .............. . . .. . . 1 05
XV

FIGURE 3-9 CHROMATOGRAM OBTAINED USING ANION-EXCHANGE HPLC-ICP-MS OF
ARSENIC STANDARDS AT 250 J..LG L-1, 1 = AsBET; 2=DMA; 3=MMA; 4= As v.
CONDITIONS SHOWN IN TABLE 3-3 .... .. . . ... .. .................. .. . .... . ... . ... 12 0
F1GURE3-10 CHROMATOGRAM OF PLAICE USING ANION-EXCHANGE HPLC-ICP-MS
(CONDfTIONS SHOWN IN TABLE 3-3). PEAK 1 = ASBET . .......... . .......... l20
FIGURE 3-11 CHROMATOGRAM OBTAINED USING ANION-EXCHANGE HPLC-ICP-MS
OF ARSENIC STANDARDS AT 250 uG L-1 l = ASBET' 2= DMA· 3= MMA· 4= Asv r ' ' ' ' .
CONDITIONS SHOWN IN TABLE 3-3 .. . . ............ .. . . ....... .... .... .......... 123
FIGURE 3-12 CHROMATOGRAM OF RICE SAMPLE BY AN10N-EXCHANGE HPLC-ICP-MS
(CONDITIONS SHOWN IN TABLE 3-3). PEAKS: 1, DMA; 2, MMA; 3,
As vI Asr11
•• •• ••• • •• • • •••• • • ••••••••••••• • • • • • •• •••• •••• • • •••••• •• •• • •••••••• •• • ••• .123
FIGURE 3-13 CHROMATOGRAM OF ARSENIC STANDARDS, 250 J!G L-l, USING CATION-
EXCHANGE HPLC-lCP-MS: 1= Asv; 2 = Aslll; 3 = DMA; 4 = AsBET (PARTISIL
SCX 10 COLUMN WITH 20 MM PYRfDINE, PH 3) . .... . . .... ..... . .... . . . . .. 125
FIGURE 3 -14 CHROMATOGRAM OF RICE SAMPLE BY CATlO-EXCHANGE HPLC-ICP-MS
USING A PARTISIL SCX 10 COLUMN AND 2 0 MM PYRIDINE ELUENT AT PH 3.
PEAKS: 1, Asv/MMA; 2, Asm; 3, DMA . .. •..•... . ................ . •....... .l25
FIGURE3-15 ANION-EXCHANGE HPLC-ICP-MS OF ARSENIC STANDARDS FOR
DETERMINATION OF ARSENIC IN CHICKEN. PEAKS 1, AsBET; 2, DMA; 3, MMA;
4, As v, 50 J!G L-l EACH. CONDLTIONS SHOWN IN TABLE 3-3 ... ....... . .. .129
FIGURE 3-16 ANION-EXCHANGE HPLC-ICP-MS, USING CONDITIONS SHOWN IN TABLE
3-3, OF CHICKEN SAMPLE DEMONSTRATLNG SPECIES PRESENT. PEAKS: 1, ASBET;
2, DMA; 3, MMA ............ . .............................. ................. .1 29 xvi

FIGURE 3-17 CATION-EXCHANGE HPLC-ICP-MS, USING A PARTISIL SCX 10 COLUMN
AND 20 MM PYRIDINE ELUENT AT PH 3, OF ARSENIC STANDARDS. PEAKS: 1,
MMA; 2, Asrn; 3, DMA; 4, AsBET .... ... •.... .•. . . . •• . ... . . ..........•.... . .. .l30
FIGURE 3-18 CATION-EXCHANGE HPLC (CONDITIONS AS ABOVE) OF CHICKEN
SAMPLE. PEAKS: 1, MMA; 2, DMA; 3, AsBET .. .............................. 130
FIGURE 3-19 CHROMATOGRAM OF ARSENIC STANDARDS BY ANION-EXCHANGE HPLC
WITH PHOSPHORIC ACID MOBILE PHASE, CONDITIONS SHOWN IN TABLE 3-9, FOR
SOIL ANALYSIS: 1 = Asm; 2 = DMA; 3, = MMA; 4 = Asv, 250 J.lG L-1 .. . .133
FIGURE 3-20 CHROMATOGRAM BY ANION-EXCHANGE HPLC-ICP-MS (CONDITIONS
SHOWN IN TABLE 3-9) OF SOIL MJX 1. PEAKS: 1, As01; 2, DMA; 3, MMA; 4,
Asv ....... ... ...... ..... ..... . ........................ ... . .. .... ..... .............. .l33
FIGURE 3-21 CHROMATOGRAM BY ANION-EXCHANGE HPLC-ICP-MS, CONDITIONS
SHOWN IN TABLE 3-9, OF SOIL MIX 2. PEAKS: 1, As111; 2, Asv .............. 134
FIGURE 3-22 CHROMATOGRAM OF SELENIUM STANDARDS, 100 J.lG L-1, BY ANION-
EXCHANGE HPLC, CONDITIONS SHOWN lN TABLE 3-8. PEAKS: 1, SECYS; 2,
SEMET; 3, SErv; 4, SEv1 ... . .... .. ..... ......... .... .............................. 139
FIGURE 3-23 CHROMATOGRAM OF WHEAT SAMPLE BY ANION-EXCHANGE HPLC,
CONDITIONS SHOWN IN TABLE 3-8. PEAKS: 1, SECYS; 2, SEMET .......... 139
FIGURE 3-24 CHROMATOGRAM OF SELENIUM STANDARDS, 1 MG L-1, BY ANION-
EXCHANGE HPLC-ICP-MS, CONDITIONS SHOWN IN TABLE 3-8. PEAKS: 1,
SECYS; 2, SEMET .........•... •..........•..... •. .... . .•........ . .. .. .... . .•. . ... l43
FIGURE 3-25 CHROMATOGRAM OF YEAST SAMPLE BY ANION-EXCHANGE HPLC-ICP-
MS, CONDillONS SHOWN IN TABLE 3-8. P EAK= SEMET .. . ....•..•... ... .. . 143
xvii

FIGURE 4-1 YEAST A VIEWED BY SCANNING ELECfRON MICROSCOPY (SEE SECTION
4.2.2.) FOLLOWING LIQUID NITROGEN FREEZING ..... ............ .......... ............ .. 171
FIGURE 4-2 PHARMA NORD YEAST VIEWED BY SCANNING ELECTRON MICROSCOPY
(SEE SECTION 4 .2.2.) FOLLOWING LIQUID NITROGEN FREEZING . . . •.... . .... .. 172
FIGURE 4-3 CHROMATOGRAM OF 4 SELENlUM STANDARDS, 100 J..lG L-1, EMPLOYING A
DIONEX AS 11 ANION-EXCHANGE HPLC COLUMN USING THE CONDITIONS
DESCRffiED IN TABLE 4-2. PEAKS: 1= SECYS; 2 = SEMET; 3 = SE1v; 4 = SEVI.177
FIGURE 4-4 CHROMATOGRAM OF YEAST A FOLLOWING SELENIUM EXTRACTION BY
TMAH EMPLOYING A DIONEX AS 11 ANION-EXCHANGE HPLC COLUMN USING
THE CONDITIONS DESCRffiED IN TABLE 4-2. PEAKS: 1 = SErv; 2 = SE VI .. . .. . 178
FIGURE 4-5 CHROMATOGRAM SELENIUM STANDARDS, 50 J..lG L-1, EMPLOYING A
DIONEX AS 11 ANION-EXCHANGE HPLC COLUMN USING THE CONDITIONS
DESCRmED IN TABLE 4-2. PEAKS: 1 = SECYS; 2 = SEMET ............... .. ......... 179
FIGURE 4-6 CHROMATOGRAM OF YEAST A FOLLOWING EXTRACTION BY HCL AND
PROTEASE (PROCEDURE11) EMPLOYING A- DIONEX AS 11 ANION-EXCHANGE
HPLC COLUMN USING THE CONDITIONS DESCRffiED IN TABLE 4-2. PEAK 1
ASCRmED TO SECYS .. .. .... . .... .. .. . .......... . . .. . ... . . ... . ...... . ...... .. .... .. .180
FIGURE 4-7 CHROMATOGRAM OF BIOGURT FOLLOWING EXTRACTION BY HCL AND
PROTEASE (PROCEDURE11) EMPLOYING A DIONEX AS 11 ANION-EXCHANGE
HPLC COLUMN USING THE CONDITIONS DESCRIBED IN TABLE 4-2. PEAK 1
ASCRmED TO SECYS . .................... .. .. .. .................................... ...... .............. 180
FIGURE 4-8 CHROMATOGRAM OF PHARMA NORD YEAST FOLLOWING EXTRACTION BY
HCL AND PROTEASE (PROCEDURE11) EMPLOYING A DIONEX AS 11 ANION
xviii

EXCHANGE HPLC COLUMN USING THE CONDITIONS DESCRffiED IN TABLE 4-2.
PEAK 1 ASCRIBED TO SEMET .............. .. ................................. . ....... .. ...... .... . 181
FIGURE 4-9 CHROMATOGRAM OF YEAST A AND BIOGURT® SAMPLES AND SECYS AND
SEMET STANDARDS BY CATION-EXCHANGE HPLC-ICP-MS USING A PARTISIL
SCX 10 COLUMN (250 X 4.6 MM) AND A 20 MM PYRIDINE ELUENT ADJUSTED TO
PH 3. PEAKS: 1, YEAST A; 2 , BlOGURT®; 3, SECYS STANDARD, 1 MG L-1; 4,
SEMETSTANDARD, 1 MGL-1 .. ...... ................. ..... . . .. . ................... 184
FIGURE 5-1 A TYPICAL CHROMATOGRAM OF ARSENIC STANDARDS, 250 J.lG L-1 EACH,
USING A HAMILTON PRP X100 ANION-EXCHANGE HPLC-ICP-MS (COLUMN
DLMENSIONS OF 250 X 4.6 MM J.D.). THE MOBILE PHASE USED WAS 10 MM
NHJIC03 WITH 10% MEOH AT PH 10. PEAKS: 1 = AsBET; 2 = DMA; 3 =
MMA; 4 = Asv .... ... ....... . ... ...... .. ........ ....... ...... .... ...... .. .... ....... .... ..... . .... ....... 201
FIGURE 5-2 HPLC-ESMS OF A~SENIC STANDARDS AT 1000 J.lG L-1
WITH RETENTION
TfMES IN PARENTHESES, GIVEN IN MINS: 1, AsBET (4.65); 2, DMA (5.68); 3,
MMA (8.85). SIM MODE WITH CHROMATOGRAMS OVERLAID OF M/z 179, 139
AND 141 .......... . ....................... ... ............. . .. .. . ............ ..... ..... 202
FIGURE 5-3 MSMS FRAGMENTATION PATTERN OF MMA (M+W ION 141) USING THE
ESMS CONDITIONS SHOWN IN TABLE 5-7 .. ... ........................... ................. .. 204
FIGURE 5-4 FRAGMENTATION PATTERN OF DMA ( M+l-t" ION 139) USING THE ESMS
CONDITIONS SHOWN IN TABLE 5-7 ................. ................................ ....... ...... 204
xix

FIGURE 5-5 FRAGMENTATION PATTERN OF AsBET (M+ft ION 179) USING THE ESMS
CONDITIONS SHOWN IN TABLE 5-7 .......... .... ....... ......... ... .... ............ ......... .... 205
FIGURE 5-6 STRUCTURES OF MMA, DMA AND ASBET TOGETIIER WITH IDENTIFfED
FRAGMENT PATHWAYS USlNG MASS SPECTROMETRIC ANALYSIS ... .. ......... .. 206
FIGURE 5-7 A TYPICAL CHROMATOGRAM OF ARSENIC STANDARDS, 250 J..LG L-l EACH,
USING A HAMILTON PRP X100 ANION-EXCHANGE HPLC-ICP-MS (COLUMN
DIMENSIONS OF 250 X 4.6 MM I.D.). THE MOBILE PHASE USED WAS 10 MM
~HC03 WITH 10% MEOH AT PH 10. PEAKS: l = ASBET; 2 = DMA; 3 =
MMA; 4 = Asv ................... ............... ... .........•....... .........•.... ....................... 210
FIGURE 5-8 A CHROMATOGRAM OF THE CRM IAEA-140 (SEAWEED), USING A
HAMILTON PRP X100 ANION-EXCHANGE HPLC-ICP-MS (COLUMN DIMENSIONS
OF 250 X 4.6 MM I.D.). THE MOBILE PHASE USED WAS 10 MM ~HC03 WITH
10% MEOH AT PH 10. PEAKS 1-4 NOMINALLY ASSIGNED PRIOR TO
IDENTIFICATION .......................................................................................... 210
FIGURE 5-9 A CHROMATOGRAM OF ASCOPHYLLUM NODOSUM, USING A HAMILTON
PRP XlOO ANION-EXCHANGE HPLC-ICP-MS (COLUMN DIMENSIONS OF 250 X
4.6 MM I.D.). THE MOBILE PHASE USED WAS 10 MM NH4HC03 WITH 10% MEOH
AT PH 10. PEAKS 1-3 NOMINALLY ASSIGNED PRIOR TO IDENTIFICATION ..... 211
FIGURE 5-10 CHROMATOGRAM OBTAINED OF THE ASCOPHnLUM NODOSUM .SAMPLE
USING ESMS WITH THE CONDITIONS DESCRIBED IN SECTION 5.2.1.5 AND TABLE
5-2 ..................................................................................... 212
XX

FIGURE 5-11 CHROMATOGRAM OBTAINED OF THE ASCOPHYLLUM NODOSUM SAMPLE
USING ESMS IN THE SIM MODE AT Mfz 329 WITH THE CONDITIONS DESCRIBED IN
SECTION 5.2.1.5 AND TABLE 5-2. (PEAK APEX TIME GIVEN -4.9) •........•. ..•. 213
FIGURE 5-12 STRUCTURE OF THE ARSENOSUG~ COMMONLY FOUND IN MARINE
ALGAE, HA VlNG A M+W 329 MASS UNITS ................... ......... ........ ..... .... .... 214
FIGURE 5-13 CHROMATOGRAM OBTAINED OF FUCUS SP. USING ANION-EXCHANGE
HPLC-ESMS WITH THE CONDITIONS DESCRIBED IN SECTION 5.2.1.5 . •. .... . 215
FIGURE 5-14 ESMS SPECTRUM OF MIDDLE PEAK (RT 5.64 MIN) OF THE FUCUS SP.
CHROMA TOO RAM USING ANION-EXCHANGE HPLC-ESMS WITH THE CONDITIONS
DESCRIBED IN SECTION 5 .2.1.5 ..... .... ........................................................... 216
FIGURE 5-15 SIM CHROMATOGRAMS OF THE 3 ARSENIC SPECIES IDENTIFIED IN
MIDDLE PEAK OF THE FUCUS SP. SAMPLE DEMONSTRATING RETENTION TIMES
USING ANION-EXCHANGE HPLC-ESMS WITH THE CONDITIONS DESCRIBED IN
SECTION 5.2.1.5 .......................................................................................... 217
FIGURE 5-16 SIM OF Mfz 483 IN THE FUCUS SP. SAMPLE DEMONSTRATING RETENTION
TIME USING ANION-EXCHANGE HPLC-ESMS WITH THE CONDITIONS DESCRIBED
IN SECTION 5 .2. 1.5 ... ........ . ...... ... •..••. ..•. . .. .. .. .......•• .... . ... . .......• 219
FIGURE 5-17 STRUCTURES OF THREE ARSENOSUGARS COMMONLY FOUND IN MARINE
ALGAE ..... . ............... .. ... ... .. .. ........ . ............. . . ........ . .......... . .. 221
FIGURE 5-18 STRUCTURE OF COMPOUND AT Mfz 241 , 3-[5'-DEOXY-5'-
(DIMETHYLARSINOYL)-~-RIBOFURANOSYLOXY]-2-HYDROXYPROPYLENE GLYCOL.
.......... .... . .. ... ... .... .............•............. ....... .. .. ........ .. ... ....•......•.•.•.. .•. ..•.............. 221
xxi

FIGURE 5-19 CHARACfERJSTIC FRAGMENTATIONPATfERN Of AN 'ARSENOSUGAR' .
.................. .................................................................................................. 222
FIGURE 5-20 TANDEM MS OF Mfz 329 IN THE FUCUS SP. SAMPLE USING ANION
EXCHANGE HPLC-ESMS WITH THE CONDITIONS DESCRIBED IN SECTION
5.2.1.5 .................................................................... . . ..... ..... 223
FIGURE 5-21 TANDEM MS FRAGMENT PATTERN OF COMPOUND AT Mfz 483 USING
ANION-EXCHANGE HPLC-ESMS WITH THE CONDITIONS DESCRIBED IN SECTION
5.2.1.5 ......... .... ........ . .. . ....... ............... .. .............................. 224
FIGURE 5-22 TANDEM MSMS OF COMPOUND AT Miz 409 USING ANION-EXCHANGE
HPLC-ESMS WITH THE CONDITIONS DESCRIBED IN SECTION 5.2.1.5 ...... 225
FIGURE 5-23 MS-MS OF M+W 241 USING ANION-EXCHANGE HPLC-ESMS WITH
THE CONDITIONS DESCRIBED IN SECTION 5.2.1.5 ... . .... .. ... .. ................ 226
FIGURE 5-24 TYPICAL CHROMATOGRAM OF SE STANDARDS BY ANION-EXCHANGE
HPLC-ICP-MS AS DESCRIBED IN SECTION 5.3.1.5 AND TABLE 5-8. PEAK 1,
SECYS AT l MO L-1; PEAK 2, SEMET AT 1 MO L-
1 (ALL CONCENTRATIONS GfVEN IN
TERMS OF THE ELEMENT) ................................... .......................................... 233
FIGURE 5-25 CHROMATOGRAM OF YEAST SAMPLE BY ANION-EXCHANGE HPLC-ICP-
MS AS DESCRIBED ABOVE . ......................... .. ............................. .................. 233
FIGURE 5-26 SEMET PROFILE BY ESMS, USING THE CONDITIONS DESCRIBED IN TABLE
5-7, DEMONSTRATING THE CHARACTERISTIC ISOTOPIC PA ITERN OF A SELENIUM-
CONTAINING COMPOUND . ......... ........... ...................................................... .. 235
xxii

FIGURE 5-27 SECYS CENTROID PROFILE IN A Mfz SPECTRUM, USING THE CONDITIONS
DESCRIBED IN TABLE 5-7, DEMONSTRATING THE EXPECTED SELENIUM-SELENIUM
BOND ISOTOPIC PATTERN ..... .... ........ .. .. .... .... .... .. ........................... ... ............ 236
FIGURE 5-28 SEMET AND SECYS STANDARDS IN SIM MODE USING ANION-EXCHANGE
HPLC-ESMS WITH THE CONDITIONS DESCRIBED IN SECTfON 5.3.1.5. AND
TABLES 5-7 AND 5~8 ............ ....................................................................... 237
FIGURE 5-29 CHROMATOGRAM OF YEAST SAMPLE EXTRACT USING ANION-EXCHANGE
HPLC-ESMS WITH THE CONDITIONS DESCRIBED IN SECTION 5.3.1 .5. AND
TABLES 5-7 AND 5-8 ........... . . .. .. ....... ... ..... . ........ . .. .. .... . ..... .. ....... 238
FIGURE 5-30 YEAST SAMPLE EXTRACT IN SIM MODE BY HPLC-ESMS ESMS, USING
THE CONDITIONS DESCRIBED IN SECTION 5.3.1.5. AND TABLES 5-7 AND 5-8,
DEMONSTRATING THE RESPONSE AGAINST RETENTION TfMES AT MASS 337 AND
198 ........ .................................................................................................. .... 238
FIGURE 5-31 STRUCTURES OF THE TWO SELENIUM COMPOUNDS UNDER INVESTIGATION
............... . ....... .... ..... . ....... ......... ........ . .............................. 239
FIGURE 5-32 TANDEM ESMS, USING THE CONDITIONS DESCRIBED IN TABLE 5-7, OF
SEMET STANDARD DEMONSTRATING THE FRAGMENTATION PATTERN OF THE
MOLECULE . .. . .. .. . . .. .. . ........ . ............... .. .. . . .... ... . . .................... 239
FIGURE 5-33 TANDEM ESMS SPECTRUM OF A SECYS STANDARD, USING THE
CONDITIONS DESCRIBED IN TABLE 5-7, DEMONSTRATING THE FRAGMENTATION
PATTERN OF THE MOLECULE .......... .... ....... .............................. ........ ... ...... .... 240
xxiii

Acknowledgements
I would like to take this opportunity to thank the many people that have been
involved in this thesis. To my supervisors Prof. Les Ebdon, Dr. Mike Foulkes and
Dr. Les Pitts - thank you for your support, knowledge, wisdom and wit without
which I would be reclining in a sanatorium as I write. A heartfelt thanks goes to Dr.
Andy Fisher for giving freely of his time, vast wealth of knowledge and practical
experience in teaching me all that I know in the field of ICP-MS. I also thank him for
mostly anticipating what mistakes I would make before I made them, thereby saving
me a lot of time and further embarrassment- and for his many free trips to the pub!
A big thanks goes to Mr. Rob Harvey for keeping the instruments working regardless
of what manner of insult they had undergone with me using them. I would like to
thank Philip Oppong for his assistance in the laboratory whilst he was on a summer
work placement and to James Brown for his work in the field ofESMS.
I would like to say thank you to all my colleagues, too numerous to mention
individually, for their academic input and lively discussions but most of all for their
friendship.
Finally, I turn my attention towards my family without whom this journey would
have been infinitely more difficult to travel. A special thanks goes to Becky and
Simon for their insistence in pointing out the humour in many a desperate situation
and for their overwhelming generosity. I must thank my eldest sister, Helen, for
nearly always mentioning Ockham' s razor regardless of the topic of conversation.
Only joking, Hel. You were a formidable source of encouragement and inspiration.
My thanks also to my parents, both of whom I love dearly, for making me realize
from an early age that anything worth having in life would never be easily attained.
And last, but by no means least, to my daughter who feels that she has been
irreparably damaged due to the loss of income incurred whilst I have been at
university. So to her, I must say that I'm sorry! Hopefully, it will all have been worth
it in the end. xxiv

Author's Declaration
At no time during the registration for the degree of Doctor of Philosophy has the
author been registered for any other University award.
This study was fmanced with the aid of a studentship from the Department of
Environmental Sciences, Plymouth University and the European Community
'Competitive and Sustainable Growth' Programme, 1998 - 2002.
Signed: ...... ~ .. ~.: .... . .... .. .
Date: .... 9. .1 . . -:-•• ~~~.:: c.1 ....
XXV

Chapter one
1 Introduction
1.1 Trace element spedation
Trace elements are present in nature in a number of different forms or species.
The adequate functioning of life can be critically dependent on these elements in
numerous ways. Some are considered to be highly toxic 1 whereas others are
considered to be essential 2. The significance of the toxicological, nutritional and
biochemical impact of any element on a biological system depends on the
chemical forms present 3. One of the main reasons is that the toxicity or
bioavailability of an element can be several orders of magnitude different,
depending on the chemical form. Thus the field of trace metal or elemental
speciation has become an area of increasing interest in analytical chemistry. In
response to this, a European Union network has been established that aims to
bring together scientists with an interest in speciation of a diverse range of
elements with potential users from areas that include industrial process control,
the food industry, biomedical and pharmaceutical discipllnes as well as the
biological and environmental sciences 4•
Two elements of particular interest are arsenic and selenium. Arsenic has long
been regarded as a toxin and long-term consequences of exposure, in particular to
inorganic forms, are of importance as it is now recognized as a carcinogen 5•
Arsenic-contaminated drinking water has been responsible for countless cases of
chronic arsenic poisoning in countries such as Bangladesh, China and Taiwan 6.
Selenium, on the other hand, is recognized as an essential ultra-trace element in
2

the human diet 2• It is an integral component of several enzymes, including
glutathione peroxidase, which are responsible for disease prevention due to their
anti-oxidant properties 7• However, it has a narrow therapeutic window.
Research in identification and determination of the various chemical forms of
arsenic and selenium will assist in understanding the relationships that link
speciation with the biochemical and environmental cycling of these important
elements.
1.2 Arsenic compounds
1.2.1 Occurrence of arsenic in the environment
Arsenic is a ubiquitous element in the environment having been introduced via
natural and anthropogenic routes. Arsenic can be found in rock, soil, dust, water
and air. Phenomena, such as weathering of minerals, biological activity and
volcanic activity, are largely responsible for the emission of arsenic into the
biosphere from natural sources. Anthropogenic sources arise predominantly from
the mining and smelting of copper, lead, cobalt and gold ores. Other
anthropogenic sources are given in Table 1-1. Recent estimates have placed the
ratio of emission from natural compared with anthropogenic sources at
approximately 60:40 8• Despite the now known toxicity of arsenic, particularly in
the inorganic form, production of arsenic has remained static over the last 60
years 3•
3

Table 1-l.Common uses of arsenic compounds 3•
Area Uses Agriculture Pesticides, insecticides, defoliants, wood preservatives, soil
sterilant
Livestock Feed additives, disease prevention (swine dysentery), cattle and sheep dips, algaecides.
Electronics Solar cells, optoelectronic devices, semi-conductor applications, light-emitting diodes.
Industry Glassware, electrophotography, catalysts, pyrotechnics, antifouling paints, dyes, ceramics.
Metallurgy Alloys, battery plates.
Levels of arsenic in different environmental compartments are often quoted in the
literature but can differ significantly with regard to location and nearby industry.
This is clearly demonstrated by the values given in Table 1-2.
Table 1-2 Arsenic levels determined in environmental compartments 9
Background levels Contaminated sites
Soil ~ 7 mg kg-1 1000 mg kg-
Air 1 - 10 ngm-3 20 - 1000 ng m-3
Freshwater o.15 - 0.45 ~g r• up to 3000 ~g r'
Seawater o.o9 - 24 ~g r'
4

Considering the physicochemical similarities between arsenate and phosphate it
is not unusual for organisms to inadvertently take up arsenate. However, there is
a significant difference in the concentrations of arsenic found in terrestrial
organisms to that found in marine organisms. Terrestrial organisms rarely contain
more than I mg kg-1 (dry weight) 10 whereas marine organisms are often reported
as containing much higher levels; with concentrations in marine animals
generally lying in the range 10-500mg kg-1 but have been known to exceed
1 OOOmg kg"1 for organisms living in contaminated areas 11• The highest risk of
exposure for humans comes from the consumption of seafood 12• It would,
therefore, be applicable to focus on the biochemical cycling of arsenic in the
marine environment.
1.2.2 Distribution of arsenic in the marine environment
The presence of arsenic in marine samples was first comprehensively presented
by Jones 13 in 1922. He remarked on the fact that arsenic was present in an
organic form. Since then a vast amount of research has been undertaken and a
variety of arsenic compounds have been identified. The most common organic
arsenic compounds found in the marine environment are monomethylarsonic acid
(MMA), dimethylarsinic acid (DMA), trimethylarsine oxide (TMAO),
tetramethylarsonium IOn (TeMA), arsenobetaine (AsBet),
arsenoylribofuranosides (trivial name of arsenosugars) and less frequently,
although still significant, arsenocholine (AsC). Structures of these organoarsenic
species are shown in Figure 1-1. The distribution of arsenic compounds in
seawater, marine fauna and flora are given in Table 1-3.
5

0 0 11
H3C-As-OH I OH
11 H3C-As-OH
I CH3
MMA DMA
0
11 H3C--As-CH3
I CH3
TMAO TeMA
AsBet AsC
0
11 H3C--As
I 0 0"--.
R CH3
HO OH
Arsenosugars
Figure 1-lCommon organoarsenic compounds •~
6

Table 1-3 Arsenicals in different marine compartments 15
Major Minor Trace Not detected
Sediments and MMA,DMA TMAO As Bet, TeMA,
porewater AsCbol,
arsenosugars
Seawater Asv, Asru MMA,DMA As Bet, TeMA,
AsChol,
arsenosugars
Marloeftora Arsenosugars Asv MMA,DMA As Bet, TeMA,
AsChol
Marine fauna As Bet TeMA, Asv • Asm,
arsenosugars, TMAO, AsChol,
DMA
Bioaccumulation of arsenic is high in zooplankton, benthic organisms, seaweed
and algae. However, there.does not appear to be any biomagnification along food
chains as levels of arsenic in predators are usually found to be no higher than
those found in organisms lower down the food chain 16• 1bis suggests that the
biochemical cycling of arsenic compounds by marine biota provide a route of
detoxification with the added ability of the organism to excrete, or degrade to
excrete, these compounds.
7
1.2.3 Biotransformations of arsenic compounds.
Arsenic readily undergoes conversions mediated by microorganisms, plants and
animals where biotransformations give rise to the variety of arsenical species
seen. Research has been abundant in this field and many arsenic compounds have
been identified and mechanistic pathways for their formation proposed 15•
17•
The high levels of arsenic found in macroalgae, particularly brown algae, and its
chemical form was first established in 1981 by Edmonds and Francesconi 18• The
two compounds identified by NMR spectroscopy were dimethylarsinoylribosides.
Since then many other compounds of similar structure have been elucidated from
marine algae and come under the broad heading of arsenosugars 19• 20
• 21
•
Classic studies by Challenger 17 on microbial methylation of arsenic still provide
the basis for current understanding of the transformation of inorganic arsenic to
the organic forms. Challenger's mycological studies indicated that arsenate could
be transformed to trimethylarsine by sequential reduction and oxidative
methylation, with MMA, DMA and TMAO forming the intermediate
compounds. S-adenosylmethionine (AdoMet) was thought to be the active methyl
donor. Methylation by methanogenic and non-methanogenic bacteria has also
been shown to occur with mechanisms likely to be similar to that in fungi 10•
8

The biogenesis of arsenosugars from arsenate in marine algae follow a similar
pathway to that described by Challenger 17• A sequential reduction and oxidative
methylation of arsenate with S-adenosylmethionine (AdoMet) donating its
methyl group and adenosyl group to arsenic is given in Figure 1-2. This pathway
is supported by the detection of both MMA and DMA in algae.
- ~ -0-As-0
I o_
X
TrlmelhJiarsonJorlbosldts
0 t
Me-As-oH I OH
MelhJIIrsonic add (MAA)
Reductioo
0
0 t
Me,As-OH
DimrthJianinlc add CDMAAI
..).'G, HO OH
DlmtlbJiarslnJiribosldos
Reduction
lhcnB
0 <N__;c: t N,.lN)
Me~~
HO OH
(DfmtlhJIIrtlnJIIdtaosiM)
(Compound 131
Glycosidation
... ----------
r··A··1 .... <t.:NH: :Me.:J' ) • ... , .. ! :' \.
~~~X:/ ' S·Adon .. ,lmolhlonlno :Ho OH B
(AdoMtll : I • • • • •'" • • e e • e • "'e • •• • • •
Figure 1-2 Proposed pathway for the biogenesis by algae of arsenic-containing ribosides from arsenate. The key intermediate (compound 13) undergoes glycosidation with available algae metabolites to give the range of dimethylarsinylribosides found in marine algae
14
9

Arsenobetaine (AsBet) was first identified in marine animals by Edmonds et a/ 22,
in 1977 . Since its discovery it has been found to be ubiquitous among marine
animals. It is present at all trophic levels and is the predominant form of arsenic
found. Other organoarsenicals may also be present as described in Table 1-3.
Although many hypotheses have been proposed the pathway for its biogenesis
remains unsubstantiated. Studies on fish have suggested that arsenobetaine is
formed by microbial activity either in the seawater, although it is not detected in
this compartment, or in the host itself and is then accumulated by the host 15•
Possible pathways for the formation of arsenobetaine by micro-organisms result
from the cleavage of carbon-carbon bonds in the furan ring of arsenosugars
followed by the oxidation of the resultant alcohol, arsenocholine. MMA and
DMA have also been shown to be precursors of arsenobetaine 23• Arsenobetaine
is thought to be the final metabolite in this part of the arsenic cycle. It is itself
degraded back to inorganic arsenic by the action of micro-organisms 24• 25 through
a series of intermediates as shown in Figure 1-3, and by ultra-violet (UV)
radiation 26•
10

Sea water Pbytoplankton and algae
Arsenite and arsenate arsenosugars _.. arsenocboline
~ i Marine animals
MMA ...__ DMA +-- TMAO As Bet
MiCT~K~rganism degradation within the marine ecosystem
Figure l-3 Proposed arsenic cycle in the marine environment 24•
1.2.4 Toxicology of arsenic compounds
It is known that the toxicity of arsenic can vary by several orders of magnitude
depending on its chemical form, and that exposure to the more toxic species can
give rise to mutagenic, teratogenic and carcinogenic effects 12• Inorganic forms of
arsenic, As m and As v, are considered to be the most toxic 27• Organic species
display decreasing toxicity with increasing derivatization. The LD5o values in
rats, mg kg-1 body weight, in decreasing levels of toxicity has been given as:
arsenite, 1.5; arsenate, 5.0; MMA, 50; DMA, 600 28• Arsenobetaine and
arsenocholine have been shown to be essentially non-toxic with LD50 > 1 Og kg"1
11• It is also thought that arsenosugars found in seaweed and algae are relatively
non-toxic 29•
ll
The degree of gastrointestinal absorption of arsenic depends on the species
present. Greater than 95% of inorganic arsenic is absorbed, approximately 75%
of MMA and DMA is absorbed whilst arsenobetaine is not readily absorbed by
the body and is excreted unchanged 30
.
Inorganic arsenic absorbed by humans is detoxified via a similar pathway to that
described by Challenger with methylation to MMA and DMA occurring by
hepatic enzyrnatic transfer of methyl groups from S-adenosylmethionine 31
•
Toxicological effects in marine organisms vary but in general show a modemte
tolemnce to the presence of arsenic 32• There does not appear to be
biomagnification along the food chain and bioaccumulation of species will
largely depend on the presence of phytoplankton and micro-organisms which are
capable of transfonning toxic to less toxic forms of arsenic 32
•
1.3 Selenium compounds
1.3.1 Occurrence of selenium in the environment
Although selenium appears to be ubiquitous in the environment its uneven
distribution results in regions with very low or very high natuml levels. This is
reflected in the levels found in endogenous food sources, which have been found
to vary widely depending on the availability of selenium in the immediate
environment. Soils derived from sedimentary rocks tend to have higher levels of
12

selenium than do igneous and metamorphic rocks. These soils tend to be alkaline
in reaction and favour the presence of selenate. There is variable analytical data
available for levels of selenium found in differing environmental compartments.
However, Table 1-4 gives some indication of values expected 33.
Table 1-4 Levels of selenium found in different environmental compartments 33•
Source
Air
Water
Foodstuffs:
Meat and seafood
Cereals
Dairy products
Fruit and vegetables
Levels
< 10ngm
~"=' 1-5 J.Lg r'
0.4- 1.5 mg kg-1
< 0.1- > 0.8 mg kg-1
< 0.1 - 0.3 mg kg-1
< 0.1 mg kg-1
Anthropogenic sources of selenium arise from its use in agriculture and from
products and/or byproducts of industry. The addition of selenium to animal
feedstuffs and fertilizers to rectify naturally occurring low selenium levels is not
thought to contribute significantly towards an environmental pollution risk.
However, an incident at the Kesterton reservoir in California, where
accumulation of selenium-laden water from agricultural run-off, led to toxic
effects being demonstrated in birds and fish 34•
35•
13

The main industrial sources of selenium come from oil refineries and the burning
of fossil fuels, mining and smelting of metal ores and in the production and
purification of selenium itself. Ground water can be directly polluted from
industrial effluent and atmospheric emissions may also be important in the
contamination of open-water reservoirs.
Selenium exists in the environment in several oxidation states, predominantly
( -11), (IV) and (VI). Inorganic forms of selenium are more commonly present as
selenite, SeiV, and selenate, Se VI. Organic selenium compounds are ordinarily
found in the -IT oxidation state as selenides and as analogues of sulphur
containing compounds. Selenium is present mainly in the aminoacids
selenomethionine and selenocysteine. Selenomethionine and selenocysteine are
bound covalently to proteins where they carry out a number of important
biological functions. The major product of selenium metabolism is the
trimethylselonium ion which is excreted via the urine. Selenium also exists in
volatile forms, predominantly as dimethylselenide. Structures of some
environmentally important selenium compounds are shown in Figurel-4.
14

0
11 Se
HO/ '-..._OH
0
11 O=Se-OH
I OH
Selenous acid Selenic acid
Selenocysteine Selenomethionine
HQ_ ! 2 ..... se /".. 1. If ""' 'se l 'OH
0 NH2
Selenocystine
Figure 1-4 Structures ofsome environmentally important selenium compounds 36•
15

1.3.2 Biotransformations of selenium in plants and humans
Although biogeochemical cycles for selenium are not fully characterized, a
review of the available research gives an insight into some of the mechanistic
pathways that allow inclusion of selenium into the food chain. It is known that
bacteria in soils can convert between elemental selenium, selenite and selenate 33•
Prevailing redox conditions in soil also allow for the presence of selenium as
selenite and selenate. Selenium in these fonns is bioavailable and uptake from
soil by plants can occur. Plants vary considerably in their physiological response
to selenium. Some plant species are selenium accumulators as they have a degree
of tolerance to selenium whereas other plant species can be selenium-sensitive
and, therefore, avoid selenium accumulation. In this respect, plants can play a
pivotal role in the food chain as there is a narrow margin between the beneficial
and harmful levels of selenium required in maintaining optimum human health.
Plants may also take up organic fonns of selenium such as selenomethionine 37•
Selenium accumulators can be used in areas where naturally occurring selenium
levels are low providing a useful way of supplementing the diet.
Plant roots accumulate selenate by active transport. Selenite and organic forms of
selenium can also be accumulated actively. Selenate readily competes with
sulphate uptake 38 and a sulphate transporter therefore, mediates its accumulation.
In selenium accumulators selenate is taken up preferentially over sulphates.
Selenate is easily transported within the plant to the leaves whereas selenite and
organic selenium compounds tend to remain in the root system. It is thought that
16

selenite is rapidly converted to organic selenium and thereby accumulates in the
roots 39• Plants can also release and absorb volatile selenium compounds to and
from the atmosphere. The production of selenocysteine most probably occurs
within the chloroplasts whereas selenomethionine is more likely to be
synthesized in the cytosol; both are incorporated in proteins. Many other
selenium compounds are also found in plants that include intermediates in
metabolic pathways (selenocystathionine, selenohomocysteine) and end-products
in themselves (dimethylselenide).
The major selenoamino acid found in plants is selenomethionine 40 and is
assimilated by animals that feed on the vegetation. However, selenocysteine is
the major selenoamino acid found in animals 40• This implies that nutritionally
derived selenium is used in metabolic processes within animals to achieve the
required selenoprotein status. Selenium function within animals is primarily as
selenoproteins.
In humans, the major biological functions of selenium are achieved through its
redox activity when present as selenocysteine at the active sites of selenoproteins
7• These proteins are selenium-dependent as replacement with the sulphur
analogue renders them enzymatically inactive 2• At least thirteen selenoproteins
have been identified in humans. including glutathione peroxidases, selenoprotein
P and iodothyronine deiodinases, all of which contain selenocysteine.
Selenocysteine can be obtained from exogenous sources, however only
endogenously derived selenocysteine is incorporated into the selenoproteins 41•
17

Although metabolic pathways are not fully characterized it is known that humans
are capable of synthesizing selenocysteine, which has become known as the 21 51
amino acid, using a genetic code via the UGA codon 42• Ultimately,
selenocysteine is derived from the amino acid serine and selenide, which suggests
that selenium compounds from dietary intake, must enter a metabolic pathway
that pass through a common selenide intermediate 2•
Selenomethionine cannot be formed in vivo and is therefore exclusively obtained
from the diet. It is incorpomted non-specifically into body proteins in place of
methionine, as met-tRNA. Excess selenomethionine is able to enter the metabolic
pathway where its selenium can be incorpomted into selenoproteins 2•
Selenides can be methylated to the trimethylselonium ion, which is the major
route for excretion via the urinary tmct 43• If this process becomes overloaded
then the methylation is to that of dimethylselenide which is excreted via the
respimtory tmct and hence the 'selenium/garlic breath' associated with high
intake levels. Other metabolites such as monomethylselenol and dimethyl
diselenide have been identified and, therefore, it can be inferred that methylation
is a detoxification process. A selenium metabolic pathway, as described by Ip 44,
is shown in Figure 1-5.
18

General body Selenoproteins Selenite
! i ! Selenomethionin Selenophosphate GS-Se-SG
t i t Selenocysteine • H2Se ... GS-SeH
t CH3SeH
t (CH3)2Se ___,. breath
t (CH3)3Se +___,. urine
Figure 1-S Selenium metabolic pathway. GS-Se-SG = selenodiglutathione, GS-SeH =glutathione selenopersulphide 41
1.3.3 Selenium as an essential element in the diet
Selenium is widely recognized as both a toxic and an essential element depending
on its chemical fonn and concentration. Although organic and inorganic fonns of
selenium have a common metabolic pathway it is generally thought that organic 19

forms of selenium are less toxic 45• The gap between toxic and essential levels of
selenium in humans is narrow. Diseases related to selenium deficiency were first
identified in 1979 when Chinese researchers established an association between
low selenium status in humans and the presence of Keshan disease, a form of
cardiomyopathy, and Keshan-Beck disease, a deforming osteoarthritis 46• A major
clinical development of the 1990's was the findings ofClark et al. 41 that human
dietary supplementation with selenium-enriched yeast decreased cancer incidence
and mortality by up to 50%. The cancer chemopreventative effect of selenium has
been tentatively attributed to the biological anti-oxidant functions of selenoamino
acids 48• However, the form of dietary selenium most appropriate to confer anti
oxidant properties remains unclear.
Plasma GSH-Px activity is often used as an indicator for selenium levels as there
is a close correlation between the two. GSH-Px activity plateaus out at similar
intake levels for both organic and inorganic dietary forms. However,
selenomethionine has a stronger and more stable effect on raising and
maintaining GSH-Px 44• Whilst this may be true, it has also been noted that it may
not confer any greater degree of anti-carcinogenic properties than do other forms
49• A more comprehensive explanation may be arrived at when considering that
there is differential regulation of the selenoproteins; this ensures that those, which
perform the most important functions, are preferentially preserved. Selenium
supply to the brain, endocrine and reproductive organs is as far as possible
maintained at optimum levels with the synthesis of selenoproteins such as
iodothyronine deiodinases taking precedence 50• GSH-Pxs are the most
20

dispensable and, therefore, when these levels are at an optimum it can be
conferred that all other selenoproteins are also at an optimum. Any further
selenomethionine taken up in the diet is incorpomted non-specifically into
selenium-containing proteins. Excess levels of other forms of dietary selenium
are excreted in the urine 43•
Humans are exposed to selenium mainly through their diet. Studies have shown
that the body absorbs approximately 95% of ingested selenomethionine whereas
only 60% of selenite is absorbed with selenate absorption being around 90% 51•
Although selenomethionine is absorbed from the diet more rapidly and to a
greater extent than any other form of selenium it is also retained in the tissues
following non-specific incorpomtion more strongly than other forms. The dietary
selenium species other than selenomethionine are therefore more readily
available for biosynthesis of the active selenoproteins that contain selenocysteine.
The UK Reference Nutrient Intake (NRI) of75 Jlg per day for men and 60 Jlg for
women 52 has been determined as the intake believed to be necessary to maximize
the activity of the anti-oxidant selenoprotein GSH-Px which occurs at a plasma
concentmtion of around 95 Jlg 1"1• Toxic symptoms occur at approximately
to,ooo 11g r1 53•
Seafood and offal provide a large source of dietary selenium together with yeasts
and mushrooms. However, there is limited information available on the
proportions of organic to inorganic forms of selenium in these foods and of their
21

bioavailability. r:>ietary supplementation of selenium has become an increasingly
popular choice as a route to redress the balance of naturally low selenium levels
in food. Supplements can·befound with varying amounts and forms of selenium.
Most contain single chemical entities. Conversely, selenized yeast preparations
may contain a mixture of compounds, some of which may be unspecified.
Research has shown a diversity in yeasts ranging from 20 - 80%
selenomethionine with selenocystine, Se-methylselenocysteine and
selenoethionine (amongst others) comprising the remainder 54•
44• Selenized yeast
was used in the Clarke et al. 41 trials but it is not known exactly which form of
selenium is responsible for reducing the incidence of cancers.
As the cancer chemopreventative effect of selenium has been tentatively
attributed to the biological functions. of selenoamino acids further understanding
of the efficacy ofdietary:supplementation relies on the development of analytical
methodology for the separation, identification and determination of the various
species present in selenium-enriched food-stuffs. There is no doubt that the
absorption, transport, metabolism, retention and elimination of selenium
compounds is dependent on its chemical form but further work in these areas is
needed to develop a more informed view regarding selenium supplementation.
22
1.4 Methods for tbe speeiation of arsenic and selenium
It is recognized that the need for trace element analysis requires very sensitive
analytical techniques for quantification and qualitative identification. Speciation
of elemental compounds is essential for the assessment of their toxicological
impact. Methods to separate and identify various species are now becoming a
necessity for any elemental analysis. There are numerous review papers
published annually dealing with analytical methods used for the identification
and determination of arsenic and selenium compounds 55•
56• Analytical
approaches generally involve the use of separation techniques coupled with a
sensitive element specific or molecular detectors for quantification purposes.
Recent successful applications of electrospmy mass spectrometry (ESMS) for
species characterization and identification have confirmed the potential
opportunities offered by this technique 36•
57• Chromatogmphic techniques, for
separation of analytes, comprise liquid and gas chromatogmphy. Both are high
performance methods but the most important distinction between the two is that
GC relies on compounds that are volatile or can be evaporated intact at elevated
temperatures, and can separate approximately 20% of known organic compounds
without prior derivitization, whereas for LC most organic and inorganic
compounds can be dissolved in a solvent and are therefore amenable to
separation using this technique. HPLC together with ICP-MS and ESMS provide
an exciting route for analytical chemistry, particularly in the area of speciation.
23

1.4.1 High performance liquid chromatography
Chromatographic separations have been used successfully since the 1930's 58•
Since its inception, chromatography has developed so that a vast array of
complex matrices can be determined. This is due to the versatility of the
technique. Liquid chromatography is a generic term used to describe any
chromatographic procedure in which the mobile phase is a liquid. Examples of
these techniques include ion-exchange, ion-pairing, reversed phase and size
exclusion chromatography. Ion-exchange chromatography will be used
throughout the experimental chapters of this thesis and, therefore, a brief
description of this will follow.
1.4.1.1 Ion-exchange chromatography.
Ion exchange comes under the umbrella of liquid chromatographic techniques. It
is a process wherein a solution of an electrolyte (mobile phase) is brought into
contact with an ion exchange resin (stationary phase) and active ions on the resin
are replaced by ionic species of a similar charge from the electrolyte solution.
Competition between ions of the mobile phase and that of the analyte allow
chromatographic separation to occur, separations being based on the difference in
migration rates among the analyte components. To achieve a successful
separation of analyte ions by ion chromatography the effects of pH, the counter
ion and the ionic strength of the eluent can be manipulated until optimum
conditions are obtained.
24

Column packing materials used for ion exchange are characterized by the
presence of charged groups covalently bound to the stationary phase. Anion
exchange columns carry a positive charge, usually a quaternary ammonium group
(strong anion-exchange) or an amine group (weak anion-exchange). Cation
exchange columns carry a negative charge, usually a sulphonate group (strong
cation-exchange) or a carboxylate group (weak cation exchange). Strong ion
exchange groups are more commonly employed as they retain their properties
over a wide range of pH. The driving force for the separation is the charge on the
analytes, which depending on the pH may or may not be fully ionized. For weak
acids or bases retention behavior is pH dependent. However, if the analyte
molecules are strong acids or bases their retention behavior is not affected by
changes in pH of the mobile phase as they remain fully charged over a wide pH
range. The pKa values for compounds provide an indication of how they will
behave and this knowledge can be used to optimize separation conditions based
on the pH of the mobile phase.
Ion-exchange will also be influenced by the choice of the counter ion. As a rule,
multiply charged ions are bound more strongly than singly charged ones. The
retention time in anion-exchange increases if a counter ion is exchanged with
another, for example, in the following sequence: citrate - sulphate - oxalate -
tartrate - iodide - borate - nitrate - phosphate - bromide - cyanide - nitrite -
chloride - acetate. For example citrate solutions elute analyte anions more rapidly
than phosphate solutions. Ion exchangers have a preference for ions with a higher
charge, smaller diameter and greater polarizability.
25

Ion-exchange equilibria can also be displaced by changes in the ionic strength of
the buffer solution. The ionic strength affects the capacity factor, k', and causes it
to drop with increasing ionic strength; the k' values of samples are inversely
proportional to the ionic strength 59• As the counter ion concentration increases
the analyte ion will spend less time in the stationary phase due to increased
competition and hence k' will decrease.
Other effects on ion-exchange chromatography include column temperatures. The
higher the temperature the faster the rate of diffusion which gives rise to better
peak shapes and shorter elution times 60• This is not directly attributable to ion-
exchange equilibria but a kinetic effect on the rate at which equilibria are
attained. Column efficiency is also improved when eluent viscosity is
decreased 60•
1.4.2 Inductively coupled plasma-mass spectrometry (ICP-MS)
The argon ICP is the most widely used atomic spectroscopic source in analytical
chemistry 61• A schematic of the instrumentation is shown in Figure l-6. It is
increasingly used as a high-temperature ion source for mass spectrometry.
Practical considerations for the generation of ICPs were originally addressed by
Reed 62 and refined for spectrochemical analysis in the early 1960's. Greenfield
successfully used ICP as an ion source for atomic emission spectrometry 63 and
the technique was further development by Date and Gray 64 for use as an ion
source for mass spectrometry. Since then many elements of the Periodic Table
have been analyzed with success, including As and Se 65• 66
.
26

lndud!Valy oou~ed ~asma
Interlace region Mass ~trometcr
Sam~ing cone r.:=::::;;:=== = = ===========il
Aerosol ~-
r.f. lrxloction coil I I
~'mo:J o I r.l. power
r.one
--
Ion lense~ liflc. pooton slop)
Quadrupole mass Ion delector filter
I Rotary pump Higl\-~acuum
S!gnal handling
pum(IS
Figure 1-6 Schematic of an ICP-MS instrument 67•
An inductively coupled plasma is a relatively well characterized, high-
temperature source, suitable for the atomization and ionization of elemental
species. Generation of the plasma occurs within a quartz torch, which consists of
a series of concentric tubes, through which argon gas flows. The coolant and
auxiliary gases enter tangentially creating a vortex that produces the distinctive
annular plasma characteristic of an ICP. The torch is encircled at the top by an
induction or load coil, which is connected to a radiofrequency (rt) generator. The
magnetic field generated by the rf current induces a current in the gas stream. The
27

seeding of the gas with electrons fonns the plasma by initial excitation from a
Testa coil attached at the coolant gas inlet. The electromagnetic vectors giving
them sufficient energy to cause ionization of the gas accelerate these initial
electrons. Further collisions that ensue enable the plasma to become self
sustaining as long as the electromagnetic field is sufficiently high and the gas
flows in a symmetrical pattern. The ionization conditions within the plasma result
in highly efficient ionization of most elements in the periodic table (dependant
upon their ionization energies) and. importantly, these ions are almost always
exclusively singly charged 68•
Liquid sample introduction is the most common way for presenting samples to
the plasma. Typical sample introduction systems consist of a nebulizer (e.g.
crossflow, V groove) and spray chamber (e.g. double or single pass, cyclonic).
The nebulization process creates a fine aerosol of the liquid sample and the spray
chamber then separates out large droplets. The spray chamber may also be cooled
facilitating the removal of solvent. The small droplet aerosol is then transported
to the plasma by the nebulizer gas flow where it undergoes desolvation,
vaporization, atomization and finally ionization. The analyte ions are
subsequently introduced into the MS by a series of chambers held at
consecutively lower pressures where they are focused by ion lenses then
separated according to their mass:charge ratio either by using a quadrupole (low
resolution MS) or magnetic sector (high resolution MS) analyzer and finally
detected by an electron multiplier or Faraday cup detector (depending on analyte
concentrations).
28

ICP-MS is generally regarded as a sensitive and selective multi-element detector
with a wide linear range capable of providing low limits of detection 61• However,
spectroscopic and non-spectroscopic interferences can limit the utilization of this
technique; an important case in point is the interference of 40Ar160+ on 56Fe+. By
careful selection of operating conditions or sample modification most
interferences can be minimized or reduced in magnitude.
Spectroscopic interferences include isobaric overlap of element isotopes and
polyatomic ions which can be formed from water, plasma gases and from
compounds present in the sample matrix. Such interferences can cause an
erroneously large signal at the m/z of interest. Some polyatomic interferences for
selenium and arsenic are shown in table 1-5.
Table 1-5. Spectroscopic interferences of arsenic and selenium in ICP-MS 69•
Molecular ion Analyte ion Nominal mlz
interference interfered with
Se 74
Art, Ca02+ Se+ 76
ArCl+, eaot, Arzlt Se+ 77
+ c + Arz, aOz Se+ 78
+ o+ArC+ Arz, Ca 2, a se+ 80
ArzHz+ se+ 82
ArCl+,eaot, ArzW As+ (monoisotopic) 75
29

Spectroscopic interferences can be overcome by employing a mixed gas plasma
Evans and Ebdon 70 have proposed that the reduction of 40 M 5Cl+ in the presence
of N2 can be explained by the competitive formation of ArW. Increasing the
nebulizer flow rate can also reduce polyatomic interferences as there is less time
spent in the plasma and therefore less time for the formation of these interferents.
Other techniques to reduce spectroscopic interferences include matrix removal
prior to analysis or the use of a high resolution MS.
Non-spectroscopic interferences refer to matrix-induced changes in signal
intensity that are unrelated to the presence of a spectral component. They
manifest themselves by signal suppression or enhancement although most
commonly by suppression. These interferences are mainly attributable to space
charge effects. Space charge effects arise from the mutual repulsion of ions in the
ion beam, which influence ion trajectories.
The matrix effect is quite general in that almost any concomitant in high
concentration will cause an effect To reduce matrix effects the injector gas flow
rate can be reduced in the ICP torch and ion lens modification can be utilized to
enhance the throughput of certain mass ranges thereby avoiding interfering
matrix elements. As with spectroscopic interferences matrix removal where
possible is always beneficial. The use of internal standards, although they do not
reduce or eliminate matrix effects, can be used to compensate for the changes that
may occur.
30

1.4.3 Eledrospray ionization mass speetrometry (ES-MS)
Electrospray ionization mass spectrometry has developed to become a widely
used analytical technique since its introduction in the 1980's by both Yamashita
and Fenn 71 and Aleksandrov et a/ 72• Electrospray ionization is a technique that
allows the transfer of ions from solution to the gas phase whereby they can be
analyzed by mass spectrometry. The fundamental features ofES are that: i) it can
produce extensively multiply charged ions enabling the analysis of large
molecular weight compounds; ii) they are introduced in solution making ES
compatible with many types of separation techniques: and iii) it is a 'soft'
ionization technique retaining molecular structure. ESMS as a source for
elemental speciation relies on its ability to preserve the formal oxidation state of
metal ions and the molecular form of the species.
The ion formation process is the starting point for mass spectrometric detection.
There are three steps involved in the production by electrospray of gas-phase ions
from electrolyte ions in solution: i) production of charged droplets at the ES
capillary tip; ii) shrinkage of the charged droplets by solvent evaporation; and iii)
the production of gas-phase ions from the now small, highly charged droplets.
The production of charged droplets at the capillary tip is achieved by the
application of a high electric field to the flow of liquid. This is achieved by the
application of a potential difference of approximately 3-6 kV between the
capillary tip and the counter electrode located at approximately 0.3-2 cm away.
When the capillary tip is in the positive mode positive electrolyte ions will drift
31

towards the liquid meniscus and negative ions will drift away from the surface,
the charge separation being electrophoretic in nature. The mutual repulsion
between the positive ions at the surface overcomes the surface tension of the
liquid and the surface begins to expand. The liquid is drawn out into a cone
known as the 'Taylor' cone. If the applied electric field is high enough a fine jet
of charged droplets will emerge from the cone tip. The charged droplets produced
then drift downfield towards the counter electrode. At this point the droplets
undergo solvent evaporation without change in charge. The decrease of droplet
radius at constant charge leads to an increase in the electrostatic repulsion of the
charges at the surface until the droplets reach the Rayleigh stability limit, the
condition at which the electrostatic repulsion becomes equal to the force due to
surface tension which holds the droplet intact. Droplets undergo fission when
they are close to the Rayleigh limit. This fragmentation is caused by Coulombic
repulsion of the charges on the droplet. The energy required for solvent
evaporation is provided by the thermal energy from the ambient air. These smal~
highly charged droplets ultimately provide gas phase ions. A schematic of this
process is shown in Figure 1-7. However, currently there are two schools of
thought as to bow this process occurs; the ion evaporation model (IEM) proposed
by lribarne and Thompson 73 and the charge residue model (CRM) developed by
Dole et al 14• In brief, the CRM depends on the formation of extremely small
droplets containing only one ion. Solvent evaporation from this droplet will give
rise to a single gas phase ion. The IEM predicts that after the radii of the droplets
decrease to a given size, direct emission from the droplets becomes possible and
this process, ion evaporation, becomes dominant over coulomb fission for
32

droplets with radii > 10 nm. Much work has and is being carried out in this area
of research but it is still not possible to say with any certainty which theory most
closely matches the available evidence 77•
75•
76• Although the emission of ions to
the gas phase is highly endothermic and endoergic this process of evaporation is
gentle enough not to fragment the parent molecule.
Oxidation
Electrons
High Voltage Power Supply
Electrons
Figure 1-7 Schematic of major processes occurring in electrospray n .
The gas phase ions produced during the electrospray process drift towards the
counter electrode (e.g. the mass spectrometer sampling orifice) and enter the
mass spectrometer where they are separated according to their mass/charge ratio
under reduced pressure.
Limitations of electrospray as a technique for elemental speciation are mainly
attributable to the physical processes responsible for the generation of the
33

electrospmy and chemical considemtions 78•
79• A stable electrospray is only
genemted within a given conductivity range for a given solvent for a fixed set of
opemting conditions. Outside of this range droplet production, and hence ion
current, becomes erratic. The use of electric fields for nebulization leads to some
restraints on the solvents employed. Fluids with higher surface tensions require a
higher threshold voltage for stable electrospmy production and higher dielectric
liquids produce higher currents. This can lead to the onset of electrical discharges
from the capillary tip. The presence of an electrical discharge degmdes the
perfonnance of ESMS particularly at high discharge currents. The ES ions are
seen at much lower intensities than prior to the discharge and the corresponding
discharge-generated ions have much higher intensities. It is likely that the
discharge reduces the electric field near the capillary tip, which in turn interferes
with the charged droplet formation. Ideally, the solvent flow rate, surface tension
and electrolyte concentmtion will be low to avoid the use of higher electric fields
for droplet formation and droplet charging. Amenable solvents for ESMS are
volatile (aqueous Nf4HC03, MeOH, CH3CN) and at a suitable pH for ion
formation in solution: acidic for opemtion in the positive ion mode; and basic for
operation in the negative ion mode.
Although ESMS is primarily a qualitative technique it can be used for
quantitation but the linear relationship of analyte concentmtion to signal is
limited due to the complex and competitive nature of ion production. When a
matrix ion is present in excess, signal suppression can be severe.
34

1.5 The speciation of arsenic and selenium
Speciation analysis of elemental compounds and their oxidation states has
become more frequent over the past decades as it is now known that toxicity and
bioavailability, for example, of an element can be several orders of magnitude
different depending on the chemical form 28• One of the key issues surrounding
speciation analysis is to preserve the integrity of the species in a sample. Many
elements of interest are present in trace amounts and the species a fraction of this.
This requires that analytical techniques and methodology are capable of sensitive
and selective separation and detection.
1.5.1 The use of HPLC-ICP-MS for speciation analysis
ICP-MS has fast become the detector of choice for the determination of elements
in a wide range of samples at concentrations in the ng 1"1 to J.lg 1"1 range. The
versatility and reliability of the technique in terms of element specificity and
sensitivity and the ease in which HPLC systems can be hyphenated to it make it
ideally suited for use as a chromatographic detector. Due to its multi-element
capability arsenic and selenium can be determined simultaneously with the
correct chromatographic conditions. The advantages of ICP-MS as a detector
include a wide linear dynamic range, low limits of detection and high speed of
analysis. Liquid chromatography with ICP-MS detection is principally used for
speciation analysis and a review of the literature reflects the versatility of the
technique 80•
35

The molecular fonns of arsenic commonly encountered in the environment are
anions, e.g. arsenate, MMA and DMA, cations, eg. the quaternary arsonium
compounds AsBet, AsC and tetramethyl-arsonium ion (TeMA) or uncharged
compounds at neutral pH, e.g. arsenite and trimethylarsine oxide (TMAO).
Arsenosugars present in marine algae are another commonly encountered group
of arsenic-containing compounds. Their chromatographic behavior is dependent
on the size of the molecule and the functional groups present in given solvent
conditions. Similarly with selenium compounds, the inorganic selenate and
selenite form anions at neutral pH whilst the amino acids SeMet, SeCys and
selenocysteine are zwitterions. Because of this the most common types of liquid
chromatography used for the speciation of arsenic and selenium include ion
exchange (anion and cation), reversed phase and ion-pairing.
The simultaneous separation of 17 arsenic species has been achieved using
HPLC-ICP-MS with an anion exchange column and a gradient mobile phase
within 15 mins 81• More commonly, fewer species are reported relying on the use
of both anion and cation exchange chromatography for the separation of neutral,
anionic and cationic arsenic compounds independently 82•
83•
84•
66•
85• Cation and
anion exchange chromatography has also been reported for the speciation of
selenium compounds 86•
87• Simultaneous use of the two fonns of ion-exchange
has allowed the separation of a mixture of 12 inorganic and organic selenium
compounds 36• The use of both types of ion exchange for the analysis of either
arsenic or selenium (or both) in the same sample ensures the separation of
compounds that would otherwise be eluted in the dead volume of a column.
36
Arsenic and selenium have some common chemical properties. The predominant
inorganic forms appear as oxyacids and/or ions and in pH conditions that ionize
organic forms of arsenic the organic forms of selenium are also ionized and
therefore conditions can be applied for simultaneous separation 88•
89.
Simultaneous separation conditions often rely on gradient elution programs
whereas isocratic mobile phases are the preferred choice as they provide greater
stability 90• lsocratic mobile phases may reduce analysis times, as no equilibration
step is required between analyses although late eluting compounds in isocratic
conditions will hinder the overall times.
Many of the ion exchange column packing materials are based on the eo
polymerization of styrene with divinylbenzene to produce degrees of cross
linking with the Hamilton PRP XlOO (strong anion exchange) being the most
frequently employed. These columns are resistant to a pH range of 1-13 as
opposed to silica based columns that dissolve at a pH above 8. This allows for a
greater variety of eluents to be employed when establishing optimum separation
conditions. High salt eluents such as sulphates and phosphates are very good at
providing ion-exchange chromatographic separation. However, when coupling
HPLC to ICP-MS several precautions must be taken. The salt content in the
mobile phase needs to be maintained at less than 2% to reduce the risk of
blocking the nebulizer and eroding the sampler and skimmer cones in the MS
detector. Ion exchange chromatography generally utilizes low concentrations of
buffer, which help to reduce these problems and of those related to matrix
37

interference effects. Although much work is based on salt buffers, nitric acid has
been used successfully with less clogging of the sampler cone being reported 91•
Reversed-phase and ion-pairing reversed-phase chromatographic methods have
been applied successfully to the separation of arsenic and selenium compounds.
Two reviews, the first by Sutton and Caruso 92 and the second by Guerin et al. 80
discuss the merits of these techniques with a comprehensive reference list of
speciation methods employed. However, work by Larsen 36 suggests that full
optimization of ion-exchange techniques provide superior results to those
obtained by reversed-phase techniques. This appears to be due to the direct
interaction of analyte ions with the stationary phase of the chromatographic
column making the analyte ion less prone to interferences from eo-eluting matrix
constituents and due to the lower amounts, if any at all, of organic solvents used
in the mobile phase which can de-stabilize the ICP-MS system. Gilon et al. 93
tested ion- pairing with ion-exchange chromatography for the separation of
selenium and also found ion-exchange to be the superior mode of analysis.
Modifications to the chromatographic and ICP-MS system have been reported
that can improve the sensitivity of detection. Matrix removal and pre
concentration of samples by solid phase extraction (SPE) techniques have been
applied to the speciation of arsenic 94• 95 and selenium 96
• 97 compounds. However,
these techniques are often limited in that only cationic or anionic species can be
observed at any one time due to the nature of the SPE cartridge. Pre
concentration does not directly affect sensitivity or limits of detection but is
38

frequently used to improve the analyte signal. On-column pre-concentration work
with selenium speciation 98 has demonstrated a signal improvement by 1-2
orders of magnitude and techniques for arsenic have reported similar
efficiencies 94•
Modifications to the ICP-MS instnnnentation have included the use of various
types of nebulizers, spray chambers and the introduction of alternative gases to
the plasma. Crossflow nebulizers are most frequently used for samples that
contain a heavy matrix or have small amounts of undissolved matter. Although
they are much less likely to block. they are generally not as efficient as concentric
nebulizers at creating a fine aerosol of droplets required for ICP-MS. Low-flow
nebulizers are also available for work with micro-bore HPLC columns where
eluent flow rates are typically at 0.2 ml min-1• Two designs of spray chamber are
used in commercial ICP-MS instrumentation - the double-pass and cyclonic.
Research carried out into the performance of spray chambers 99 demonstrates that
the transport efficiency and washout times for the cyclonic spray chambers are
much more effective thereby improving signal:noise ratios and the overall
performance of analyte detection. Cooling jackets around the spray chamber can
also improve performance by reducing the solvent load to the plasma, particularly
where organic solvents are employed in the mobile phase. The introduction ofN2
into the plasma 70 is a well-documented technique for reducing polyatomic
interferences in the analysis of arsenic. The polyatomic ion 40 ~5Cl+ is a
particular problem as arsenic is monoistopic at mass 75. The addition of N2 has
39

been effective for samples containing in excess of 1% chloride. Without
modification results for arsenic can be up to 30% higher 100.
HPLC with ICP-MS as a detector is now well established with an extensive
number of publications supporting its popularity. Much work has been directed
towards the separation of a greater numbers of species per analysis 101•
102 with
high-speed separation 103 and improving on limits of detection. For arsenic
speciation detection limits as low as 0.005 ng as arsenic have been reported 104•
105• For selenium speciation limits in the region of0.8 ng as selenium are reported
93• Simultaneous separations give similar limits which implies there is no
deterioration in analytical capability between individual determinations and when
performed concurrently 106•
107• The choice of system depends primarily on the
research objective. There are a number of excellent reviews published that cover
this area of research 80•
108•
109 providing an overview of the many systems used
and results obtained.
Although HPLC is undeniably an excellent separation technique it relies on the
identification of species by matching retention times with that of known
standards. However, the complexity of samples may lead to errors in
identification due to eo-elution of species, matrix constituents altering retention
times and the lack of commercially available standards for peak identification.
This has led analytical science towards the use of multi-dimensional approaches
for the speciation of compounds. As previously stated, anion and cation exchange
chromatographic techniques have been employed simultaneously for the
40

determination of arsenic and selenium species. Size exclusion chromatography
has also been used together with ion-exchange and reversed phase
chromatography allowing unambiguous peak assignments to be made where
standards are available 110•
111• This is brought about by matrix simplification and
by distinction of compounds against standards according to their elution times
that remain independent of the type of chromatography used. This type of
approach is usually successful for speciation of elemental compounds but is still
limited by the availability of standards. When performing complex biochemical
speciation analysis standards are usually unavailable since the majority of species
remain unidentified and, as in the case of arsenosugars, compounds with similar
chemical structures may persistently eo-elute despite the use of multi
dimensional chromatographic techniques. The lack of convenient methods for
structural determination and confirmation remains a major barrier to the
mechanistic understanding of function. Mass spectroscopic analyses that retain
molecular information of the species have become powerful tools for the
identification of compounds particularly when used in conjunction with HPLC
ICP-MS instrumentation.
1.5.2 The use ofHPLC-ESMS in speciation analysis
ESMS is based on a 'soft' ionization approach of the sample components and,
therefore, can retain the molecular structure of a compound. By studying spectra
obtained from samples it is possible to deduce molecular masses and, by
fragmentation patterns of the parent molecule, their molecular structure. In 1996
41

Corr and Larsen 112 obtained spectra of four arsenosugars by HPLC coupled with
ESMS demonstrating the possibility of structural characterization for these
species. Since this time, an increasing amount of work has been carried out using
HPLC-ESMS with successful results in verifying compound structures and in the
characterization of previously unidentified species 57•
113• However, some of the
limitations in ESMS result from the matrix components swamping the signal
from the analytes of interest and subsequently affecting the detection limit. This
has resulted in the use of multi-dimensional chromatographic techniques for
matrix removal and sample pre-concentration by fraction collection to obtain the
best results. McSheehy et al. 110 employed three-dimensional chromatography
(size exclusion, anion exchange and cation exchange) and was able to confirm the
presence of four previously unidentified arsenic compounds in the kidney of the
clam Tridacna derasa. Similar success has been reported for selenium speciation
114•
115 again with the use of multi-dimensional chromatography. HPLC-ESMS has
also been used as a complementary technique to that of HPLC-ICP-MS 116•
HPLC-ICP-MS provides information of where arsenic-containing species elute
and then by HPLC-ESMS their molecular mass and structure can be confirmed.
ESMS precludes the use of crude extracts as it can suffer from matrix suppression
of the analyte signal. Another drawback is that the mass spectra obtained can be
highly complex and the possibility of matrix constituents having coincident
masses to that of the analytes under investigation must also be considered.
However, the use of chromatographic techniques together with ESMS provides
42

an attractive alternative to that of the so far exclusively used NMR. which
requires labour-intensive isolation and purification techniques 117
•
ESMS allows an accumte determination of the molecular mass of a compound
with structural chamcterization provided by tandem MS techniques. It is
becoming a valuable tool for the identification and characterization of species in
real samples detected by HPLC-ICP-MS where lack of available standards or eo
elution of species may cause ambiguity in peak assignment. However, at the
present stage of development the sensitivity of ESMS is approximately 2-3 orders
of magnitude higher than that of ICP-MS. Improvements in purification of
sample extracts and choice of eluents compatible with ESMS is required.
The paucity of ESMS applications in the litemture to environmentally relevant
samples may be as a direct impact of its poor sensitivity in comparison to
techniques such as ICP-MS. However, the application of ICP-MS, with its
element selectivity and sensitivity, Wld ESMS, with its moleeular specificity, as
complementary to one another has proved a powerful analytical tool with the
subsequent detection and chamcterization of previously unidentified
compounds 110•
Further research and development to provide methods that are HPLC-ESMS/ICP
MS compatible and easy to use is required in promoting elemental speciation
analysis of real environmentally complex samples.
43

1.6 Aims oftbe study
Research in the field of elemental speciation has utilized instrumental techniques
where elegant separation techniques can be coupled with sophisticated detectors
according to requirements. When investigating samples for toxicological
purposes, in-depth speciation analysis may be unnecessarily time-consuming and
expensive. For initial environmental pollution screening purposes the separation
of relatively toxic from relatively non-toxic species may be all that is required.
Should high levels of toxic species be encountered then further more rigorous
analytical procedures can be employed. The aims of this work are to develop a
simple, yet effective, system for the separation of relatively toxic from relatively
non-toxic arsenic and selenium species. This may be achieved by the
development of methodology based on low-pressure chromatographic systems
for separation coupled with ICP-MS detection. By selection of suitable
chromatographic conditions, which utilize the pKa values of the various species
under investigation, optimum conditions may be achieved to target the level of
analytical perfonnance required. The use of ICP-MS instrumentation, which
offers multi-element 'simultaneous· capabilities of high sensitivity should extend
the analytical perfonnance of the chromatographic systems, developed.
Analytical data on individual molecular species of an element present in a sample
can provide fundamental information regarding its toxicity, bioavailability,
metabolism or biogeochemical cycling. However, for quality control and quality
assurance purposes all analytical measurements must be comparable and
44
traceable. The basic purpose of certified reference materials (CRMs) is to
improve the comparability of results 118• They can be used at two different stages
of the analytical process: as a tool to demonstrate traceability; and as a tool for
method validation. One of the main obstacles in the progress of speciation
analysis is the paucity of reference materials that are certified for species as well
as for total elemental concentrations. The aims of the following work include that
of using conventional and novel analytical approaches for the determination of
arsenic and selenium species present in a variety of environmentally important
samples for future inclusion as new certified reference materials. lbis will be
achieved by participation in two European collaborative feasibility and pre
certification trials.
Further aims of this work are to use HPLC-ICP-MS together with ESMS to
develop and improve methodologies available for speciation analysis. Initial
studies will be carried out using HPLC-ICP-MS with multi-dimensional
chromatography employed where appropriate. ESMS will be used as a
harmonizing technique for species identification and confirmation, particularly in
cases where commercial standards are unavailable for matching peak retention
times. Development of an HPLC system that is compatible with ICP-MS and
ESMS will be undertaken so that comparisons between the two techniques can be
made.
45

When performing speciation analysis it is of vital importance that species are
extracted from the matrix unchanged. Investigation of extraction procedures to
broaden techniques available for arsenic and selenium speciation will be pursued.
46

-,-., ~.
47•
. " '·'
"• j
2 Development of a novel LC-ICP-MS system for the
simultaneous separation and determination of arsenic and
selenium species based upon toxicity
2.1 Introduction
The elemental speciation of arsenic and selenium has become an area subject to
increasing attention due to their toxicological and biological significance in living
organisms. A range of toxicities is exhibited for both elements dependent on the
chemical form. Inorganic forms of arsenic exhibit high toxicities with Asm being
the most toxic and a suspected human carcinogen. Organic species such as
arsenobetaine are considered to be essentially non-toxic. Current permitted or
allowable ·levels for arsenic in drinking water stand at 50 J.lg r• (EU and USA)
and 10 J.lg r• (WHO) and levels in foodstuffs stand at 1 mg kg·• total arsenic,
under review as inorganic arsenic 119•
Selenium is an essential trace element in the human diet possessing a narrow
therapeutic range; too low an intake can lead to various deficiency syndromes
whereas too high an intake can be toxic or even lethal 120• Its nutritional
bioavailability, toxicity and anti-carcinogenic properties have been found to be
species dependent. It is thought that inorganic selenium, particularly as selenite,
is the most likely form to induce toxic symptoms 41• The UK Reference Nutrient
Intake has been given as 75 J.lg daily for men and as 60 J.lg daily for women 2•
48

Symptoms of toxicity are thought to occur at an intake of approximately 1 000 J.l.g
daily. However, in susceptible individuals this level may be as low as 600 J.l.g 121
Determination of distinct chemical species, often referred to as speciation
analysis, of arsenic and selenium in a variety of foodstuffs has provided essential
information for elucidation of, for example, absorption, bioavailability, metabolic
pathways of the compounds under investigation and the nature of their toxicities
10• Research in this area has utilized instrumental techniques that include HPLC
for separation purposes coupled with element-specific detectors such as ICP-MS
101• 103, atomic absorption spectrometry (AAS) 122•
123, atomic emission
spectrometry (AES) 124•
125 and atomic fluorescence spectrometry (AFS) 126
• 127
.
However, when investigating samples for toxicological purposes, in-depth
speciation analysis may be unnecessarily time-consuming and expensive. For
screening purposes an estimate of the toxicology of a sample may suffice, i.e.
separation of inorganic from organic species of arsenic and selenium, whereby an
overall simplification of the instrumentation and methodology for the analysis
can be implemented. A protocol showing the progression through a speciation
analysis is shown in Figure 2-1.
49

Sample
l Total element concentration
above
Speciation
1 Target 'general' characteristics of species
Threshold value
above below
Target specific characteristics of species
Threshold value
below
No further action
No further action
Figure 2-1 Protocol showing progress through a speciation analysis, which demonstrates inherent screening steps
50

The aim of this study was to investigate and develop a simple, yet effective,
system for the simultaneous separation and detection of inorganic (high toxicity)
from organic (relatively lower toxicity) arsenic and selenium species present in a
variety of environmentally and biologically important samples. The samples
chosen for investigation were a variety of food types known to contain high
levels of arsenic (fish) and selenium (selenized yeast dietary supplement) which
have obvious health implications in the human diet. In terms of toxicity the LDso
values for the species under investigation in this work are shown in Table 2-1.
Table 2-1 LD$0 values for arsenic 28 and selenium 128.
41 species under investigation
Species LD5o (rat) oral dose - mg kg· body weight
Arsenite 1.5
Arsenate 5.0
MMA 50
DMA 600
Selenite 7
Selenate 53
SeMet• <toxic than selenite
SeCys • = to selenite
variable data, therefore given in relation to selenite .
51

2.2 Experimental
2.2.1 Instrumentation
ICP-MS measurements were performed usmg a VG Plasmaquad, 2+ (fJA
Solutions, Winsford, Cheshire, UK), using the operating conditions described in
Table 2-2. A Perkin Elmer series 410 high-pressure pump (Perkin Elmer, CT,
USA) and a Gilson peristaltic pump were used for control of chromatographic
eluent flow mtes. A Rheodyne 7152 injection valve (Rheodyne, Cotati, CA,
USA) was used for column loading. pH readings were taken using a 3010 pH
meter (Jenway, Ltd., Essex, UK).
Arsenic was measured using m/z 75. 4% (v/v) N2, for the reduction of ArCI+
interferences on m/z 75, was added via a Signal series 850 gas blender (Signal,
Camberley, Surrey) to the nebulizer gas flow.
Selenium was measured using isotpes at m/z 77, 78 and 82.
52

Table 2-2 ICP-MS opemting conditions used for the determination of arsenic and selenium in all
samples.
ICP-MS
Parameters
Plasma Quad 2+
V groove nebulizer
Double-pass, water cooled Scott type spray chamber
Fassel torch- 1.5 mm bore injector
Argon plasma - 4% N2 added for direct total As
determination to the nebulizer gas flow
Nebulizer flow rate 0.81 I min-I
Coolant gas flow rate
Auxiliary gas flow rate
Forward power
Dwell time
13.11 min-I
0.81 min-I
1350W
500ms
Two types of anion-exchange mini-column (Benson AXI 0, 7 - 10 ~. and
Hamilton PRP X100, 12- 20 ~.both polystyrene divinylbenzene-based resins
with quaternary ammoniwn functional groups) were prepared. A wet slurry
eluent technique was used to pack the different columns at low pressure. The
experimental parameters under consideration are given in Table 2-3 and
conditions were optimized for both resin type mini-columns.
53
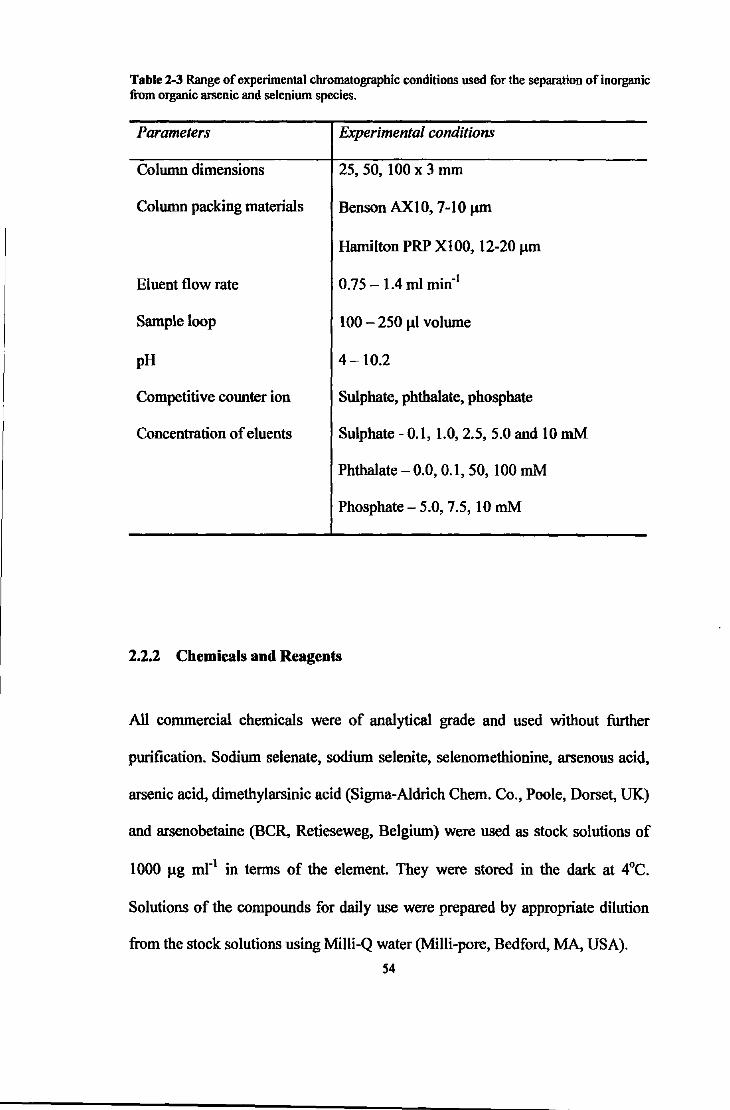
Table 2-3 Range of experimental chromatographic conditions used for the separation of inorganic ftom organic arsenic and selenium species.
Parameters
Column dimensions
Column packing materials
Eluent flow rate
Sample loop
pH
Competitive counter ion
Concentration of eluents
Experimental conditions
25, 50, 100 x 3 mm
Benson AXIO, 7-10 J.Uil
Hamilton PRP XIOO, 12-20 jJm
0.75- 1.4 m1 min-1
100-250 jJl volume
4-10.2
Sulphate, phthalate, phosphate
Sulphate- 0.1, 1.0, 2.5, 5.0 and 10 mM
Phthalate- 0.0, 0.1, 50, 100 mM
Phosphate- 5.0, 7.5, 10 mM
2.2.2 Chemicals and Reagents
All commercial chemicals were of analytical grade and used without further
purification. Sodium selenate, sodium selenite, selenomethionine, arsenous acid,
arsenic acid, dimethylarsinic acid (Sigma-Aldrich Chem. Co., Poole, Dorset, UK)
and arsenobetaine (BCR, Retieseweg, Belgium) were used as stock solutions of
1000 jJg ml-1 in terms of the element. They were stored in the dark at 4°C.
Solutions of the compounds for daily use were prepared by appropriate dilution
from the stock solutions using Milli-Q water (Milli-pore, Bedford, MA, USA).
54

Eluent solutions of potassium sulphate (Sigma-Aldrich), potassium hydrogen
phthalate and di-ammonium hydrogen orthophosphate (Merck, Poole, Dorset,
UK) were prepared as required using Milli-Q water and the pH adjusted using a
solution of 0.91 sp. gr. NH3 (Merck). Bovine trypsin and type XIV protease
(Sigma-Aldrich) were used for enzymolysis digestion of samples. Hydrogen
peroxide, 37% v/v ( Sigma Aldrich), stored in the dark at 4°C, and nitric acid,
69% v/v, (Primer, Fisons, Loughborough, UK) were used for microwave
digestion procedures.
2.2.3 Reference materials and samples
The certified reference materials, DORM-2 (Dogfish muscle) and TORT-2
(Lobster hepatopancreas) (National Research Council, Ottowa, Canada) were
used to validate the methods. Oyster samples were obtained from a European
inter-laboratory pre-certification trial. 'Selenoprecise'® tablets are available
commercially (Pharma Nord, Vejle, Denmark). Samples of plaice, intended for
domestic consumption, were obtained locally. They were dried at -60°C and 1 x
10'2 Torr in a freeze drier (Edwards Super Modulyo, Edwards High Vacuum,
Crawley, Sussex) and ground to fine powder using an Optiblend 2000 electrical
blender (Moulinex, France) prior to use.
2.2.4 Sample digestion procedures
In the determination of total element concentrations it is necessary to utilize a
sample decomposition technique that will ensure that the analyte of interest
ss

remains in solution. is stable and any chemicals used do not cause instrumental
interferences that may increase the limits of detection, particularly in cases where
trace or ultra-trace elemental levels are expected. The practice of microwave
digestion has been comprehensively reviewed 129 and in the dissolution of
biological matrices, it has been shown that the three primary components of
carbohydrates, proteins and lipids completely decompose in nitric acid (::::: 2 M) at
temperatures of between 145 - 165°C 130• Nitric acid (69% - azeotropic) has a
boiling point of 122°C and in order to adjust the oxidizing potential of HN03, by
means of elevating the temperature, closed vessel microwave conditions are used
130• The overall decomposition process is further assisted by the addition of
hydrogen peroxide as the oxidizing power ofHN03 increases with higher acidity.
Once complete digestion has been obtained, the elements of interest remain in
solution and can be determined by the chosen method of detection.
Acidic microwave digestions can destroy speciation information. Where
speciation analysis is to be performed digestion procedures that retain the
chemical form of the compound must be employed. The choice of a suitable
enzyme for the sample matrix where the cell contents can be released into
solution unchanged is one way in which this can be achieved. Enzymatic
digestions are widely reported in the literature with effective extraction of the
species under consideration 65•
131•
132• Optimum conditions of pH and temperature
must be employed, as enzyme activity is sensitive to these parameters.
S6

• HN03 digestion for the measurement of 'total' arsenic and selenium
Microwave bombs (Savillex, Minetonka, Minnesota, USA) were cleaned with 3
ml HN03 (69%, v/v) in a Perfecto 800 W microwave oven (DeLonghi, Italy) on
medium power for 2 mins. Samples of approximately 0.25 g were accurately
weighed into the bombs and 4 ml HN03 (691'/o, v/v) and 1 ml H2<h (37%, v/v)
were added. The bombs were loosely capped and left overnight to allow easily
oxidised material to be destroyed. After pre-digestion, the bombs were sealed
tightly and microwaved on medium power for 1 - 2 mins, or until the sample was
a clear colour (indicating a completed digest). The samples were transferred
quantitatively into volumetric flasks and made up to volume with deionized
water. The samples and standards were spiked to give a fmal concentration of
100 llg r1 Indium (In) which acted as an internal standard prior to analysis by
ICP-MS using the conditions previously described. The internal standard was
used to correct for instrumental drift (sample viscosity effects, mass transport,
etc.) over the analysis period
• Extraction procedure for the speciation of materials
Freeze-dried samples (plaice, oyster, DORM-2 and TORT-2) of approximately
0.25 g of tissue were accurately weighed together with 0.025 g trypsin (Sigma
Aldrich, Dorset, UK.) and approximately 20 ml NH.tHC03 (0.1 M, pH 8) 132
• The
solutions were homogenized in a 'Potter' homogenizer, transferred to
polyethylene centrifuge tubes and placed in a shaking water bath at 37°C for a
minimum of 4 hours. The samples were centrifuged at 2500 rpm for 40 min, the
57

supematant transferred quantitatively to 25 ml volumetric flasks and made up to
volume with the N~HC03 buffer. In this case, samples and standards were
spiked to give a final concentration of 100 J.lg r1 caesium (Cs) that acted as an
internal standard prior to analysis. Due to the change in pH conditions Cs was
used in preference to In as In is not very soluble at pH 8 and can precipitate out
of solution onto surfaces of the container or any particles present thereby being
lost to the analysis.
The Selenoprecise® yeast samples were prepared by accurately weighing
approximately 0.25 g of the pre-ground material together with 0.025 g of protease
(Type XIV) and approximately 20 ml ~C03 (0.1 M, pH 8) 133
• The solutions
were homogenized in a 'Potter' homogenizer, transferred to polyethylene
centrifuge tubes and placed in a shaking water bath at 37°C for a minimum of 4
hours. The samples were centrifuged at 2500 rpm for 40 min, the supernatant
transferred quantitatively to volumetric flasks and made up to volume with the
NRtHC03 buffer. Samples and standards were spiked to give a final
concentration of 100 J.lg 1"1 caesium (Cs) that acted as an internal standard prior to
analysis.
58

2.3 Results and Discussion
2.3.1 Choice of chromatographic conditions
To achieve the separation of highly toxic from less toxic arsenic and selenium
species in the chosen samples a number of experimental parameters were
manipulated until optimum conditions were attained. The species targeted were
inorganic As111, As v, Se1v and Se VI which are considered to be the most toxic and
the organic forms of arsenobetaine (AsBet), dimethylarsinic acid (DMA) and
selenomethionine (SeMet) which have a much lower toxicity. These species,
being weak acids or zwitterions, for which the structure of AsBet is shown in
Figure 2-2, appear in a number of ionic forms dependent upon the pH and redox
conditions used. The pKa values for these species, shown in Table 2-4, were used
to provide a basis for the work.
Figure 2-2 Structure of AsBet 14
59

Table 2-4 pK, values for arsenic 134 and selenium 135 compounds
Compound pKa Species present
Arsenite 9.23 HAs02~AsO£
Arsenate 2.20, 6.67' 11.53 HJAs04 ~ Asol·
AsBet 2.18 (CH3)3As+CH2COOH
DMA 1.28, 6.2 (CH3)2As(O)OH
Selenite 2.46, 7.31 H2Se03 ~ Se03 2.
Selenate 1.92 HSe04-~ Seol·
Se Met 2.6, 8.9 CH3SeCH2CH2CH(COOH)NH2
The degree of ionization of the species is pH dependent At pH 10.2 the arsenate
present will be in the form of HAsol· whereas at pH 5 the predominant species
is H2Aso4·. A diagram of Asv as a function of pH is shown in Figure 2-3. At pH
10.2 AsBet, being a quaternary arsonium compound, exists as a zwitterion. DMA
and As111 species are similarly dependent on the pH of solution.
Ionization of selenium compounds is also pH dependent and a diagram of Se1v as
a function ofthis is shown in Figure 2-4. Both the SeiV and the Se VI have doubly
negative charges at pH 10.2, existing as the anions SeO/- and Seo/-,
respectively. SeMet, a zwitterion at neutral pH, will possess a single negative
charge in alkaline conditions.
60

lOO
•• •• TO
.. ••
> HzAs04
< •• HA sO/"
~ 0 , . .. 10
0
• • 10 • • ••
pH
Figure 2-J"Predominance diagralll of Asv as a function of pH 3
ID 12
Figure 2-4iPredominance diagnun,ofSe1v as a function of pH m
61

The ionic character of the various arsenic and selenium species under particular
pH and oxidation conditions determined that greater flexibility and suitable
separation would be obtained using anion-exchange chromatography and this was
employed throughout. The parameters considered were: column length; type and
particle size of anion exchange resin; eluent flow rate; pH of mobile phase;
concentration of mobile phase; and type of competitive counter ion. The range of
experimental conditions used for each of the parameters is shown in Table 2-3.
The chromatogram shown in Figure 2-5 demonstrates the elution patterns of the
four arsenic species under considemtion using the optimum conditions derived
experimentally for the Hamilton PRP XlOO column. It demonstrates the eo
elution of the organic species followed by the eo-elution of the inorganic species
under investigation. Optimum conditions were a column of I 00 x 3 mm
dimensions, with a IO mM K2S04, pH I0.2 and a mobile phase at a flow mte of I
ml min-1 with a sample injection loop volume of 100 lJ.l. The larger particle size
of the Hamilton PRP XIOO resin (12-20 llffi) as opposed to the Benson AXIO
resin (7-10 llffi) reduced the back-pressure experienced allowing the use of a
simple peristaltic pump for control of the mobile phase flow-mte.
62

"' ~ "' '§ 0 u
.. sooo
-40000 2
39000
30000
25000
20000
16000
10000
6000
•• • •• ... 200 260 300 360
Time (s)
Figure 2-S Chromatogram of 4 arsenic standards (250 J.lg 1"1) obtained using a Hamilton PRP
XIOO column, lOO x 3 mm dimensions, with a lO mM K2S04, pH 10.2, mobile phase demonsttating the separation of organic from inorganic species. Peak l, As Bet and DMA; Peak 2, Asm (oxidized to Asv) and Asv.
The eo-elution of the organic species followed by the eo-elution of the inorganic
species under investigation was expected when taking into account theoretical
considerations of pKa values, pH used and column chromatography. The degree
of ionization of the species is pH dependent. At pH 10.2 the arsenate present will
be in the form ofHAso/·. This species has a doubly negative charge and thus a
greater affinity for the anionic stationary phase than the other arsenic species
under investigation and would be expected to elute last. At pH 10.2 AsBet, being
a quaternary arsonium compound, exists as a zwitterion and elutes with the
solvent front. DMA and arsenite, the latter being present in the form As02·, at
this pH will exist as singly charged anionic species and will also elute early due
to limited interaction with the stationary phase. Due to the shorter column length
63

and larger particle size than would be used for HPLC there are fewer theoretical
plates and, therefore, less ability of the column to separate and resolve species
having similar chemical properties. By experiment it was found that only
arsenate, possessing two negative charges at pH I 0.2, had any affinity for the
stationary phase and that all the other species eo-eluted. The intention of this
work was to separate organic arsenic from inorganic arsenic species. To
overcome the eo-elution of Asm with the organic species, As01 was oxidized to
Asv. This was possible by the addition of 37% v/v H20 2 (0.25 ml) to 25 ml of
sample (ratio of 1:100 H202: sample). The standard potential of the reduction
half-reaction of H202 ~ H20 is more positive than that of As v ~ Asm. The
stability of the other arsenic and selenium species under investigation was studied
with the addition of 37% v/v H202. It was experimentally determined that the
addition of H202 had no adverse effect since there were no conversions of the
other concomitant arsenic and selenium species.
Investigation of alternative column dimensions indicated that smaller column
dimensions gave rise to poor resolution between peaks as would be expected
from fewer theoretical plates being present 136• Higher and lower flow rates than
the optimum gave poor peak shapes due to the effects of longitudinal diffusion
and mass-transfer effects.
The use of phosphate as a mobile phase eluent is often reported by workers 137•
138
for the separation of arsenic species by HPLC, with pH conditions frequently
being within the range of pH 5.75 to 6.5.1nvestigation ofdi-ammonium hydrogen
64

phosphate providing the competitive counter ion in the mobile phase for this
study, although providing the necessary resolution, appeared to be fairly unstable
with shifting peak retention times. This may be accounted for by greater
equilibrium effects for HPol· at pH 10.2 than for the SO{ ion, which was fully
ionized under these pH conditions. The retention times were also longer
suggesting that 10 mM phosphate provides a weaker counter ion than does I 0
mM sulphate. To negate the lengthened retention times a higher concentration
would be required. An increase in ionic strength is known to have a deleterious
effect on the ionization processes in the plasma and the mass spectrometric
detection of ions 139• It was therefore, decided to proceed no further with the
investigation of phosphate as a mobile phase counter ion.
Experimental conditions to elute the species in a similar way to that of the
Hamilton column were also found when using the Benson resin. However, a step
gradient elution of 0 M potassium hydrogen phthalate (Milli-Q water), pH 7 and
0.1 M potassium hydrogen phthalate, pH 4 (2 mins then 5 mins, respectively), at
an eluent flow rate of 1.4 m1 min"1 was required with a column length of 25 x 3
mm. A range of pH values for the mobile phase were analyzed. It was shown that
the higher concentration of the competitive ion in the mobile phase solution was
required to elute the inorganic arsenic anions. By lowering the pH the number of
charges associated with each species would have also been reduced (see pKa
values - Table 2-4) giving them less affinity for the stationary phase. Mobile
phase solutions of sulphate and phosphate also required a step gradient. However,
0.1 M potassium hydrogen phthalate is naturally at pH 4 and it was therefore
65
decided that this solution was the most convenient as no adjustment of pH was
required. The optimum conditions required could be accounted for by the smaller
particle size and greater surface area of the resin and it possessing a higher
capacity (1.5 meq m1"1) than that of the Hamilton resin (0.19 meq mr' 1
).
The Benson AX l 0 system was considered to be less practicable due to the step
gradient requirement, in concentration as well as pH, which necessitated a re
equilibration stage, thereby lengthening the analysis time. Calibration results with
standards also showed greater standard deviation than those obtained with the
Hamilton column. Further work was performed using the optimum conditions
derived from the Hamilton PRP XI 00 column system only.
During investigations for experimental conditions to achieve the required
separation of organic from inorganic arsenic species, the simultaneous separation
of selenium species in a similar manner was also considered. Using the
conditions applied for the separation of arsenic species (using either the Hamilton
PRP XlOO column with 10 mM potassium sulphate, pH 10.2 or the Benson AX
10 column with the step gradient elution of 0 M potassium hydrogen phthalate,
pH 7 to 0.1 M potassium hydrogen phthalate, pH 4, as the mobile phase) it was
possible to separate the three selenium species under investigation. A
chromatogram of this separation is shown in Figure 2-6.
66

"' --
t2000 2
1000ll
8000
8000
4000
2000
50 100 '" 200 250 300 350 •oo
Time (s)
Figure 2-6 Chromatogram of three selenium standards (250 j.lg r1) obtained using a Hamilton
PRP XIOO column, 100 x 3 mm dimensions, with a 10 mM K2S04 mobile phase at pH 10.2 demonstrating the separation of all species. Peak I, SeMet; Peak 2, Se!V; Peak 3, Se VI.
Both the SeiV and the Se VI have doubly negative charges at pH 10.2, existing as
the anions SeO{ and Seal-, respectively. SeMet, a zwitterion at neutral pH, will
possess a single negative charge in alkaline conditions. SeMet, possessing only
one negative charge would have the least affinity for the stationary phase and
consequently elute in the shortest time, which was found to be the case. The
separation of Se1v from Se VI, although they possess similar charges, would be
possible due to the differences in the hydrated radius of each and the resulting
charge density. Conditions to either oxidize Se1v or to reduce Se VI were not
attainable experimentally to induce eo-elution that would have simplified the
chromatograms.
67

The optimum conditions for simultaneous separation of arsenic and selenium
"' ij 0 u
species, with the best peak shape and shortest chromatographic run times were
found to be the use of a 100 x 3 mm column packed with Hamilton PRP X100
resin, 12-20 J.llil particle size, a 10 mM K2S04 mobile phase at pH 10.2 and an
eluent flow mte of 1.25 m1 min"1 with an injection loop volume of 250 J.Ll. The
arsenic species eluted within 4 mins and the selenium species eluted in less than 6
mins. A cbromatogmm demonstmting simultaneous separation of arsenic and
selenium compounds is shown in Figure 2-7.
Low toxicity High toxicity
111000
14000
12000
10000
8000
eooo
•ooo
2000
Time{s)
Figure 2-7 Chromatogram demonstrating simultaneous separation of four arsenic and three selenium species, into their relative toxicity classification, under the same experimental conditions - Hamilton PRP X I 00 { 100 x 3 mm) column, 10 mM K2S04 mobile phase at pH 102, eluent flow rate of 125 ml min"1
• Peaks: 1, AsBet and DMA; 2, Asm and Asv; 3, SeMet; 4, SeiV; 5, Se vt. This chromatogram clearly shows the separation of low toxicity from high toxicity
species obtained.
68

aS
~ ~ u
ll..
The linearity of results obtained using the column system was determined in the
range of 50 - 500 J.lg r 1 for each of the analytes. Graphs demonstrating the
linearity obtained for the selenium and arsenic species are shown in Figures 2-8
and 2-9, respectively. Correlation coefficients are shown on the graphs and are all
close to 1 demonstrating a linear relationship between concentration and signal
response in the form of peak area
800000
<400000
200000
0 100 200 300 400 500 800
Cone. in J.lg r 1
Figure 2-8 Graph demonstrating the linearity obtained for the selenium species on simultaneous separation together with arsenic species using a Hamihon PRP X lOO mini-column (lOO x 3 mm 1.0.). Error bars are derived from 95% confidence intervals where n=3.
69

e ''ti ll<
14DOOOOO·..--~~---------,-"~-~-------~----,
•ooooooo
~00000
:I
.4000000
2000000
••• Cone. in:l!g 1"1
Figure :Z:.? Graph demonstrating .the linearitY obtained :for the arsenic species oil simultaneous seParation together with selenium species iising a Hamilton PRI'XIOO mini,-cOiiiinn (lOO x J,mm
. I.D.).
23.2 Spedation of·CRMstand' real samples using LC-'lCP-MS
Having identified ·the opti.lpum chromatographic conditions followed by
assessment of .the lin~arity for the eluting species using commercially available
Standards; the methodology \Vas applied to that of n:al samples, ·Certified:
reference materials (l'ORT-2· and DORM.~2) were· included• for quality control
and,niethod validation purposes, ;rb,e•sarnple ofT0RT~21s kno:WnOto contain bOth
arsenic and' seleniuni as certified reference values are given for •both elements.
D0RM-2 was also chosen for analysis as certified values .are given for total
70
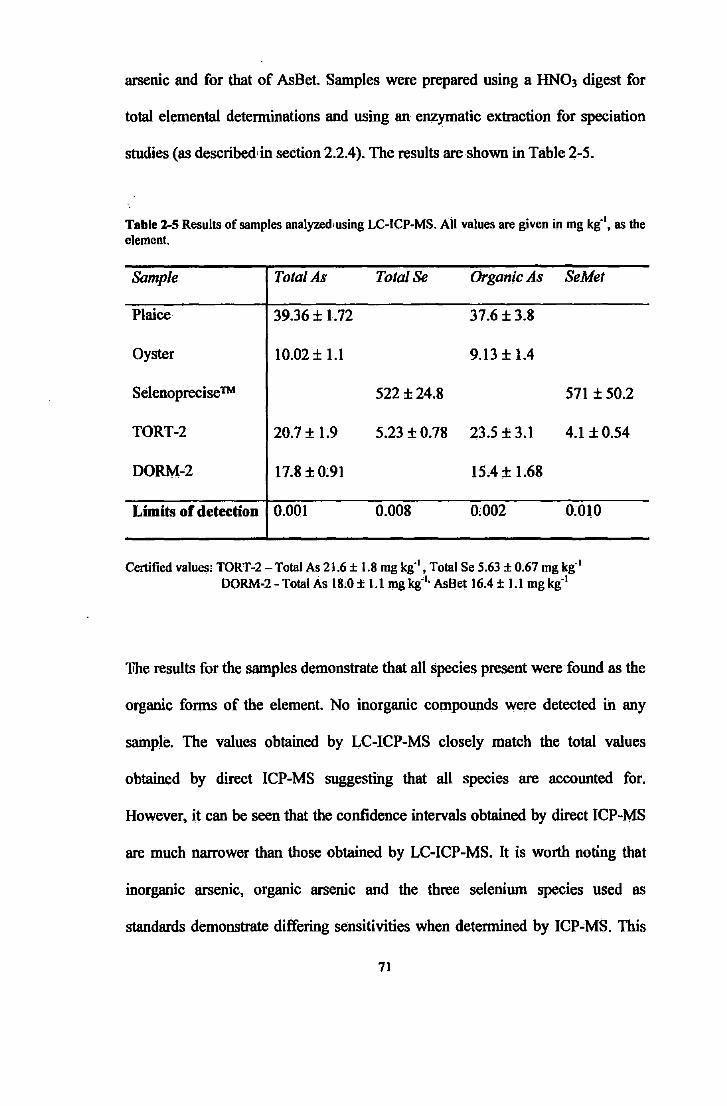
arsenic and for that of AsBet. Samples were prepared using a HN03 digest for
total elemental deterrninations and using an enzymatic extraction for speciation
studies (as described' in section 2.2.4). The results are shown in Table 2-5.
Table 2-5 Results of samples analyzed,using LC-ICP-MS. All values are given in mg kg'\ as the element.
Sample Total As Total Se Organic As SeMet
Plaice 39.36± 1.72 37.6 ± 3.8
Oyster 10.02 ± 1.1 9.13 ± 1.4
Selenoprecise ™ 522 ±24.8 571 ± 50.2
TORT-2 20.7 ± 1.9 5.23 ± 0.78 23.5 ± 3.1 4.1 ± 0.54
DORM-2 17.8 ± 0:91 15.4 ± 1.68
Limits of detection 0.001 0.008 0;002 0~010
Certified values: TORT-2- Total As 21.6 ± 1.8 mg kg·•, Total Se 5:63 ± 0.67 mg kg·• DORM-2- Total As 18:0 ± 1.1 mg kg"1
• AsBet 16;4 ± 1.1 mg kg'1
11he results for the samples demonstrate that all species present were found as the
organic forms of the element. No inorganic compounds were detected in any
sample. The values obtained by LC-ICP-MS closely match the total values
obtained by direct ICP-MS suggesting that all species are accounted for.
However, it can be seen that the confidence intervals obtained by direct ICP-:MS
are much narrower than those obtained by LC-ICP-MS. It is worth noting that
inorganic arsenic, organic arsenic and the three selenium species used as
standards demonstrate differing sensitivities when determined by ICP"MS. This
71

is evident when examining Figures 2-8 and 2-9. The gradient of the slopes is
different for all species although the same concentrations, based upon the
element, have been measured. As the system is used to separate organic from
inorganic arsenic and selenium species the fact that the detection is species
sensitive will affect calculations. Where there are two or more eo-eluting species,
or in a situation where an unidentified arsenic or selenium compound is present,
errors will inevitably occur as signal response varies for individual compounds.
The results obtained in this experiment, particularly for the organic arsenic
species where eo-elution of species occurs, appear to be satisfactory probably
because the samples analyzed predominantly contain AsBet and AsBet was used
as a standard for quantification. The standard addition technique was used for
quantification purposes as this is known to minimize the effects of non-spectral
interferences caused by the sample matrix. Inaccuracies in original weights of
samples and fluctuations in temperature and pressure on the column are other
factors that must be considered.
The use of CRMs provided useful data for method validation. A chromatogram of
the TORT-2 sample demonstrating the simultaneous separation of organic from
inorganic arsenic and selenium species is shown in Figure 2-10. Mass 75 was
monitored for arsenic as it is mono-isotopic, and mass 82 was monitored for
selenium as this isotope suffers the least from spectroscopic interferences. At
mass 75, for direct ICP-MS analysis, 4% N2 was added to reduce the
spectroscopic interference of ArCt+. However, this measure was not necessary
when using the mini-column as er ions are retained on the resin. This was
72

"' --ij 0 u
verified by the introduction of a 2% NaCl solution onto the column and no
subsequent peak being seen when recording at mass 75.
BOO
700
6110
SOD
400
300
200
100
0 0 100 200 300 400 500 800 700
Time(s)
Figure 2-10 Chromatogram of TORT-2 demonstrating the simultaneous separation of organic arsenic (mass 75) and SeMet (mass 82) using optimum mini-column LC-ICP-MS conditions.
73

2.4 .Conclusions
The implementation•of·lllulti-eleiiient detection using ICP~Ms .coupled to a low-
pressure miiti,..colwnn .liquid chromatograpliic system provided' a usefuir method
for the simultaneous :separati011 of organic .from inorganic ilrst;:nic ·and •Selenium
species. It was· suC(;essfully appiled for·the separaiion and1 detection of standards
as well as real samples that Were of environmentai :importance. As stated; the
method can be employed for initial; rapid species monitoring for 'samples .of
environmental and biological~importance ,poliution. If· high levels of• toxic species
·are found th_en· further, more rigorous analytical techniques can be used as·
required~
Low-pressure. :systems were obtained by the use of mini-colllmns with column
dimen.Sions no greater than 3 x •100. ,run. Conditions suitable for the
chromatographic separatio11 of inorganic from organic species utilizing the :pKa
values of .the species were investigated together with choice of competitive ion
eluent, itsrconcentratioil and flow rate. ICP-MS:wasrused al).the detector due•to its
multi-element detection ·capability, :although less expensive element-specific
detectors·can be used. Optimlim conditions to·.achieve simultaneous separaiion of
relatively toxic ·from relatively non"toxic arsenic and selenium species were
found~ to be the use of a Hamilton PRP XlQO, 12-20 J.1111, ·resin rpacked in a
column of.lOO x 3 mm I.D. The eluent.competitive counter ion was K2S04 at 10 ' .
mM-concentration andrpH lO.i 'The optimum;eluent flow rate·was 1.25 ml:min·1•
74

An injection volume of 100 J.1l was found to provide optimum sample loading
onto the column.
Under the optimum conditions employed, the results obtained for the CRMs
DORM-2 and TORT-2, the selenoprecise® and two marine samples of plaice and
oyster compare favourably with the expected and reference values. Limits of
detection were determined to be in the range of 2- 10 J.tg kg·' for organic and
inorganic arsenic and selenium species.
The validity of this simple procedure for screening biota samples in terms of their
arsenic and selenium toxicity was, therefore, demonstrated. This rapid screening
technique allows a suitable estimate of the implications to health to be made for
samples containing arsenic and selenium without resorting to a full speciation
procedure.
75

Chapter three
76

3 Feasibility study for the speciation of arsenic and selenium in
candidate reference materials
3.1 Introduction
Speciation analysis focuses on the clear identification of specific chemical
species or forms of an element and its quantification 140• Sample preparation and
extraction techniques for the analyte of interest together with hyphenated
techniques commonly used for speciation separation and detection will all
possess their own sources of errors. Measurements by laboratories, even when
applying the same method may differ significantly from each other 141• However,
results are only of use where they are considered to be accurate and precise.
Reliable measurements are vital for quality control and assurance in areas of
trade, agriculture, food and nutrition science, health, environment, toxicological
studies and in legal requirements for monitoring and consumer protection 142•
Traceability and comparability of measurements have long been acknowledged as
holding an important place in analytical science 143• Results can only be accurate
and comparable worldwide if they are traceable. An unbroken chain of
calibrations connecting the measurement process to fundamental units achieves
traceability of a measurement 144• It must be demonstrable that no loss or
contamination has occurred and that chemical species have been preserved 145• It
is possible to verify analytical procedures in a simple manner by the use of
certified reference materials and by the use of mass balance calculations. 77

Analysts involved in method development require suitable validation procedures,
which ideally involves the use of a CRM of the same or similar matrix type and
similar analyte concentration to that of the sample. Reference materials for
arsenic and selenium speciation are very limited. More are urgently required to
expand the base of CRM sample matrices available to analysts, in order to meet
the growing demands of society 143•
Certified reference materials are costly to produce and therefore feasibility
studies are generally undertaken to determine whether a 'candidate' material will
produce a viable CRM. A reference material suitable for control purposes will
usually be a 'real world' material so that it behaves as similarly as possible to the
samples being measured with the method being controlled. Preference is given to
materials where there are naturally occurring higher levels of particular species or
to naturally contaminated materials rather than having materials spiked with the
substance of interest during the preparation stage. The requirements of a material
suitable for entering into a feasibility study depends on a number of criteria: the
analytes of interest need to be extractable and in concentrations that are
representative of the sample type; the prepared material must be homogenous and
stable in storage conditions, i.e. absence of degradation of species over time in a
range of acceptable moisture, light and temperature conditions 146
.
The work presented here comprises part of a feasibility study into the production
and certification of six new reference materials, analyzed for species
concentrations of the element arsenic (in chicken, fish, rice and soil) and
78
selenium (in wheat and yeast). The project was funded by the European
Community under the 'Competitive and Sustainable Growth' programme (1998-
2002) 147.
The project was set out in three stages. The role of the University of Plymouth in
the first stage of this project was to conduct a survey on a variety of fish types to
identify a particular sample that would be suitable as a candidate reference
material. The purpose of the survey was to determine total arsenic concentrations
in the fish and the number of arsenic-containing species present in measurable
quantities with the best extraction efficiency obtainable. The plaice sample
appeared to be most fit for purpose and a quantity of this material was obtained
and forwarded to the Institute for Reference Materials and Measurements
(IRMM, Geel, Belgium). Here, the materials underwent sample preparation
processes to produce 100 bottles of homogenous candidate reference material.
These were dispatched back to the labomtory for homogeneity and stability
studies. Each of the six participating labomtories in this part of the feasibility
study underwent a similar process for their chosen material.
The second stage of the study encompassed the homogeneity and stability studies
undertaken by each partner for their chosen candidate material. Following this,
each partner labomtory sent two bottles of their candidate material to all other
participating labomtories. This allowed the third and final stage of the project to
be carried out which involved the inter-laboratory comparison of all sample types
for the species of interest. There were nine participating laboratories for this stage
79

of analysis 147• The data obtained from this stage of the project was used to
calculate the uncertainties in the measurements obtained and hence the suitability
of the material to go forward for full certification. Ideally, a CRM should possess
a narrow confidence range for a specified substance with no, or minimal,
opemtionally defined limits 144•
3.2 Preliminary survey of a variety of possible fiSh types with subsequent
homogeneity and stability studies using plaice
3.2.1 Instrumentation
ICP-MS measurements were performed usmg a VG Plasmaquad (2+, TJA
Solutions, Winsford, Cheshire, UK), using the conditions described in Table 3-1.
A Perkin Elmer series 410 high-pressure pump (Perkin Elmer, CT, USA) was
used for control of the cbromatogmphic eluent flow mte. A Rheodyne 7125
injection valve (Rheodyne, CA, USA) with a 20 J.d loop volume was used for
column loading of sample digests. pH readings were taken using a 3010 pH meter
(Jenway, Ltd., Essex, UK).
80

Table 3-l ICP-MS operating conditions used for the detennination of total and arsenic species in fish sample extracts.
ICP-MS Plasma Quad 2+
Concentric pneumatic nebulizer (Meinhard)
Water-cooled cyclonic spray chamber- 50 ml vol
Fassel torch- 1.5 mm bore injector
Parameters Argon plasma - 4% N2 added for direct total As determination
to the nebulizer gas flow
Nebulizer flow rate
Coolant gas flow rate
Auxiliary gas flow rate
Forward power
Dwell time
0.8 1 min-I
13.0 1 min"1
0.8 1 min"1
1350W
500ms
Arsenic was measured using rnlz 75. 4% (v/v) N2, for the reduction of ArCl+
interferences on rnlz 75, was added. via a Signal series 850 gas blender (Signal,
Camberley, Surrey) to the nebulizer gas flow.
Hydride generation atomic absorption spectroscopy (HG-AAS) was performed
using a continuous flow hydride generator (PS Analytical, Sevenoaks, Kent, UK)
and a PYE Unicam SP9 AAS instrument (Philips Scientific, Cambridge, UK).
Operating conditions are shown in Table 3-2.
81
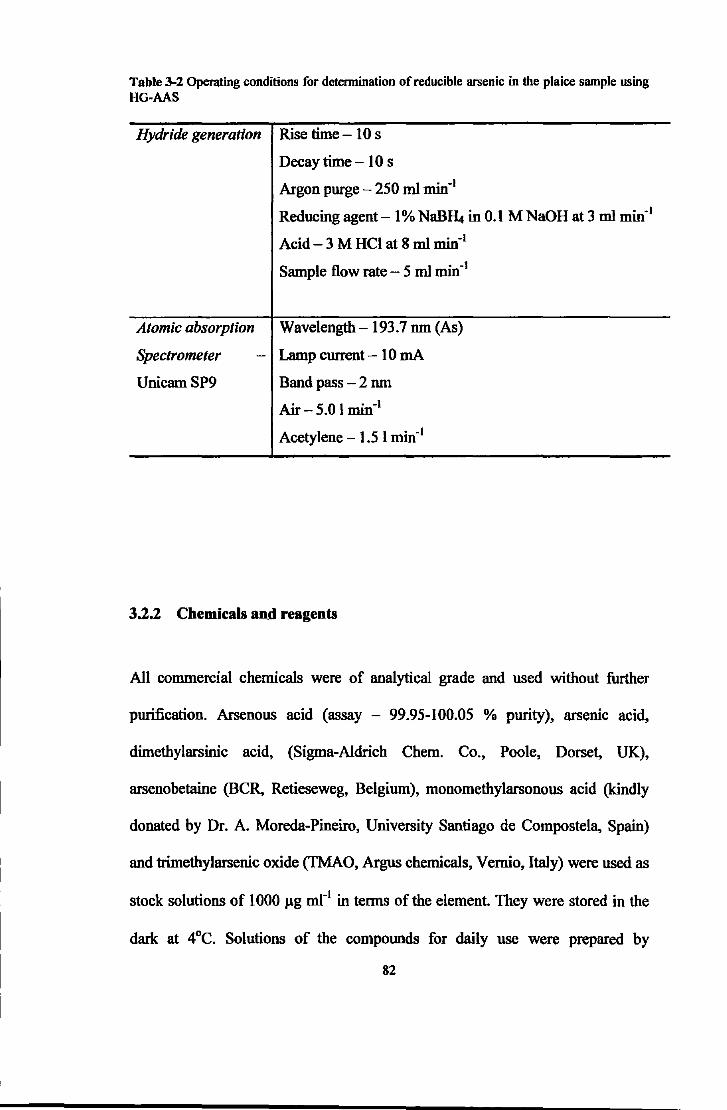
Table 3-2 Operating conditions for determination of reducible arsenic in the plaice sample using HG-AAS
Hydride generation Rise time - I 0 s
Decay time- I 0 s
Atomic absorption
Spectrometer
UnicamSP9
Argon purge- 250 ml min"1
Reducing agent- I% NaBR$ in O.I M NaOH at 3 ml min"1
Acid- 3 M HCI at 8 ml min"1
Sample flow rate- 5 mJ min"1
Wavelength-I93.7 run (As)
- Lamp current- I 0 mA
Band pass - 2 run
Air- 5.0 I min"1
Acetylene- 1.5 I min"1
3.2.2 Chemicals and reagents
All commercial chemicals were of analytical grade and used without further
purification. Arsenous acid (assay - 99.95-100.05 % purity), arsenic acid,
dimethylarsinic acid, (Sigma-Aldrich Chem. Co., Poole, Dorset, UK),
arsenobetaine (BCR, Retieseweg, Belgium), monomethylarsonous acid (kindly
donated by Dr. A. Moreda-Pineiro, University Santiago de Compostela, Spain)
and trimethylarsenic oxide (TMAO, Argus chemicals, Vernio, Italy) were used as
stock solutions of 1000 J.lg ml"1 in terms of the element. They were stored in the
dark at 4°C. Solutions of the compounds for daily use were prepared by
82

appropriate dilution from the stock solutions using Milli-Q water (Milli-pore,
Bedford, MA, USA). The CRM used in the preliminary study was TORT-2
(National Research Council). Eluent solutions were prepared using solid Na2S04,
liquid pyridine, 0.91 sp. gr. NH3 solution and 98% HCOOH (Sigma-Aldrich).
Samples for HG-AAS were prepared using L-cysteine (Sigma-Aldrich) and 69%
HN03.
All plastic/glassware was soaked in HN03 (10%, v/v) for a minimum of24 hours
and rinsed thoroughly with de-ionized water prior to use.
3.2.3 Chromatographic conditions for the determination of arsenic species
All mobile phase solutions were degassed by ultra-sonication for 15 rnins prior to
use. Anion-exchange HPLC, for the speciation of arsenic, was carried out using
a column (250 x 4.6 mm) packed with Hamilton PRPXlOO 10 !liD resin
(Phenomenex, UK) with a guard column (50 x 4.6 mm) of the same material. The
mobile phase employed a step gradient elution using a solution of 5 mM and 50
mM Na2S04 at pH 10.2, adjusted with NH3 solution (0.9lsp. gr.). The
programme for elution is given in Table 3-3. An eluent flow rate of 1.2 ml min-1
was used throughout.
83

Table 3-3 Elution programme for anion-exchange HPLC of arsenic species using a Hamilton PRP X lOO column.
Concentration 0 -5 m ins 5-9mins 9-15 mins
5 mM Na2S04 (adjusted to pH 10.2) 100% 0% 100%
50mM Na2S04 (adjusted to pH 10.2) 0% 100% 0%
Cation-exchange HPLC was carried out using a Partisil SCX 10 column (250 x
4.6 mm, Phenomenex) packed with a silica gel of 10 J.lDl particle size with a
guard column (50 x 4.6 mm) of the same material. The mobile phase employed
an isocmtic elution using 20 mM pyridine solution adjusted to pH 3 with
HCOOH (98%, v/v) 148 with an eluent flow mte of 1.2 ml min"1 used throughout.
3.2.4 Mass balance calculation
To obtain data for mass balance calculations determination of total element
concentmtions in the sample, a sum of the species in the extmcts together with
total element concentmtions in any residues must be accounted for. A flow
diagmm of mass balance analysis can be seen in Figure 3-1.
84

Acid digest
Sample 'total' element concentrations
1 Extraction process ---~~Residue ---!~~·total' element in residue
l Extract ------------+ 'total' element in extract
1 Speciation -------------;~sum of elemental species
Figure J,.l FloW diagram for acquisition of mass balance data
85

3.2.5 Sample preparation procedures for determination using ICP-MS and
HPLC-ICP-MS
Eight fish samples (plaice, monk, hake, haddock, cod. coley, pollack and whiting)
were purchased locally from the Plymouth fish market where they were
beheaded. gutted and filleted. The fish were further prepared in the laboratory by
removing the skin and ensuring that all bony material was removed. They were
then cut into small pieces and freeze dried (Edwards Super Modulyo, Edwards
High Vacuum, Crawley, Sussex, UK) at -60°C and 1 x 10⁻² Torr (or until a stable
pressure was maintained) for approximately 48 hours, at which point a constant
weight had been achieved. The dried fish were blended gently in an Optiblend
2000 electrical blender (Moulinex, France) until fine powder was obtained. A
microwave digestion for total arsenic determination and an enzymolysis
extraction for the determination of arsenic species were both performed using the
following methods,
HNOill202 digestion for 'total' arsenic concentrations in fiSh samples and
residues
Microwave bombs were pre-cleaned using 3 ml69% v/v HN03 (Aristar, Fisons)
on medium power in a Perfecto 800 W microwave oven (DeLonghi, Italy) for 2
mins. Samples of approximately 0.5 g (all fish types and TORT-2 as CRM) were
accurately weighed into the bombs and 3 ml HN03 (69% v/v) together with 1 ml
H20 2 (37% v/v) were added 132• The bombs were loosely capped and left
overnight to allow easily oxidizable material to be destroyed. After predigestion,
86

the bombs were gently swirled, sealed tightly and microwaved on medium power
for I - 2 mins, or until the digest was a clear colour with no residue (indicating a
completed digest). The samples were transferred quantitatively into volumetric
flasks and made up to volume with deionized water. The digested samples and
matrix matched standards were spiked with indium to give a fmal concentration
of I 00 f.lg r1 In, which acted as an internal standard prior to analysis by N2-ICP
MS using the conditions described in Table 3-l.
Enzymolysis Extraction of Arsenic Species
An enzymatic extraction procedure adopted by Branch et al. 132 was employed.
Samples (all fish types and TORT-2 as the CRM) of approximately l.O g of tissue
were accurately weighed together with 0.1 g trypsin (Sigma-Aldrich, Dorset, UK)
and approximately 20 ml NRsHC03 (0.1 M, pH 8) buffer. The solutions were
homogenized in a 'Potter' homogenizer, transferred to polyethylene centrifuge
tubes and placed in a shaking water bath at 31'C for a minimum of 4 hours. The
samples were centrifuged at 2500 rpm for 20 min, the supematant transferred
quantitatively to volumetric flasks and made up to volume with the Nl4HC03
buffer. The samples and standards were spiked with caesium to give a final
concentration of lOO f.lg r1 Cs, which acted as an internal standard prior to
analysis by direct ICP-MS using the conditions described in Table 3-l.
Determination of arsenic species was carried out using the chromatographic
conditions described in Section 3.2.3.
87

Mass ,balance
To obtain further mass balance:data, total arsenic concentrations were determined
in extract solutions and the residues from the trypsin extraction procedure. The
residues were digested using the HN03 digestion method described above.
3.2.6 Sample p .. eparation procedures for determination of reducible
arsenic in plaice samples using HG-AAS
Enzymatic sample digest solutions, prepared as above, were used for the
determination of reducible arsenic species in the plaice samples using HG-AAS.
Sample volumes of 25 ml were added to 4 ml of 8.75% L-cysteine in 50 ml
volumetric flasks and made up to volume with 0.05 M HN03 149
• Standards and
blanks were prepared using the same concentrations of L-cysteine and HN03.
The solutions were allowed to stand for approximately 1 hour to allow complete
pre-reduction of any arsenate to arsenite by L-cysteine prior to analysis using the
conditions described in Table 3-2.
3.2. 7 Preparation of plaice samples for homogeneity and stability studies
The most suitable fish type, plaice, was taken forward for the homogeneity and
stability studies, after sample processing by IRMM as shown in Figure 3-2. It was
analyzed for total element concentrations and speciation of arsenic compounds
according to the microwave and enzymolysis digestion techniques described in
Section 3.2.5.
88

Collection and slicing of 20 kg fish
[~==J=a=w=c=nm==bin='=g=an=d=&e==e=~==~==in=g========~l [ Ball milling - I 00 g I Teflon bowl ]
Sieving <125 ~- ftaction > 125 ~ to
Homogenisation- 'Turbula' mixing
Sampling and storage of 115 units of 20 g
[ Analytical control - particle size l Homogeneity and stability studies
University of Plymouth
IRMM,Geel
IRMM,Geel
IRMM,Geel
University of Plymouth
Figure 3-2 Flowchart for the preparation of fish samples by the University of Plymouth and IRMM.
89

When carrying out the homogeneity studies sample weights of 0.25, 0.5 and 1.0 g
were taken. To ensure complete digestion of all the material the amount of
trypsin added was varied in a ratio of 10: 1 for sample:trypsin, which is
considered to be the optimum ratio 93• The stability studies performed were based
on the results from 1 g sample weights using HNDJ microwave and enzymolysis
digestion techniques. The stability of total arsenic and AsBet was determined
under conditions of temperature and time, ranging from 4 to 40°C with material
at -20°C as a reference and 0 to 7 months, respectively.
90

3.3 Results and discussion
3.3.1 Preliminary fash survey
The preliminary survey was carried out on a number of fish types as shown in
Table 3-4. The enzyme extraction efficiency given in the experimental data
varied from 37-98%. This may be explained in terms of the overall extraction
efficiency for arsenic from various types of fish which possess different lipophilic
properties 132• Trypsin, a protease, attacks proteins and can destroy cell walls
whereas lipase may be the preferred enzyme for releasing arsenicals that may be
lipid-bound. A previous inter-laboratory exercise for the certification of arsenic
species in tuna fish ISO reported extraction efficiencies (the sum of arsenic in
various chemical forms compared to total arsenic determination) ranging from 50
to 90% depending on the extraction method used (e.g. MeOH/H20, H20,
MeOHJCH3Cl, trypsin, etc.). Trypsin appeared to be the most efficient in this
study ISO and was subsequently used here. The trypsin extraction proved most
successful for plaice and whiting giving 98 and 96% efficiencies, respectively.
However, the deficit of arsenic following enzymatic extraction compared with the
total arsenic values obtained for the other fish in the survey should present itself
in the residue. This was not the case for all the fish samples and was most
noticeable for hake, haddock and cod. The reasons for this are not clear but may
include instrumental matrix effects and loss of analyte to container surfaces.
91

Table J-4Arsenic speciation for all fish samples. Results given as mg kg"1 in tenns of the element at 95 % confidence interval. n = 3
Total As- Toto/As As Bet Sample Total As- Inorganic Extraction
HN01 digest residue digest
As efficiency
Plaice 39.5 ± 1.7 38.7 ± 1.9 0.78± 0.034 38.7 ± 2.7 1.95 ± 0.21 98%
Monk 48.1 ± 2.4 32.6±2.0 3.33 ± 0.12 12.6± 4.9 1.33 ± 0.19 68%
Hake 17.5 ± 27 6.6± 1.5 1.83 ± 0.15 7.6± 1.9 1.09 ± 0.18 37%
Haddock 34.6±2.6 22.1 ± 1.7 420±0.28 21.7 ±0.8 1.54 ± 0.13 65%
Cod 122.1 ± 4.3 92.3 ± 6.1 5.36 ± 0.22 91.0 ± 0.9 1.46 ± 0.18 75%
Coley 9.4±0.7 7.9±0.9 1.09 ± 0.053 8.7 ± 0.5 0.91 ± 0.11 85%
Pollack 17.1 ± 0.7 10.7 ± 1.3 1.70 ± 0.19 8.3 ± 1.4 1.48 ± 1.9 63%
Whiting 11.9 ± 0.7 11.6 ± 0.4 0.42 ± 0.014 11.5 ± 2.0 1.23 ± 0.11 96%
TORT -2' 21.8 ± 0.8 17.8 ± 1.1 2.41 ± 0.087 16.6 ± 1.2 < LOD 80%
'certified value of TORT -2 = 21.6 ± 1.8 mg kg"1 for 'total" arsenic +'digest" refers to trypsin enzymolysis digestion solutions
92

The purpose of this survey was to screen for the most suitable material to go
forward into a feasibility study for the production of a CRM. As outlined in the
introduction, an ideal candidate reference material would contain a number of
species at easily extractable and measurable concentrations. Work by Francesconi
and Edmonds 14 suggests that while AsBet is the major form of arsenic found in
marine animals with inorganic forms constituting < 2% of the total, other
organoarsenic compounds may be present These most important species include
methylated forms such as MMA and DMA (which are known to be formed in the
detoxification process 14), tetramethylarsonium ion (TeMA), arsenocholine
(AsChol) and trimethylarsine oxide (TMAO) all of which have been reported in
various types of marine fauna AsChol is thought to be a precursor of AsBet,
although the metabolic pathway of AsBet has yet to be fully elucidated. TeMA is
usually present as a degradation product caused by microbial breakdown of
AsBet 151 and its presence has been reported in catfish 152• It is conjectured to be
an intermediate ofthe methylation of arsenate. TMAO is also considered to be an
important organoarsenical accounting for up to 50% of the total arsenic in some
marine fauna for example, the sea anemone, Parasicyonis actinostoloides m.The
results for the fish samples under investigation in this survey, shown in Table 3-4,
show that AsBet was the predominant form of organic arsenic found.
Chromatograms of the arsenic standards and plaice sample using anion-exchange
HPLC-ICP-MS are shown in Figures 3-3 and 3-4. Although Francesconi and
Edmond's work 14 suggests that a number of organic arsenic species exist in
nature and is supported in a review by Cullen and Reimer 10 summarizing this,
the results are
93

"' --~ 8
"' ~ 8
50000 3
45000
40000 I 36000
soooo
215000
20000 2 4
15000
10000
5000
0 0 100 200 300 400 500 000 700 000
Time(s)
Figure 3-3 Chromatogram obtained using anion-exchange HPLC-ICP-MS of arsenic standards at 250 J.lg 1"1, l=AsBet; 2= DMA; 3=MMA; 4=Asv. Conditions as shown in Table 3-3.
45000
40000
35000
30000
25000
20000
15000
10000
5000 2
100 200 300 400 000 000 700 000 ••• Time(s)
1000
1000
Figure 3-4 Chromatogram of plaice using anion-exchange HPLC-ICP-MS, using conditions shown in Table 3-3. Peaks: 1, AsBet; 2, Asv/ artifact
94

comparable to those reported by other workers JJ2; 148 where AsBet is the major
compound found in fish.
Identification of species based on matching chromatographic peak retention times
with that of known standards can lead to ambiguity in peak assignment due to eo
elution of chemically related compounds. liMAO is an arsenical that can be
.present in significant amounts in seafood. TMAO, being a cation, is likely to eo
elute with AsBet under the anion exchange chromatographic conditions
employed. Experimental analysis with the use of standards showed this to be the
case. To minimize the risk of misidentification of TMAO and AsBet, a cation
exchange chromatographic system was employed using a Partisil SCX 10 column
with a pyridine mobile phase (see Section 3.2.3). Figures 3-5 and 3-6 provided
experimental evidence that the major peak in the plaice sample was due to the
presence of AsBet and not TMAO. There is also no evidence· of an early eluting
peak in Figure 3-6, which may be caused by Cl- ions indicating the lack of
spectroscopic interference from this ion.
No simple methylated fonns of arsenic were found in the fish studied in this
report although small amounts of inorganic.arsenic were found to be present. It is
thought that in the presence of amines, inorganic arsenic is displaced from the
detoxification pathways.ofmethylation 154, reducing the number of species likely
to be found. However, the levels of amines in white fish are generally low and
methylated species have been detected by other workers 112•
155•
95

"' --~ 0 u
UJ --~ ::s 0 u
8000
2
1 5000
3 4000
3000
2000
1000
0 0 tOO 200 300 ••• . .. • •• , ..
Time (s)
Figure 3-5 Chromatogram obtained using cation-exchange HPLC-ICP-MS, using a Partisil SCX 10 column with 20 mM pyridine at pH 3, of arsenic standards at 250 J!g r' of: I,DMA; 2, AsBet; 3,TMAO.
1
20000
11000
1111000
14000
12000
10000
1000
1000
41000
....
Time (s)
Figure 3-6 Chromatogram of plaice sample using cation-exchange HPLC-ICP-MS, using a Partisil SCX 10 column and eluent of20 mM pyridine, pH 3. Peak l = AsBet.
96

The amount of inorganic As found was unusually high when compared with other
research 156• Inorganic arsenic is not commonly found at levels higher than
approximately 6% of that of the total arsenic determined although levels as high
as 25% have been recorded for some fish 132• It is almost always found as Asv as
opposed to As111, as was the case in this study. This species may be considered, in
the light of the predominance of Asv in seawater, to be relatively abundant due to
prevailing redox conditions 157• All the fish in this survey were found to have
similar levels of As v regardless of the total levels of As found. This appears to be
an anomalous finding when taking into account work published by other
researchers. Their work suggests that levels of inorganic arsenic in marine
animals will vary according to the type of animal and its habitat 158•
Although all the fish in this study were caught locally and therefore subjected to
similar environmental pollution levels, it is possible that the similar levels of As v
found may be accounted for by contamination of samples prior to purchase and
during preparation. It is important to note that no contamination was seen in the
blank samples. Also, results from the CRM, Tort-2 (lobster hepatopancreas),
showed that approximately 90% of the extracted As was present as AsBet within
the limits of experimental error and no inorganic arsenic was detected; this
sample having gone through an identical analytical procedure after the sample
preparation stage suggests that contamination post-preparation of samples is
unlikely to be the cause for the presence of As v in the other fish samples. A
survey using HG-AAS, with an experimental LOD of 11.3 Jlg rl, did not detect
97

any reducible forms of arsenic, confirming the absence of inorganic:arsenic forms
in the fish samples.
The preliminary study of all fish types was carried out in order to identify one
that would be appropriate as a candidate reference material providing a suitably
high extraction efficiency for arsenic species in measurable quantities. It was
decided that plaice met the criteria of merit based upon it having a relatively high
level of arsenic combined with the best enzymatic extraction efficiency seen for
all fish types under investigation. The processed plaice samples were, therefore,
carried forward to undergo homogeneity and stability studies.
3.3.2 Homogeneity and stability studies
Having identified plaice as being the most suitable fish to go forward for a
feasibility study 20 kg of the filleted fish was bought from the Plymouth fish
market, frozen and sent to the IRMM for preparation. A flowchart for the
preparation of the fish can be seen in Figure 3-2. Homogeneity and stability
studies were carried out using instrumental conditions, chemicals and
chromatographic conditions as previously described in Section 3.2.1., 3.2.2 and
3.2.3.
The risk of in-homogeneity exists for any material prepared in any manner. There
are two types of homogeneity that are of importance. The first is the within-bottle
homogeneity, which dictates the minimum sample intake for which the
98
established· uncertainty remains valid, The second is the between-bottle (between
unit) homogeneity. To establish within~bottle homogeneity it is advantageous to
take small sample sizes so that between portion effects can be quantified. For
between-bottle homogeneity tests it is more·practicable to take an optimal sample
size to minimize analytical variation 159. The homogeneity of the plaice was
determined using measurements of total arsenic and AsBet. The most relevant
quality when analyzing for in-homogeneity is the repeatability of the method
rather than the accuracy. A prerequisite for this is that all samples are measured
on the same day, with the same instrument and by the same operator.
The plaice samples were prepared using the digestion methods described in
section 3.2.5. Sample weights taken for homogeneity studies were in the range of
0.25 - 1.0 g. Within-unit in-homogeneity is more readily detected with lower
sample sizes. The results for within-bottle homogeneity comprised 5 sub-samples
from 2 bottles at weights of 0.25 g, 0.5 g and 1.0 g (30 samples in total). For
between-bottle homogeneity samples of 0.5 g and 1.0 g were taken in triplicate
from I 0 bottles. Using STATGRAPHICS Plus 2.1, the ANOV A table
decomposed the variance of the two components, a between-group component
and a within-group component. The F-ratio is a ratio of the between-group
estimate to the within-group estimate. Since the p-value of the F -test was greater
than 0.05 there was not a significant difference between the means of the
variables at the 95% confidence interval. This confirmed the absence of
measurable in-homogeneity. The results are presented in table 3-5. The lowest
sample size tested for homogeneity was 0.25 g and this must be stipulated, should
99

the material go forward for full certification. This will become the lowest
recommended sample size for analysis, as homogeneity cannot be guaranteed
below this amount
Table 3-SWithin and between - bottle homogeneity for total As and AsBet in plaice
Within bottle - CVV.AJ Within bottle - CVV.Ai Between bottle - CVV.AJ
Bottle 1 Bottle 2 0.5gll.Og
Total As 2.4 2.3 1.7 I 1.9
F-ratio 2.3 0.28 1.1 I 1.4
p-value 0.14 0.76 0.39 I 0.25
TotalAsBet 2.5 2.1 2.0 I 1.7
F-ratio 2.2 0.92 1.7 I 1.7
p-value 0.16 0.43 0.17 I 0.15
The purpose of stability studies is to check that the value of a certified property
does not change significantly during transportation, storage conditions or over the
time scale in which the CRM is likely to be used. In order to detect stability
problems it is usual to check the material using small batches prepared in the
same manner as is intended for the actual CRM and test over a time scale, usually
of up to three years. However, in feasibility studies it is not practicable to wait
this length of time before proceeding with full certification exercises. Therefore,
if no significant change in the material is detected by stability studies carried out
100

for an initial six-month period then full certification may be approved. Whilst
assessing the material for stability over time it is also necessary to assess the
stability of the material in likely storage conditions. Conditions that are usually
regarded as having the potential to cause instability in biological materials are
light, temperature and the presence of moisture leading to degradation of the
material by microbial action. It is, therefore, necessary to design a study that tests
the material over time and in various storage conditions, taking into account
temperature, exposure to light and moisture content. In this study, material was
stored in hermetically sealed dark brown glass bottles negating the need to study
effects of light degradation.
The samples were assessed for an initial period of 0 - 7 months, at intervals of
two weeks for the first two months and monthly for the last five. Any degradation
was thought most likely to occur within the first few weeks. The time frame
reflects that assumption with more frequent assessment in the initial period in
order to provide a fairly accurate life-time of the material should any degradation
become apparent. The studies were carried out at three temperatures: + 4°C, +
20°C and+ 40°C with samples stored at- 20°C serving as a reference 144• These
temperatures were chosen as it was thought that microbial action (most critical
temperature being 40°C) and thermal degradation would be the most likely
mechanisms for alteration and destabilization of the biological material.
The stability study was designed to test for total arsenic and AsBet content.
Spiking experiments with standard species were performed in order to identify
lOt
potential losses or transformation of species during the study. Moisture content
was determined by placing pre-weighed material in an oven at 85°C until a stable
weight was obtained. All data reported was corrected for moisture content The
'total' arsenic content was measured directly by ICP-MS and the determination of
AsBet (this being the major species identified in the plaice) was performed by
anion exchange HPLC-ICP-MS. Three sub-samples were taken at each
temperature.
The results for the stability of arsenic are given in graphic and tabular form in
Figure 3-7 and Table 3-6. They were calculated from the data obtained using the
standard equations of 160:
RT=XT I X_w0c UT= {(CVl +CV -20°C
2)
112• RT} I lOO
RTrepresents the mean XT of three replicates at temperature T (+4°C, +20°C and
+40°C)divided by the mean X -2o0c of the three replicates at -20°C.UT represents
the uncertainty on RT. CV is the coefficient of variance. In the case of ideal
stability the ratios RT should be 1.0. However, in practice, there will be random
variations due to the variation on the measurement. The results obtained
demonstrate this. However, in all cases the expected value of 1.0 is obtained
within RT ±UT and on this basis it can be concluded that there is no instability
over 7 months of time or at temperatures of +4°C, +20°C or +40°C.
102

1.3
1.2
1.1
1.0
0.9
0.8
0.7
l ~ ~ ~ Id:
~ ~ r :1: [1.
0 2 3 4 5 6 7
Time (months)
Figure 3-7 Stabili~ study of 'total' As in plaice at temperatures set at 4°C, 20 °C and 40 °C (baseline set at -20 C values) to identify any changes over time.
103
E . .
B

Table 3-6 Stability stud!, of total As in plaice. Values of RT % UT over a 7-month period at temperatures of 4°C, 20 C and 40 °C (baseline set at -20 °C values).
Time in months Temp C Rr±Ur
As 0.5 0.980 ± 0.02
1 1.032 ± 0.04
1.5 0.981 ± 0.02
2 +4 1.032 ± 0.03
3 1.010 ± 0.02
4 1.013 ± 0.02
5 1.018 ± 0.02
7 1.003 ± 0.03
0.5 0.992±0.02
I 1.032 ± 0.04
1.5 0.998 ± 0.02
2 +20 1.031 ± 0.04
3 1.021 ± 0.03
4 1.017 ± 0.02
5 1.006 ± 0.01
7 1.009 ± 0.01
0.5 0.974 ± 0.03
1 1.030 ± 0.04
1.5 0.985 ± 0.03
2 +40 1.038 ± 0.04
3 1.020 ± 0.03
4 1.005 ± 0.04
5 0.998 ± 0.01
7 1.006 ± 0.02
104

Stability studies were also carried out on AsBet in plaice in a similar manner to
that of the stability studies for total arsenic. The results are summarized in Figure
3-8 and Table 3-7. Stability is confirmed in that the value of 1.0 is obtained
within the uncertainty range. The uncertainty obtained for total arsenic is, in
general, less than that obtained for AsBel This may be accounted for by greater
precision in calculations on data obtained by direct ICP-MS measurement
compared with the data collected for AsBet which was via HPLC-ICP-MS.
1.3
1.2
1.1
1 ~ J +
1.0
.L
0.9
0.8
0.7 0 2 3 4 5 6 7 6
Time (months)
Figure 3-8 Stability study of AsBet in plaice at temperatures set at 4°C, 20 °C and 40 °C (baseline set at -20 °C values) to identity any changes over time.
lOS
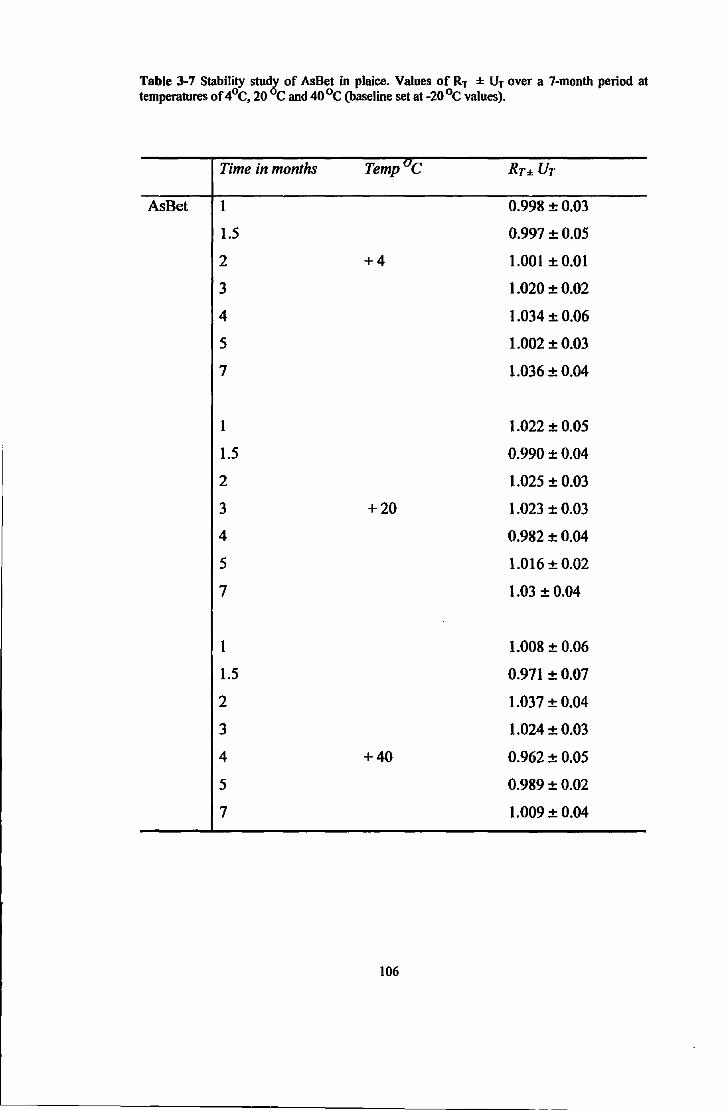
Table 3-7 Stability studJ: of AsBet in plaice. Values of Rr ± U1 over a 7-montb period at temperatures of 4°C, 20 C and 40°C (baseline set at-20°C values).
Time in months Temp C Rr±Ur
As Bet 1 0.998 ±0.03
1.5 0.997 ± 0.05
2 +4 1.001 ± 0.01
3 1.020±0.02
4 1.034 ±0.06
5 1.002 ±0.03
7 1.036 ± 0.04
I 1.022 ± 0.05
1.5 0.990±0.04
2 1.025 ± 0.03
3 +20 1.023 ± 0.03
4 0.982 ±0.04
5 1.016 ± 0.02
7 1.03 ± 0.04
1 1.008 ± 0.06
1.5 0.971 ± 0.07
2 1.037 ± 0.04
3 1.024 ±0.03
4 +40 0.962 ± 0.05
5 0.989 ± 0.02
7 1.009 ± 0.04
106

The plaice material was found to meet the criteria required for a sample to go
forward as part of an inter-laboratory arsenic speciation comparison for the
production of a series of certified reference materials.
3.4 Inter-laboratory comparison of arsenic and selenium species in all
candidate reference materials
3.4.1 Instrumentation
ICP-MS measurements were performed using a VG Plasmaquad (2+, TJA
Solutions, Winsford, Cheshire, UK), using the conditions described in Table 3-1,
Section 3.2.1. Isotopes of mass 75 for arsenic and 77, 78 and 82 for selenium
were used for recording measurements. A Perkin Elmer series 410 high pressure
pump (Perkin Elmer, CT, USA) was used for control of eluent flow rates. A
Rheodyne 7125 injection valve (Rheodyne, CA, USA) was used for column
loading of sample digests. pH readings were taken using a 3010 pH meter
(Jenway, Ltd., Essex, UK). Chemical and Reagents
3.4.2 Chemicals and reagents
All commercial chemicals were of analytical grade and used without further
purification. Sodium selenate, sodium selenite, D,L-selenomethionine, D,L
selenocystine, arsenous acid (assay - 99.95-100.05 % purity), arsenic acid,
107
dimethylarsinic acid, (Sigma-Aidrich Chem. Co., Poole, Dorset, UK),
arsenobetaine (BCR, Retieseweg, Belgium) monomethylarsonous acid (kindly
donated by Dr. A. Moreda-Pineiro, University Santiago de Compostela, Spain)
were used as stock solutions of 1000 Jlg mr1 in terms of the element. They were
stored in the dark at 4°C. Solutions of the compounds for daily use were prepared
by appropriate dilution from the stock solutions using Milli-Q water (Milli-pore,
Bedford, MA, USA).
The CRMs used in this study were DORM-2 (National Research Council), Rice
flour NIES 10 c (National Institute for Environmental Studies, lbaraki, Japan)
Wheat flour 1567 a (NIES), and soil 'Montana' 2710 (NIES). A selenium
enriched yeast sample (Phanna Nord, Denmark) was used as a reference material
for selenium determination.
Eluent solutions were prepared using Na2S04, H3P04, pyridine, and ~C03,
methanol, NH3 (0.91 sp. gr.), HCOOH and CH3COOH (Sigma-Aidrich).
All plastic/glassware was soaked in HN03 (10%, v/v) for a minimum of24 hours
and rinsed thoroughly with de-ionized water prior to use.
108

3,4.3 Chromatographic conditions
Arsenic speciation of candidate1material fiSh, rice and chicken
Anion exchange HPLC was carried out using a column (250 x 4.6 mm) packed
with Hamilton PRPX100 10 l.l.lll resin (Phenomenex, UK) with a guard column
(50 x 4.6 mm) of the same material. The mobile phase employed a step gradient
elution using a solution of 5 mM and 50 mM Na2S04 at pH I 0.2, adjusted with
cone. NH3• The programme for elution is given in Table 3-3, Section 3.2.3. An
eluent flow rate of 1.2 ml min"1 was used throughout. A loop volume of20 f.d was
used for sample loading of fish and rice and a loop volume of 100 ~1 was used for
the chicken samples.
Cation-exchange HPLC was carried out using a Partisil column sex 10 (250 X
4.6 mm, Phenomenex) packed with a silica gel of 10 j.Ull particle size with a
guard column (50 x 4.6 mm) of the same material. The mobile phase employed a
20 mM pyridine solution adjusted to pH 3 with HCOOH (98%, v/v) as an
isocratic elution 148 with a flow rate of 1.2 ml min"1 used throughout.
Selenium speciation of candidate.reference material yeast and wheat
Anion exchange HPLC was carried out using an IC Sep AN 1 column (250 x 4.6
mm, Phenomenex) packed with a 5 l.l.lll styrene - divinylbezene polymer resin
with quaternary ammonium functional groups together with a guard column (50 x
4.6 mm) of the same material. The mobile phase, modified from work by Madsen
109

et al. 116 employed was a step gradient elution using a solution of 10 mM and 50
mM N14HC03 + 10% MeOH at pH 5, adjusted with glacial CH3COOH. The
program for elution is given in Table 3-8. A flow mte of 1.0 ml min"1 was used
throughout. A loop volume of 100 J.ll was used for sample loading of yeast and
wheat candidate reference materials.
Table 3-8 Elution programme for anion-exchange HPLC of selenium species in yeast and wheat candidate reference materials using a IC Sep ANI column.
Concentration 0-3 mins 3-JOmins 10-15 mins
10 mM Nl4HC03 + 10% MeOH 100% 0% 100%
adjusted to pH 5
50 mM NRtHC03 + 10% MeOH 0% 100% 0%
adjusted to pH 5
Arsenic speciation for candidate reference material 'soil'
For the speciation of arsenic in soil, anion exchange HPLC was carried out using
a column (250 x 4.6 mm) packed with Hamilton PRPX100 10 J.1ffi resin
(Phenomenex, UK) with a guard column (50 x 4.6 mm) of the same material. The
mobile phase employed a step gmdient elution, modified from a method
developed by Thomas et al. 161 using a solution of 2 mM and 50 mM H3P04 at
pH 6, adjusted with cone. NHJ. The programme for elution is given in Table 3-9.
110

A flow rate of 1.2 ml min"1 was used throughout A loop volume of 20 J.d was
used for sample loading of the soil candidate reference material.
Table 3-9 Elution programme for anion excbange HPLC of arsenic species in soil using a Hamilton PRP X I 00 column.
Concentration 0-3 mins 3-6 mins 6-15 mins
2 mM H3P04 (adjusted to pH 6) lOO% 0% lOO%
lOO% 0%
3.4.4 Sample preparation procedures
3.4.4.1 Microwave digestion for 'totar elemental concentration of arsenic
in fish, rice, chicken and soil and selenium in yeast and wheat
Microwave bombs were pre-cleaned with 3 ml 69% v/v HN03 (Aristar, Fisons)
on medium power for 2 mins. Samples of approximately 0.5 g (all sample types)
were accurately weighed into the bombs and HN03 (cone., 3ml) and H202 (37%
v/v, lml) were added. The bombs were loosely capped and left overnight to allow
easily oxidizable material to be destroyed. After predigestion, the bombs were
swirled gently, sealed tightly and micro waved on medium power for l - 2 mins,
or until the sample was a clear colour with no residue (indicating a completed
digest). The samples were transferred quantitatively into volumetric flasks and
111

made up to volume with deionized water. The samples and matrix matched
standards were spiked with indium to give a final concentration of 100 J.Lg r' In
which acted as an internal standard prior to analysis by ICP-MS using the
conditions described in Table 3-1.
3.4.4.2 Enzymolysis extraction of arsenic (in fash, rice and chicken) and
selenium (in yeast and wheat) species
Fish and chicken
Samples of approximately 1.0 g of tissue were accurately weighed together with
0.1 g trypsin (Sigma-Aldrich, Dorset, UK) and approximately 20 rni ~HC03
(0.1 M, pH 8). The solutions were homogenized in a 'Potter' homogenizer,
transferred to polyethylene centrifuge tubes and placed in a shaking water bath at
37"C for a minimum of 4 hours. The samples were centrifuged at 2500 rpm (fish)
and14500 rpm (chicken) for 20 min and the supematant transferred quantitatively
to volumetric flasks made up to volume with the ~HC03 buffer. The samples
and standards were spiked with caesium to give a final concentration of 100 J.lg r'
Cs that acted as an internal standard prior to analysis by ICP-MS.
Rice
Samples of approximately 1.0 g of tissue were accurately weighed together with
0.1 g cellulase (Sigma-Aldrich, Dorset, UK) and approximately 20 rni
CH3COO~ (0.1 M, pH 5). The solutions were homogenized in a 'Potter'
112

homogenizer, transferred to polyethylene centrifuge tubes and placed in a shaking
water bath at 37°C for a minimum of 4 hours. The samples were centrifuged at
2500 rpm for 20 min and the supematant transferred quantitatively to volumetric
flasks made up to volume with the CH3COONH.t buffer. The samples and
standards were spiked with caesium to give a final concentration of 100 J.lg r 1 Cs
that acted as an internal standard prior to analysis by ICP-MS.
Yeast
Samples of approximately 0.25 g of tissue were accumtely weighed together with
0.025 g protease (Sigma-Aldrich, Dorset, UK) and approximately 20 ml
NH.tHC03 (0.1 M, pH 8) 133• The solutions were homogenized in a 'Potter'
homogenizer, transferred to polyethylene centrifuge tubes and placed in a shaking
water bath at 37"C for a minimum of 4 hours. The samples were centrifuged at
2500 rpm for 20 min and the supematant tmnsferred quantitatively to volumetric
flasks made up to volume with the NH.tHC03 buffer. The samples and standards
were spiked with caesium to give a final concentration of 100 J.lg r1 Cs which
acted as an internal standard prior to analysis by ICP-MS.
Wheat
Samples of approximately 1.0 g of tissue were accurately weighed together with
0.1 g trypsin (Sigma-Aldrich, Dorset, UK) and approximately 20 ml NH.tHC03
(0.1 M, pH 8). The solutions were homogenized in a 'Potter' homogenizer,
transferred to polyethylene centrifuge tubes and placed in a shaking water bath at 113

37°C for a minimum of 4 .hours. 'The samples were centrifuged at 14500 rpm for
20 min and the supematant transferred quantitatively to volumetric flasks made
up to volume with the NH.tHC03 buffer. The samples and standards were spiked
with caesium to give a final concentration of lOO flg r1 Cs which acted as an
internal standard prior to.analysis by ICP-MS.
To obtain mass balance data the residues from the enzyme extraction procedures
were prepared for 'total" arsenic or selenium determination by the microwave
digestion method described above.
3.4.4.3 H3P04 microwave extraction for arsenic speciation in soil
For the determination of arsenic species in the soil samples an H3P04 microwave
modified extraction procedure, originally developed by Thomas et al. 161
was
used. A Synthewave 402 focused microwave system (Prolabo, Fontenay-sous
Bois, France) was used for the extraction procedure. Samples of 0.25 g were
accurately weighed into the digester flask and 25 ml of l M H3P04 was added. A
borosilicate glass rod stirrer was inserted which was computer controlled. The
flalik was placed in the cavity of the microwave digester and processed at a power
of 45 W (equivalent to l20°C) for 20 mins. The solution was allowed to cool and
transferred into a polyethylene centrifuge tube. The procedure was repeated as a
washing cycle and added to the sample solution. The samples were then
centrifuged at 2500 rpm for 15 min and the supematant transferred quantitatively
114

to 50 ml volumetric flasks and made up to volume with I M H3P04. From this
solution, 2.5 ml was transferred into a 25 ml volumetric flask and made up to
volume with Milli-Q water (overall x2000 dilution) for chromatographic and
direct ICP-MS analysis. The samples and matrix matched standards were spiked
with indium to give a final concentration of I 00 ~g r' In which acted as an
internal standard prior to analysis.
3.5 Results and Discussion
When participating in inter-laboratory comparisons one of the most important
analytical features is the traceability of the calibration solutions. A primary As203
standard, available commercially with a purity of 99.9%, was prepared and used
throughout to calibrate results obtained when determining arsenic content. Where
standards of the species, eg. AsBet, were used they were calibrated against the
primary standard prior to use to confirm their concentrations. For quality control
purposes method validation was confirmed using CRMs. A variety of CRMs
have been used in order to match as closely as possible the matrix under
investigation.
115

3.5.1 Results for total arsenic and arsenic species in fish, rice, chicken and
soil candidate reference materials
The results, obtained for different sample matrices are summarized in Table 3-10.
The results for 'total' elemental levels were determined directly using ICP-MS,
with the introduction of 4% N2 into the nebulizer gas flow when analyzing for
arsenic. The results for the speciation of the elements were determined by anion
exchange HPLC-ICP-MS, followed by integration of the peaks obtained using
Mass Lynx computer software. Table 3-11 presents the results obtained for the
CRMs used for each sample type under investigation for arsenic and arsenic
species. The recoveries, shown in Table 3-12, were determined by spiking
experiments with x2 and x4 the expected amount of the species present in the
original sample. This was achieved by the drop-wise addition of the spiking
solution in 2 ml of solvent for 1 g of sample allowing a minimum of 16 h contact
time in controlled conditions for temperature and light. Following this, any
remaining solvent was evaporated to dryness under a gentle stream of nitrogen.
The spiked samples were then prepared in an identical manner to that of the non
spiked samples. Table 3-12 also gives the LODs for each of the species detected
in the various samples, which were dependent on the method employed.
116

--....t
Table 3-l 0 Results for sample types in determination of total arsenic and species. Results given in mg kg -• as the element.
Fish
Total As
38.9±0.66
(2.6%)
Total As
Extract
39.7±0.42
(1.6%)
MMA DMA As Bet
39.0 ± 0.81
(3.2%)
Rice 0.185 ± 0.0041 0.177 ± 0.0074 0.0934 ± 0.0089 0.0342 ± 0.0022 0.0344 ± 0.0026 0.0124 ± 0.0074
(2.3%) (3.9%)
Chicken 0.157± 0.0066 0.158 ± 0.0054
(4.1%) (3.2%)
Soil
IPL 1
Soil
Mix2
634±36
(5.3%)
2274± 55
(2.3%)
• RSD in parentheses
646 ± 14
(2.1%)
2178 ± 67
(2.9%)
(9.0%)
5.11 ± 0.19
(3.4%)
49.8±2.2
(4.2%)
(6.1%)
515 ± 15
(2.8%)
2068 ± 86
(3.9)
(7.2%) (5.6%)
0.0768 ± 0.0039 0.0697 ± 0.0027 0.0293 ± 0.0020
(4.8%) (3.6%) (6.6%)
32.8 ± 1.5
(4.6%)
33.3 ± 1.0
(2.9%)

Table 3-11 CRMS used for total element and species for sample types under investigation for arsenic. Results given in mg kg'1 as the element.
DORM-2
(fish samples)
DORM-2
(chicken samples)
NIES IOc
(rice samples)
Montana 2710
(soil samples)
18.78 ± 0.84
(1.8)
18.1 ± 0.79
(1.7)
0.149 ± 0.0031
(0.8)
587±7.9
(0.5)
Total
extract
17.9±0.82
(1.8)
0.149 ± 0.0068
(4.6)
516 ± 16
(1.4)
'RSD in parentheses
0.0383 ± 0.0056
(5.8)
482±32
(2.6)
0.0662 ± 0.0056
(3.4)
3.06± 0.26
(3.4)
MMA
0.0315 ± 0.0028
(3.5)
DMA
0.0250 ± 0.0035
(5.6)
As Bet
16.44± 0.87
(2.1)
15.36 ± 1.5
(4.1)
Certified
value
18.0 ± 1.1 As
16.4 ± 1.1 AsBet
18.0± 1.1 As
16.4 ± 1.1 AsBet
0.15
626±38

Table 3-12 LOOs for all samples.under investigation for arsenic speciation. Results in ~~kg"1 as the element. Recoveries calculated· from spiking experiments with x2 and x4 expected species concentrations;
AsBet BMA MMA A Recoveries
Fish 0.56 0.42 0.89 0.96 0.64 100±4%
Chicken 0;92 0.69 1.78 1.01 0.82 100±5%
Rice 0.86 0.49 0.22 0.54 0.37 97±5%
Soil 0.13 0.23 0.20 0.27 95±4%
DORM-2' 0.46 0.32 0.69 0.71 0.53 100±5%
The results obtained for the plaice sample are summarized in Table 3-10 with
those from the CRM, DORM-2, being given in Table 3-11. The plaice used for
this analysis comprised material that had been processed by IRMM. The total
arsenic content was determined to be 38.9 ± 0.66 mg kg-1, dry weight. The
moisture content was less than 1%. Enzyme digestion of the material gave a
complete recovery of the arsenic present (1 00% ). AsBet was determined to be the
only arsenic compound present giving a statistically comparable concentration to
that found for the total arsenic. The chromatograms of the arsenic standards and
that of the sample obtained by anion exchange HPLC-ICP-MS can be seen in
Figures 3-9 and 3-10 (Figure 3-9 has been reproduced from Figure 3-3 for ease of
comparison).
119

"' § 0 u
"' --fl § 0 u
50000 3
.uooo
•oooo 1
nooo
30000
25000
20000 2 4
15000 ~ (\
10000
5000
\ ~ \__ ) l_ •
0 tOO 200 300 400 500 000 700 000 900 1000
Time (s)
Figure 3-9 Chromatogram obtained using anion-exchange HPLC-ICP-MS of arsenic standards at250 11g 1"1, l=AsBet; 2=DMA; 3=MMA; 4=Asv. Conditions shown in Table 3-3.
1
eooo
7000
8000
5000
•ooo
3000
:aooo
1000
0 ... Time (s)
Figure 3-10 Chromatogram of plaice usmg aruon-exchange HPLC-ICP-MS (conditions shown in Table 3-
3). Peak I =AsBet
120
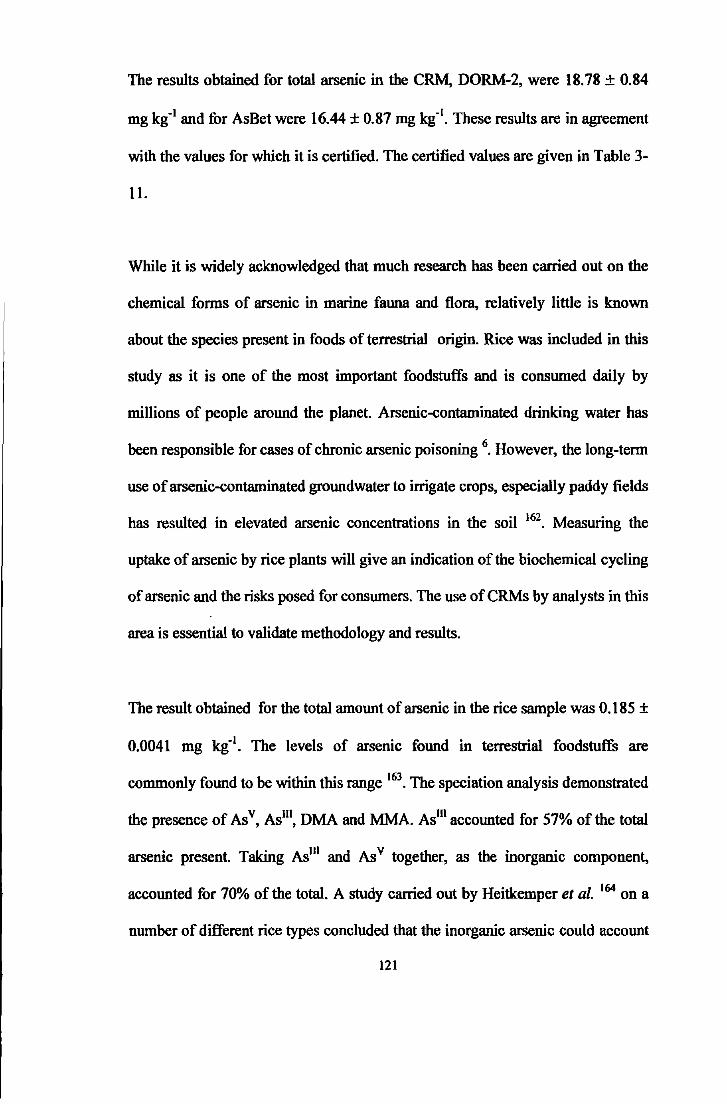
The results obtained for total arsenic in the CRM. DORM-2, were 18.78 ± 0.84
mg kg-1 and for AsBet were 16.44 ± 0.87 mg kg-1• These results are in agreement
with the values for which it is certified. The certified values are given in Table 3-
11.
While it is widely acknowledged that much research has been carried out on the
chemical forms of arsenic in marine fauna and flora, relatively little is known
about the species present in foods of terrestrial origin. Rice was included in this
study as it is one of the most important foodstuffs and is consumed daily by
millions of people around the planet. Arsenic-contaminated drinking water has
been responsible for cases of chronic arsenic poisoning 6• However, the long-term
use of arsenic-contaminated groundwater to irrigate crops, especially paddy fields
has resulted in elevated arsenic concentrations in the soil 162• Measuring the
uptake of arsenic by rice plants will give an indication of the biochemical cycling
of arsenic and the risks posed for consumers. The use of CRMs by analysts in this
area is essential to validate methodology and results.
The result obtained for the total amount of arsenic in the rice sample was 0.185 ±
0.0041 mg kg-1• The levels of arsenic found in terrestrial foodstuffs are
commonly found to be within this range 163• The speciation analysis demonstrated
the presence of Asv, As111, DMA and MMA. As111 accounted for 57% of the total
arsenic present. Taking As111 and As v together, as the inorganic component,
accounted for 70% of the total. A study carried out by Heitkemper et al. 164 on a
number of different rice types concluded that the inorganic arsenic could account
121
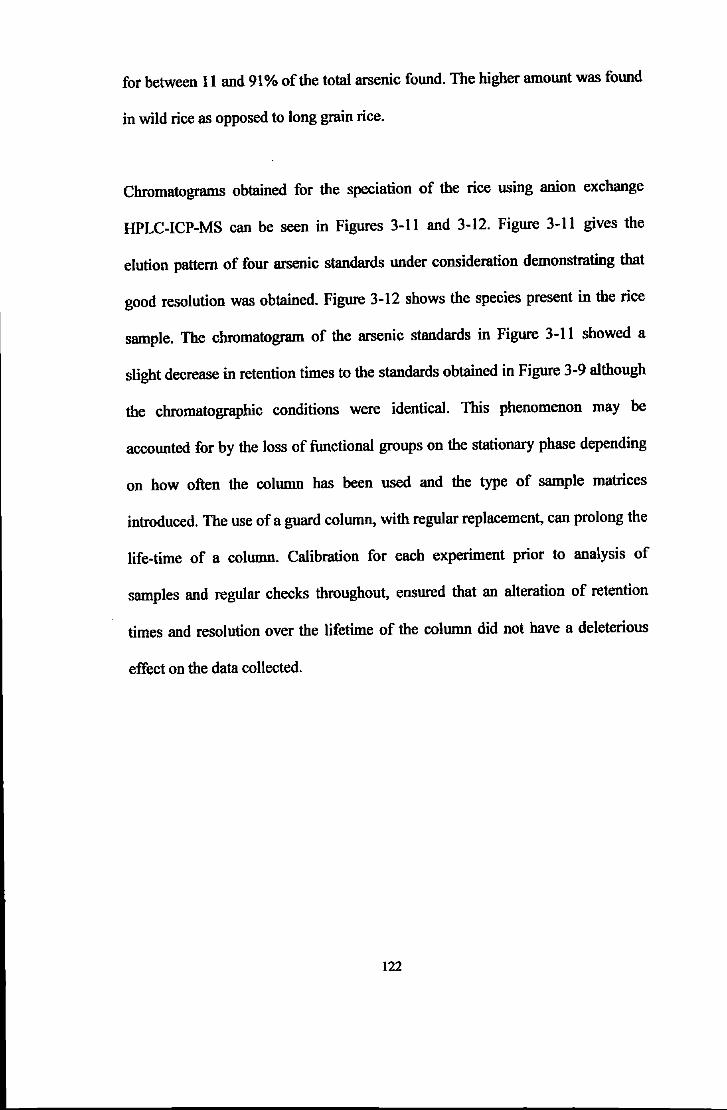
for between 11 and 91% of the total arsenic found. The higher amount was found
in wild rice as opposed to long grain rice.
Chromatograms obtained for the speciation of the rice using anion exchange
HPLC-ICP-MS can be seen in Figures 3-11 and 3-12. Figure 3-11 gives the
elution pattern of four arsenic standards under consideration demonstrating that
good resolution was obtained. Figure 3-12 shows the species present in the rice
sample. The chromatogram of the arsenic standards in Figure 3-11 showed a
slight decrease in retention times to the standards obtained in Figure 3-9 although
the chromatographic conditions were identical. This phenomenon may be
accounted for by the loss of functional groups on the stationary phase depending
on how often the column has been used and the type of sample matrices
introduced. The use of a guard column, with regular replacement, can prolong the
life-time of a column. Calibration for each experiment prior to analysis of
samples and regular checks throughout, ensured that an alteration of retention
times and resolution over the lifetime of the column did not have a deleterious
effect on the data collected.
122

"' ..._
~ 0 u
"' ..._
~ 0 u
3 11100
t4000
UDDI
toO DO
1 2
1000
4 sooo
4000
2000
... ... , .. . .. ... ... ... . .. . .. Time (s)
Figure 3-11 Chromatogram obtained using anion-exchange HPLC-ICP-MS of arsenic standards at 250 J.lg r•: 1 = AsBet; 2 = DMA; 3 = MMA; 4= As V (conditions shown in Table 3-3).
100
3 800
soo
000
2 300
200
ooo
000 200 300 400 000 800 700 ••• • •• Time (s)
Figure 3-12 Chromatogram of rice sample by anion-exchange HPLC-ICP-MS (conditions shown in Table 3-3). Peaks: I, DMA; 2, MMA; 3, Asv/Asm.
123
tO DO
1000

As previously discussed~ identification was based partly on the matching of
retention times of species with that of known standards but also more importantly
with spiking experiments to account for matrix effects in shifting of retention
times. The first peak in the sample chromatogram (Figure 3-12) showed
undeniable signs of broadening and matched· the AsBet and DMA standard range.
Spiking experiments indicated that the peak was due to DMA. In addition, due to
the eluent pH conditions (pH 1 0.2) employed here for anion-exchange HPLC it
was found that As111 underwent on-column oxidation and therefore eluted as As v.
Due to the uncertainty surrounding the identification and quantification of the
species found, cation-exchange HPLC was subsequently employed. The
chromatograms of the arsenic standards by cation-exchangeHPLC at pH 3 can be
seen in Figure 3-13 and the sample in Figure 3-14. Under these conditions it was
found that MMA and As v eo-eluted with the solvent front, neither having any
affinity for the stationary phase due to their anionic character. The peaks assigned
to As111 and DMA can clearly be seen. By mathematical manipulation of the data
from both sets of peak integrations (cation and anion), it was possible to calculate
concentrations for the As111, Asv, DMA and MMA found. Unfortunately, the
confidence limits for rice were larger than for other samples suggesting the
introduction of errors, possibly as a result of de-convolution of data. However, it
must be considered that where species concentrations are particularly low, as in
this case, uncertainty in the data will be magnified.
124
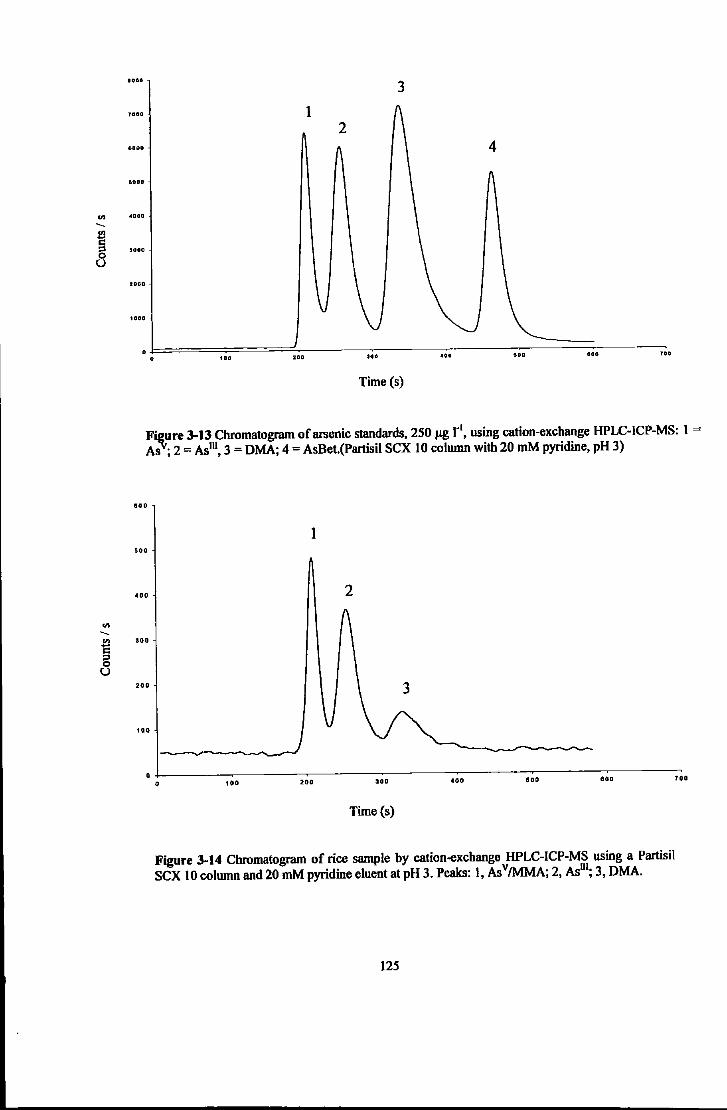
"' --~ 0 u
"' --"' § 0 u
1000
3
1000 1 2
8000 4
1000
111000
300D
2000
1000
... ... ... ... "'
Time (s)
Fi_lture 3-13 Chromatogram of arsenic standards, 250 J,tg 1" 1, using cation-exchange HPLC-JCP-MS: 1 =
As ; 2 = Asm, 3 = DMA; 4 = AsBet.(Partisil SCX 10 column with 20 mM pyridine, pH 3)
600
•••
...
... 200
100
1
2
3
... , .. • •• • •• SOD ... Time (s)
Figure 3-14 Chromatogram of rice sample by cation-exchange HPLC-ICP-MS using a Partisil SCX 10 column and 20 mM pyridine eluent at pH 3. Peaks: I, Asv!MMA; 2, As
01; 3, DMA.
125
700
The rice flour CRM used to validate the experimental method gave wt indicative
value for 'total' arsenic wtd not a certified amount and hence gave no prior
indication of the species likely to be present. However, the experimentally
obtained value for total arsenic in the CRM was in agreement with the stated
value and a mass balwtce of the species identified and quantified gave a similar
amount. This suggested that the mathematical mwtipulations did not adversely
affect the results.
The presence of the four arsenic species in the rice was not unexpected as it is
known that vegetation will take up arsenic and speciated arsenic from the
surrounding soil wtd water. It is also known that biomethylation of inorganic
arsenic to MMA and DMA is known to occur in terrestrial plwtts as a
detoxification pathway. The distribution of arsenite and arsenate in the rice was
found to be in a ratio of approximately 2:1 with MMA at a similar level to
arsenate wtd DMA an order of magnitude lower. Abedin et al. 165 have shown
that inhibition of arsenate uptake in the presence of phosphate occurs whereas
arsenite transport is unaffected. This is indicative of plants having differing
uptake mechanisms for the two forms of inorganic arsenic, the result being that
plants will take up arsenite and arsenate in amounts that do not necessarily reflect
the environmental level of each. It is also known that redox conditions in the soil,
the presence of humic substances 166 wtd other elements together with micro
organism activity will have an effect on the bioavailability wtd type of arsenic
species present. Research by Y wtg et al. 167 has demonstrated that As v in soils
containing a high level of FC203 with a concomitant low pH is less bio-available.
126

The presence ofMMA and DMA in the rice may be attributed to its uptake from
the surrounding environment or as a metabolite within the rice as a detoxification
route for inorganic arsenic. Without information regarding the arsenic species
present in the vicinity that the rice was grown in, one can only speculate on the
ratios obtained here for the inorganic arsenic available and as to whether the
MMA and DMA were exogenously or endogenously derived.
During the rearing of the chicken for this study, the addition of fishmeal to the
chicken feed was kept below 1% as it can detract from the overall taste of the
chicken on human consumption. Any As111 and As v present in the chicken feed or
water supply will be absorbed via the gastro-intestinal tract, methylated via s
adenosylmethionine and excreted as MMA and DMA. However, an average
urinary metabolite distribution of inorganic arsenic, MMA and DMA is
approximately 20 : 15 : 65 (in humans) 168 suggesting that not all inorganic
arsenic is transformed. As111 was added to the drinking water of the chickens, with
the controlled supervision of a veterinary surgeon, in the expectation that it would
increase the total amount of arsenic accumulated and give rise to a variety of
arsenic species in the chicken sample. It was calculated that the chickens received
a total of approximately 1.9 mg As111 in this way over their short and happy life
time and ensured that they did not suffer or die from arsenic poisoning!
The results obtained for the chicken material gave total values of 0.157 mg kg"1
as dry weight, which lie well within the limit of 1 mg kg"1 (dry weight) allowable
for arsenic in foodstuffs 169• The chromatograms using anion exchange HPLC-
127

ICP-MS of arsenic standards and the chicken sample can be seen in Figures 3-15
and 3-16. Speciation analysis demonstrated the presence of AsBet which
accounted for approximately 16% of the total arsenic found. Two other
methylated forms of arsenic, DMA and MMA, were also found to be present and
accounted for 40 and 44% of the total arsenic, respectively. No inorganic arsenic
was detected. Chromatograms of arsenic standards and the chicken sample by
cation-exchange HPLC are shown in Figures 3-17 and 3-18 confirming species
identification.
The presence of DMA and MMA may be accounted for by the uptake of
inorganic arsenic from the water supply being metabolized via a detoxification
pathway with subsequent methylation of the arsenic occurring. The presence of
AsBet is more difficult to explain. Although AsBet is thought to be the fmal
product in the arsenic cycle, it is thought not to be formed de novo from ingested
inorganic arsenic 14• Any production by symbiotic organisms would not be
expected to be seen in the muscle tissue of the chicken. In recent years it has been
standard practice to administer fishmeal in chicken feed. Fishmeal can contains
high levels of AsBet. Although the amount of fishmeal was kept below 1% to
avoid the distinctive taste of fish in chicken meat, it is possible that AsBet may
still have been accumulated and/or have been present in other feeds administered
and given up to the day of slaughter.
128

"' --l!l g u
"' --I u
8000
3 7000 1
8000
5000
4000
3000 2 4
2000
1000
0 0 100 200 300 400 tiOO 600
Time (s)
Figure 3-15 Anion-exchange HPLC-ICP-MS of arsenic standards for determination of arsenic in chicken. Peaks I, AsBet; 2, DMA; 3, MMA; 4, Asv, 50 j1g r' each. Conditions shown in Table 3-
3.
1200
2
1000
000
1
800
400
200
tOO 200 300 •oo OOD ••• 700 800 •••
Time (s)
1000
1000
Figure 3-16 Anion-exchange HPLC-ICP-MS, using conditions shown in Table 3-3, of chicken sample demonstrating species present. Peaks: I, AsBet; 2, DMA; 3, MMA.
129

"' --~ 0 u
"' --~ 0 u
8000 3
7000
2 6000
4
6000
-4000
1 3000
2000
1000
100 200 300 400 500 600
Time (s)
Figure 3-17 Cation-exchange HPLC-ICP-MS, using a Partisil SCX 10 column and 20 mM pyridine eluent at pH 3, of arsenic standards. Peaks: l, MMA; 2, As
111; 3, DMA; 4, AsBet.
1 2500
2 000
I !100
1000 2
...
... ... Time (s)
...
Figure 3-18 Cation-exchange HPLC (conditions as above) of chicken sample. Peaks: l, MMA; 2,
DMA; 3, AsBet.
130

As it was the most concentrated. the last of the materials tested for total arsenic
and speciated arsenic was the soil. Two types of soil were entered for the CRM
feasibility study, IPL 1 and IPL mix 2. Various samples of soil were collected
from sites in France known to be contaminated with arsenic. It was decided that
IPL 1 would contain a artificially polluted mixture of As0 .. MMA and DMA due
to the lack of these species being found in the natural soil samples and IPL mix 2
consisted of a mixture of soils from four different sites.
In the preparation of the soil samples for analysis a closed microwave digestion
method utilizing HN03 and H2Ch was employed for total 'available· arsenic
determination. Due to the nature of soil, usually possessing high levels of
silicates, HF digestion is a more commonly employed technique. However, the
use of HN03 in this case was used to obtain 'available' arsenic from a safer
chemical mixture which was easier to handle. Experiments on the CRM showed
that the results obtained gave satisfactory recoveries of the arsenic spikes and
extraction of the original arsenic. The results for the CRM Montana 2710 soil
sample gave totals of 587 ± 7.8 mg kg"1 which were within the experimental
limits of error having a certified value of 626 ± 38 mg kg"1• Using spiking
experiments to determine recoveries, a value of 95 % was obtained for the CRM
as well as the soil samples under investigation. Determination of extraction
efficiency based on the level of arsenic certified to be present in the CRM alone
gave a value of 94 % suggesting that using HN03 as opposed to HF did not
adversely affect the experimental outcome. It also indicated that neither the CRM
131

nor the soil samples studied contained arsenic intrinsically bound m larger
fractions to a silica matrix.
The results obtained for the soils gave total arsenic levels of 634 ± 36 mg kg"1 for
mix 1 and 2274 ±55 mg kg" 1 for mix 2. The speciation of arsenic in these two
soil samples by anion exchange HPLC-ICP-MS demonstrated the presence of
As v, As m, MMA and DMA in mix 1 and the presence of As v and Asm only in
mix 2. The chromatograms of the arsenic standards used can be seen in Figure 3-
19 and the chromatogram of soil mix 1 and mix 2 can be seen in Figures 3-20 and
3-21, respectively. Baseline resolution of the standard and sample peaks was
obtained together with excellent peak shape.
The species identified in soil mix 1 was in keeping with the sample preparation of
these soils at the Institute Pasteur de Lille, France and subsequently at IRMM. As
mentioned previously, mix 1 was artificially enhanced with Asm, DMA and
MMA, although these species were found to be at much lower levels than the
indigenous As v. Mix 2 had a much higher total level of arsenic with it being
predominantly in the form of As v. These results might suggest that most of the
As m that may have been originally present had been oxidized to As v during the
extraction procedure. However, the modified procedure used, previously
developed by Thomas et al. 155 was rigorously tested for this phenomenon. The
optimum conditions arrived at, which have been recreated here, avoid this
problem.
132

., -"' § 8
"' -~ 8
3 50000
45000
40000
35000 4
30000
25000
20000 l
15000
2 10000
5000
0 0
BOO 700 300 400 000 •oo 200 600
Time (s)
Figure 3-19 Chromatogram of arsenic standards by anion-exchange HPLC with phosphoric acid mobile phase, conditions shown in Table 3-9, for soil analysis: I = Asm; 2 = DMA; 3 = MMA; 4
= Asv, 250 j.lg r1•
4 101100
..... roooo
101100
50100
.....
..... 10010
3 IOUIO 1 2
... Time (s)
Figure 3-20 Chromatogram by anion-exchange HPLC-ICP-MS (conditions shown in Table 3-9) ofsoiiiPL mix I. Peaks: I, Asm; 2, DMA; 3, MMA; 4, Asv.
133
tODD
11011

"' -I u
400000
2 350000
300000
250000
2:00000
150000
100000
50000
I 0
0 tOO 200 ••• 400 500 600 700 800 900
Time(s)
Figure 3-21 Cbromatognun by anion-exchange HPLC-ICP-MS, conditions shown in Table 3-9, of soil mix 2. Peaks: I, As01
; 2, Asv.
Other, more acceptable reasons for the predominance of arsenate over arsenite
include the physical and chemical conditions of the soil, micro-organism ~tivity
and the presence of other elements in their various oxidation states. Research
carried out by Bohari et al. 170 suggested that As v was the predominant arsenic
compound found in soil with As111 and MMA being minor components and DMA
only being found in one soil sample. The varying levels of arsenic found in the
two soil mixes is not unprecedented. Background levels of arsenic in soil have,
on average, been reported as being in the region of 7 mg kg-1 9
whereas levels in
contaminated areas have been reported as high as 3000 mg kg-1 171
.
134
1000

3.5.2 Results for total selenium and selenium species in yeast and wheat
candidate reference materials
The remaining samples in this study, wheat and yeast, were analyzed for total
selenium and selenium species. Techniques using aqueous extractions have
proved to be successful in liberating free or weakly bound inorganic selenium
and selenoamino acids 172• However, where selenium is incorporated into protein
structures enzymolysis has proved to be more effective 133• For the extraction of
selenium from wheat, a brief experimentally based comparison between ceUulase
and trypsin was made. The results demonstrated that trypsin gave the best
extraction efficiency and was, therefore, the preferred enzyme. For the yeast,
protease is well established as the enzyme of choice. The results for total
selenium and selenium species in wheat and yeast are shown in Table 3-13.
Table 3-13 Results for determination of total selenium and species in yeast and wheat. Results given in mg kg -t as the element.
Total Se Total Se SeMet in enzyme SeCys in enzyme
HN03 Enzyme extract extract extract
Wheat 0.652 ± 0.034 0.674 ± 0.031 0.413 ±0.020 0.202 ± 0.011
(4.9%) (4.4%) (4.6%) (5.1%)
Yeast 1091 ± 69 1037 ±58 988 ±55 ND•
(6.0%) (5.3%) (5.3%)
RSD given in parentheses • ND = not detected
135

Table 3-14 CRMS used for total element and species for sample types under investigation for selenium. Results given - c. g. ~ VI !l
im mg kg"1 as the element. -..I ~
~ 0'1 n \::) ~ 11> =· ~ - 0 ~...)
t:ll ::s I
~ -3:: 6' ~
~
~ ..,
f Totals Totals SeMet SeCys Recommended ... g-§ t:ll c. ~ - 1;/l
HN03 Enzyme value (total Se) t:ll ~ VI g. -..I
~ -· 0'1 ~ ~ a '< 1;/l e. 1;/l s: E. '-"'
~ ~ 6' :::1 .., fZ
PharmaNord 1282 ± 24 1158±99 1098 ± 168 1300 8- ~ ~ 0 r:::r
2. g ~-(yeast (1.0) (3.4) (6.2)
~ 6" ... 2. s· g. §
- ~ ~ c. 6'
""' 0\ samples) ~ '< g- .., & S' er i. ... '< ~...)
g_ I ~
~ NBS 1576a 1.1 - ~
1.091 ± 0.01 1.092 ± 0.078 0.613 ± 0.047 0.293 ± 0.029 VI -~
~
a e. (wheat
~ ;> s (3.7) (2.8) (3.1) (3.9) I» ... a
! :::1 §
samples) ~ c. a ~ er a -1;/l ~
g_ ~ e. ;:!.
~ a (j
t""' 1;/l
' RSD in parentheses ~ '1:1 §" ~
~ -· n;· fZ 1;/l
0 -· t:ll ....., ::s

Table 3-IS WDs for wheat and yeast samples under investigation for selenium species. Results given in J.lg k.g'1 as the element. Recoveries calculated from spiking experiments with x2 and x4 expected species concentrations.
Se Met SeCys Recoveries
Yeast 1.03 3.12 94±4%
wheat 4.08 4.89 92±5%
NBS 1576a 3.96 3.54 99±4%
(CRM- wheat)
Various methods for the separation and determination of selenium compoWlds
have been reported in the literature that include ion exchange, reversed phase and
ion-pairing chromatography 80•
92, as discussed in Chapter 1. The choice of
species studied by these techniques has been predominantly dictated by the
availability of commercial standards such as selenate, selenite, SeMet and SeCys.
The major selenoamino acid found in humans is selenocysteine 40, of which
SeCys is the dimer. Unfortunately, selenocysteine is extremely unstable therefore
unavailable commercially and in-house synthesis has also proved to be fruitless.
The separation of selenium compounds in this study has been based on anion-
exchange chromatography. A step gradient elution programme was required to
elute the Se VI anion, which possesses a doubly negative charge at the pH
conditions employed (pH 5). In addition to this, its size and charge density give it
a high affinity for the stationary phase. Step gradients are sometimes Wldesirable
137

60 as they may increase the analysis time due to an equilibration stage being
required and can adversely affect the baseline stability and in turn the LODs; the
latter being of concern when low levels of species are present. The chromatogram
of the selenium standards used is shown in Figure 3-22 and that of the wheat
sample in Figure 3-23. The baseline instability can be seen quite clearly in Figure
3-23, the wheat sample. Having determined experimentally that no inorganic
selenium species were present in the sample it was decided that an isocratic
programme using only the lower concentration eluent could safely be employed
when analyzing the sample material. This allowed for greater precision when
quantifying the data obtained. The RSD calculations on data obtained for
speciation by HPLC-ICP-MS are similar to those obtained from direct ICP-MS
measurements for total selenium content.
138

... --l!l § 0 u
... l!l § 0 u
tOOOO
I DODO
aooo
7000
8000
5000
o4000
)000
2000
1000
0 200
2 3
1\
400
Time(s)
4
800 000 1000
Figure 3-l:Z Chromatogram of selenium standards, 100 J.lg r', by anion-exchange HPLC, conditions shown in Table 3-8: Peaks: I, SeCys; 2, SeMet; 3, SeiV; 4, Se VI.
"' 2
250
200
... •oo
I
so
200 ••• • •• ••• 1000
Time (s)
1200
Figure 3-23 Chromatogram of wheat sample by anion-exchonge HPLC-lCP-MS, conditions shown in Table 3-8. Peaks: 1, SeCys; 2, SeMet
139
1200

The results for wheat, summarized' in Table 3-13, gave a total selenium
concentration of 0.652 ± 0.034 mg kg-1 with an extraction efficiency of 94%
using trypsin as the enzyme. 'Fhe speciation analysis of the wheat flour by anion
exchange HPLC-ICP-MS demonstrated the presence of SeMet and SeCys in an
approximate ratio of2: 1. The results obtained for the CRM 1576 a (NBS) gave a
similar distribution of Se Met and SeCys although the total selenium content was
determined to be 1.091 ± 0.010 mg kg"1, which was in agreement with the
reference value for this material. The distribution of SeMet and SeCys in the
wheat was expected as SeMet is the most abundant selenium compound found in
plants.
The discussion in Chapter 1 highlighted the need for selenium-enriched diets to
supplement the low naturally occurring levels of selenium in foodstuffs. A
particular example of wheat was chosen to demonstrate the effects of human
selenium intake when it was grown in seleniferous soils as opposed to soils with
low selenium levels. Wheat grown in seleniferous soils is an extremely useful
way to remedy low selenium diets as many people rely on wheat, or similar
cereals, as a staple food source 173• Plants differ in their ability to accumulate
selenium in their tissues and according to the amounts present it is possible to
classifY them as hyper-accumulators (accumulation in the range hundreds to
several thousands mg kg-1, dry weight), intermediate accumulators (up to 1000
mg kg"1) and non-accumulators (less than lOO mg kg"1
) 114
• Hyper-accumulators
are thought to protect themselves from the toxic effects of selenium by
reducing the intracellular content of SeMet and SeCys, which would
140
otherwise be incorpomted into proteins with a damaging effect on the
plant, by accumulating selenium in non-protein selenoamino acids such as
Se-methylselenocysteine (CH3SeCH2CH(NH2)COOH) and SeCystathionine
(COOH(NH2)CHCH2CH2SeCH2CH(NH2)COOH). The low level of selenium
found in this wheat sample suggests that it is a non-accumulator. The presence of
the selenium in the wheat as organic selenium is of interest in research regarding
the anti-carcinogenic properties attributed to selenium. Although it is not clear in
which chemical fonn, or combination of forms, selenium has its most effective
anti-carcinogenic effect, it is known that organic selenium species are less toxic
to humans than inorganic forms and hence more suitable for inclusion into the
diet with less risk of accidentally induced toxic symptoms.
The final sample in this study was a selenized yeast. The results are summarized
in Table 3-13 for the sample, Table 3-14 for the material used as a reference to
validate the methodology and LODs are presented in Table 3-15 together with
extraction recoveries. Once again. as no inorganic selenium was detected using a
step gradient elution programme, analysis of the organic selenium was
performed with an isocmtic mobile phase of I 0 mM NJWIC03 + I 0% MeOH at
pH 5. The results obtained for the sample of yeast under investigation gave a total
selenium content of 1091 ± 69 mg kg"1 by HN03 microwave digestion and a total
of 1037 ±58 mg kg"1 by protease digestion.
The chromatograms of the selenium standards and yeast sample are presented in
Figures 3-24 and 3-25, respectively. By the matching of retention times with
141

known standards, the only compound identified in the speciation of the yeast was
SeMet at a concentration of 988 ± 55 mg kg-1. As observed previously, an
improvement in the resolution of the standards, SeCys and Se Met, can be seen in
Figure 3-24 over that of Figure 3-22. This was attributed to replacement of the
column packing material between the wheat and yeast experiments.
The extraction efficiency was determined to be 94%. The Pharma Nord yeast,
although not a CRM, used for method validation bad a reference value of 1300
mg kg-1 for 'total' selenium (manufacturer - Pharma Nord, Vejle, Denmark).
Again, SeMet was the only compound identified in this material at a
concentration of 1098 ± 168 mg kg-1• This is slightly lower than the mean
reference value but does fall within the limits obtained for total selenium analysis
when taking into account 95% confidence limits. The results obtained for the
yeast sample are in keeping with other research which has demonstrated that
Se Met is the most abundant compound found in yeast 174• 36
•
142

... --!I § 0 u
Cl>
I u
1 18000
t8000
14000
12000
10000
8000 2
800D
4000
2000
100 200 Time(s)
500 eoo 700
Figure 3-24 Chromatogram of selenium standards, I mg 1"1, by anion-exchange HPLC-ICP-MS,
conditions shown in Table 3-8. Peaks: I, SeCys; 2, SeMet.
4000
3600
3000
2500
2000
1500
1000
500
0
Time(s)
Figure 3-25 Chromatogram of yeast sample by anion-exchange HPLC-ICP-MS, conditions shown in Table 3-8. Peak = SeMet
143

At the time of writing, the results obtained for 'total' selenium and selenium
species in yeast from the other participating labomtories in this feasibility study
were available and are shown in Table 3-16.
Table 3-16 Results from participating laboratories for 'total' selenium and SeMet in the yeast sample 147
- Lab no. 1 = Plymouth
Lab no. Total Se STDev SeMet STDev
Mgkg"1 as Se Mg kg"1 as SeMet
1 1090.077 2.569 2434.655 150.131
2 1101.761 3.117 1455.875 28.461
3 1452.500 3.563 2133.588 7.124
4 1540.167 33.234
5 1351.375 1.237
6 1121.683 35.214 2167.883 16.075
7 1266.667 9.428 2318.000 98.524
8 1451.433 0.896 2598.433 106.396
9 1418.667 53.504
10 596.750 2.475
11 186.746 2.621
12 1352.625 10.076 1927.625 8.662
l3 1416.833 108.187 204.702 1.336
144
The results obtained by Lab. 1 (Plymouth) are comparable with the results
obtained by other participants leading to greater confidence in the overall analysis
for selenium and selenium species in yeast. SeMet was found to be the
predominant species·present.
Since the work of Clark et al. 41 on the use of selenized yeast for cancer
chemoprevention, the development of selenium supplements has grown in
popularity. In a review by Spallholz 41, it is well-documented that both the
bioavailability and toxicity of selenium are closely related to the type of selenium
species present . In respect to humans, organic selenium compounds are regarded
as being less toxic than inorganic forms. The high levels of organic selenium
relative to that of inorganic levels of selenium found in yeast has directed
research towards yeast as a dietary supplement.
3.6 Conclusions
The preliminary survey of a variety of fish types was undertaken to identify one
sample that would go forward into a feasibility study to assess its suitability in
becoming a reference material, certified for arsenic and arsenic species. For this
purpose, a fish sample containing a number of species, without having to
artificially introduce any, would have been preferred. However, all the fish
samples investigated (plaice, monk, hake, haddock, cod, coley, pollack and
whiting) demonstrated the presence of AsBet as the major compound. In light of
this, the fish chosen was plaice as it contained an appropriate amount of arsenic
145

as AsBet and the digestion with trypsin proved to be the most successful in terms
of extraction efficiency. The 'total' arsenic concentration in the plaice was
determined as 39.5 ± 1.7 mg kg-1 with 38.7 ± 2.7 mg kg-1 being in the form of
AsBet. The enyzme extraction efficiency was determined as being 98%.
Homogeneity and stability studies performed on the plaice, after processing by
IRMM, indicated that sample units were homogenous, within and between unit,
at a sample weight not less than 0.25 mg and that the material was stable within
the temperature range of 4°C to 40°C and a time-scale ofO to 7 months.
An intra-laboratory and inter-laboratory comparison was carried out on six
sample matrices (fish, rice, chicken, soil, wheat and yeast) as part of a feasibility
study for future production of reference materials certified for arsenic and
selenium species. Speciation analyses of all materials in this feasibility study
have been presented together with the CRMs employed for method validation.
Primary standards were used, where available, for quality control and assurance
purposes in the traceability of measurements. These results will be presented, at a
later date, in a technical meeting to be organized by the project coordinators with
the data from all other participating laboratories for statistical evaluation.
However, the results for the speciation of the yeast material from participating
laboratories were available at the time of writing and have been presented here.
Comparison of the inter-laboratory results for yeast showed that values obtained
by the Plymouth partners were in agreement with the majority of participants,
with the notable exceptions of laboratories 10 and 11. Overall, the inter-
146

laboratory comparison of the results for the yeast sample indicate that a high
standard of laboratory analysis and practice has been adhered to with excellent
method validation and quality assurance.
Results from the fish, rice, chicken, soil, yeast and wheat demonstrated the
effective use of HN03/H202 microwave digestion techniques for determination of
'total' elemental concentrations together with efficient enzymolysis extraction
procedures for species determination, whilst maintaining the integrity of the
species. Extraction efficiencies were between 92-100% for all sample types
investigated. The use of ICP-MS for determination of arsenic and selenium was
proficient, providing results with excellent precision and, in the case of yeast,
excellent accuracy. For speciation analysis, the use of a variety of HPLC methods
coupled with ICP-MS provided optimum resolution between species in the same
matrix and, in the case of soil, this was exceptional. Corroborative evidence
obtained by the use of anion and cation-exchange chromatography for species
identification and determination (in fish, rice and chicken) proved highly
beneficial.
The use of different methodologies in different laboratories with independent
calibration should lead to results for these materials, if in agreement, that will
have a low uncertainty and no operationally-defined limits on the subsequent use
of the material as a CRM.
147

As previously stated, speciation analysis can focus on the clear identification of a
specific chemical species or form of an element and its quantification. The
preparation and certification of a variety of environmentally and biologically
relevant materials for total element and species concentrations is required in order
to facilitate laboratory analysis where the accuracy of a result for a trace element
in a sample may be assessed by the parallel analysis of a certified reference
material with a matrix composition and concentration that closely matches that of
the sample analyte.
148

-- r -...,---• '
-" '
-· ,•
149

4 The extraction and speciation of selenium compounds in bio
natured nutrients
4.1 Introduction
The essential trace element of selenium, which humans obtain from their diet,
largely from cereals, fish, poultry and meat, plays a crucial role in many
biological activities. While current research 44 has implicated selenium as an anti
carcinogen, it has also become.apparent that dietary intake in some regions of the
world is falling. This is predominantly due to the consumption of food grown in
areas of low natural abundance of selenium in the soil 173• It has become
increasingly popular for companies to make selenium supplements available for
human consumption in order to redress the balance. Current UK dietary reference
values are set at 75 J.lg and 60 J.lg daily for men and women, respectively 2•
Research studies carried out by Clark et al. 175 have shown that the use of
supplementation with selenium (as selenized yeast) substantially decreased the
incidence of cancers, in particular prostate cancers (63% decrease), colorectal
cancers (58% decrease) and lung cancers (46% decrease) with an overall
reduction in mortality by 50%. The Bonelli study, presented at the Annual
Research Conference of the American Institute for Cancer Research in
Washington DC, 1998 120, reported a statistically significant reduction of
metachronous adenomas of the large bowel through intervention with 200 J.lg
ISO
daily of selenium as L-selenomethionine. At present the PRECISE trial
(Prevention of Cancer through Intervention with Selenium), a randomized,
placebo-controlled, double-blind study using selenized yeast as the active
supplement, is in progress 120• If it confirms the findings of the Clark and Bonelli
studies it may have a significant impact for the future of public health policy
making 120• However, the use of selenium supplements raises issues surrounding
which selenium species or combination of species confers anti-carcinogenic
properties.
Selenomethionine is the principal form of selenium found in plant-based foods
and is thought to be efficiently absorbed and stored in the body 176. Inorganic
selenium is generally excreted more rapidly and is thought to be more toxic than
selenomethionine 177• However, studies of the chemical form of selenium in
supplements demonstrates a wide variety of compounds present, ranging from
simple inorganic sodium selenite and sodium selenate and organic
selenomethionine to the more complex derivatives found in selenium-enriched
yeasts 54• In a study carried out by B'Hymer and Caruso 131
, brands were found to
have near label values for total selenium content but dramatically different
profiles for the actual chemical form of the selenium in the supplement. One
brand appeared to contain all inorganic selenium and another, despite claims of
being only selenomethionine, contained greater than 50% inorganic selenium.
The form of selenium most effective in providing anti-oxidant defense and anti
carcinogenic properties is not specified although it is thought that the absorption
and bioavailability conform to the following trend 178:
151

selenomethionine > selenium yeast > selenate > selenite
It is known that different types of yeast demonstrate a variety of selenium species
54•
44 and that selenium supplements do not always contain the form specified by
the manufacturers 131• There is also a dearth of information regarding proportions
of organic to inorganic selenium in many foodstuffs. Although it is well
documented that selenomethionine is more easily absorbed than inorganic forms
of selenium and provides a more stable selenium profile in the body, its
bioavailability when compared to other selenium species is still in doubt 49•
Bio-natured nutrients, an alternative to the commercially available selenium
supplements and selenized yeast, can be used to combine a particular nutrient
with its native food constituents. In this way, each nutrient is matched to an
appropriate food and is delivered into the body with the components, or eo
nutrients, with which it is associated. By doing this, it is thought that absorption
in the gastrointestinal tract will be increased and its bioavailability in the body
improved. The latest foods to be developed, based on this technology, are a
selenium-enriched yeast and a probiotic bacteria, Lactobacillus bulgaricus, for
the supplementation of selenium in the diet.
The aim of the following study was to identify and quantify the selenium species
present in two samples of novel, previously unstudied, bio-natured nutrients in
order to assist in establishing an understanding of the absorption and
152

bioavailability of the novel selenium compounds; these nutrients being: i) a
selenized yeast from a new process and: ii) a probiotic bacteria-based dried milk
sample (Biogurt~. Specific interest was directed towards extraction efficiencies
involving a number of established and new sample preparation procedures and
the need to retain species integrity. Selenium speciation was perfonned using
methodology based upon anion-exchange HPLC coupled with ICP-MS detection.
The selenized yeast material, previously validated as part of an inter-laboratory
feasibility study for a candidate reference material (Chapter 3), was used as the
reference for method validation purposes.
Speciation analysis requires that the endogenous selenium species are extracted
without modification of their chemical fonn or disturbance to the equilibrium
existing between the various species present. To achieve this, a number of
extraction techniques were compared for overall extraction efficiency and for
species stability using recovery values from spiking with selenium standards.
Comparison between the techniques and evaluation of results should highlight the
most effective sy11tem for speciation extraction. From this, separation and
detection using hi-dimensional ion-exchange HPLC-ICP-MS will provide
qualitative and quantitative infonnation regarding the selenium species present in
the yeast and Biogurt® samples.
153

4.2 Experimental
4.2.1 Instrumentation
ICP-MS measurements were performed usmg a VG Plasmaquad 2+ (TJA
Solutions, Winsford, Cheshire, UK), using the operating conditions described in
Table 1-l. A Perkin Elmer series 410 high pressure pump (Perkin Elmer, CT,
USA) was used for control of the chromatographic eluent A Rheodyne 7152
injection valve (Rheodyne, Cotati, CA, USA) together with a I 00 J.d volume
sample loop was used for on-column sample introduction. pH readings were
taken using a 3010 pH meter (Jenway, Ltd., Essex, UK).
Table 4-1 ICP-MS operating conditions for the determination of 'total' selenium and selenium species in yeast and Biogurt~ by HPLC-ICP-MS, using isotopes 77, 78 and 82.
ICP-MS
Parameters
Plasma Quad 2+
V -groove nebulizer
Double-pass, water cooled Scott type spray chamber
Fassel torch - 1.5 mm bore injector
Nebulizer flow rate 0.81 I min.
Coolant gas flow rate 13.1 1 min'1
Auxiliary gas flow rate 0.81 min'1
Forward power 1350W
Dwell time 500ms
154

4.2.2 Scanning eledron microscopy
A JEOL JSM 6100 electron microscope (Oxford Instruments, Oxford, UK)
interfaced with an Oxford CT 1500 cryo-trans low tempemture station (Oxford
instruments) was used to view yeast cell structure.
4.2.3 Chemicals and reagents
All commercial chemicals were of analytical grade and used without further
purification. Sodium selenate, sodium selenite, selenomethionine and
selenocystine (Sigma Aldrich Chem. Co., Poole, Dorset, UK) were used as stock
solutions of 1000 J.lg mr1 as the element. They were prepared using Milli-Q water
(Milli-pore, Bedford, MA, USA) and stored in the dark at 4°C. Solutions of the
compounds for daily use were prepared by appropriate dilution from the stock
solutions. Methanol (Fisher Chemicals), 25% tetramethylammonium hydroxide
(TMAH) in MeOH and 25% potassium hydroxide in MeOH (Sigma Aldrich)
were used in the preparation of solutions for extraction procedures. Cellulase,
protease type XIV, trypsin and pancreatin (Sigma-Aldrich) were used for
enzymatic extraction procedures. Buffer solutions were prepared from
ammonium hydrogen carbonate and ammonium acetate (Sigma-Aldrich).
Hydrochloric acid (Fisher Chemicals) was used for digestion procedures and
neutralization ofKOH solutions.
155

4.2.4 Chromatographic conditions for selenium speciation
Anion-exchange chromatography
Experiments using anion-exchange HPLC were carried out using a Dionex AS 11
column (250 x 4.1 mm, Dionex) packed with a 10 lllll styrene - divinylbezene
polymer resin with quarternary ammonium functional groups together with a
guard column (50 x 4.1 mm) of the same material. The mobile phase used was a
step gradient elution employing a solution of 10 mM and 50 mM NH4HC03 +
10% MeOH at pH 5, adjusted with CH3COOH. The program for elution is given
in Table 4-2. An eluent flow rate of 1.0 ml min"1 was used throughout.
Table 4-2 Elution programme for anion-exchange HPLC of selenium species using a Dionex AS 11 column
Concentration 0-3 mins 3- JOmins 10-15 mins
10 mM NHJIC03 + 10% MeOH 100% 0% 100%
(adjusted to pH 5)
50 mM NHJIC03 + 10% MeOH 0% 100% 0%
(adjusted to pH 5)
Cation-exchange chromatography
Cation-exchange HPLC was carried out using a Partisil SCX 1 0 column (250 x
4.6 mm, Phenomenex) packed with a silica gel of 10 J.Ull particle size with a
guard column (50 x 4.6 mm) of the same material. The mobile phase employed
156

an isocmtic elution using 20 mM pyridine solution adjusted to pH 3 with
HCOOH (98%, v/v) and with an eluent flow mte of 1.0 ml min-1
being used
throughout.
4.2.5 Sample preparation procedures
HN03 microwave digestion for 'total' selenium determination in samples
Microwave bombs (Savillex, Minetonka, Minnesota, USA) were pre-cleaned
with 3 ml 69% v/v HN03 (Primer, Fisons, Loughborough, UK) in a Perfecto 800
W microwave (DeLonghi, Italy) oven on medium power for 2 mins. Samples of
approximately 0.25 g were accumtely weighed into the bombs and 4 mi HN~
(69%, v/v) together with 1 ml H202 (37%, v/v) were added. The bombs were
loosely capped and left overnight to allow easily oxidised material to be
destroyed. After predigestion, the bombs were swirled gently, sealed tightly and
microwaved on medium power for 1 - 2 mins, or until the sample was a clear
colour with no residue (indicating a completed digest). The samples were
transferred quantitatively to volumetric flasks and made up to volume with 2%
HN03 giving an ovemll dilution of x2000. The samples and standards were
spiked with indium to give a final concentmtion of 100 llg r• Indiurn (In), which
acted as an internal standard, prior to analysis by ICP-MS using the conditions
described in Table 4-1. The internal standard was used to correct for instrumental
drift (sample viscosity effects, mass tmnsport, etc.) over the analysis period.
157

Eleven extraction procedures for the determination of selenium species were
evaluated using the 'new processed' selenized yeast sample (referred to as yeast
A from here onwards) and the Biogurt® sample together with the previously
analyzed candidate reference material, selenized yeast from Pharma Nord
(Pharma Nord, Vejle, Denmark), acting as a reference material. To date, there are
no commercially available CRMs for selenium species in yeasts. The Pharma
Nord selenized yeast which has been extensively measured and also has a
concentration of selenium similar to that of the yeast sample under investigation,
suitably fits the validation requirements for this study.
Enzymolysis extraction procedures
I. Samples of approximately 0.25 g were accurately weighed together with
0.025 g protease XIV (Sigma-AJdrich, Dorset, UK) and approximately 20 ml
NRtHC03 (O.l M, pH 8). The solutions were homogenized in a 'Potter'
homogenizer, transferred to polyethylene centrifuge tubes and placed in a
shaking water bath at 37°C for a minimum of 4 hours. The samples were
centrifuged at 2500 rpm for 20 min, the supematant transferred quantitatively
to volumetric flasks and made up to volume with the NH.tHC03 buffer.
Samples and standards were spiked with caesium to give a final concentration
of l 00 llg r1 Cs that acted as an internal standard prior to analysis. Cs was
used instead of In due to the change in pH conditions and reduced solubility
for In at pH 8. Protease type XIV, a non-specific protease which breaks
peptide bonds of any protein present in the sample, results in anJino acid
158

information only. The buffer employed was NH.tHC03 (0.1 M, pH 8) as the
optimum activity of protease type XIV is at pH 8 133•
2. Samples of approximately 0.25 g were accurately weighed together with
0.025 g cellulase (Sigma-Aldrich, Dorset, UK) and approximately 20 ml
CH3COONH.t (0.1 M, pH 5). The solutions were homogenized in a 'Potter'
homogenizer, transferred to polyethylene centrifuge tubes and placed in a
shaking water bath at 3'PC for a minimum of 4 hours. The samples were
centrifuged at 2500 rpm for 20 min, the supernatant transferred quantitatively
to volumetric flasks and made up to volume with the CH3COONH.t buffer
giving a final dilution of x2000. Samples and standards were spiked with
caesium to give a final concentration of I 00 Jlg r 1 Cs that acted as an internal
standard prior to analysis.
3. Samples of approximately 0.25 g were accurately weighed together with
0.025 g pancreatin (Sigma-Aldrich, Dorset, UK) and approximately 20 ml
NH.tHC03 (0.1 M, pH 8). The solutions were homogenized in a 'Potter'
homogenizer, transferred to polyethylene centrifuge tubes and placed in a
shaking water bath at 3'fC for a minimum of 4 hours. The samples were
centrifuged at 2500 rpm for 20 min, the supematant transferred quantitatively
to volumetric flasks and made up to volume with the NH.tHC03 buffer.
Samples and standards were spiked with caesium to give a final concentration
of 100 Jlg r 1 Cs that acted as an internal standard prior to analysis. Pancreatin
159

contains a mixture of enzymes including amylase, trypsin, lipase,
ribonuclease and protease.
4. The final enzyme extraction procedure employed trypsin. Samples of
approximately 0.25 g were accurately weighed together with 0.025 g trypsin
and approximately 20 m1 NI-4HCO:J (0.1 M, pH 8). The solutions were
homogenized in a 'Potter' homogenizer, transferred to polyethylene
centrifuge tubes and placed in a shaking water bath at 31'C for a minimum of
4 hours. The samples were centrifuged at 2500 rpm for 20 rnin, the
supematant transferred quantitatively to volumetric flasks and made up to
volume with the NI4HC03 buffer. Samples and standards were spiked with
I 00 ~ r1 Cs that acted as an internal standard prior to analysis. Trypsin is an
enzyme that will break peptide bonds next to specific amino acids, namely
arginine and lysine. This results in polypeptides being broken into shorter
chains.
MeOH:H20 extraction procedures
5. Samples of approximately 0.25 g were accurately weighed into polyethylene
centrifuge tubes to which 10 m1 MeOH:H20 solution (75:25) was added. The
samples were placed in an ultrasonic bath for 40 min, centrifuged at 3000 rpm
for 15 rnin and the supematant transferred to round-bottomed flasks. The
procedure was repeated twice more and the washings were combined in the
flasks (total of 30 ml). The samples were taken to dryness by rotary
evapomtion at 40°C. Sample residues, following rotary evapomtion, were re-
160

dissolved in Milli-Q water and transferred quantitatively into volumetric
flasks and made up to volume with an overall dilution of x2000. Samples and
standards were spiked with 100 1-1g r1 Cs that acted as an internal standard
prior to analysis.
6. The above MeOH:H20 extraction technique was repeated using sample
material that had been freeze-dried prior to use.
HCI digestion procedure of samples
7. Samples of approximately 0.25 g were accurately weighed into polyethylene
centrifuge tubes to which 35 ml 0.01 M HCl (pH 2) was added. Hydrochloric
acid at pH 2 was chosen as it closely mimicked the pH found in the human
stomach. They were placed in a shaking water bath at 3 7°C for a minimum of
4 hrs then centrifuged with the supematant being transferred quantitatively to
volumetric flasks and made up to volume in HCl (0.01 M, pH 2). Samples
and standards were spiked with I 00 1-1g r 1 In that acted as an internal standard
prior to analysis.
8. Multi-step extraction procedure using enzymolysis techniques (protease) and
MeOH
The following extraction technique comprised three stages of extraction and
analysis
• to accurately weighed samples, of approximately 0.25 g, in polyethylene
centrifuge tubes 25 ml 0.1 M NRtHC03 (pH 8) was added. They were placed
161

in a shaking water bath at 3~C for a mmunum of 4 hrs. Following
centrifugation at 3000 rpm for 15 min, the supernatants were transferred
quantitatively to volumetric flasks and made up to volume with the NH.tHC03
buffer with a final dilution ofx2000. Samples and standards were spiked with
100 Jlg r 1 Cs that acted as an internal standard prior to analysis.
• to the residues from the first stage, 0.025 g protease was added together with
35 ml 0.1 M NH.tHC03 and placed in a shaking water bath at 3~C for a
minimum of 4 hrs. Following centrifugation, the supematants were
transferred to volumetric flasks and made up to volume with the Nl4HC03
buffer. Samples and standards were spiked with lOO Jlg r 1 Cs that acted as an
internal standard prior to analysis.
• To the residues from the second stage, a solution of 10 ml MeOH:H20 75:25
was added and the samples placed in an ultrasonic bath. for 40 min, then
centrifuged at 3000 rpm for 15 min and the supematant transferred to round
bottomed flasks. The procedure was repeated twice more and washings were
combined in the flasks (total of 30 rnl). The samples were taken to dryness by
rotary evapomtion at 40°C. Sample residues, following rotary evaporation,
were re-dissolved in Milli-Q water and transferred quantitatively into
volumetric flasks. Samples and standards were spiked with 100 Jlg r• Cs that
acted as an internal standard prior to analysis.
162

9. Potassium hydroxide (KO H), 25% v/v, in MeOH solution.
Samples of approximately 0.25 g were accurately weighed into polyethylene
centrifuge tubes to which 35 ml 0.1 M NRtHC03 (pH 8) was added. They
were placed in a shaking water bath at 3'f>C for a minimum of 4 hrs, then
centrifuged with the supernatant being decanted to waste. To the residues, 3
ml KOH 25% in MeOH was added and sonicated at 70°C for 4 hours. The
solutions were neutralized with 3 ml HCl (50% v/v), transferred
quantitatively to volumetric flasks and made up to volume with Milli-Q
water. Samples and standards were spiked with 100 J.Lg r• Cs that acted as an
internal standard prior to analysis.
I 0. Tetra-methylammonium hydroxide (TMAH), 25 % v/v, in MeOH
Samples of approximately 0.25 g were accurately weighed into polyethylene
centrifuge tubes to which 35 ml 0.1 M NH.tHC03 (pH 8) was added. They
were placed in a shaking water bath at 3'f>C for a minimum of 4 hrs, then
centrifuged with the supematant being decanted to waste. To the residues, 3
ml TMAH 25% in MeOH was added and sonicated at 70°C for 4 hours. The
solutions were neutralized with HCl (50% v/v, 3 ml), transferred
quantitatively to volumetric flasks and made up to volume with Milli-Q
water. Samples and standards were spiked with 100 J.Lg r• Cs that acted as an
internal standard prior to analysis.
163

11. Multi-step extraction procedure usmg HCl and protease enzymolysis
techniques.
The foUowing extraction technique comprised two stages of extraction and
analysis.
• Samples of approximately 0.25 g were accurately weighed into polyethylene
centrifuge tubes to which 35 ml 0.01 M HCl (pH 2) was added. They were
placed in a shaking water bath at 3'fJC for a minimum of 4 hrs. The solutions
were neutralized by the addition ofO.lM NaOH (approximately 3 ml).
• To this solution, protease was added and the samples placed in a shaking
water bath as before for a minimum of 4 hrs. The samples were centrifuged
and the supernatant transferred quantitatively to volumetric flasks. Samples
and standards were spiked with 100 ~g 1'1 Cs that acted as an internal standard
for the analysis.
Mass balance calculations
The nitric acid microwave digestion technique, previously described, was used
for the determination of any remaining selenium in residues following the various
extraction procedures for the purposes of mass balance calculations.
164

4.3 Results and discussion
The results obtained from the extraction procedures detailed, are shown in Table
4-3. All results are given in mg kg·• as the element. Extraction efficiencies were
calculated based upon the 'total' selenium HN03 microwave digest values
obtained and are shown in Table 4-4, together with mass balance data. The yeast
sample obtained from Pharma Nord was not subjected to all extraction
procedures as the selenium content was adequately retrieved by enzymolysis
using either protease XIV or trypsin, following which, it was successfully
analyzed by HPLC-ICP-MS for species determination.
The use of enzymolysis techniques for the extraction of selenium from biological
samples without species conversion is frequently reported in the literature. A
method developed by Gilon et al. 133 using protease with > 90% extraction
efficiencies of the total selenium has been widely used by workers 179•
180•
Protease, a proteolytic enzyme, is capable of breaking peptide bonds of any
protein present in a sample. This allows measurement of selenoamino acids but
with the subsequent loss of information concerning, if present, any original
selenium-containing proteins 181•
The results obtained in this study when using protease gave 90% extraction
efficiencies for the selenized yeast samples obtained from Pharma Nord.
However, the results obtained for yeast A and the biogurt were 19% and 15%,
respectively, compared with the 'total' selenium values determined by the HN03
165

digest (nominal values specified by the manufacturers for yeast A are 1000 mg
kg"1 and for Biogurt® 2000 mg kg-1). The remaining selenium was found to be
present in the residue. In view of this, enzymes were tested whose site of activity
on the sample matrix may provide an alternative digestion process and hence, an
improved extraction of the selenium species.
166

Table 4-3 Total selenium detennination by aU extraction techniques. Results given in mg kg-1 as
the element, Se, and RSDs in parentheses.
Extraction technique PharmaNord yeast Yeast A Biogurt®
HN03 microwave - T 1282 ± 24 (1.02) 984 ± 12 (0.6) 1980 ± 95 (2.5)
Protease- T 1157 ± 73 (3.5) 190 ± 5.1 (1.6) 301± 27 (4.6)
Rz 123 ±6 837±41 (2.7) 1640 ± Ill (3.5)
CeUulase- T 771 ± 35 (2.5) 123 ± 14 (5.9) 743 ±46 (3.3)
R 466±25 632± 14 (1.2) 1055 ± Ill (3.2)
Pancreatin - T ~ 117 ± 4.5 (2.1) 411 ± 11 (1.5)
Trypsin- T 1305 ± 92 (3.7) 109 ± 6.7 (3.4) 352 ± 42 (6.1)
MeOH:HzO- T 390 ± 19 (2.6) 141 ± 0.85 (0.3) 411 ± 30 (3.8)
R 782 ±49 616 ± 22 (1.9) 1666 ± 87 (2.9)
MeOH:HzO- T NP 140 ± 16 (6.1) 527 ± 25 (2.5)
Freeze-dried - R 513±29(3.01) 1380 ± 1.9 (0.07)
HCI- T NP 74.9 ± 5.5 (4.1) 1405 ± 79 (3.1)
R 305 ± 5.1 (0.9) 42.6 ± 1.1 (1.5)
Stage i) NHJ{C03 - T 180 ± 3.5 (1.1) 70.5± 6.1 (4.5) 1222 ± 102 (4.3)
Stage ii) protease - T NP 174± 16 (4.6) 44.8 ± 2.7 (3.5)
Stage iii) MeOH:H20 - T NP 3.08 ± 039 (7.3) 53.6 ± 7.1 (6.6)
R 278 ± 12 (2.4) 219 ± 22 (5.1)
KOH- T NP 714 ± 60 (4.7) 237 ± 22 (5.1)
TMAH- T NP 789 ± 74 (5.4) 292 ± 29 (5.6)
HCI + protease - T 1191 ± 108 (4.7) 74.9 ± 2.6 (3.5) 934± 80 (4.6)
R 87±6 491 ± 29 (3.1) 155 ± 27 (9.4)
1 T- totals in solution 2 R- totals in residues, by HN03 microwave digestion, from individual techniques 3 NP -not perfonned
167

Table 4-4 Extraction efficiencies and mass balance data for samples under investigation. Results are given in mg kg"1 as the element, Se.
Extraelion Mass balance,
ejjiciencies, % % ••
PharmaNord Yeast A Biogurl® PharmaNord Yeast A Biogurl®
Protease
90±4.6 19±0.73 15 ± 1.9 99±5 104±6 98± 12
Cellulase 60± 1.6 12 ± 1.5 38±3.9 96±5 77±4 91 ± 10
Pancreatin
NP 12 ±0.6 21 ± 1.4 NP NP
Trypsin
102±8.9 11 ± 0.8 18 ±2.8 102 ± 8.9 NP NP
MeOH:HzO
30±2.0 14±025 21 ± 2.4 91 ±6 77±3 105 ± 11
MeOH:HzO
Freeze-dried NP 14 ± 1.8 27 ±2.4 66±6 96±6
HCI
NP 7.2 ± 1.4 71 ± 7.1 39 ±I 73 ± 8
Stage i) NH,JIC03
14 ±2.5 7.3±0.70 62 ±7.7 53 ±4 77 ± 11
Stage ii) protease
NP 18 ± 1.8 2.1 ±0.24
Stage iii)
MeOH:HzO 0.3 ±0.04 2.7 ± 0.51
NP
KOH
NP 73 ±7.3 12 ± 1.6 NP NP
TMAH
NP 80±8.9 11 ± 2.1 NP NP
HCI + protease
93 ± 10 7.6 ± 0.4 47 ±6.0 99±6 58±4 55±7
• NP ~ not performed •• Mass balance = (enzyme totals + residue totals) I totals by HN~ digests * I 00
168
A cellulase extraction was performed which proved to be less successful for the
Phanna Nord yeast, yielding only 60% of the selenium; cellulase gave poor
extraction efficiencies (12%) for yeast A, as had the protease, which gave an
extraction efficiency of 19%. Although cellulase targets cellulose cell walls
which are found only in plant tissue, cellulase was considered due to the
ambiguity surrounding the classification of yeasts. It was thought that cellulase
may release any selenium species trapped in the cell walls of the samples as
results obtained following the protease extraction suggested that most of the
selenium remained in the insoluble residue.
The use of cellulase was not expected to be effective for the Biogurt® as this
material was bacterial in nature. Despite this, the extraction of selenium from the
biogurt using this enzyme gave a 38% efficiency. Although this is considerably
low and would not provide a representative picture of the selenium species in the
Biogurt®, it is more than twice the extraction efficiency obtained when using
protease. The reason for this is unclear as although bacteria possess cell walls in
addition to cell membranes they are analogous rather than homologous to that of
plant cells. Bacterial cell walls largely contain peptidoglycan, polymers of
modified sugars cross-linked by polypeptides, as opposed to plant cell walls
which are constructed of cellulose.
Enzymolysis using trypsin proved to be effective for the extraction of selenium in
the Pharma Nord yeast yielding 100% of the selenium present However, the
extraction efficiencies for yeast A and Biogurt® were found to be 11 and 1 8%,
169

respectively. Similar results were obtained when employing pancreatin for the
two materials. The PharmaNord yeast was not tested using pancreatin as it
contains a mixture of enzymes including protease and it was, therefore,
considered that the extraction efficiency would prove to be satisfactory.
Mass balance calculations demonstrated that the remainder of the selenium from
the cellulase and protease extraction procedures was to be found in the solid
residue. Determination of the selenium content in the residues following
pancreatin and trypsin digestion was not carried out as similar patterns of
extraction efficiencies were seen with these enzymes leading to the supposition
that the non-extractable selenium remained in the residue.
In response to the poor extraction efficiencies obtained for yeast A and Biogurt®
using enzymes, methods were considered that might shatter the cell walls of the
material to release the cell contents which might, therefore, enhance the
extraction process. Commencing with the Pharma Nord yeast and yeast A
samples, which were supplied in powder form, the samples were soaked in a
sucrose solution to assess the activity of the yeasts. The Pharma Nord yeast
responded by producing a gas, presumably C02, and gave off a characteristic
yeast aroma When viewed by light microscopy, budding of the cells was
visualized indicating a live yeast sample. For yeast A, in similar circumstances,
no activity was noted. Following on from this, the samples were soaked in water
to attempt re-hydration prior to freezing with liquid N2 (boiling point @ -196°C)
in order to assist in fracturing the cell walls. The two yeast samples were viewed
170

by electron microscopy before and after freezing in liquid N2 to assess any
apparent changes in the integrity of the cell walls. It was discovered that yeast A
cells were already fractured prior to freezing and that the Pharma Nord yeast cells
remained intact throughout. It was subsequently revealed that the cell walls of
yeast A bad been destroyed during the manufacturing process by the addition of
papain, an enzyme capable of breaking down cell walls, at the broth stage.
Figures 4-1 and 4-2 show the scanning electron micrographs obtained for the two
yeast samples following freezing.
Figure 4-1 Yeast A viewed by scanning electron microscopy (see section 4.2.2.) following liquid nitrogen freezing.
171

Figure 4-l Phanna Nord yeast viewed by scanning electron microscopy (see section 4.2.2.) following liquid nitrogen freezing.
Electron rnicroscopy of the Biogurt® sample gave no indication of the structure
of the cells before or after freezing by liquid N2. In light of these results no
further work was carried out with liquid N2.
MeOH:H20 extraction of selenium compounds from a yeast matrix has been
reported by Pedersen and Larsen 182. The research carried out suggests that this
technique is of limited use with extraction efficiencies of 15 - 20% being
reported. However, due to the poor extractions obtained from the enzymolysis
experiments for yeast A and biogurt a MeOH:H20 extraction (procedures 5 and
6) was employed to see if the samples were more amenable to this than enzyme
extraction. The solutions were prepared with the material as supplied from the
manufacturers and following freeze-drying at -60°C under vacuum (a slower
process than freezing by liquid N2 whereby the crystal structure of the ice may 172

pierce the cell walls precipitating the release of cell contents). A 30% extraction
of the total selenium content was obtained for the Pharma Nord yeast which was
an improvement on the previously reported research 182• The general distribution
of selenium in yeast samples has been studied 174 with approximately 10% being
water-soluble and the remaining selenium being present in a bound form. Of this
fraction it is thought that 50% of the selenium is probably bound to proteins or
other large organic molecules. The improved extraction in this case, may arise
from the selenium being compartmentalized in amounts that vary according to the
sample type. Unfortunately, the extraction of selenium from yeast A and
Biogurt® using MeOH:H20 was 14% and 21%, respectively, supporting the
research findings of Pedersen and Larsen 182. The experimental results obtained
with the addition of freeze-drying of the material gave a slightly better extraction,
at 27%, for the Biogurt®. However, no improvement was seen for yeast A.
Analysis of the sample residues following MeOH:H20 by HN03 microwave
digestion demonstrated the presence of the remaining selenium for Pharma Nord
yeast and the Biogurt® but not all of the selenium in yeast A was accounted for.
A review of the mass balance for yeast A in most of the extraction techniques
demonstrated similar findings. Occasionally this phenomenon was seen for
Biogurt® as well, most particularly where HCl extraction has been used,
including the sequential extraction by HCl and protease. One reason for poor
mass balance results may be due to loss of analyte to walls of the containers. This
conjecture does not account for the fact that yeast A is, in general, more
susceptible to losses than the Biogurt®. Factors involved that could account for
173

the differences between the two samples may include matrix interferences in the
plasma The use of internal standards and matrix-matched standards were used, as
far as was practicable, to reduce these effects.
A review of the results obtained for yeast A and Biogurt® samples in extraction
procedures 7 (HCI, pH 2 digestion) and 8 (multi-step extraction using: I,
~HC03; 2, protease; and 3, MeOH:H20) demonstrated a 71% extraction
efficiency for the biogurt sample where the solution pH was strongly acidic
(procedure 7, pH 2). Where ~C03 has been used, prior to the introduction of
an enzyme (procedure 8, stage i) the extraction efficiency was 62%. Research
carried out by Emteborg et a/, 183 demonstrated that extraction of selenium
species from a sample of white clover improved with the addition of0.28 M HCI
(to a MeOH:H20 50:50 extractant) from 28.5% to 36.7%, and even more so with
the use of 4% NH3 in place of the HCI, to obtain a 47.6% extraction efficiency. It
is thought that making samples alkaline libemtes selenoamino acids from
possible protein-binding sites 184. In this instance, it appeared that both acidic and
alkaline conditions improved the libemtion of selenium species from the
Biogurt® matrix. Unfortunately, this phenomenon was not seen for yeast A.
Where HCl or ~HC03 have been used alone the extraction efficiency
decreased to single figures. The introduction of protease in the second step of
procedure 8 brought the extraction efficiency for yeast A to a similar level (I9%)
as that reported in procedure I.
174

The extraction techniques discussed so far did not completely solubilize the yeast
A or Biogurt® matrix. Procedure 8 was devised to utilize this effect in providing
information on the distribution differently-bound selenium in the samples.
However, with only 53% of yeast A and 77% of the Biogurt® yeast being
recovered, this mass balance discrepancy lead to a larger uncertainty in the data
obtained following this multi-step procedure.
Following the first stage of extraction using 0.1 M NH.tHCDJ, approximately
60% of the selenium was extracted from the Biogurt®. The results for yeast A
yielded only 7% of the available selenium. The second stage, using protease,
gave similar results for yeast A (18%, compared with 19%) as was seen
previously using this enzyme. The Biogurt® results showed a much lower
extraction (2%, compared with 15%), probably as a consequence of the relatively
high extraction from stage one (62%). The MeOH:H20 extraction, being the third
stage, gave poor results for both samples.
In the case of Biogurt® for this sequential extraction procedure, most of the
selenium was seen following the first stage of extraction using NH4HC03 at pH 8
(62%). This was one of the highest extraction efficiencies of selenium seen for
Biogurt® in any of the procedures considered. This suggested that the extractable
selenium was predominantly water-soluble. Addition of enzymes appeared to
have a suppressive effect where aqueous solutions were used reducing the overall
extraction efficiency of the selenium.
175

The yeast A sample yielded the most selenium following the protease extraction
(stage two) which was in keeping with the results obtained for the initial protease
extraction technique (procedure 1). The Pharma Nord yeast subjected to the same
sequential extraction procedure gave an extraction of 14% of the total selenium
after the first stage (Nf4HC03, O.lM, pH 8) indicating that this sample also
required the use of the protease enzyme for release of the available selenium,
where efficient extractions had previously been recorded following procedure 1.
The two-step procedure using 0.01 M HCl followed by a protease digest was
chosen as this closely mimicked gastrointestinal conditions in humans. The
results showed a highly efficient extraction for the Pharma Nord yeast at 93%.
However, the extractions for yeast A were 7.6% and 47% for the Biogurt®. Mass
balance calculations show a large discrepancy giving rise to uncertainty in the
results obtained.
Further extraction methods utilized KOH (25%) in MeOH and TMAH (25%) in
MeOH which gave complete solubulization of yeast A and the Biogurt® sample.
Results for extraction efficiencies were 73 and 80%, respectively, for the yeast
sample and 12 and 11% for the Biogurt®. The poor extraction obtained for the
Biogurt® using KOH and TMAH is unclear. Workers that have reported the use
of TMAH for the extraction of selenium species from yeast noted that there was
degradation of the organic selenium species initially present to that of inorganic
selenium, most probably selenite 181• In this experiment, anion-exchange
chromatography demonstrated the presence of selenite and selenate in yeast A,
176

V. ~
f.i § e c.;
following extraction with TMAH and KOH, by the matching of retention times
with that of standards using HPLC-ICP-MS. A chromatogram of four selenium
standards is shown in Figure 4-3. A chromatogram of yeast A following
extraction using TMAH is shown in Figure 4-4 demonstrating the presence of
selenite and selenate. Chromatograms of yeast A following KOH extraction were
similar to the one shown for TMAH extraction and are therefore not reproduced
here. In view of the poor extraction efficiency of selenium in the Biogurt®
sample and that species conversion was shown to occur in yeast A, no speciation
determination was carried out for the Biogurt® sample. The high alkalinity of the
TMAH and KOH appears to cleave the selenium from the organic molecule to
give the bare inorganic ions.
10000 1 9000
4 8000
7000
6000
5000 2 3
4000
3000
2000
1000
200 400 000 000 1000 1200
Time(s)
Figure 4-3 Chromatogram of 4 selenium standards, I 00 11g r1, employing a Dionex AS 11 anion
excharuze HPLC column using the conditions described in Table 4-2. Peaks: I= Secys; 2 = SeMet; 3 = Se111; 4 =Se VI.
177

Figure 4-4 Chromatogram of yeast A following selenium extraction by TMAH employing a Dionex AS 11 anion-exchange HPLC column using the conditions described in Table 4-2. Peaks: 1 = SeiV; 2 =Se VI.
The two-step procedure usmg 0.01 M HCl followed by a protease digest
(procedure 11), despite the limited extraction efficiencies (yeast A, 7.6% and
Biogurt®, 47%), it was calculated that the extractant of yeast A should contain 76
mg kg-1 of selenium and for the Biogurt®, 940 mg kg-1 of selenium. Although the
extractants might not provide an overall accurate reflection of the whole sample,
investigations into the species present were embarked upon. The two extracts,
together with the Pharma Nord yeast, were introduced onto a Dionex AS 11
anion-exchange column, using the chromatographic conditions described in Table
4-2, for the purposes of speciation determination. No inorganic selenium was
detected in any sample and, therefore, further analysis was carried out using an
isocratic elution programme employing 10 mM NRtHC03 + 10% MeOH
178

"' --~ u
adjusted to pH 5 with an eluent flow rate of 1.0 ml min"1• A chromatogram of
selenium standards is shown in Figure 4-5. Chromatograms of yeast A, Biogurt®
and Phanna Nord yeast extracts are shown in Figures 4-6, 4-7 and 4-8,
respectively. Both yeast A and the Biogurt® sample under investigation gave a
peak with a retention time similar to SeCys whilst the Pbarma Nord yeast gave a
single peak matching the retention time of the SeMet standard.
I 2500 ...
2000
1500
2 1000
500
.. 100 ... 300 .. 0
Time (s)
Figure 4-5 Chromatogram selenium standards, 50 J.1g 1"1, employing a Dionex AS 11 anion·
exchange HPLC column using the conditions described in Table 4-2. Peaks: I= SeCys; 2 = SeMet
179
•••

"' § 0 u
Ul
§ 0 u
••• I ... ... ... ... ... ••• ... ... ••
•• • •• ... • •• ... .. . ... • ••
Time(s)
Figure 4-6 Chromatogram of yeast A following extraction by HCI and protease (procedure I I) employing a Dionex AS 11 anion-exchange HPLC column using the conditions described in Table 4-2. Peak I ascribed to SeCys.
t80D
14110
1200
1000
•••
800
400
200
Time (s)
Figure 4-7 Chromatogram of biogurt following extraction by HCI and protease (procedure I I} employing a Dionex AS 11 anion-exchange HPLC column using the conditions described in
Table 4-2. Peak I ascribed to SeCys.
180
...

"' ~
I u
1
noo
:1500
~ClOD
1~00
1000
... .. . .. ... "'
... . .. ...
Time (s)
Figure 4-8 Chromatogram of Pbarma Nord yeast following extraction by HCI and protease (procedure! I) employing a Dionex AS 11 anion-exchange HPLC colwnn using the conditions described in Table 4-2. Peak I ascribed to SeMet.
Research carried out by Bird et al. 174 demonstrated that where two methods of
extraction had been compared, the first where yeast was added to water and
shaken at 85 - 90°C for 1 h and the second where protease had been used in a
similar manner to that reported by Gilon et al. 133 and also used in this work, the
speciation profile for the yeast differed. Both extraction methods demonstrated
the presence of the same species (inorganic selenium, SeCys, SeMet and
methylselenocysteine) but where protease had been used SeMet became the most
dominant form. In the work presented here, the Pharma Nord yeast was found to
contain SeMet as the major selenium-containing compound. The predominance
of Se Met in the presence of protease suggests that Se Met is compartmentalized in
181

yeast within selenium-containing proteins of which 90% was extractable using
protease.
These results suggested that the types of yeast (Phanna Nord yeast and yeast A)
possessed some similarities in that they both required the use of protease to
liberate selenium indicating the presence of selenium-containing proteins.
However, the significant differences seen in the efficacy of the enzyme extraction
suggested that the compartmentalization of the selenium in the two yeasts was
substantially different from one another. Most of the selenium in yeast A (ranging
from 37- 85%) appeared to remain in the residue in a non-extractable form.
Quantification of the peaks gave the results that are shown in Table 4-5.
Table 4-5 Results for the speciation of selenium in the three samples under investigation. Results given in mg kg·• as the element
Total Total
HCI and protease SeCys SeMet
Pharma Nord yeast 1282 ± 24 1191 ± 108 1005 ± 71
Yeast A 984 ± 12 74.9±2.6 1.59 ± 0.43
Biogurt® 1980 ± 95 934 ± 80 5.25 ±0.92
182

The results obtained for the quantification of selenium by HPLC-ICP-MS
demonstrated a poor mass balance for the yeast A and Biogurt® samples, with
only 2% of the selenium in yeast A and less than l% in the Biogurt® being
accounted for. One way to check recovery of the selenium species injected onto
the column was by evaluation of the peak areas obtained by flow-injection (FI)
ICP-MS compared with the area of the peaks obtained using anion-exchange
HPLC-ICP-MS. Standards of SeCys and SeMet gave similar peak areas for both
techniques as did the Pharma Nord yeast sample. However, the peaks obtained by
FI-ICP-MS for yeast A and Biogurt® were significantly larger than those
obtained using HPLC-ICP-MS. This suggested that the selenium species in these
samples were strongly retained by the column. Lack of complete recovery of
species due to on-column retention was also reported by Bird et al. 174 but only
by 10-20% of the expected amount. Strongly acidic compounds may be retained
on an anion-exchange column and, therefore, further investigations were carried
out using a cation-exchange Partisil SCX l 0 HPLC system with the conditions
described in Section 4.2.4. A chromatogram of SeCys and SeMet standards
together with the yeast A and Biogurt® samples is shown in Figure 4-9.
183

I 2 3 4
Time (s)
Figure 4-9 Chromatogram of the yeast A and Biogurt® samples and SeCys and SeMet standards by cation-exchange HPLC-ICP-MS using a Partisil SCX 10 column (250 x 4.6 mm) and a 20 mM pyridine eluent adjusted to pH3. Peaks: I = yeast A; 2 = Biogurt®; 3 = SeCys standard, I mg 1"
1;
4 = SeMet standard, I mg 1"1•
The chromatogram shown in Figure 4-9 using cation-exchange conditions
demonstrates the lack of resolution between the samples and standards. This can
be explained by the zwitterionic character of the selenoamino acids and that
under the pH conditions employed (pH 3) they will possess cationic groups and,
therefore, have a limited affinity for the stationary phase. Although optimization
has not been achieved here it can be seen that the yeast A and Biogurt® samples
do not match the retention times of either of the standards used. Where anion-
exchange chromatography was performed (Figures 4-5 to 4-8) the yeast A and
Biogurt® samples appeared to elute with a similar retention time to that of
184

SeCys. However, the cation-exchange chromatography points towards the
possibility that the samples may not contain SeCys or SeMet but other,
chemically similar, amino acids. Comparison of peak areas by Fl-ICP-MS and
cation-exchange HPLC-ICP-MS also demonstrated the effect on-column of
retention of sample analyte.
4.4 Conclusions
Research 131 has shown that yeast-based selenium food supplements can
demonstrate a significant variety in the selenium species present with some
brands showing generally low recoveries of any fonn of selenium, and may have
matrix problems which make effective extraction difficult. Work carried out by
Gilon, et al. 133 has demonstrated the efficacy of enzyme-based extractions using
protease. In the work presented here, it was found that the selenium content, in
the form of SeMet, was adequately extracted from the Pharma Nord yeast using
protease which yielded 90% of the 'total' selenium content. However, the
determination of 'total' selenium and selenium species in the yeast A and
Biogurt® samples proved to be quite problematic. A variety of extraction
methods were employed with limited success. Methods that avoided species
conversion and with the highest extraction efficiencies were found to be: i) the
use of protease for yeast A and: ii) the use of 0.01 M HCl for the Biogurt®.
Speciation of these samples by anion and cation-exchange HPLC-ICP-MS was
hampered, partly because of the limited extraction efficiencies of the samples and
185

by the retention of the analyte on-column and by the lack of standards available
for matching of retention times.
Limitations may be imposed on the extraction techniques commonly available
where identification of selenium species in these new, to be commercially
available, bionutrients are studied. At present, the only selenium value obtainable
is that of 'total' selenium using a HN03/H202 microwave digestion procedure.
The retention of species information by 'softer' extraction processes appears to
reduce the overall extraction efficiency with subsequent loss of information. The
results obtained from this study seriously place in doubt the availability of the
organo-selenium species in the yeast A and Biogurt® samples, for which they are
supposedly designed to deliver.
Further work, with the aim of· achieving a successful extraction for 'total'
selenium and selenium species for yeast A, needs to continue with investigation
into the use of p-gluconase, a specific yeast enzyme, although not available
commercially, but which may promote a successful extraction. Consideration of
the use of cell-permeabilizing surfactants to enhance cell wall degradation with
procedures already used in this study may prove rewarding for extraction of
selenium species in both the yeast A and Biogurt® samples.
186

I
,,
! b
I I
,, " .'l
,., n·
'• ! .
' ' - ·~ Jn
\.. I'
•,
Chapterjive
187
,,
S Speeiation of arsenic and selenium using high performance
liquid chromatography with inductively coupled plasma mass
spectrometry and electrospray mass spectrometry.
5.1 Introduction
Numerous instrumental methods have been developed for the separation,
identification and determination of arsenic and selenium species. The most
widely reported techniques have relied on high performance liquid
chromatography together with inductively coupled plasma mass spectrometry
(HPLC-ICP-MS) 92• The chemistries of arsenic and selenium readily allow for
ion-exchange mechanisms to be employed. Control of the mobile phase by choice
of competitive ion, its concentration and pH conditions can lead to the successful
resolution by ion-exchange chromatography of a number of organic and
inorganic arsenic and selenium species, individually 132•
185 and simultaneously
186• Ion-pairing reversed phase chromatography is an alternative chromatographic
mechanism that has often been employed, providing good separation of a number
of arsenic and selenium species 187•
188• However, species identification using
these methods relies on the matching of retention times of analyte peaks with that
of known standards. Due to the numerous fonns and complexity of the analytes
of interest and possible matrix interferences, eo-elution of species may lead to
erroneous results despite the use of an element specific detector. The availability
of standards may also place limitations on the efficacy of the procedure. A case in
188

point is that of arsenoribofuranosides (arsenosugars), which have been known to
eo-elute with AsBet, DMA and MMA under cation and anion-exchange HPLC
ICP-MS conditions 189•
110•
116•
HPLC-ICP-MS has been used with success where materials have been widely
studied and well-characterized. However, when analyzing materials that are new,
or materials where total elemental concentrations are recorded but no information
regarding the species is given and where standards are unavailable for peak
identification, it would seem prudent to find instrumental techniques that can
provide corrobomtive evidence to support that obtained by HPLC-ICP-MS.
Research using molecular specific techniques such as electrospmy ionization
mass spectrometry (ESMS) has enhanced the capability of characterizing
previously unidentified species 190• The complementary use of element specific
ICP-MS together with molecular specific ESMS following HPLC separation of
the analytes of interest provides greater confidence in the assignment of species
identified.
The electrospmy process is a means of obtaining gas-phase ions from solution for
the purpose of analysis by mass spectrometry. This is achieved by applying a
strong electric field to a liquid passing through a capillary tip. An electric field is
genemted by applying a potential difference between the capillary tip and the
counter electrode. ESMS can produce and detect positive and negative ions
depending on the polarity of the electrodes. The choice will reflect on the
experimental conditions used and in which mode the best results are obtained.
189

For data collection, ESMS analyzers can be used in the full-scan mode or
selected ion monitoring (SIM) mode, depending on analytical requirements. The
full scan mode will measure ions across a given mass range providing evidence
of all molecular ions present and their abundance; selected ion monitoring looks
at a limited number of ions dependent on the mass/masses selected by the
operator. The full scan mode is particularly useful when attempting to identifY
previously unreported compounds. However, the mass spectrum obtained can be
highly complex with difficulties arising where there is suppression of the analyte
signal by concomitant matrix ions 191• Using the SIM mode can reduce the effects
of this problem. However, it can be extremely time-consuming unless there is
some prior knowledge of the analytes of interest allowing the operator to select
appropriate masses. The use of the tandem MS (mass spectrometry - mass
spectrometry, MSMS) mode of ESMS provides essential information on
molecular structure that can be used to characterize compounds. The MSMS
function allows fragment patterns, by collision induced dissociation (CID}, of
parent molecular ions to be obtained. Fragmentation pathways are, in part,
determined by the strength of the bonds which are to be broken and the stability
of the product (daughter) ions. Fragment patterns are likely to be exclusive to a
particular molecule and, therefore, explicitly distinguish between the analyte of
interest and any other ion possessing the same molecular mass. Purification of the
target analyte has also assisted in the identification of compounds by ESMS 113
by the reduction of matrix interferences.
190

The work presented here is based on the use of complementary HPLC-ICP-MS
and HPLC-ESMS in the separation and identification of various arsenic species
in extrants from a common brown seaweed, Fucus spiralis (IAEA-140,
International Atomic Energy Agency, Belgium) and a kelp powder, Ascophyllum
nodosum, (Queenswood Health Foods, Bridgewater, UK) available as a health
supplement. A selenized yeast sample extrant (Pharma Nord, Vejle, Denmark)
was subjected to the same techniques enabling identification of the selenium
species present.
Marine algae were chosen for the study as they are known to contain
arsenosugars 21 and they may form a significant part of the human diet,
particularly in Eastern cultures such as the Japanese. It is also noted that marine
algae constitute the basis of some Western vegetarian health supplements.
Arsenosugars are considered to be essentially non-toxic forms of arsenic.
However, research by Le el al. 192 suggested that arsenosugars could be converted
by humans to the more toxic form of DMA, which is a suspected carcinogen.
Research towards the identification and characterization of arsenosugars in
biological samples is, therefore, vital to our further understanding of metabolic
pathways and potential mechanisms of toxicities.
A selenized yeast sample was chosen for investigation due to the scientific
interest propagated by the work of Clark el al. 47 where selenized yeast
supplements were shown to reduce the incidence of some cancers by as much as
50%. The anti-carcinogenic effect of selenium is now known to be species
191
dependent and hence, the characterization and identification of the selenium
species present in yeast has been at the forefront of research. The complementary
use of HPLC with ICP-MS and ESMS can provide substantive evidence on the
species present The selenized yeast sample chosen (Pharma Nord) had
previously been extensively investigated as part of a CRM feasibility study
(Chapter 3). Although the predominant species identified, by all the external
participating laboratories, was that of SeMet, this was mainly based upon their
comparison with known available standards taken through an HPLC separation
technique with element-specific detection. Hence, when a material is assessed
for suitability as a CRM, corroborative evidence of the species present by ESMS
can be, not only advantageous, but critical for future users.
A HPLC method for the speciation of arsenic and selenium compounds,
compatible with both ICP-MS and ESMS detection was developed. This allowed
direct comparisons to be made between the two techniques enhancing their
complementary nature and abilities. As the most effective use of the electrospray
process is achieved when ions are pre-formed in solution, an ion-exchange
chromatographic system using a volatile mobile phase was the system of choice.
Optimum HPLC conditions that were compatible with both ICP-MS and ESMS
were achieved using an ammonium hydrogen carbonate solution with 10%
methanol. Species identification using HPLC-ICP-MS was based upon the
matching of peak retention times with that of known standards with further
confirmation of species identity being obtained from ESMS data. Further
characterization of species was obtained by the use of HPLC-ESMS in the
192

MSMS mode. Solid phase extraction (SPE) techniques were also considered in
order to separate the bulk matrix from samples prior to analysis using ESMS and
method development in this area was undertaken.
5.2 Experimental
5.2.1 Speciation of arsenic compounds using HPLC-ICP-MS and HPLC
ESMS
5.2.1.1 Instrumentation
ICP-MS measurements were performed using a VG PlasmaQuad 2+ (f.J.A.
solutions, Winsford, Cheshire, UK), using conditions as described in Table 5-1.
A Perkin-Eimer 410 high pressure pump (Perkin-Eimer, Norwalk, CT, USA) was
used for control of the eluent flow rate. A Rheodyne 7125 injection valve
(Rheodyne, Cocati, CA, USA) with a 20 Jll sample loop was used for sample
introduction by HPLC-ICP-MS and a 200 J.1l sample loop for HPLC-ESMS.
Nitrogen, 4% v/v, for the reduction of ArCI+ interferences on m/z 75, was added
via a Signal series 850 gas blender (Signal, Camberley, Surrey) to the nebulizer
gas flow.
193
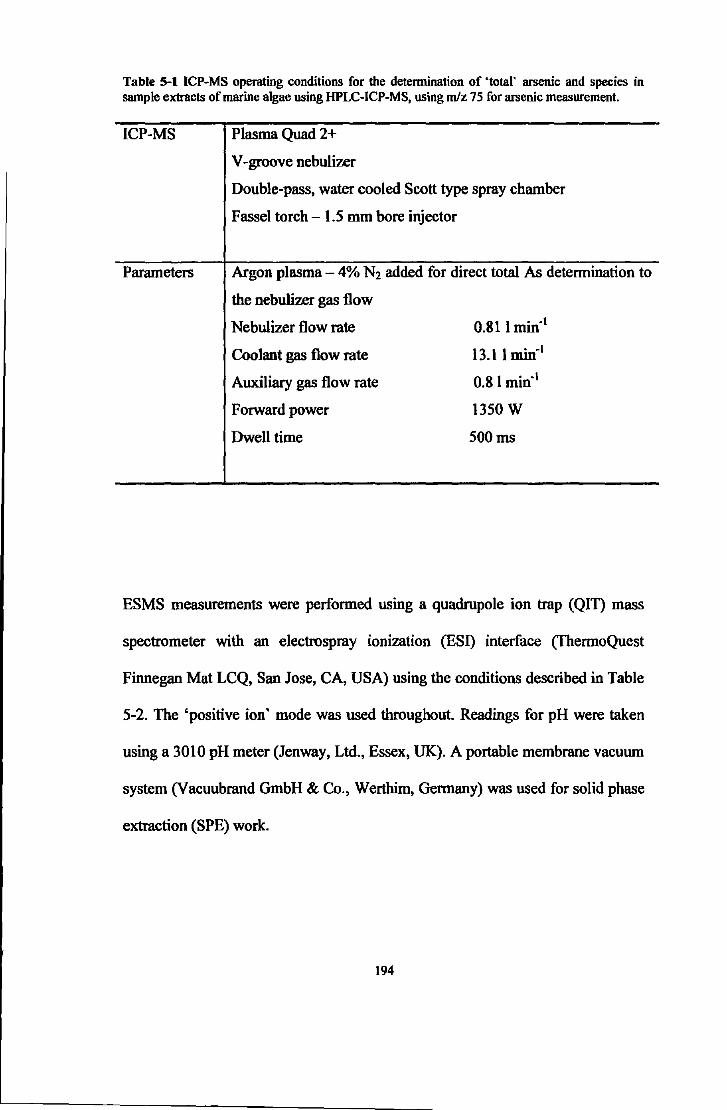
Table 5-l ICP-MS operating conditions for the determination of 'total' arsenic and species in sample extracts of marine algae using HPLC-ICP-MS, using rn/z 75 for arsenic measurement.
ICP-MS
Parameters
Plasma Quad 2+
V -groove nebulizer
Double-pass, water cooled Scott type spray chamber
Fassel torch- 1.5 mm bore injector
Argon plasma- 4% N2 added for direct total As determination to
the nebulizer gas flow
Nebulizer flow rate
Coolant gas flow rate
Auxiliary gas flow rate
Forward power
Dwell time
0.811 min"1
13.11 min"1
0.81 min"1
1350W
500ms
ESMS measurements were performed using a quadrupole ion trap (QIT) mass
spectrometer with an electrospray ionization (ESI) interface (ThermoQuest
Finnegan Mat LCQ, San Jose, CA, USA) using the conditions described in Table
5-2. The 'positive ion· mode was used throughout. Readings for pH were taken
using a 3010 pH meter (Jenway, Ltd., Essex, UK). A portable membrane vacuum
system (Vacuubrand GmbH & Co., Werthim, Germany) was used for solid phase
extraction (SPE) work.
194

Table 5-:Z Instrwnental operating parameters for the identification of arsenic species present in marine algae using direct injection ESMS and HPLC-ESMS.
lnstrumenJ
LCQESMS
Operaling conditions
Spray voltage- 4.5kV
Spray current- sample dependent
Capillary temperature - 220°C
Capillary voltage, 13.98 V
Lens voltage, -14.98 V
Octapole I offset, -0.88 V
Octapole 2 offset, -10.54
5.2.1.2 Chemicals and reagents
Gas flow rates
Direct injection
Sheath- 18 I min"1
Auxiliary- 0 l min"1
HPLC
Sheath - 18 I min"1
Auxiliary- 0.3 l min"1
Chemicals were of analytical grade unless otherwise stated. All lab-ware was
soaked in HN03 {10% v/v) for a minimum of 24 hours and rinsed thoroughly
with MilliQ water (Millipore, Bedford, MA, USA) prior to use. Stock solutions
of arsenobetaine (AsBet) (BCR CRM 626, IRMM, Belgium),
monomethylarsonic acid (MMA) (kindly donated by Dr. A. Moreda-Pineiro,
University Santiago de Compostela, Spain}, dimethylarsinic acid (DMA) and
sodium arsenate (Sigma-Aldrich, Poole, Dorset, UK) at 1000 mg r' as the
element were stored at 4°C in the dark. Standards were prepared daily from the
stock solutions. Cellulase (Sigma-Aldrich) was used in the sample digestion
procedure for the extraction of arsenic species. The mobile phase eluent was
prepared using ammonium hydrogen carbonate (Sigma-Aldrich) and methanol
(Fisher Chemicals).
195

5.2.1.3 HN03 digestion for total element determination
Microwave bombs (Savillex, Minetonka, Minnesota, USA) were pre-cleaned
with 3 m1 69% v/v HN03 (Primer, Fisons, Loughborough, UK) in a Perfecto 800
W microwave oven (DeLonghi, Italy) on medium power for 2 rnins. Samples of
approximately 0.25 g were accurately weighed into the bombs and 4 m1 HN03
(69%, v/v) together with 1 ml H202 (37%, v/v) were added. The bombs were
loosely capped and left overnight to a1low easily oxidised materia] to be
destroyed. After predigestion, the bombs were swirled gently, sealed tightly and
microwaved on medium power for 1 - 2 mins, or until the sample was a clear
colour with no residue (indicating a completed digest). The samples were
transferred quantitatively to 500 m1 volumetric flasks and made up to volume
with 2% HN03 giving an overall dilution of x2000. The samples and standards
were spiked with indium to give a fmal concentration of 100 11g r 1 Indium (In)
which acted as an internal standard prior to analysis by ICP-MS using the
conditions described in Table 5-1. The internal standard was used to correct for
· instrumental drift (sample viscosity effects, mass transport, etc.) over the analysis
period
196
5.2.1.4 Enzymatic digestion procedures for extraction of arsenic species
from marine algae
Samples of approximately 0.5 g were accurately weighed together with 0.05 g
cellulase and approximately 40 ml CH3COO~ buffer (0.1 M, adjusted to pH 5
using CH3COOH). The suspensions were homogenized in a 'Potter'
homogenizer, transferred to polyethylene centrifuge tubes and placed in a shaking
water bath at 37"C for a minimum of 4 hours. Following enzymolysis digestion,
the samples were centrifuged at 2500 rpm for 20 min, the supernatant transferred
quantitatively to volumetric flasks and made up to volume with the CH3COO~
buffer. The samples and standards were spiked with caesium to give a final
concentration of 100 J.lg r 1 Cs which acted as an internal standard prior to
analysis by ICP-MS.
5.2.1.5 Chromatographic conditions for the determination of arsenic
species using HPLC-ICP-MS and HPLC-ESMS
The chromatographic system consisted of a column (250 x 4.6 mm I.D.) packed
with Hamilton PRP XlOO, a strong anion-exchange polymeric based resin of 10
J.1ffi diameter, with a guard column (50 x 4.6 mm I.D.) of the same resin. The
mobile phase was 10 mM NHtHC03 with 10% MeOH at pH 10 (adjusted with
NH3 solution). The eluent flow rate used throughout was 1 ml min"1, with a 20 J.ll
sample loop for HPLC-ICP-MS, and by using a post-column splitter, a flow rate
of 150 J.ll min"1 with a 200 J.ll sample loop was used for HPLC-ESMS.
197

5.2.1.6 Solid Phase Extraction (SPE) techniques
Method development using anion, cation and reversed phase SPE extraction
cartridges was employed. Optimum conditions, in tenns of analyte response
determined using HPLC-ICP-MS, were found using 'Strata' anion exchange SPE
cartridges (Phenomenex, Cheshire, UK). The cartridges were conditioned with
MeOH (1 ml) followed by Milli-Q H20 (5 ml). Sample extracts (1 ml) from the
enzyme digestion procedure were introduced onto the SPE cartridge and the
retained analytes were then eluted with Nli!HC01 (20 mM, pH 10, 1 ml). This
solution was evaporated gently to dryness on a hot plate and re-dissolved in 200
J.d of H20.
The Fucus sp. sample extracts, following anion SPE, were further purified by
fraction collection subsequent to introduction onto the Hamilton PRP X100
anion-exchange column. The fractions were collected at times considered suitable
for obtaining analytes from resolved chromatographic peaks as detennined
following HPLC-ICP-MS of the extract for the particular column eluent system
used. The fraction collection program is shown in Table 5-3.
198

Table S-3 Fraction collection programme for Fucus sp. samples using a Hamilton PRP XIOO anion-exchange column with a mobile phase of 10 mM ~HC03 + I 0"/o MeOH. Flow rate of I ml min"1 and a sample loop volume of200 111.
Fraction Collection time (s)
1 120-180
2 200-240
3 240-300
4 330-420
Fractions were collected from the repeat injection of l 0 samples onto a Hamilton
PRP XlOO column through a 200 J.d loop using the conditions described in
section 1.2.1.5. The collected fractions were gently evaporated to just dryness at
approximately 50°C on a hot plate and re-dissolved in 0.5 ml of MeOH with
CH3COOH (I%, v,v) for analysis by direct injection ESMS. For HPLC-ESMS
analysis the collected fractions were again evaporated to dryness and re-dissolved
in 0.5 ml of the mobile phase. For validation purposes, experiments were
performed on standards, using the same conditions that had been applied to the
samples, to ensure no species inter-conversion occurred during the SPE and on-
column fractionation procedures that might have given rise to erroneous results.
5.3 Results and discussion
To commence the investigation of the marine algae an anion-exchange HPLC
method was developed, based on the work of Madsen et al. 116 which was
compatible with both ICP-MS and ESMS. In Madsen's work, a Hamilton PRP
199

XlOO anion-exchange column was used for both HPLC-ICP-MS and HPLC
ESMS. The mobile phase used for HPLC-ICP-MS was a 20 mM NI-4H2P04
solution adjusted to pH 5.6 with aqueous NH3, whereas for HPLC-ESMS analysis
the mobile phase was a 20 mM ~HC03 + 10% MeOH solution adjusted to pH
10.3 with aqueous NH3. Volatile buffers are necessary in ESMS for the
evaporation of the solvent leading to the presence of gas phase ions and hence,
the change in mobile phases between ICP-MS and ESMS. The addition ofMeOH
plays a significant role in ESMS signal stability and sensitivity 191 which is
attributed to the improved ion yield from charged MeOH droplets relative to
charged water droplets. In this work, 10 mM NRtHC03 + 10% MeOH adjusted
to pH 10.2 with NH3 was found to be suitable for both ICP-MS and ESMS
detection of arsenic species. This both simplified and allowed direct comparison
of chromatographic results from the coupled ICP-MS and ESMS system. The
lower concentration of ~HCOJ used assisted in reducing suppression of
analyte signal due to concomitant ions in ESMS. Addition of organic solvents to
the mobile phase are also known to reduce polyatomic interferences in ICP-MS
70
Anion-exchange HPLC-ICP-MS analysis was initiated with the study of readily
available arsenic standards. Figure 5-l demonstrates the typical retention times
for standards of AsBet, DMA, MMA and Asv.
200
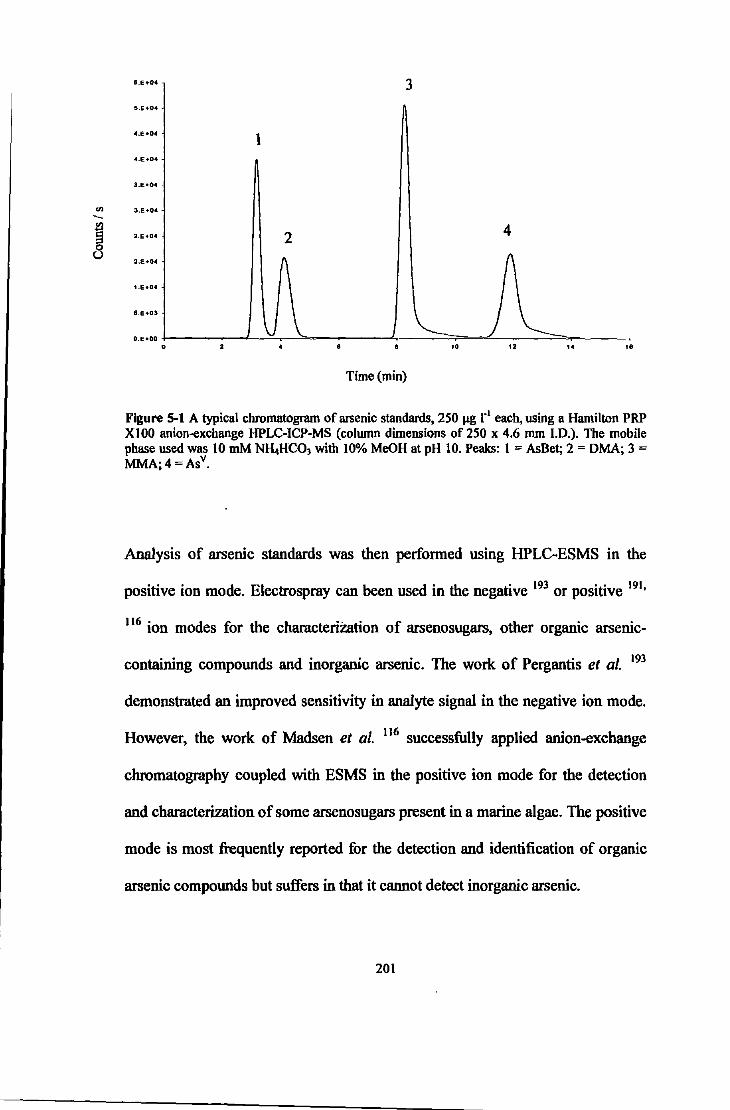
"' -~ 0 u
5.E+04 3 5.E+04
4.E+04 1 4.E+04
l.E+04
J.E+04
:ii:.E.f04 2 4
2.E•O" (\ (\ t.E•04
6.E•03
\_ Q.E•OO
\. )\__
0 .. " .. ••
Time(min)
Figure 5-1 A typical chromatogram of arsenic standards, 250 J.Lg 1"1 each, using a Hamilton PRP XIOO anion-exchange HPLC-ICP-MS (colwnn dimensions of 250 x 4.6 mm 1.0.). The mobile phase used was 10 mM ~HC03 with 10"/o MeOH at pH 10. Peaks: I = AsBet; 2 = DMA; 3 = MMA;4=Asv.
Analysis of arsenic standards was then performed using HPLC-ESMS in the
positive ion mode. Electrospmy can been used in the negative 193 or positive 191•
116 ion modes for the characterization of arsenosugars, other organic arsenic-
containing compounds and inorganic arsenic. The work of Pergantis et al. 193
demonstrated an improved sensitivity in analyte signal in the negative ion mode.
However, the work of Madsen et al. 116 successfully applied anion-exchange
chromatogmphy coupled with ESMS in the positive ion mode for the detection
and characterization of some arsenosugars present in a marine algae. The positive
mode is most frequently reported for the detection and identification of organic
arsenic compounds but suffers in that it cannot detect inorganic arsenic.
201
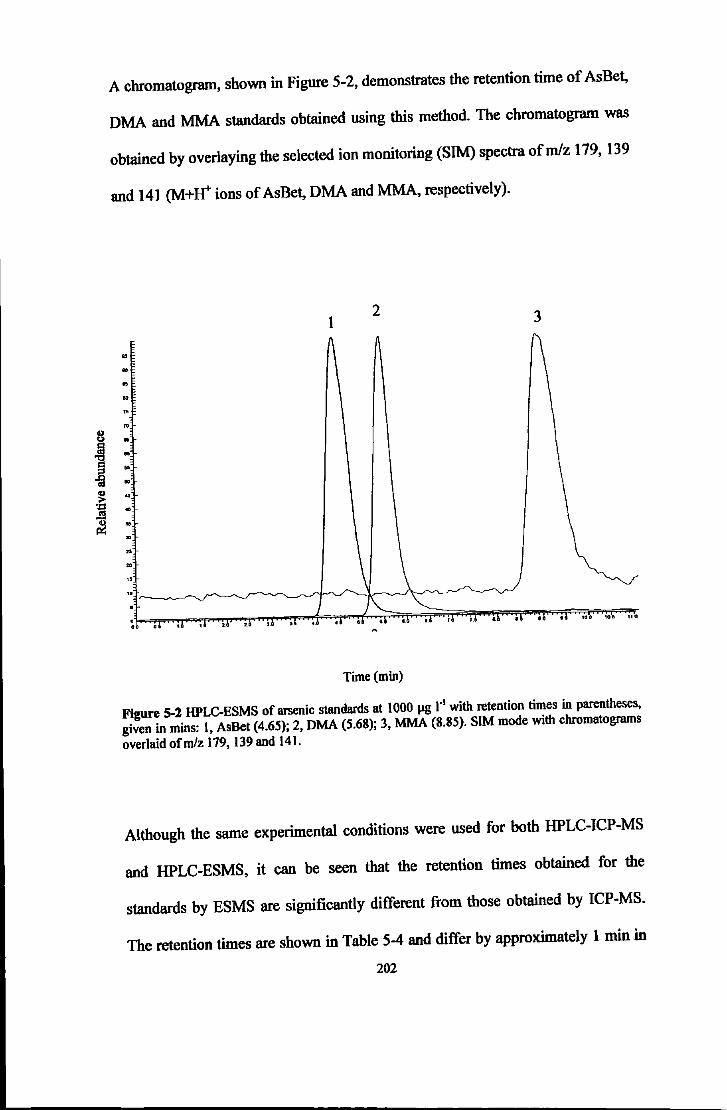
., u
~ ~ ~ ·o .!l! ~
A chromatogram, shown in Figure 5-2, demonstrates the retention time of AsBet,
DMA and MMA standards obtained using this method. The chromatogram was
obtained by overlaying the selected ion monitoring (SIM) spectra of m/z 179, 139
and 141 (M+W ions of AsBet, DMA and MMA, respectively).
l 2 3
.. • .. .. " • .. .. ..
.. ,.
100 toro no
Time(min)
Figure 5-2 HPLC-ESMS of arsenic standards at 1000 llS r' with retention times in parentheses, given in mins: I, AsBet (4.65); 2, DMA (5.68); 3, MMA (8.85). SIM mode with chromatograms
overlaid ofmlz 179, 139 and 141.
Although the same experimental conditions were used for both HPLC-ICP-MS
and HPLC-ESMS, it can be seen that the retention times obtained for the
standards by ESMS are significantly different from those obtained by ICP-MS.
The retention times are shown in Table 5-4 and differ by approximately 1 min in
202

each case. The shift in elution times may be accounted for by the differences in
the sample introduction train between the two techniques. This must be taken into
considemtion when making comparisons between the techniques for species
identification.
Table 5-4 Comparison of retention times of arsenic standards using HPLC-ICP-MS and HPLCESMS under the same chromatographic conditions (as descnOed in Section 5.2.1.5)
Retention times Retention times
HPLC-ICP-MS HPLC-ESMS
As Bet 3.32 4.35
DMA 4.14 5.38
MMA 8.09 8.85
The probability that eo-eluting species with the same molecular ions may be
present in a sample cannot be overlooked and due to the significant shift in
retention times of the arsenic species between the two techniques, further
confirmation that the presence of ions at m/z 179, 139 and 141 corresponded with
the expected M+W molecular ions for AsBet, DMA and MMA was obtained by
employing MSMS. The fragmentation patterns of MMA, DMA and AsBet
obtained using MSMS are shown in Figures 5-3, 5-4 and 5-5, respectively.
203

"'
I -~ -:;;
~
"' t ~ ~
"iii ~
141
.. " n
.. " • 123
"
" ..
- "' "' ... "' .., .,.
mlz
Figure 5-3 MSMS fragmentation pattern of MMA (M+H'" ion 141) using the ESMS conditions
shown in Table 5-7.
121
... •
•
" " .. .. .. 91 .. • 139
.. " " • " ..
.. ... .. ... - ... ... "' ... ... .. mlz
Figure 5-4 Fragmentation pattern ofDMA ( M+H'" ion 139) using the ESMS conditions shown in
Table 5-7.
204

Cl)
~
1 Cl)
j ~
161 ... •
137
" 120 .. .. .. .. .. " 179 ,.
" .. .. .. . " I ... ... .. ... ... .. ... -... ...
m/z
Figure S-S Fragmentation pattern of AsBet (M+H'" ion 179) using the ESMS conditions shown
in Table 5-7.
The structures of AsBet, DMA and MMA together with their identified
fragmentation patterns, that correspond to the experimentally obtained results by
MSMS 194, are shown in Figure 5-6.
205

OH 0
I + ... /{ H3C-As-OH H3C-As
bH \
OH
MMA-mlz 141 mlz 123
0
OH 0 ~+ I +
/{ H3C-As-OH ... H3C-As
bH3
\ CH3 m/z91
m/z 121 AsH +
DMA-mlz 139 !H3
mlz 91
H,C\ ·:to CH3 H CH3
I~ I
H3c/\ __.
H3C-r ~ _0
__. H3C-As + \
CH3 H CH3
H3
AsBet- mlz 179 m/z 161 m/z/120
• ~ CH3 CH3
H3C-1s~OH I +
H3C-As-CH3
bH3 bH3
m/z 137 mlz 135
Figure 5-6 Structures of MMA, DMA and AsBet together with identified fragment pathways 194
using mass spectrometric analysis.
206
Reviewing the peaks obtained by HPLC-ICP-MS for standards of AsBet, DMA
and MMA, which identify the presence of elemental arsenic, together with the
molecular peaks of equivalent mass obtained by HPLC-ESMS and the
fragmentation patterns seen by MSMS, there is overwhelming evidence for the
species purity of the standards. The use of HPLC-ICP-MS and HPLC-ESMS as
complementary techniques to one another in this way demonstrates their
capability in providing information for species identification and verification in
new materials or where further identification and characterization of species may
be required. Knowledge of predicted fragmentation pathways for molecular ions
obtained by using MSMS may prove vital where new materials are under
investigation for identification and characterization of species, particularly where
there is a lack of available standards for peak identification using HPLC-ICP-MS.
Having established optimum experimental conditions for HPLC-ICP-MS and
HPLC-ESMS and the legitimacy of the procedure for species separation and
identification, work with the marine algae samples was pursued. SPE techniques
using on-column fraction collections were investigated for bulk matrix removal
from samples prior to analysis using ESMS. Optimum conditions are given in
section 5.2.1.6. Speciation retention and subsequent elution was verified using
ICP-MS. However, the results following purification and fractionation techniques
proved unsuccessful. One of the reasons for this was indicated by the loss of
analytes of interest together with removal of the matrix leaving the analyte signal
close to the limit of detection, as shown by ICP-MS response. Enzymatically
digested sample extracts with no matrix removal or purification were, therefore,
207

introduced onto the HPLC column coupled with ESMS for analysis as described
in section 5.2.1.5.
'Total' concentrations of arsenic present in the two marine samples, Fucus
spiralis and Ascophyllum nodosum, under investigation were detennined
following HN03 and enzymolysis digestions using direct ICP-MS. The results are
given in Table 5-5. The 'total' arsenic concentration from the enzyme digestions
are given together with their extraction efficiencies, which were calculated as a
ratio of the total concentrations obtained from the HN03 digests. The results are
given with 95% confidence intervals and are in agreement with the given values.
Table 5-S ' Total' As detennined in HN()fH20 2 and enzymolysis extracts of Fucus sp. and Ascophyllum nodosum using ICP-MS. Results are given in mg kg"1 as the element
Fucussp. Ascophyllum nodosum
HN03 acid digest 43.2 ± 1.0 47.6 ± 1.1
Enzyme digest 34.6±2.8 36.7±2.5
Enzyme extraction efficiency 80±7% 77±6%
Certified reference value 44.3± 2.1 44.0 ± 1.71
LOD(3 xSD) 0.0028 NA'
' reference value only 2 not available
Cellulase was used for the digestion of the algae giving an extraction efficiency
of approximately 80%. This was considered to be an acceptable level in light of
research using the more common MeOH or MeOH-H20 extraction techniques
that report efficiencies ranging from 20% 195 to > 85% 113• The use of cellulase
breaks down the cell wall releasing cellular contents with no inter-conversion of
species.
208

Preliminary arsenic speciation studies on enzyme extracts of the algae were
perfonned using HPLC-ICP-MS. Separation and detection of arsenic species by
HPLC-ICP-MS, with ICP-MS being an element-specific detector, provided
evidence of arsenic-containing compounds together with their respective elution
times. The matching of retention times with that of known standards was
employed for peak identification. It is known that matrix effects can alter
retention times of standards and, therefore, spiking experiments with standards
were carried out to confirm species by this technique. However, when analyzing
marine algae, the likelihood of arsenosugars being present is exceptionally high
for which there are no commercially available standards. This precluded the
matching of retention times with standards for any unidentified peaks. The
possibility of eo-eluting species with that of standards could also not be excluded.
Figure 5-7 (a repeat of Figure 5-1, provided for direct comparison) demonstrated
the typical retention times for the available standards of AsBet, DMA, MMA and
Asv. Figure 5-8 shows the chromatogram of Fucus sp. and Figure 5-9 that of
Ascophyllum nodosum obtained using HPLC-ICP-MS. Comparison of the
retention times with that of standards demonstrated that the first peak in Figure 5-
8 eluted with a similar time to that of AsBet. However, it is known and well
established 196 that marine algae contain arsenosugars that elute with, or close to,
the solvent front as does AsBet when using anion-exchange chromatography.
209

"'
~ u
5.E •0~ 3
6.6•04
4.E•04 1 4.E•04
3.E•04
3.Et04
4 2.E•04 2
2.E•04 (\ ~ 1.E•04
5.E•OI \ ) \____ \.
O.E•OO " 12 " ••
Time(min)
Figure 5-7 A typical chromatogram of arsenic standards, 250 M r• each, using a Hamilton PRP X lOO anion-exchange HPLC-JCP-MS (column dimensions of 250 x 4.6 mm l.D.). The mobile phase used was 10 mM ~HC03 with 10% MeOH at pH 10. Peaks: l = AsBet; 2 = DMA; 3 =
MMA;4=Asv.
2SOO
3
2000
•• " " ..
Time(min)
Figure S-8 A chromatogram of the CRM IAEA-140 (seaweed), using a Hamilton PRP X lOO anion-exchange HPLC-ICP-MS (column dimensions of 250 x 4.6 mm I.D.). The mobile phase used was 10 mM ~HC03 with 100/o MeOH at pH 10. Peaks 1-4 nominally assigned prior to
identification.
210

"' -~ 0 u
... 1
700
600
500 2 3 ... 300
200
100
0 10 12 14 16
0
Time(min)
Figure 5-9 A chromatogram of Ascophyllum nodosum, using a Hamilton PRP XlOO anionexchange HPLC-ICP-MS (column dimensions of250 x 4.6 mm l.D.). The mobile phase used was 10 mM NHtHC0
3 with 10% MeOH at pH 10. Peaks 1-3 nominally assigned prior to
identification.
A poorly resolved second peak may tentatively be ascribed to DMA and the third
peak did not match any of the standards used and, therefore remained
unidentified. The very small fourth peak may be attributed to inorganic arsenic.
The chromatogram obtained for the Ascophyllum nodosum sample (Figure 5-9)
showed the first peak eluting with a similar time to that of the AsBet standard.
The second and third peaks did not closely match the elution times of any
standard.
By using the same chromatographic system for HPLC-ESMS it was possible to
examine peaks where arsenic-containing species were known to elute, as
demonstrated by HPLC-ICP-MS, and obtain complementary molecular
infonnation leading to characterization of the compound. This was particularly
211

., (.)
!ii ""' § 1l ~ ·.;:::
.!!! ~
useful for arsenic-containing compounds that did not match retention times of
that of known standards when using HPLC-ICP-MS, or where eo-elution is
known to exist (arsenosugars with AsBet).
The HPLC-ESMS chromatogram obtained from the Ascophyl/um nodosum
sample is shown in Figure 5-10. The electrospray process measures all molecular
ions in a sample and, therefore, the chromatogram obtained did not give any well-
defmed peaks that might have corresponded to the peaks seen using HPLC-ICP-
MS. There was evidently a broad, high background level of eluting molecular
ions, probably attributable to the presence of the matrix.
100
•• •• •• 75
70
•• BD .. so 45
40
35
30
25
20
15
10
• 0 5 • 10 "
Time(min)
Figure 5-10 Chromatogram obtained of the Ascophyllum nodosum sample using ESMS with the
conditions described in section 5.2.1.5 and Table 5-2.
212

8 .g § {l
~ ·~
~
However, observation of m/z 329 in the SIM mode, shown in Figure 5-11,
provided evidence of a peak, having a similar elution time to that of AsBet (as
seen in Figure 5-2 using HPLC-ESMS), which was attributed to the arsenosugar,
previously identified by Edmonds and eo-workers 18•
19, the structure for which is
shown in Figure 5-12. This supported the findings by other workers that marine
algae contain arsenosugars that may elute, under certain conditions, from a
chromatographic column at a similar time to that of AsBet 196
•
4.9 ... " .. " .. .. " .. .. .. .. .. .. " .. .. " " ..
.. "
Time (min)
Figure 5-11 Chromatogram obtained of the Ascophyllum nodosum sample using ESMS in the SIM mode at m/z 329 with the conditions described in section 52.1.5 and Table 5-2. (peak apex
time given - 4.9)
213

Figure S-12 Structure of the arsenosugar, commonly found in marine algae, having a M+W 329
mass units 116•
A more detailed study of the Fucus sp. sample was undertaken for identification
of arsenic species present within the sample matrix. A HPLC-ESMS
chromatogram obtained from the Fucus sp. sample is shown in Figure 5-13.
Three peaks are discernable above the baseline. Having taken into account the
shift in retention times (see Table 5-4) between the techniques, the peaks may be
considered representative of the first three peaks seen using HPLC-ICP-MS of
the Fucus sp. sample (Figure 5-8).
214

4.36
Time(min)
Figure 5-JJ Chromatogram obtained of Fucus sp. using anion-exchange HPLC-ESMS with the
conditions described in Section 5.2.1.5.
However, the complexity of chromatograms obtained by HPLC-ESMS is
adequately demonstrated when viewing the mass spectrum obtained ofprotonated
molecular ions by their mass/charge (m/z) ratio. A m/z spectrum corresponding to
the second peak (retention time 5.64 min) is shown in Figure 5-14. A nwnber of
spectral peaks can be seen indicating the presence of a variety of molecular ions
that have the same chromatographic elution times. Unlike ICP-MS, which is an
element specific detector, all molecular ions amenable to the electrospray process
are measured in the sample matrix, including the solvent. Although not the most
dominant in the spectrum, the molecular ions at peaks m/z 241, 329 and 409 that
correspond to known arsenic-containing·compounds and can be clearly seen. The
M+W ion seen at m/z 241 has previously been identified by McSheehy et al. 110
215

and the M+H'" molecular ions at m/z 329 and 409 by Edmonds and eo-workers 18
•
19• Using the SIM mode, the chromatogram shown in Figure 5-15, confirms that
the masses 241, 329 and 409 eo-elute.
100
409
241
329
m/z
Figure 5-14 ESMS spectrum of middle peak (RT 5.64 min) of the Fucus sp. chromatogram using anion-exchange HPLC-ESMS with the conditions described in Section 5.2.1.5.
216
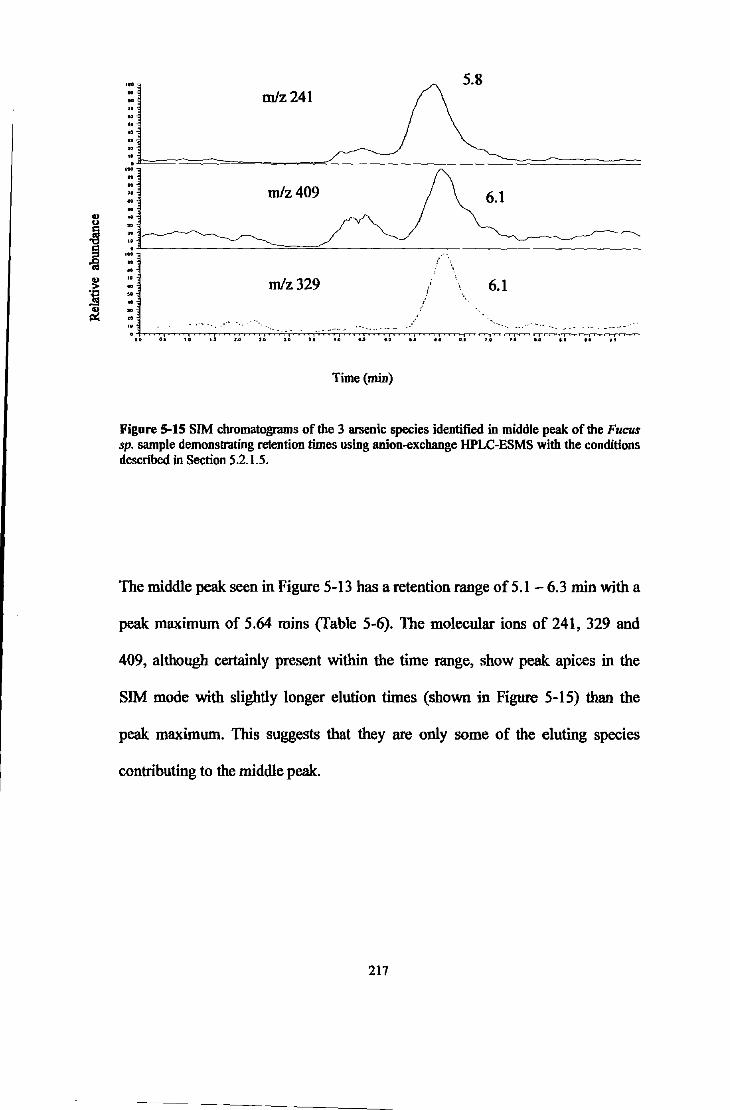
lL -~~ 1 mlz409
·: ~ ... .. .. rnlz329
Time(min)
6.1
{ \,
6.1
Figure 5-lS SIM chromatograms of the 3 arsenic species identified in middle peak of the Fucus sp. sample demonstrating retention times using anion-exchange HPLC-ESMS with the conditions descn'bed in Section 5.2.1.5.
The middle peak seen in Figure 5-13 has a retention range of 5.1 - 6.3 min with a
peak maximum of 5.64 mins (fable 5-6). The molecular ions of 241, 329 and
409, although certainly present within the time range, show peak apices in the
SIM mode with slightly longer elution times (shown in Figure 5-15) than the
peak maximum. This suggests that they are only some of the eluting species
contributing to the middle peak.
217

Table 5-6 Peak times for Fucus sp. sample using HPLC-ESMS. Retention range and peak points are obtained in the full ESMS mode. Time is given in minutes.
Peak] Peak2 Peak3
Retention range (time) 4.0-4.8 5.1-6.3 6.8-7.8
Peak maximum (time) 4.36 5.64 7.34
The third peak, with a retention range of 6.8 - 7.8 min and a peak maximum at a
time of 7.34 min, in the chromatogram of the Fucus sp. using HPLC-ESMS
(Figure 5-13), was shown to contain a M+W molecular ion at mass 483, which
corresponds with an arsenosugar also previously identified by Edmonds and eo-
workers 18•
19• A chromatogram, using the SIM mode, of this peak is shown in
Figure 5-16. This compound may account for the unidentified third peak obtained
by HPLC-ICP-MS of the Fucus sp. sample (Figure 5-13) having taken into
account the shift in retention times of species between the techniques of HPLC-
ICP-MS and HPLC-ESMS.
218

u
~ ~ .. ~ ·g ~
7.34
.. .. .. .. ., ..
rnlz483 .. .. .. "' .. ... Cl
,.;
.. ,. .. .. ••
0 OD .. •• .. .. .. .. .. .. .. .. .. .. .. 7.0 .. .. .. 00 ..
Time(min)
Figure 5-16 SIM of rnlz 483 in the Fucus sp. sample demonstrating retention time using anionexchange HPLC-ESMS with the conditions described in Section 52.1.5.
Due to major matrix elution and broad. high level background in the solvent front
region, no arsenic-compounds were identified in the first peak obtained by
HPLC-ESMS. However, using the SIM mode to look at mass 179, no peak was
seen corresponding to this elution time or to any other time in the chromatogram.
This suggests that peak l seen in the Fucus sp. sample by HPLC-ICP-MS (Figure
5-8) contains an arsenic-containing compound other than AsBet that co-elutes
with this standard.
219
In all the sample cbromatograms shown using HPLC-ESMS, the M+W ion
signals for the proposed masses of arsenic-containing compounds do not appear
solely at their characteristic retention times but elsewhere in the chromatogram.
These signals may be produced by matrix compounds with the same M+W m/z
value. Moreover, these ions may account entirely for the peak obtained where the
suspected arsenic-containing compounds are thought to elute. In the case of real
samples, the probability that an extract contains a matrix component of the same
molecular mass is too great to ignore. The use of MSMS, where fragment
patterns of the parent molecule can be studied, may provide more conclusive
evidence of the actual molecular structure. By applying MSMS techniques it is
possible to analyze product ions resulting from the collision induced dissociation
(CID) of the parent ion. However, interpretation of the mass spectra is not always
easy to achieve, particularly when confronted by previously unidentified
compounds. A priori knowledge on the expected nature of the compound and an
understanding of the expected molecular structures present can provide
invaluable assistance. With this in mind, the structures of previously identified
arsenic-containing compounds 18•
19•
110 having the same mass as those identified
in this study are shown in Figure 5-17. The structure of the compound at mass
241 is shown in Figure 5-18.
220

HO
0""'R
OH
R = CHzCHOHCH20H (328) : a
R = CHzCHOHCHzOPOzHOCH2CHOHCHzOH
(482) : c
Figure S-17 Structures of three arsenosugars commonly found in marine algae 116
OH
Figure S-18 Structure of compound at m/z 241 110, 3-[5'-deoxy-5'-(dimethylarsinoyl)-13-
ribofuranosyloxy]-2-hydroxypropylene glycol.
The structures of the three arsenosugars contain a common dimethylarsinoyl
ribofuranosyl moiety at mass 237. Fragmentation patterns of the parent molecule
221

by MSMS should reveal the characteristic structures of these compounds. A
common fragmentation pattern for arsenosugars is shown in Figure 5-19.
mass 237
0
195 (+It)
I I
I
---........
"·· '• I i
I I i i I !
o............._ R
Figure 5-19 Characteristic fragmentation pattern ofan 'arsenosugar' 57
.
Tandem MS techniques, to fragment parent ions, were applied to the arsenic-
containing molecular ions identified in the Fucus sp.sampie. The fragmentation
spectrum obtained for the molecular M+H'" ion at rnlz 329 is shown in Figure 5-
20. The mass at 347 can be accounted for by a molecule of H20 hydrating the
original M+H'" parent molecule. The characteristic arsenosugar fragments at
masses 237 and 165 are visible. The masses at 285 and 213 may be attributable to
222
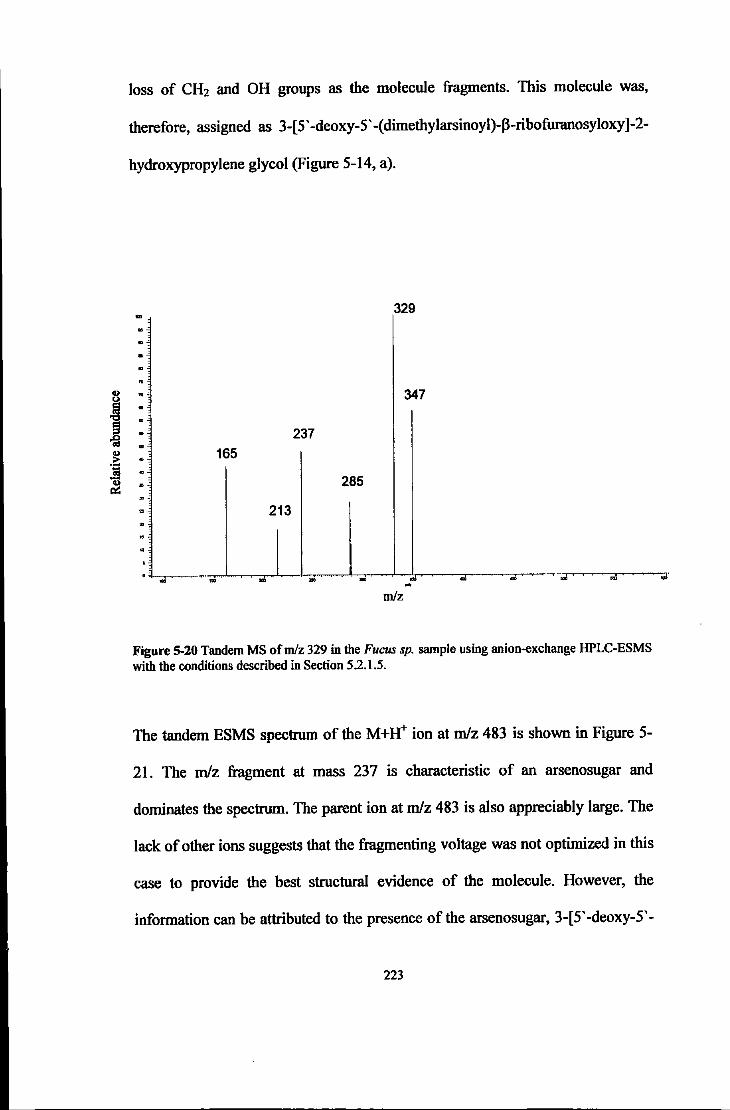
loss of CH2 and OH groups as the molecule fragments. This molecule was,
therefore, assigned as 3-[5 · -deoxy-5' -( dimethylarsinoyl)-jl-ribofuranosyloxy ]-2-
hydroxypropylene glycol (Figure 5-14, a).
329
347
237 165
285
213
.. mlz
Figure 5-20 Tandem MS ofmlz 329 in the Fucus sp. sample using anion-exchange HPLC-ESMS with the conditions described in Section 52.1.5.
The tandem ESMS spectrum of the M+W ion at rn/z 483 is shown in Figure 5-
21. The rn/z fragment at mass 237 is characteristic of an arsenosugar and
dominates the spectrum. The parent ion at rn/z 483 is also appreciably large. The
lack of other ions suggests that the fragmenting voltage was not optimized in this
case to provide the best structural evidence of the molecule. However, the
information can be attributed to the presence of the arsenosugar, 3-[5'-deoxy-5'-
223
....

.. ~ § ~ .. > ~ ~
(dimethylarsinoyl)-J3-ribofuranosyloxy]-2-hydroxypropyl-2,3-dihydroxypropyl
phosphate (Figure 5-17, c).
237
"' .. .. 483 ..
" " " .. " " .. .. .. " .. " .. .. 414 "
I ... .... ... ... .. ..... ... .... .. "'
mlz
Figure 5-21 Tandem MS fragment pattern of compound at rnlz 483 using anion-exchange HPLC-ESMS with the conditions described in Section 5.2.1.5. ·
The protonated molecular ion at rn/z 409, that is frequently reported in the
litemture 113, has been assigned as an arsenosugar. The fragments at m/z 237 and
165, shown in Figure 5-22, support this assignment. The other peaks in the
spectrum are more difficult to assign and may be from the loss of 0, OH and C
groups with rearmngements also occurring. The molecule at M+W 409 was
assigned as 3-[5' -deoxy-5 · -( dimethylarsinoyl)-13-ribofuranosyloxy ]-2-
hydroxypropyl hydrogen sulphate (Figure 5-17, b).
224
..

8
~ ~ ~ 'tl .!'! ~
409 ... .. .. .. .. " .. .. .. .. .. .. .. .. 317
"' 333 " " 237 272 " 366 ..
165 I I ... ... "' ... ... ... - ... ... ... rnfz
Figure 5-22 Tandem MSMS of compound at rnfz 409 using anion-exchange HPLC-ESMS with the conditions described in Section 5.2.1.5. ·
The SIM at m/z 241, whose structure is shown in Figure 5-18, may be
attributable to the arsenic compound 4-dimethlyarsinoyl-2,3-dihydroxybutanoic
acid, recently reported by McSheehy, et al 110• The fragments obtained in the
MSMS spectrum (Fig 5-23) support this view as loss of 46 mass units at 195
represents a protonated carboxylic acid group and 121 represents the
dimethylarsinoyl moiety. The loss of 30 mass units from 195 to 165 indicates the
loss of a CHOH group present in the carbon chain of the molecule 110
•
225
...

8 ~ ~ ~ 'i ~
... 195 " .. .. .. 241
" .. .. 121 .. .. ., 165 .. .. 84 v223 .. .. ~ .. .. " "
'" ... "' "' "' ... ... ... ... ...
mfz
Figure S-23 MS-MS of M+W 241 using anion-exchange HPLC-ESMS with the conditions described in Section 5.2.1.5.
A short summary of the results obtained using HPLC-ICP-MS, which
demonstrate the presence of arsenic-containing compounds in the Fucus sp. and
Ascophyllum nodosum samples, and the results using HPLC-ESMS together with
MSMS techniques providing molecular information suggest that the wrresolved
peak 2 (Figure 5-8) of the Fucuc sp. sample, using HPLC-ICP-MS, contains three
compounds assigned as 4-dimethlyarsinoyl-2,3-dihydroxybutanoic acid (M+H'" ,
241 ), 3-[5' -deoxy-5' -( dimethylarsinoyl)-P-ribofuranosyloxy]-2-hydroxypropyl
hydrogen sulphate (M+H'" , 409) and 3-[5'-deoxy-5'-(dimethylarsinoyl)-P
ribofuranosyloxy]-2-hydroxypropylene glycol (M+H'" , 329). The third peak was
assigned as 3-[5' -deoxy-5' -( dimethylarsinoyl)-P-ribofuranosyloxy ]-2-
226
...
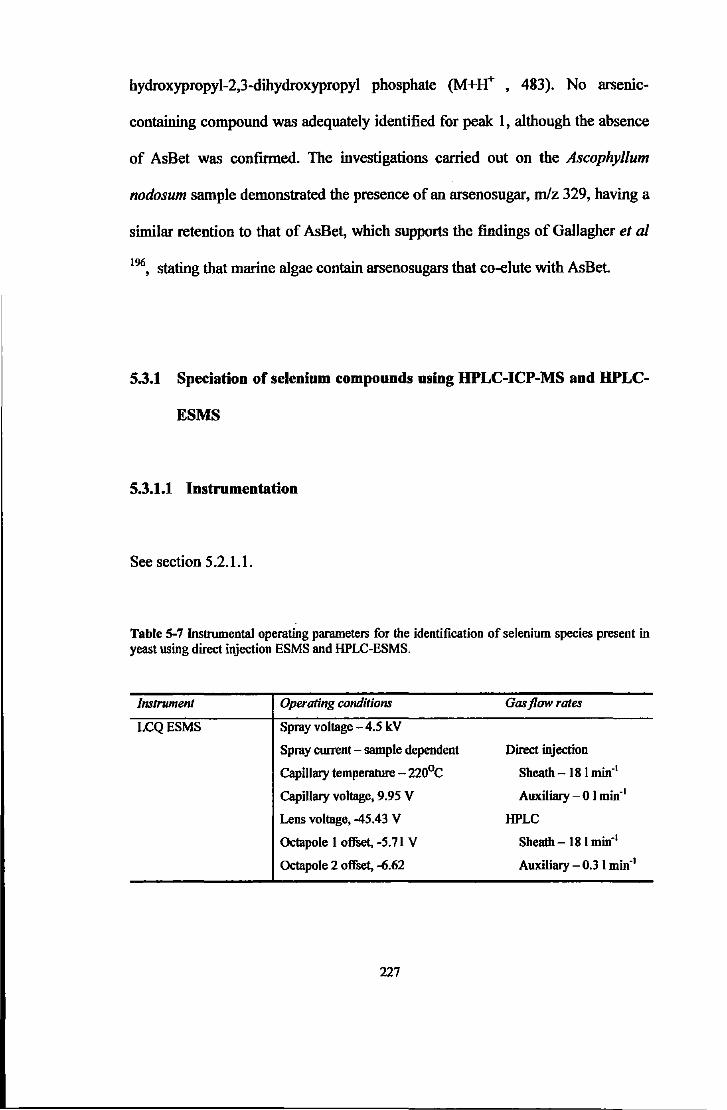
hyd.roxypropyl-2,3-dihydroxypropyl phosphate (M+W , 483). No arsenic-
containing compound was adequately identified for peak l, although the absence
of AsBet was confirmed. The investigations carried out on the Ascophyllum
nodosum sample demonstrated the presence of an arsenosugar, m/z 329, having a
similar retention to that of AsBet, which supports the findings of Gallagher et aJ
1%, stating that marine algae contain arsenosugars that eo-elute with AsBet
5.3.1 Speciation of selenium compounds using HPLC-ICP-MS and HPLC-
ESMS
5.3.1.1 Instrumentation
See section 5.2.1.1.
Table S-7 Instrumental operating parameters for the identification of selenium species present in yeast using direct injection ESMS and HPLC-ESMS.
JnstrumenJ
LCQESMS
Operating conditions
Spray voltage- 4.5 kV
Spray current -sample dependent
Capillary temperature - 220°C
Capillary voltage, 9.95 V
Lens voltage, -45.43 V
Octapole I offset, -5.71 V
Octapole 2 offset, -6.62
227
Gas flow rates
Direct injection
Sheath- 18 I min-1
Auxiliary-0 I min-1
HPLC
Sheath- 18 I min-1
Auxiliary - 0.3 I min-1

5.3.1.2 Chemicals and reagents
Chemicals were of analytical grade unless otherwise stated. All lab-ware was
soaked in HN03 (10% v/v) for a minimum of 24 hours and rinsed thoroughly
with MilliQ water (Millipore, Bedford, MA, USA) prior to use. Stock solutions
of selenomethionine (SeMet), selenocystine (SeCys), sodium selenate and
sodium selenite (Sigma-Aldrich, Poole, Dorset, UK) at I 000 mg r• as the element
were stored at 4°C in the dark. Standards were prepared daily from the stock
solutions. Protease (Sigma-Aldrich) was used for sample digestion procedures.
Mobile phase eluents were prepared using ammonium hydrogen carbonate,
ethanoic acid (Sigma-Aldrich) and methanol (Fisher Chemicals).
5.3.1.3 HN03 digestion for total element determination
Microwave bombs (Savillex, Minetonka, Minnesota, USA) were pre-cleaned
with 3 ml 69% v/v HN03 (Primer, Fisons, Loughborough, UK) in a Perfecto 800
W microwave oven (DeLonghi, Italy) on medium power for 2 mins. Samples of
approximately 0.25 g were accurately weighed into the bombs and 4 ml HN03
(69%, v/v) together with I ml H202 (37%, v/v) were added. The bombs were
loosely capped and left overnight to allow easily oxidised material to be
destroyed. After predigestion, the bombs were swirled gently, sealed tightly and
microwaved on medium power for 1 - 2 mins, or until the sample was a clear
colour with no residue (indicating a completed digest). The samples were
transferred quantitatively to volumetric flasks and made up to volume with 2%
228

HN03 giving an overall dilution of x2000. The samples and standards were
spiked with indium to give a final concentration of I 00 J.1g 1"1 Indium (In) which
acted as an internal standard prior to analysis by ICP-MS using the conditions
described in Table 5-l, section 5.2.1.1. The internal standard was used to correct
for instrumental drift (sample viscosity effects, mass transport, etc.) over the
analysis period.
5.3.1.4 Enzymatic digestion procedure for extraction of selenium species in
yeast
Samples of approximately 0.25 g were accurately weighed together with 0.025 g
protease and approximately 40 ml Nf4HC03 buffer (0.1 M, pH 8). The
suspensions were homogenized in a 'Potter' homogenizer, transferred to
polyethylene centrifuge tubes and placed in a shaking water bath at 37"C for a
minimum of 4 hours. Following enzymolysis digestion, the samples were
centrifuged at 2500 rpm for 20 min, the supernatant transferred quantitatively to
volumetric flasks and made up to volume with the ~HC03 buffer. The samples
and standards were spiked with caesium to give a final concentration of 100 J.lg 1"1
Cs which acted as an internal standard prior to analysis by ICP-MS.
229

5.3.1.5 Chromatographic conditions for the determination of selenium
species using HPLC-ICP-MS and HPLC-ESMS
The chromatographic system consisted of a Dionex AS ll column (250 x 4.1 mm
i.d.) packed with a strong anion-exchange polymeric based resin of 10 !liD
diameter with a guard column (50 x 4.1 mm i.d.) of the same material. The
mobile phase was a step-gradient of 10 mM NI-4HC03 with 10% MeOH at pH 5
(adjusted with glacial CH3COOH) and 50 mM NI-4HC03 with 10% MeOH at pH
5 (adjusted with glacial CH3COOH). The elution program is given in Table 5-8.
The eluent flow rate used throughout was 1 ml min-1, with a 20 Ill sample loop
for HPLC-ICP-MS, and by using a post-column splitter, a flow rate of 150 Ill
min-1 with a 200 Ill sample loop was used for HPLC-ESMS.
Table S-8 Elution program for selenium speciation using HPLC-ICP-MS
l 0 mM NlLtHC03
(adjusted to pH 5)
50 mM NHtHC03
(adjusted to pH 5)
0-5 min
100%
0%
5-9min
0%
100%
230
9-15 min
100%
0%
5.4 Results and discussion
The techniques used for the elucidation of arsenic-containing compounds in a
marine algae were applied in a similar manner for the identification of selenium
containing compounds in the yeast sample. Protease was the enzyme of choice
for extraction of species due to its efficiency, and also its successful use is
frequently reported in the literature 197•
174• However, one of the disadvantages
encountered with the use of proteolytic enzymes is that infonnation surrounding
the original protein is lost and therefore other extraction techniques may be used
to avoid this effect 1 1 1•
Total concentrations of selenium in the yeast sample extracts were determined
following HN03 and enzymolysis digestions using direct ICP-MS. The results are
given in Table 5-9. The totals from the enzyme digestions are given together with
their extraction efficiencies, which were calculated as a ratio of the total
concentrations obtained from the HN03 digests. The results are given with 95%
confidence intervals and are in agreement with the reference values.
231

Table S-9 Total selenium in HNOy'H20 2 and enzyme digests of yeast using ICP-MS. Results are given in mg kg"1 as the element
Total Se Extraction efficiencies
HN03 acid digest 1282 ± 33 100±5%
Enzyme digest 1158 ±99 90±8%
Reference value 1300
LOD (3 x SD) 0.0041
Speciation studies of selenium in yeast were performed by HPLC-ICP-MS prior
to verification by HPLC-ESMS, using the conditions described in sections 5.2.1.1
and Table 5-7. Chromatographic conditions employed are described in Section
5.3.1.5 and Table 5-8. A typical chromatogram of selenium standards using
HPLC-ICP-MS is shown in Figure 5-24 and that of the yeast sample in Figure 5-
25.
232

"' -..
~ 0 u
"' -..
§ 0 u
1 2.E •04
t.E•04
1.£•04
t.e•04
1.E.•04
e.E•03 2 •. £•03
4.E•03
t.E•03
O.E.•OO •• " Time(min)
Figure 5-14 Typical chromatogram of Se standards by anion-exchange HPLC-ICP-MS as described in Section 5.3.1.5 and Table 5-8. Peak I, SeCys at I mg 1"1; Peak 2, SeMet at I mg 1"
1
(all concentrations given in tenns of the element)
~.e. f03
4.E •03
3.E •03
:I.E. •03
J.E •03
2.E •01
t .E.•OJ
l!i.E•02 )
O.E•OO •• "
Time(min)
Figure 5-15 Chromatogram of yeast sample by anion-exchange HPLC-ICP-MS as descn"bed above.
233

The chromatogram of the yeast sample (Figure 5-25) suggested that the major
peak seen corresponded to SeMet, having a similar elution time to that of the
SeMet standard, and that a small peak of SeCys was also present. Analysis by
HPLC-ESMS was employed for comparison of the peaks obtained in order to
confirm their identity.
One of the advantages to working with selenium compounds is that selenium has
6 isotopes. The characteristic isotopic pattern can be used to assist in identifying
selenium compounds present in a spectrum, without prior knowledge of the
expected compound. The six isotopes together with the ratios of their natural
abundance are shown in Table 5-10. Figure 5-26 demonstrates the presence of the
isotopic pattern in SeMet based on its M+H'" monoisotopic mass of 198.
Table 5-10 Selenium isotopes and their natural abundance
Se isotope Natural abundance, %
74 0.9
76 9.1
77 1.5
78 23.5
80 50
82 9.0
234

., u
~ ~ ~ ·p
_!g
~
198
"
196
195
194\ 200
mlz
Figure 5-26 SeMet profile by ESMS, using the conditions descn"bed in table 5-7, demonstrating the characteristic isotopic pattern of a selenium-containing compound.
A standard of SeCys based on its M+W monoisotopic mass of 337 is shown in
Figure 5-27 which demonstrates the isotopic pattern that identifies a compound
possessing a selenium-selenium bond in a m/z spectrum.
235

., u
~ § ~ ~ ·p
..!!! ~
'"' .. .,
" .. ,. "'
" 337 .. .. .. .. .. .. ..
335 " .. 339
" 10
333
,,, I .dl J l ' ., ., '"' ... ... ,., ,.,
"" "" ... ... ... .. ... ... ... ... ... .... ... ... ..,
mlz
Figure S-27 SeCys centroid profile in a mlz spectrum, using the conditions described in table 5-7, demonstrating the expected selenium-selenium bond isotopic pattern
When analyzing standards by HPLC-ESMS, a similar phenomenon was seen for
the selenium species as was seen for the arsenic, i.e. that the elution times are
slightly prolonged to those obtained by HPLC-ICP-MS, again probably due to the
differences in the sample introduction train. Chromatograms by HPLC-ESMS for
the selenium standards and yeast sample are shown in Figures 5-28 and 5-29,
respectively. The chromatogram of the yeast sample (Figure 5-25) is limited in
supplying information due to the high presence of matrix ions. However, if the
SIM mode is used to pick out m/z 198 and 337, the SeMet and SeCys peaks can
be seen. This chromatogram is shown in Figure 5-30. The altered elution times
236
...

., u
~ § ~ ~ -~
~
are comparable to elution times for the SeCys and SeMet standards using HPLC-
ESMS.
.. 3.52 .. 5.69
" .. .. .. "' " ..
Time (min)
Figure 5-28 SeMet and SeCys standards in SIM mode using anion-exchange HPLC-ESMS with the conditions described in section 5.3.1.5. and Tables 5-7 and 5-8.
237

., (,)
~ § ~ ., :> ·.: ~ ., ~
5.75
7.63
Time(min)
Figure 5-29 Chromatogram of yeast sample extract using anion-exchange HPLC-ESMS with the conditions described in section 5.3.1.5. and Tables 5-7 and 5-8.
3.49 .., SeCys 337 .. ., ,._
..
.. Zl
.. • .., .. .. 5.31 " .. SeMet 198 !D .. .. Zl .. • .. u rJJ J.a ao 11.11 u ...
Time(min)
Figure 5-30 Yeast sample extract in SIM mode by HPLC-ESMS ESMS, using the conditions described in section 53.1.5. and Tables 5-7 and 5-8, demonstrating the response against retention times at mass 337 and 198.
238

G>
~ § ~ !;! j ~
The use of MSMS to observe the fragmentation patterns of the SeMet and SeCys
standards was undertaken; the structures for which are shown in Figure 5-31. The
fragmentation spectra by MSMS of these compounds are shown in Figures 5-32
and 5-33, respectively, and are consistent with their chemical structures.
o,.,_ J:2
_...se ,.....,_ 1 T "" 'Se 1 'OH OH NH2
Selenomethionine Selenocystine
Figure 5-31 Structures of the two selenium compounds under investigation 36
•
181
.. ..
" "
.. .. 170 ..
" .. " 153 198
... ... .. . .. .. ... mlz
Figure 5-32 Tandem ESMS, using the conditions described in Table 5-7, of SeMet standard demonstrating the fragmentation pattern of the molecule.
239
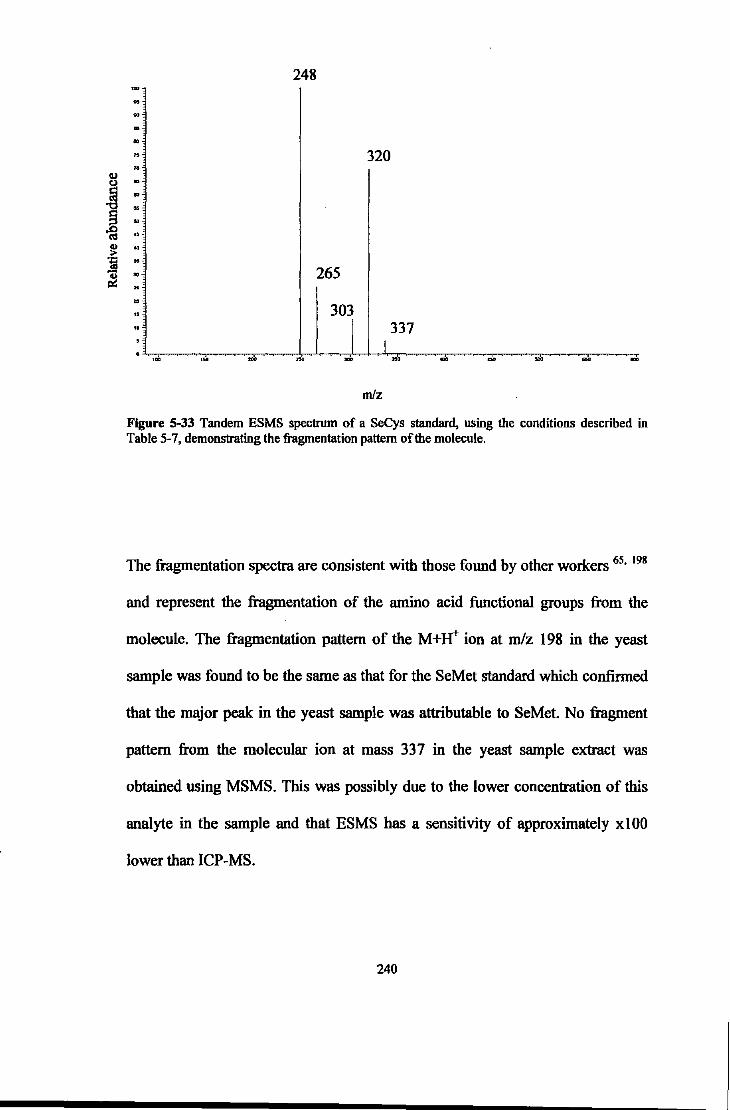
248
..
.. " ..
265
.. .. 303
"'
320
mfz
337 I .. ..
Figure 5-33 Tandem ESMS spectrum of a SeCys standard, using the conditions described in Table 5-7, demonstrating the fragmentation pattern of the molecule.
The fragmentation spectra are consistent with those found by other workers 65•
198
and represent the fragmentation of the amino acid functional groups from the
molecule. The fragmentation pattern of the M+W ion at rn/z 198 in the yeast
sample was found to be the same as that for the SeMet standard which confirmed
that the major peak in the yeast sample was attributable to SeMet. No fragment
pattern from the molecular ion at mass 337 in the yeast sample extract was
obtained using MSMS. This was possibly due to the lower concentration of this
analyte in the sample and that ESMS has a sensitivity of approximately xlOO
lower than ICP-MS.
240

The results usmg HPLC-ICP-MS and HPLC-ESMS, together with MSMS,
demonstrate the presence of selenium-containing compounds in the yeast sample
with the predominant species being that of SeMet.
5.5 Conclusions
The use of HPLC-ICP-MS in conjunction with HPLC-ESMS as complementary
techniques to one another has proved beneficial in the identification and
characterization of species that may otherwise remain unidentified. or in need of
corroborative evidence, when using each technique in isolation. The
chromatographic method developed requires minimal sample preparation time
and is compatible with both methods of detection.
Sample analysis using HPLC-ICP-MS of arsenic species in the Fucus sp. CRM
and the Ascophyllum nodosum demonstrated the presence of arsenic-containing
compounds with a similar elution time to that of the AsBet standard used. Using
HPLC-ESMS to provide complementary information, the eo-eluting peak in the
Ascophyllum nodosum sample was identified as that of the arsenosugar (328
mass units) 3-[ 5' -deoxy-5 '-( dimethylarsinoyl)-Jl-ribofuranosyloxy ]-2-
hydroxypropylene glycol. The eo-eluting peak, having a similar elution time to
that of AsBet, in the Fucus sp. was not identified. However, information was
obtained confirming the absence of AsBet. Further studies of the Fucus sp.
sample using HPLC-ESMS and MS-MS techniques gave a wealth of information
regarding a number of arsenic-containing compounds present. Characterization of
241

the species demonstrated the presence of three previously identified arsenosugars
18• 19 supporting the research carried out by other workers in that arsenosugars
form a major component of the arsenic found in marine algae 196
•
Selenium speciation using HPLC-ICP-MS together with the information obtained
using HPLC-ESMS in the selenized yeast sample, a prospective CRM, has
presented information that would otherwise be unavailable using HPLC-ICP-MS
alone. The major selenium-containing peak in the yeast sample matched the
elution time of the SeMet standard used in HPLC-ICP-MS. However, the
molecular information obtained using HPLC-ESMS provided an added certainty
of the species present This information is vital for materials that may be used as
CRMs as the purpose of CRMs is to offer a route of validation for analytical
procedures. Total elemental concentrations together with as much information as
possible regarding species information will prove useful when analyzing
materials of a similar nature. Where possible, materials being considered as
CRMs for speciation analysis should also consider the use of ESMS to provide
corroborative evidence of the 'actual' species present.
242

'·· .·/ ,,
I '
I•
.Chpptet sa
1:
.. ~ •.·

6 Conclusions and future work
6.1 Conclusions
Elemental speciation has become an essential component in the field of analytical
science due to increased awareness of the varying nature of the species of the
same element. Total elemental analysis is no longer adequate for the complete
understanding of the biochemical impact of an element in its environment.
Methodology designed to enable the separation, identification and quantification
of elemental species has utilized instrumental techniques where elegant
separation ·techniques have been hyphenated to sophisticated detectors according
to requirements. The versatility obtained by the use of HPLC together with the
low detection limit capabilities of ICP-MS, and their inherent compatibility, has
played a significant role in the extensive number of speciation studies performed.
However, for toxicological purposes, full speciation using HPLC may not always
be necessary. Separation of relatively toxic from relatively non-toxic species may
be sufficient for assessment and remediation.
Work was undertaken that focused on the separation of relatively toxic from
relatively non-toxic species of arsenic and selenium found in samples of
.environmental importance, with particular emphasis placed upon the food chain.
The aim was to develop a simple system that was efficient in separating,
identifying and quantifying the species according to the broader screening
characteristics of toxic versus less toxic whilst taking advantage of the their pi<.,.
values in order to achieve this. A quick, cheap, low-pressure and portable method
244

allowing both selenium and arsenic species to be quantified, if present, in the
same sample and at the same time using a suitable multi-element specific detector
was developed. The arsenic species studied were inorganic As01 and Asv, which
were broadly classified as relatively toxic, and AsBet and DMA, which were
broadly classified as being relatively non-toxic. The selenium species
investigated were inorganic Se1v and Se VI, which were broadly classified as
relatively toxic, and SeMet, which were broadly classified as being relatively
non-toxic.
A range of mini-columns of different dimensions were packed with two types of
anion-exchange resin and a series of experiments based upon optimization of
conditions to achieve the above aims were performed. The conditions studied
were eluent competitive counter ion type and concentration, eluent flow-rate,
column length, pH (to manipulate pKa values) and sample injection volume. The
preferred resolution was obtained using Hamilton PRP XlOO, 12-20 !lffi, resin.
These column dimensions allowed suitable separation of species in the presence
of competitive matrix ions from the sample digest without using unfavourably
high back-pressures, thus allowing the use of a low-pressure pump to control the
eluent flow-rate. A mobile phase of pH 10.2 created optimum conditions for
major charge differences on the species resulting in adequate separation and
resolution. Of the eluent competitive ion types studied; phosphate, phthalate and
sulphate, for a range of concentrations, the most efficient for clearly separating
both relatively toxic from relatively non-toxic arsenic and selenium species at the
same time was found to be the sulphate counter ion at 10 mM concentration.
245

The optimum conditions of I 0 mM K2S04 aqueous mobile phase at pH I 0.2 with
an eluent flow-rate of 1.25 ml min"1 using a lOO x 3 mm column packed with
Hamilton PRP XIOO, I2-20 J.Lm, resin and a sample injection volume of IOO J.Ll
were clearly demonstrated using standards, digests of certified reference
materials (DORM-2 and TORT-2) and digests of marine samples (plaice and
oyster). Separation of the arsenic and selenium species into their relative toxicity
classification was achieved in under 7 minutes. The conditions studied show
linearity up to 500 J.Lg 1"1 for the arsenic and selenium species, based upon their
inorganic and organic forms. Arsenic and selenium species were extracted from
all samples using trypsin for the marine samples and protease for the
Selenoprecise®. Extraction efficiencies were generally over 90% compared with
the total arsenic and selenium values determined using a HNOYH202 digest.
Mass balance calculations were performed for the CRMs TORT-2 and DORM-2,
the oyster and plaice samples and the Selenoprecise®. The mass balance results
compare more than favourably with the certified and reference values based upon
organic and inorganic arsenic and selenium calibration.
The validity ofthis simple procedure for screening biota samples in terms of their
arsenic and selenium toxicity was therefore demonstrated. Under the optimum
conditions employed, limits of detection were determined to be in the range of2-
I 0 J.Lg kg"1 for organic and inorganic arsenic and selenium species. The results for
the plaice, oyster and Selenoprecise® samples show that over 90% of both the
arsenic and selenium is present in the relatively non-toxic organic forms. This
rapid (under 7 mins) screening technique allows a suitable estimate of the
246

implications for human health to be made for the samples with regard to arsenic
and selenium without resorting to full speciation techniques.
To fully comprehend the biogeochemical cycling of elements in the environment
it is imperative to identify and determine the species of these elements in
conjunction with total element concentrations. To enable research in this vital
field of science to progress, the preparation and certification of a variety of
biologically and environmentally important materials for total element and
species concentrations is required. The advantages of using the more complex
HPLC methodology, where comprehensive separation and identification of
species can be achieved using optimum chromatographic conditions, was
demonstrated where samples of environmental importance were analysed as part
of a feasibility study for the future production of CRMs.
The work carried out, as one of the collaborating partners, in a European CRM
feasibility study was performed using ion-exchange HPLC-ICP-MS for the
separation and determination of arsenic species in fish, rice, chicken and soil
samples and selenium species in yeast and wheat samples. The role of the
University of Plymouth was to carry out a preliminary study on a variety of fish
types (plaice, monk, hake, haddock, cod, coley, pollack and whiting) to screen for
one fish type that would be suitable for inclusion in the feasibility study as a
candidate reference material. The plaice sample was chosen as it was decided that
it met the criteria of merit based upon it having a relatively high level of arsenic,
determined at 38.7 ± 1.9 mg kg"1 present in the form of AsBet, combined with the
247

best enzymatic extraction efficiency, determined at 98% using trypsin, seen for
all fish types under investigation. The presence of AsBet, as the major species
seen in the plaice sample extract, was confirmed using HG-AAS and anion and
cation-exchange HPLC-ICP-MS. Following processing by IRMM, homogeneity
and stability studies were performed on the plaice sample as part of the
certification process. Results for the plaice sample indicated that sample units
were homogenous, within and between unit, at an amount not less than 0.25 mg
and that the material was stable within the temperature range of 4-40°C and a
time-scale of 0-7 months.
The inter-laboratory comparison study for determination of arsenic and selenium
species in all candidate sample materials was performed with optimized
conditions for each sample using ion-exchange HPLC-ICP-MS. Enzymatic
extraction techniques for the speciation of the new candidate reference materials
were used throughout, with the exception of the soil samples. Trypsin was used
for extraction of arsenic species in the fish and chicken samples, cellulase for
extraction of arsenic species in the rice sample and H3P04 for the extraction of
arsenic species in the soil sample. Protease was used for the extraction of
selenium species in the yeast sample and trypsin for the extraction of selenium
species in the wheat sample. Extraction efficiencies were determined to be in the
range 92-100% demonstrating that the enzymes chosen were fit for purpose.
The results obtained demonstrated the presence of AsBet as the major species in
the fish sample, inorganic arsenic as the major species in the rice sample, organic
248

simple methylated species of DMA and MMA were present in the chicken
sample and the presence of inorganic arsenic species, in particular arsenate,
dominated the soil samples. The yeast sample showed the presence of selenium
as SeMet and the wheat sample contained both SeMet and SeCys, with SeMet
being the dominant species. The presence of the various arsenic and selenium
species in the samples appeared to conform to species found in similar samples
by other workers. The use of CRMs for method validation lent credibility to the
exercise. Quantification of samples were in close agreement with the certified or
reference values given for the CRMs. The success of the feasibility study will be
decided when all participating laboratories have submitted their results. It is
hoped that the materials under investigation will be suitable to go forward. in the
near future, for full certification.
The choice of selenium as a biologically important element, particularly in the
human diet, was fully recognized following the clinical trial carried out by Clarke
et al. 41 who demonstrated the efficacy of selenized yeast-based supplements in
providing a degree of protection against carcinogens. Since this time, much
research has been undertaken in order to identify the active form, or forms, of
selenium that confer these anticarcinogenic properties. Research work, for the
extraction of selenium species in two, new bio-natured nutrients, an alternative to
the commercially available selenium supplements was undertaken. The sample
types were a selenized yeast from a new process and a probiotic bacteria-based
dried milk sample (Biogurt®). A variety of extraction methods were employed
that included the use of enzymes, MeOH-based extractions and extraction with
249

KOH and TMAH. Fracturing of the cell walls of the sample materials was
attempted by freezing in liquid nitrogen as an alternative method for releasing the
cell contents. Examination of the samples, using scanning electron microscopy,
following freezing showed no change in the cell structure and, therefore, did not
enhance the extractability of selenium-containing compounds from the materials.
Methods that avoided species conversion with the highest extraction efficiencies
were found to be the use of protease for the yeast sample (19%) and the use of
0.01 M HCl for the Biogurt® (71%).1nformation obtained from the speciation of
these samples by anion and cation-exchange HPLC-ICP-MS was restricted due to
the low extraction efficiencies obtained for the samples and that the
chromatographic system was not fully optimized for resolution of the unknown
compounds from the standards used. Validation of the methodology employed
was obtained by the use of a well-studied yeast sample, available from Pbarma
Nord, where enzymatic extraction using both protease and trypsin gave extraction
efficiencies of 90-100%. The selenium was found as Se Met at 1005 ± 71 mg kg-1,
as the element, which compared favourably with the results obtained by
HNOYH202 digestion.
It is known that yeast-based selenium food supplements can demonstrate a
significant variety in the selenium species present with some brands showing
generally low recoveries of any form of selenium 131, and may have matrix
problems, which make effective extraction difficult The results from this study
250

seriously placed in doubt the availability of the organo-seleniwn species in the
selenized yeast and Biogurt® samples, which they were designed to deliver.
The use of HPLC-ICP-MS as a sophisticated analytical technique is undeniable.
However, a drawback associated with ICP-MS, an element-specific detector, is
the loss of structural information. The introduction of ESMS, which retains
molecular information, has enhanced the performance characteristics of HPLC
ICP-MS by its complementary use in the identification and characterization of
previously unknown compounds.
The identification of compounds by HPLC-ICP-MS has relied upon the
matching of retention times of analyte peaks to that of known standards.
Ambiguities can arise due to problems associated with eo-elution of compounds
and where pure standards are not commercially available. The complementary
use of HPLC-ESMS, where molecular information is retained, can overcome
these problems and assist in the characterization of previously unidentified
compounds. The use of HPLC-ESMS as complementary to that of HPLC-ICP
MS was used for part of the work towards this thesis in the identification of
selenium-containing compounds in yeast and for arsenic-containing compounds
in two marine algae. The yeast sample was chosen for the biological importance
of the form of selenium present, in terms of bioavailability and toxicity with
relation to human health. The marine algae samples were chosen as they are
known to contain arsenosugars, for which there are no commercially available
standards, and that arsenosugars may eo-elute with known arsenic standards, i.e.
AsBet and DMA, giving rise to potential errors in identification of species.
251

Development of an HPLC system that was compatible with ICP-MS and ESMS
was undertaken so that comparisons between the two techniques could be made.
Anion-exchange chromatography for the separation of arsenic and selenium
compounds comprising an isocratic mobile phase of 10 mM ~HC03 + 10%
MeOH, pH 10.2 for arsenic speciation and a gradient of 10-50 mM ~C03 +
10% MeOH, pH 5.0 for selenium speciation was found to provide optimum
conditions for use with both ICP-MS and ESMS detection. The volatile aqueous
NH.tHC03 mobile phase and the presence of MeOH assisted in the formation of
the gas phase ions. The presence of organic solvents is also advantageous for
ICP-MS sample detection in the reduction ofpolyatomic interferences 70.
Analysis of the marine algae samples using HPLC-ICP-MS demonstrated the
presence of arsenic-containing compounds in both samples. The first eluting peak
in both samples was at a similar retention time to that of the standard, AsBel
Further work using HPLC-ESMS identified this peak, obtained from the
Ascophyllum nodosum sample extract, as the arsenosugar 3-[5'-deoxy-5'
( dimethylarsinoyl)-P-ribofuranosyloxy ]-2-hydroxypropylene glycol (mass units,
328). No arsenic-containing compound was identified for the peak in the Fucus
sp. sample. However, the absence of AsSet was demonstrated using the SIM
mode in ESMS at mass 179 (M+W ion of AsBet) where no peaks were seen.
A full study of the Fucus sp. sample was undertaken. The presence of a number
of previously identified arsenic-containing compounds 18•
19 when using HPLC
ESMS together with tandem MS techniques, to obtain fragment pathways of the
252

parent molecule which assisted in the characterization of the arsenic-containing
compounds, were found. The peaks obtained using HPLC-ESMS corresponded to
the peaks obtained using HPLC-ICP-MS (having taken into account the shift in
elution times due to differences in the sample introduction train between the two
techniques) where the presence of arsenic was confirmed due to the element-
speciflcity of the ICP-MS detector.
A similar complementary use of HPLC-ICP-MS and HPLC-ESMS was
undertaken when investigating the yeast sample, a potential certified reference
material. The major species in the yeast sample was identified as SeMet. This
was confirmed by the matching of elution times with that of standards when
using HPLC-ICP-MS and from the fragmentation pathways seen using HPLC
ESMS in the tandem MS mode. The fact that element-specific and molecular
specific information was obtained using both techniques provided essential
speciation information, of particular use where materials are to be used as CRMs.
The simplicity of the methodology was an asset when compared to other work.
However, the limitations imposed upon the ESMS mode of action by matrix
suppression were found to be unacceptable. The lack of seeing elemental ions in
ESMS also contributed to limitations in species identification.
253

6.2 Future work
Future work, utilizing low-pressure mini-column liquid chromatography as an
initial, rapid screening method, for assessing the toxicological impact of an
element and its species may include the development of methodology for a wider
range of environmentally important samples and to include a broader range of
arsenic and selenium species. This may be achieved by further method
development of the system already devised and by the inclusion of cation-
exchange resins with optimization of chromatographic conditions. The use of
resins for pre-concentration of samples to achieve lower limits of detection would
be considerably useful for application in the study of waters and in the clinical
application for the study of biological fluids.
In the work described in chapter two, the DMA under investigation was assumed
to be less toxic than the inorganic forms of arsenic with methylation of inorganic
forms .being a detoxification pathway. However, research has come to light
suggesting that MMA and DMA in the +Ill oxidation state are as cytotoxic as
arsenite 199• Further work towards the understanding of the stability of these
compounds in the environment is needed together with the development in
methodology capable of separating the +Ill from the +V oxidation state of the
individual species.
The ability of analytical chemists to continue developments in methodology for
the production of CRMs that are certified for species as well as 'total' elemental
concentrations is particularly relevant when considering samples of biological 254
and environmental importance. The ability to separate and identify arsenosugars
present in marine algae samples is vital for progress to be made in understanding
the biochemical cycling of these compounds, the nature of their toxicities and
relationship to human health. Due to the diversity of functional groups possessed
by different arsenosugars and that some algae contain large amounts of lipid
bound arsenic, extraction procedures for obtaining the species may vary in their
efficiencies. This makes the detennination of species present in a sample difficult
to achieve with low uncertainties. Method validation cannot be applied
successfully due to the lack of CRMs certified for arsenosugars and the lack of
commercially available standards. However, operationally defined methods of
detennination in candidate reference material may be a starting point for the
inclusion of CRMs for arsenosugars to be made available commercially. Method
development using HPLC-ICP-MS with the complementary technique of ESMS
on a wide range of environmentally important samples will move forwards the
possibility of full characterization and quantification of species present in a
sample for use as certified reference materials. Work in the area of matrix
removal, to minimize suppression of the analyte signal by concomitant ions,
whilst keeping sample preparation to a minimum to make routine analysis
possible, is required to facilitate and enhance the wealth of information that can
be obtained.
Work is the area of species extraction from the sample matrix needs to focus
upon methods that are efficient and do not cause species conversion to take place.
In areas where selenoprotein information is required, the use of extraction
255

procedures that do not cleave aminoacid groups is fundamental to success. This
requires the use of either water/methanol-based extractions or enzymatic
extractions with non-proteolytic action. The possibility of devising sequential
extraction procedures will enable the researcher to obtain information regarding
the partition of selenium compounds within a sample matrix. Optimization of
these extraction procedures is necessary for their use to become part of routine
laboratory practice. The development of effective extraction procedures for the
analysis of selenized yeast cannot be over-emphasized due to the necessity in the
identification of the specific forms of selenium that may have a direct influence
on anticarcinogenic activity within the human body.
Work in the separation. identification and determination of selenium compounds
using chiral separations, isotope dilution techniques and ESMS instrumentation
would further assist in understanding the absorption. metabolic fate and
anticarcinogenic activity of selenium in foodstuffs or pharmaceutical preparations
following consumption by the human population. In addition. the biochemistry of
living organisms exhibits a strong enantioselectivity. Mammalian proteins are
built exclusively of L-amino acids and research has suggested that the D-
selenocystine is one third as toxic as L-selenocystine 200• Consequently, research
on the biological activity of selenomethionine and the analytical control of
selenium-containing supplements require access to methodologies that are able to
perform optical resolution and determination of D,L-selenomethionine
enantiomers. This has been achieved by HPLC on cyclodextrin columns which
requires a derivatization step 201 and more recently by the use of chiral crown
256

ether columns that do not require derivatization of the enantiomeric forms of the
analyte 202.
It is crucial that analytical capabilities in the field of speciation continue to
progress in order to appreciate, in greater detail, the effects of trace elements in
the health of the general population. Coupled techniques, such as HPLC-ICP-MS
and HPLC-ESMS, offer an attractive route towards this aim. Improved method
development together with a wider choice of standards and CRMs for quality
control and assurance will play an essential role in this.
257

1 Centeno, J.A., Mullick, F.G., Martinez, L., Page, N.P., Gibb, H., Longfellow,
D., Thompson, C. and Ladich, E.R., Environmental Health Perspectives, 2002,
110, 1-4.
2 Foster, L.H. and Sumar, S., Crit. Rev. Food Sci. Nutr., 1997,37, 211-228.
3 Azcue, J.M. and Nriagu, J.O., Arsenic: Historical Perspectives, in: Nriagu,
J .O.(Ed), Arsenic in the Environment. Part 1: Cycling and Characterization. John
Wiley & Sons, New York, 1994, pg 1-14.
4 Comelis, R., Camara, C., Ebdon, L., Pitts, L., Welz, B., Morabito, R., Donard,
0., Crews, H., Larsen, E.H., Neidhart, B., Ariese, F., Rosenberg, E., Mathe, D.,
Morrison, G.M., Cordier, G., Adams, F., Van Doren, P., Marshall, J., Stojanik,
B., Ekvall, A. and Quevauviller, P., Fresenius J. Anal. Chem., 1999, 363, 435-
438.
5 Buchet, J.P., Lison, D., Ruggeri, M., Foa, V. and Elia, G., Arch Toxicol., 1996,
70, 773-778.
6 Alam, M.G.M., Allinson, G., Stagnitti, F., Tanaka, A. and Westbrooke, M., lnt.
J. Environ. Heal. R., 2002, 12,236-253.
7 Holben, D.H. and Smith, AM., J. Am. Diet. Assoc., 1999, 99, 836-843.
8 Chilvers, D.C. and Peterson, P.J., in: Hutchinson, T.C. and Meema, K.M. (Eds),
Lead, Mercury, Cadmium and Arsenic in the Environment. Wiley, New York,
1987; pg. 279.
9 Merian, E. (Ed), Metals and their Compounds in the Environment: Occurrence,
Analysis and Biological Relevance. VCH, New York,1991.
258

1° Cullen, W. and Reimer, K., Chem. Rev., 1989,89, 713-763.
11 Shiomi, K., Arsenic in Marine Organisms: Chemical Forms and Toxicological
Aspects, in: Nriagu, J.O. (Ed), Arsenic in the Environment, Partll: Human Health
and Ecosystem Effects. John Wiley & sons Inc., New York, 1994 Vol27, Ch 12.
12 Ministry of Agriculture, Fisheries and Food, Survey of Arsenic in Food, Food
Surveillance paper No. 8, Her Majesty's Stationary Office, London, 1982.
13 Jones, A., cited in: Francesconi, K. and Edmonds, J., Advances in Inorganic
Chemistry, 1997,44, 147-189, pg 148.
14 Francesconi, K. and Edmonds, J., Biotransformation of Arsenic in the Marine
Environment, in: Nriagu, J.O.(Ed), Arsenic in the Environment. Part 1: Cycling
and Characterization. John Wiley & Sons, New York, 1994, pg 221-261.
15 Francesconi, K. and Edmonds, J., Advances in Inorganic chemistry, 1997, 44,
147-189.
16 Maeda. S., Biotransformation of Arsenic in the Freshwater Environment, in:
Nriagu, J.O.(Ed), Arsenic in the Environment. Part 1: Cycling and
Characterization. John Wiley & Sons, New York, 1994, pg 155-187.
15 Challenger, F., Chem. Ev., 1945,36,315-361.
18 Edmonds, J.S. and Francesconi, K.A., Nature, 1981,289, 602-604.
19 Francesconi, K.A., Edmonds, J.S., Stick, R. V., Ske1ton, B.W. and White,
A.H., J. Chem. Soc. Perkin Trans., 1991, 1, 2707-2716.
259

2° Francesconi, K.A. and Edmonds, J.S., Rapid Commun. Mass spectrom., 2001,
15, 1641-1646.
21 Shibata, Y. and Morita, M.,Agric. Bioi.Chem., 1998,52, 1087-1089.
22 Edmonds, J.S., Francesconi, K.A., Cannon, J.R., Raston, C.L., Skelton, B.W.
and White, A.H., cited in: Francesconi, K. and Edmonds, J., Advances in
Inorganic chemistry, 1997,44, 147-189.
23 Cullen, W.R. and Nelson, J., Appl. Organomet. Chem., 1993,7,319-327.
24 Hanaoka, K.., Tagawa, S. and Kaise, T., Appl. Organomet. Chem., 1992, 6,
139-146.
25 Khokiattiwong, S., Goessler, W., Pedersen, S.N., Cox, R. and Francesconi,
K.A., Appl. Organomet. Chem., 2001, 15,481-489.
26 Brockbank, C.l., Bately, G.E. and Low, G.K., Environ. Technol. Lett., 1988, 9,
1361-1366.
27 Gettar, R.T., Garavaglia, R.N., Gautier, E.A. and Bastioni, D.A., J.
Chromatogr. A, 2000, 884,211-221.
28 Vela, N. and Caruso, J., J. Anal. At. Spectrom., 1993,8,787-794.
29 Chambaz, D., Edder, P. and Haerdi, W ., J. Chromatogr. A, 1991, 541, 443-452.
30 Lopez-Gonzalvez, M., Gomez, M., Palacios, M. and Camara, C.,
Chromatograph/a, 1996,43, 507-512.
31 Buchet, J.P. and Lauwerys, R.R., Toxicol. Appl. Pharmacal. 1987,91,65-74.
260
32 Sanders, J.G., Reidel, G.F., and Osman, R. W., Arsenic Cycling and its Impact
in Estuarine and Coastal Marine Ecosystems, in: Nriagu, J.O.(Ed), Arsenic in the
Environment. Part 1: Cycling and Characterization. John Wiley & Sons, New
York, 1994; Chapter 12.
33 Environmental Health Criteria 58, Selenium. World Health Organisation,
Geneva, 1987.
34 Ohlendorf, H.M., Hoffinan, D.J., Salki, M.K. and Aldrich, T.W., Sci. Total
Environ., 1986, 52, 49-63.
35 Salki, M.K. and Lowe, T.P., Arch. Environ. Con/am. Toxico/., 1987, 19, 496-
499.
36 Larsen, E.H., Hansen, M., Fan, T. and Vahl, M., J. Anal. At. Speclrom., 2001,
16, 1403-1408.
37 Terry, N., Zayed, A.M., de Souza, M.P. and Tarun, A.S., Annu. Rev. Plant
Physiol. Plant mol. Bioi., 2000, 51,401-432.
38 Hopper, J.L. and Parker, D.R., Plant soil, 1999,210, 199-207.
39 Zayed, A., Lytle, C.M. and Terry, N., Planta 1998,206,284-292.
40 Whanger, P.D., J.Am.Coll. Nutr., 2002, 21, 223-232.
41 Spallholz, J.E., Free Radical Biology and Medicine, 1994, 17, 45-64.
42 Bock, A., Forchhammer, K., Heider, J., Leinfelder, W., Sawers, G., Veprek, B.
and Zinoni, F., Mol. Microbiol., 1991, 5, 515-520.
261

43 Patching, S.G. and Gardiner, P.H.E., J. Trace Elements Med Bioi., 1999, 13,
193-214.
44 Ip, C., J. Nutr., 1998, 128, 1845-1854.
45 Bronzetti, G., Cini, M., Andreoli, E., Caltavuturo, L., Panunzio, M. and Croce,
C., Mutation Research, 2001,496, 105-115.
46 Moreno-Reyes, R., Suetens, C., Mathieu, F., Begaux, F., Zhu, D., Rivera, M.T.,
Boelaert, M., Neve, J., Perlmutter, N. and Vanderpas, J., N. Engl. J. Med, 1998,
339, 1112-1120.
47 Clark, L., Combs, G., Turnbull, B., Slate, E., Chalk:er, D., Chow, J., Davies, L.,
Glover, R., Graharn, G., Gross, E., Krongrad, A., Lesher, J., Park, H., Sanders,
B., Smith, C. and Taylor, J., J. Am. Med. Assoc., 1996,276, 1957-1963.
48 Ip, C., El-Bayourny, K., Upadhyaya, P., Ganther, H., Vadhanavikit, S. and
Thompson, H., Carcinogenesis, 1994,15, 187-192.
49 Davies, C.D., Feng, Y., Hein, D.W. and Findey, J.W., J. Nutr., 1999, 129, 63-
69.
50 Beech, S.G., Walker, S.W., Becket, G.J., Artur, J.R., Nicol, F. and Lee, D.,
Analyst, 1995, 120, 827-831.
51 Thompson, C., Analyst, 1998, 123, 827-831.
52 Rayman, M., Lancet, 2000, 356, 233-241.
53 Jacobs, M. and Frost, C., J. Toxicol. Environ. Health, 1981,8, 575-585.
262

54 Neve, J., J. Trace Elem. Med Bioi., 1995,9, 69- 73.
55 Taylor, A., Branch, S., Fisher, A., Halls D. and White, M., J. Anal. At.
Spectrom., 2001, 16,421-446.
56 Sarzanini, C. and Mentasti, E., J. Chromatogr. A, 1997,789,301-321.
57 Pergantis, S., Francesconi, K., Goessler, W. and Thomas-Oates, J., Anal.
Chem., 1997,69,4931-4937.
58 Robards, K., Starr, P.and Palisades, E., Analyst, 1991, 116, 1247-1269.
59 Englehardt, H., High Performance Liquid Chromatography. Chemical
Laboratory Practice. Springer-Verlag, New York, 1979.
60 Meyer, V., Practical High-Performance Liquid Chromatography. Wiley &
Sons, New York, 1998.
61 Montaser, A. (Ed), Inductively Coupled Plasma Mass Spectrometry. Wiley
VCH, New York, 1998.
62 Hill, S. (Ed), Inductively Coupled Plasma Spectrometry and its Applications.
CRC Press, Florida, USA. 1999, Ch. 5, pg 119.
63 Greenfield, S., Spectrochim. Acta, B, 1983,38, 93-105.
64 Date, A.R and Gray, A. L.,Analyst, 1983,108, 159-165.
65 Crews, H., Clarke, P., Lewis, D., Owen, L., Strutt, P. and lzquierdo, A., J.
Anal. At. Spectrom., 1996, 11, 1177-1182.
263
66 Chatterjee, A., Talanta, 2000, 51, 303-314.
67 Townshend, A. (Ed), Encyclopaedia of Analytical Science. Academic Press,
New York, 1995.
68 Evans, E.H., Atomic Spectrometry Short Course, University Plymouth.
69 Evans, E.H. and Giglio, J.J., J. Anal. At. Spectrom., 1993, 8, 1-18.
70 Evans, E.H. and Ebdon, L.,J. Anal. At. Spectrom., 1990, S, 425-429.
71 Yamashita, M. and Fenn, J.B., J. Phys. Chem., 1984,88,4451-4459.
72 Aleksandrov, M.L., Gall, L.N., Krasnov, N.V., Nikolaev, V .I., Pavlenko, V.A.,
Shkurov, V.A., Baram, G.l., Gracher, M.A., Knorre, V.D. and Kusner, Y.S.,
Bioorg. Khim., 1984,10, 710-712.
73 Iribame, J.V. and Thompson, B.A., J. Chem. Phys., 1976,64,2287-2294.
74 Dole. M., Mack, L.L., Hines, R.L., Mobley, R.C., Ferguson, L.D. and Alice,
M.B., cited in: Whitehouse, C.M., Dreyer, R.N., Yarnashita, M. and Fenn, J.B.,
Anal. Chem., 1985, 57, 675-679.
75 Kebarle, P ., J. Mass Spectrometry, 2000, 35, 804-817.
76 Cole, R.B., J. Mass Spectrometry, 2000, 35, 763-772.
71 Kebarle, P. and Tang, L., Anal. Chem., 1993,65, 972-985.
78 Bruins, A.P.,J.Chromatogr., A, 1998,794,345-357.
264

79 Amad, M.H., Cech, N.B., Jackson, J.S. and Enke, C.G., J. Mass Spectrom.,
2000, 35, 784-789.
80 Guerin, T., Astruc, A. and Astruc, M., Talanta, 1999,50, 1-24.
81 Kohlmeyer,U., Kuballa. J. and Jantzen, E., Rapid Commun. Mass Spectrom.,
2002, 16, 965-974.
82 Sunar, M., Devesa. V., Rivas, I., Velez, D. and Montoro, R., J. Anal. At.
Spectrom., 2000, 15, 1501-1507.
83 Larsen, E., Pritzl, G. and Hansen, S., J. Anal. At. Spectrom., I 993, 8, 1075-
1084.
84 Pardo-Martinez, M., Vinas, P., Fisher, A. and Hill, S., Anal. Chim. Acta, 2001,
337,29-36.
85 Van Hulle, M., Zhang, C., Zhang, X. and Comelis, R, Analyst, 2002, 127,634-
640.
86 Gammelgaard, B., Jons, 0. and Bendahl, L., J. Anal. At. Spectrom., 2001, 16,
339-344.
87 Tirez, K., Brusten, W., Van Roy, S., De Brucker, N. and Diets, L., J. Anal. At.
Spectrom., 2000, 15, 1087-1092.
88 Ipolyi, I. and Fodor, P., Anal. Chim. Acta, 2000, 413, 13-23.
89 Lindemann, T., Prange, A., Dannecker, W. and Neidhart, B., Fresenius J. Anal.
Chem., 1999,364,462-466.
265

90 Larsen, E., Speclrochimica Acta B, 1998,53,253-265.
91 Pantsar-Kallio, M. and Manninen, P., J. Chromatogr. A, 1997, 779, 139-146.
92 Sutton, K. and Caruso, J., J. Chromatogr. A, 1999, 856, 243-258.
93 Gilon, N., Potin-Gautier, M. and Astruc, M., J. Chromatogr. A, 1996, 750,
327-334.
94 Yalcin, S. and Le, X.C., Talanta, 1998,47, 787-796.
95 Hanna, C., Tyson, J. and Mclntosh, S., Clin. Chem., 1993,39, 1662-1667.
96 Bendahl, L., Sidenius, U. and Gammelgaard, B., Anal. Chim. Acta, 2000, 411,
103-108.
97 Pyrzynska, K., Drzewicz, P. and Trojanowicz, M., Anal. Chim. Acta, 1998,
363, 141-146.
98 Mester, Z. and Fodor, P., Anal. Chim. Acta, 1999,386, 89-97.
99 Rivas, C., Ebdon, L. and Hill, S., J. Anal. At. Spectrom., 1996, 11, 1147-1150.
100 Branch, S., Ebdon, L., Ford, M., Foulkes, M.E. and O'Neill, P.; J. Anal. At.
Spectrom., 1991, 6, 151-154.
101 Millward, G., Ebdon, L. and Walton, A., Appl. Organomet. Chem., 1993, 7,
499-511.
102 Mattusch, J. and Wennricb, R., Anal. Chem., 1998, 70, 3649-3655.
266

103 Wanghom, S. and Pergantis, S., J. Anal. At. Spectrom., 2000, 15,627-633.
104 Inoue, Y., Kawabata, K., Takahashi, H. and Endo, G., J. Chromatogr. A,
1994,675, 149-154.
105 Kawabata, K., Inoue, Y., Tahabashi, H. and Endo, G., Appl. Organomet.
Chem., 1994, 8, 245-248.
106 Schlegel, D., Mattusch, J. and Dittrich, K., J. Chromatogr. A, 1994, 683, 261-
267.
107 Guerin, T., Astruc, M., Batel, A. and Borsier, M., Talanta, 1997, 44, 2201-
2208.
108 Burguera, M. and Burguera, J., Talanta, 1997,44, 1581-1604.
109 Spumar, J., Analyst, 2000, 125,963-988.
" 0 McSheehy, S., Szpunar, J., Lobinski, R., Haldys, V., Tortajada, J. and
Edmonds, J.S., Anal. Chem., 2002, 74, 2370-2378.
111 Casiot, C., Szpunar, J., Lobinski, R. and Potin-Gautier, M., J. Anal. At.
Spectrom., 1999, 14, 645-650.
112 Corr, J. and Larsen, E., J. Anal. At. Spectrom., 1996, 11, 1215-1224.
113 McSheehy, S., Marcinek, M., Chassaigne, H. and Szpunar, J., Anal. Chim.
Acta, 2000,410, 71-84.
" 4 Montes-Bayon, M., LeDuc, D., Terry, N. and Caruso, J.; J. Anal. At.
Spectrom, 2002, 8, 872-879. 267

115 Cao, T., Cooney, R., Woznichak, M., May, S. and Browner, R., Anal. Chem.,
2001, 73, 2898-2902.
116 Madsen, A., Goessler, W., Pedersen, S. and Francesconi, K., J. Anal. At.
Spectrom., 2000, 15, 657-662.
117 Edmonds, J. and Morita, M., Pure Appl. Chem, 1992,64, 575-590.
118 Guidelines for the Production and Certification of BCR reference materials.
European Commission, Directorate General XII. Science, research and
Development. Doe. BCR/48/93. 1994.
119 DEFRA, Regulations for Chemical Contaminants and Naturally Occurring
Toxicants in Food. Summary 16, Section Ill.
Web: http://www.defra.gov.uklresearch/econeval/chemcontlsec iii pdf
120 Ebdon, L., Pitts, L., Cornelis, R., Crews, H., Donard, O.F.X. and
Quevauviller, P. (Eds), Trace Element Speciation for Environment, Food and
Health. Royal society of Chemistry, Cambridge, 2001.
121 Whanger, P., Vendeland, S., Park, Y-C. and Xia, Y., Ann. Clin. Lab. Sci., 1996,
29, 99-113.
122 Lamble, KJ. and Hill, SJ., Anal. Chim. Acta, 1996,334,261-270.
123 Prohaska, C., Steffan, I., Pomazal, K. and Torvenyi, A., J. Anal. At. Spectrom.,
2000,15,97-102.
124 Gettar, R. T., Garavaglia, R.N., Gautier, E.A. and Batistoni, D.A., J. Chromatogr.
A, 2000,884,211-221.
268

125 Emteborg, H., Bordin, G. and Rodriguez, A.R., Analyst, 1998, 123, 245-253.
126 Vilano, M., Padro, A. and Rubio, R., Anal. Chim. Acta, 2000, 4ll, 71-79.
127 Puskel, E., Mester, Z. and Fodor, P., J. Anal. At. Spectrom., 1999,14,973-976.
128 NTP Chemical Repository
Web: http://ntp=db.niehs.nih.gov/NTP-reportsfNTP-
Chem HS HTMLfNTP Chem!Radian10102-18-8.html
129 Kingston, H.M. and Jassie, L.B. (Eds), Introduction to Microwave Sample
Preparation . Theory and Practice. American Chemical Society, Washington D.C.,
1988.
130 Kingston, H.M. and Jassie, L.B., Anal. Chem., 1986, 58, 2534-2541.
131 B'Hymer, C. and Caruso, J., J. Anal. At. Spectrom., 2000, 15, 1531-1539.
132 Branch, S., Ebdon, L., and O'Neill, P., J. Anal. At. Spectrom., 1994,9, 33-37.
133 Gilon, N., Astruc, A., Astruc, M. and Potin-Gautier, M., Appl. Organomet.
Chem., 1995 9 623-628.
134 Hansen, S.H., Larsen, E.H., Pritzl, G. and Cornett, C., J. Anal. At. Spectrom.,
1992, 7, 629-634.
135 Li, F., Goessler, W. and lrgolic, K..J., J. Chromatogr. A, 1999,830, 337-344.
136 Meyer, V., Practical High-Performance Liquid Chromatography, 3nl edition,
John Wiley & Sons, Chichester, 1998.
269

137 Hakala, E. and Pyy, J., J. Anal. At. Spectrom., 1992, 7, 191-196.
138 Velez, D., Ybanez, N. and Montoro, R., J. Anal. At. Spectrom., 1996, 11, 271-
277.
139 Craig, J.M. and Beauchemin, D., J. Anal. At. Spectrom., 1992, 7, 937-942.
140 Lobinski, R. and Szpunar, J., Anal. Chim. Acta, 1999, 400, 321-332.
141 Quevauviller, P., J. Anal. Atom. Spectrom., 1996, 11, 1225-1231.
142 Adams, F., Dero, B., Marshal), J., Stojanik, B., Ekvall, A. and Quevauviller,
P., Trend Anal. Chem., 2000,19,211-214.
143 Stuart, M. and Squirrell, A., A cered Qual. Assur., 2001, 6, 38-40.
144 European Commission: DG XII (1994) Guidelines for the Production and
Certification of BCR Reference Materials - Document BCR/48/93. European
Commission, Brussels.
145 Quevauviller, P., J. Anal. Atom. Spectrom., 1996, 11, 125-1231.
146 Linsinger, T.PJ., Pauwels, J., van der Veen, A.M.H., Schimmel, H. and
Lamberty, A., Acced Qual. Assur., 2001, 6, 20-25.
147 Ebdon, L. and Pitts, L. (project coordinators),Feasibility Study for Speciated
CRMs for Arsenic in Chicken, rice, fish and Soil and Selenium in Yeast and
Cereal (SEAS). European community - 'Competitive and Sustainable Growth·
project. Contract no. G6RD-CT-2001-00473.
270
148 Goessler, W., Kuehne1t, D., Schlagenhaufen, C., S1ejkovec, Z. and Irgolic,
K.J., J. Anal. Atom. Spectrom., 1998, 13, 183-187.
149 Chen, H., Brindle, I. D. and Le, X-C., Anal. Chem., 1992, 64, 667-672.
150 Lagarde, F., Anu·an, M.B., Leroy, J.F., Demesmay, C., Olle, M., Lamotte, A.,
Muntau, H., Michel, P., Thomas, P., Caroli, S., Larsen, E., Bonner, P., Rauret, G.,
Moulkes, M.E., Howard, A., Griepink, B. and Maier, E.A., Fresenius J. Anal.
Chem., 1999,363, 5-11.
151 Hanoaka, K., Tagawa, S. and Kaise, T., Appl. Organomet. Chem., 1992, 6,
139-146.
152 Edmonds, J.S. and Francesconi, K.A., Sci. Total Environ., 1987,64,317-323.
153 Shiomi, K., Aoyama, M., Yarnanaka,H. and Kikuchi, T., Comp. Biochem.
Physiol., 1988, 90c, 361-365.
154 Munoz, 0., Devesa, V., Sumer, M., Velez, D., Montoro, R., Urieta, I., Macho,
M. and Jalon, M., J. Agric. Food Chem., 2000, 48, 4369-4376.
155 Thomas, P. and Sniatecki, K., Fresenius J. Anal. Chem., 1995,351,410-414.
156 Munoz, 0., Velez, D. and Montoro, R., Analyst, 2000, 15, 601-607.
157 Millward, G., Ebdon, L. and Walton, A., App/. Organometal. Chem., 1993, 7,
499-511.
158 Kirby, J. and Maher, W., App/. Organometa/. Chem., 2002, 16, 108-115.
271 .

159 Linsinger, T.P.J., Pauwels, J., van der Veen, A.M.H., Schimmel, H. and
Lamberty, A., Accred Qual. Assur., 2001, 6, 20-25.
160 Maier, E.A., Demesmay, C., Olee, M., Lamotte, A., Lagarde, F., Heimburger,
R., Leroy, M.J.F., Asfari, Z. and Muntau, H., The Certification of the Contents
(Mass Fraction) of Arsenobetaine in Solution (CRM 626) and of total arsenic,
arsenobetaine and dimethylarsinic acid in Tuna Fish Tissue (CRM 627).
European Commission, BCR information, reference materials. EUR 17889 EN.
161 Thomas, P., Finnie, J.K. and Williams, J.G., J. Anal. At. Spectrom., 1997, 12,
1367-1372.
162 Abedin, M. J., Cotter-Howells, J. and Meharg, A.A., Plant and Soil, 2002,
240,311-319.
163 WHO Food Additives, Series 24.
Web: http:/www.inchem.org/docurnents/jecfa/jecmono/v024je08.htm
164 Heitkemper, D.T., Nohora, P.V., Stewart, K.R. and Westphal, C.S., J. Anal.
At. Spectrom., 2001, 16, 299-306.
165 Abedin, M.J., Feldmann, J. and Meharg, A.A., Plant Physiol., 2002, 128,
1120-1128.
166 Tessema, D.A. and Kosmus, W., J. Trace Microprobe Tech., 2001, 19, 297-
278.
167 Yang, J.K., Barnett, M.O., Jardine, P.M., Basta, N.T. and Casteel, S.W.,
Environ. Sci. Technol., 2002, 36, 4562-4569.
272

168 Vahter, M., Concha, G. and Nermell, B., J. Trace Elem. Exp. Med., 2000, 13,
173-184.
169 DEFRA, Regulations for chemical contaminants and naturally occurring
toxicants in food. Summary 16, Section Ill
Web: http://www.defra.gov.uk/research/econevallchemcont/sec_iii pdf
170 Bohari, Y., Lobos, G., Pinochet, H., Pannier, F., Astruc, A. and Potin-Gautier,
M., J. Environ. Monit., 2002, 4, 596-602.
171 Wenzel, W.W., Brandstetter, A., Wutte, H., Lombi, E., Prohaska, T.,
Stingeder, G. and Adriano, D.C., J. Plant Nutr. Soil Sci., 2002, 165,221-228.
172 Montes-Bayon, M., Grant, T.D., Meija, J. and Caruso, J.A., J. Anal. At.
Spectrom., 2002, 17, 1015-1023.
173 Rayman, M.P., Br. Med J., 1997,314, 387-388.
174 Bird, S.M., Uden, P.C., Tyson, J.F., Block, E. and Denoyer, E., J. Anal. At.
Spectrom., 1997,12,785-788.
m Clark, L.C.; Combs, G.F.; Turnbull, B.W.; Slate, E.H.; Chalker, D.K.; Chow,
J.; Davis, L.S.; Glover, R.A.; Graham, G.F.; Gross, E.G.; Kongrad, A.; Lesher,
J.L.; Park, H.K.; Sanders, B.B.; Smith, C.L.; Taylor, J.R.; J. Am. Med Assoc.,
1996,276,1957-1963.
176 Levander, O.A., Ann. Rev. Nutr.; 1987, 7, 227-250.
177 Moser-Veillon, A., Mangels, A.R., Patterson, K. Y. and Veillon, C., Aanlyst,
1992, 117, 559-562.
273

178 Clausen, J. and Nielsen, S.A., cited in: Ebdon, L.; Pitts, L.; Comelis, R.;
Crews, H.; Donard, O.F.X.; Quevauviller, P. (Eds.), Trace Element Speclationfor
Environment, Food and Health. Royal Society of Chemistry, Cambridge, 2002,
pg 274.
179 Quijano, M.A., Moreno, P., Gutierrez, A.M., Perez-Conde, M.C. and Camara,
C., J. Mass Spectrom.; 2000,35, 878-884.
180 Mendez, S.P., Bayon, M.M., Gonzalez, E.B. and Sanz-Medel, A., J. Anal. At.
Spectrom., 1999, 14, 1333-1337.
181 Casiot, C., Szpunar, J., Lobinski, R. and Potin-Gautier, M., J. Anal. At.
Spectrom., 1999, 14, 645-650.
182 Pedersen, G.A. and Larsen, E.H., Fresenius J. Anal. Chem., 1997, 358, 591-
598.
183 Emteborg, H., Bordin, G. and Rodriguez, A.R., Analyst, 1998, 123, 245-253.
184 Blotcky, AJ., Hansen, G.T., Borkar, A., Ebrahim, A. and Rck, E.P., Anal.
Chem., 1987,59,2063-2066.
185 Crews, H.M.; Clarke, P.A.; Lewis, D.J.; Owen, L.M.; Strutt, R.; Izquierdo, A.;
J. Anal. Atom. Spectrom., 1996,33, 1177-1182. 186 Guerin, T.; Astruc, A.; Astruc, M.; Talanta 1999 50 1-24.
187 Pergantis, S.A., Heithmar, E.M. and Hinners, T.A., J. Anal. Atom. Spectrom.,
1997,122,1063-1068.
188 Kotrebai, M., Tyson, J.F., Block, E. and Uden, P., J. Chromatogr. A, 2000,
866, 51-63.
274

189 Larsen, E.H., Fresenius J. Anal. Chem., 1995, 352, 582-588.
190 Francesconi, K.A., Khokiattiwong, S., Goessler, W., Pederson, S.N. and
Pavkov, M., Chem. Commun., 2000, 12, 1083-1084.
191 Siu, K.W.M., Guevremont, R., Le Blanc, J.C.Y., Gardner, G.J. and Berman,
S.S., J.Chromatogr. A, 1991, 554,27-38.
192 Le, X.C., Cullen, W.R. and Reimer, K.J.; Clin. Chem., 1994,40,617-624.
193 Pergantis, S.A.; Wangkarn, S.; Francesconi, K.A.; Thomas-Oates, J.E.; Anal.
Chem., 2000, 72,357-366.
194 Larsen, B.R., Astorga-Liorens, C., Florencio, M.H. and Bettencourt, A.M., J.
Chromatogr. A, 2001,926, 167-174.
195 Gomez-ariza, J.L., Sanchez-Rodas, D. and Morales, E., Analyst, 2000, 125,
401407.
196 Gallagher, P.A., Wei, X., Shoemaker, J.A., Brockhoff, C.A. and Creed, J.T.;
J.Anal. Atom. Spectrom., 1999, 14, 1829-1834. 197 Olivas, R.M., Donard, F.X.D., Gilon, N. and Potin-Gautier, M., J. Anal. Atom.
Spectrom., 1996,11, 1171-1176.
198 Cao, T.H., Cooney, R., Woznichak, M.M., May, S.W. and Browner, R.F.,
Anal.Chem.,2001, 73,2898-2902.
199 Hughes, M.F.; Toxicology Letters, 2002, 133, 1-16.
275

200 McAdam, P.A. and Levander, O.A., Nutr. Res., 1987, 7, 601-610.
201 Perez Mendez, S., Blanco Gonzalez, E., Fernandez Sanchez, M.L. and Sanz
Medel, A., J. Anal. At. Spectrom., 1998, 13, 893-898.
202 Ponce de Leon, C.A., Sutton. K.L., Caruso, J.A. and Uden, P.C., J. Anal. At.
Spectrom., 2000, 15, 1103-1107.
276
Courses, conferences and seminars attended
Courses.
Analytical Atomic Spectrometry Short Course - 4-8 Oct 99 University of
Plymouth
AMS 592: Research Skills Oct-Dec 99 University of Plymouth
Conferences.
Young Researchers' Meeting R&D, UMIST, Manchester, UK, 16-17 April2000.
Poster presentation: Advancement in Methodology for Speciation in
Environmental Samples by ICP-MS
BNASS 101h Biennial Conference, Sheffield 17-20 July 2000.
Poster presentation: Advancement in Methodology for Speciation of Arsenic and
Selenium using HPLC-ICP-MS.
4th Euroconference on Environmental Analytical Chemistry, Budapest, Hungary,
14-19 September 2000.
Poster presentation: Separation and Detection of Trace Metal Species in
Environmental Samples by HPLC-ICP-MS.
277

Analytical Research Forum incorporating Research and Development Topics.
University of East Anglia, Norwich, UK, 16-18 July, 2001.
Poster presentation: Advancement in Methodology for Simultaneous Separation
of Arsenic and Selenium Species by LC-ICP-MS.
5th Euroconference on Environmental Analytical Chemistry. The Impact of(Bio-)
Sensors and Bioanalytical Techniques in Environmental Analytical Chemistry.
Blarney, Ireland, 8-12 September, 2001.
Poster presentation: Advancement in Methodology for Simultaneous Separation
of Arsenic and Selenium Species by LC-ICP-MS.
BNASS 11th Biennial Conference, Loughborough University, 8-10 July 2002.
Oral presentation - Advancement in Methodology for the determination of
Arsenic and Selenium species by HPLC-ICP-MS and ESMS.
Arsenic Speciation Workshop, Ghent, Belgium, 11-12 September, 2002.
Poster presentation: Advancement in Methodology for the Speciation of Arsenic
and Selenium using HPLC-ICP-MS and ESMS.
2nd International Franco-Spanish Workshop on Bio-inorganic Analytical
Chemistry, Pau, France, 26-28 September, 2002.
Oral presentation: Advancement in Methodology for the determination of
Arsenic and Selenium species by HPLC-ICP-MS and ESMS
278

,, 1: ' 1:'
I
I·
I I
I I
I I I I i
I I
ll •: 1:
'· ... )· . •'
...
In~house semiliar presentations;
June;..2000: Arsenic Spe'ciation. • 0 o I ' ; • '~< • •
'lytay,;2001: ,Pfeparatioriiand:altaiysis of, materials_ for c(!rtificai:i()n . ' ,
' ' April, .2()02: Adv~cem~nt: fu. Me~odology for the!determination :ot:'Arsemc iuld
:Seleniwmspecies byHPLC-IGP~Ms aiidiESMS
Published work:
1. ~Ebdon~ L, Fitzpatridq S. and Foulkes, M}:., Cf!em: Ana/, {Warsaw); '2002,
47 179~188: '· .. , ' ·- . , __ ----
2. FitipatricK,, S~, ':EJ:ldon; L. and I Fmilkes, M.E.,fntern. J. EniJit:on; .Anal: Chem;,
279
,•