species in the balance: partnering on tools...
TRANSCRIPT

FEBRUARY 2018
REPORT
SPECIES IN THE BALANCE: PARTNERING ON TOOLS AND INCENTIVES FOR RECOVERING
CANADIAN SPECIES AT RISK

About Smart Prosperity Institute Smart Prosperity Institute is a national research network and policy think tank based at the University of Ottawa. We deliver world-class research and work with public and private partners – all to advance practical policies and market solutions for a stronger, cleaner economy.
About the Institute of the Environment The Institute of the Environment has a 20 year history of engaging professors from across campus in interdisciplinary research and public outreach. Since 2014, the Institute of the Environment is home to a new graduate program in environmental sustainability, offering a Master’s of Science with strong foundations in science, law, economics and policy.
The Institute of the Environment also fosters cross-cutting research and dialogue through collaborative initiatives, attracting visiting scholars and experts, as well as sponsoring conferences and seminars at the University and with partners in the National Capital and across the country.
Acknowledgements Smart Prosperity Institute and the University of Ottawa’s Institute of the Environment gratefully acknowledge financial support from the Schad Foundation, Earth Rangers, Environment and Climate Change Canada, and the Forest Products Association of Canada for this research.
ACKNOWLEDGEMENTS This report was authored by Scott McFatridge and Tony Young, Smart Prosperity Institute. Sections 4 and 6.1 of this report are adapted from Shahira Khair, Samuel J. McIntosh, Sawyer Stoyanovich, Noah Greenwald, Kieran Suckling and C. Scott Findlay. 2017. “Empirical correlates of SAR recovery.” Department of Biology and Institute of Environment Working Paper, University of Ottawa. We thank the authors for their contributions. Sections 3 and 5 feature contributions and research assistance from Shannan May-McNally, M.E.S. graduate, Institute of the Environment, University of Ottawa. Section 3 also features contributions and research assistance from Benjamin Holland, J.D. candidate, University of Ottawa.
The authors also thank Patricia Latendresse, Jessica Currie, Laura Wohrizek, Marena Winstanley, Vasundhara Saravade and Boris Ignachkov for supporting the workshop, interviews, and online survey. Thanks to Shahira Khair for setting up the online survey and to Nancy Massé for translating the survey document from English to French.
The authors thank the project advisory committee and the project management team for their research direction and feedback throughout the project: Advisory Committee Lorne Johnson, Schad Foundation Peter Kendall, Earth Rangers and Schad Foundation Robert McLean, Canadian Wildlife Service Sue Milburn-Hopwood, Canadian Wildlife Service Kate Lindsay, Forest Products Association of Canada Dr. Justina Ray, Wildlife Conservation Society Canada Dr. Jeremy Kerr, Department of Biology, University of Ottawa Dr. C. Scott Findlay, Department of Biology and Institute of the Environment, University of Ottawa Dr. Stewart Elgie, Associate Professor, Faculty of Law; Chair, Smart Prosperity Institute and Director, Institute of the Environment, University of Ottawa
Project managers Mike Wilson, Smart Prosperity Institute Geoff McCarney, Smart Prosperity Institute
The authors thank Dr. Chad Lawley, University of Manitoba and Dr. Peter Boxall, University of Alberta, for their comments on an earlier draft of this report. Thanks to Journey Paulus, R2C2 Advisory Services Inc., for her comments on the report sections pertaining to permits, offsets, and cumulative effects assessment. Thanks to Mike Wilson, Mac Radburn, and Eric Campbell, Smart Prosperity Institute, for their helpful comments and editorial advice, and to Mathias Schoemer for graphic design and report layout.
Responsibility for the final product and its conclusions is the authors’ alone, and should not be assigned to the advisory committee, external reviewers or any other third party. Review from advisory committee members and external reviewers does not imply endorsement, and all errors and omissions are the responsibility of Smart Prosperity Institute.

4 | Species in the Balance: Partnering on tools and incentives to recover species at risk
REPORT | Species in the Balance
EXECUTIVE SUMMARY Canadians care about wildlife and recognize its importance. Recent polling shows that the overwhelming majority of Canadians support the federal government’s efforts to recover species at risk (SAR). However, they want it to be done in a way that is broadly consistent with their economic aspirations and that respects private property rights (McCune et al. 2017). This is both the challenge and the opportunity — to improve outcomes for imperilled species while allowing responsible levels of development and respecting the rights of private property owners.
More than a decade has passed since Canada’s Species at Risk Act (SARA) passed into law. The time is right to take stock of current progress and challenges. The Schad Foundation initiated this research to help identify the policy tools that could enable governments, industry and civil society to prioritize conservation decision-making and investments, and improve recovery outcomes. While this report discusses some aspects of provincial and territorial legislation and regulations, it emphasizes federal government policy due to the fundamental roles of the National Accord for the Protection of Species at Risk and of the Species at Risk Act, and because of the federal government’s unique responsibility for ensuring equivalent provincial and territorial protection under SARA. There are many signs that Canada’s imperilled species are in trouble, with one recent study finding that, of the more than 350 imperilled species in Canada which have had status reassessments by the Committee on the Status of Endangered Wildlife in Canada (COSEWIC), over 85% have either seen no status change or deteriorated in status (Favaro et al. 2014). While many provinces and territories have strengthened SAR recovery by enacting their own SAR legislation or regulations, the extent to which these efforts have improved recovery outcomes is unclear.
The shortcomings in recovering SAR are linked to several long-standing barriers, including inadequate financial resources, insufficient incentives for stewardship among private landowners and industry, patchy efforts to protect SAR on provincial and territorial crown land and private land, a lack of information on the effectiveness of different recovery actions, and not making the most of available data and tools to inform decision making. This report proposes effective and actionable solutions to these challenges. It draws upon multiple sources of insight including a workshop with key stakeholders, a literature review, interviews with over 35 SAR recovery experts, a presentation and discussion at a Canadian Wildlife Director’s Committee meeting, and an online survey administered to over 100 informants in academia, government, industry and ENGOs. The research uncovers a collection of management practices, incentives and policy tools that, while underused to date, show significant promise for better engaging private landowners, resource developers, governments and stakeholders in solutions that are broadly compatible with both species recovery and private economic interests.
Greater sage grouse, prairie population (Centrocercus urophasianus urophasianus) is listed as endangered under the Species at Risk Act. Within Canada, its range encompasses southeastern Alberta and southwestern Saskatchewan. Source: Species at Risk registry.

| 5
An essential first step to recovering SAR lies in understanding and addressing priority threats. The scientific literature clearly indicates that residential and commercial development, human disturbance, and natural systems modification are the main drivers of imperilled species loss in Canada (Prugh et al. 2010; McCune et al. 2013). Invasive and problematic species, genes and diseases, point and nonpoint source pollution, biological resource use, energy production and mining, transportation and service corridors, and agriculture are other important threats to SAR. The anthropogenic threats to SAR listed above are primarily associated with the recreation, construction, hunting and fishing, agriculture, forestry, mining, oil and gas, and transportation industries (Prugh et al. 2010; McCune et al. 2013).
While the Government of Canada has made some important advances in implementing the Species at Risk Act, a number of significant challenges remain. These include gaps in SAR protection on provincial and territorial land, which are not being addressed by provincial/territorial legislation or federal backstop measures, and a lack of incentives for SAR management on private land throughout the country (where a critical mass of SAR are located). Recovery on provincial and territorial crown land and private land is also hindered by stakeholders — primarily governments, but also industry and ENGOs — failing to adopt complementary tools for managing SAR on these lands, such as economic instruments and place-based (multispecies and ecosystem) recovery strategies and action plans. Stakeholders have also noted some issues with the timeliness, flexibility and incentive basis of federal stewardship programs such as the Habitat Stewardship Program and the Species at Risk Farm Incentive Program.
Collecting, harmonizing and sharing quality data is critical for evidence-based public policy, and SARA is no exception. However, nearly all of the actors involved in SAR recovery have noted that governments and other stakeholders need to better coordinate on data collection and sharing in order to make sure that decision-makers are getting the most out of this information. There are also several outstanding issues surrounding how to manage impacts to SAR on federal, provincial and territorial crown land, such as a lack of clarity on interactions between SARA and the Canadian Environmental Assessment Act (CEAA 2012), and their implications for regulatory compliance (including cumulative effects management). Greater clarity is also needed on compliance measures for addressing impacts to species at risk on federal crown land (including cumulative effects). Finally, nearly all stakeholders acknowledge that addressing the challenge of SAR recovery will require considerable increases in overall financial resources relative to today’s levels, combined with a disciplined and prioritized approach to how these funds are spent.
In order to address the challenges outlined above, understanding how recovery actions can address threats to SAR or compensate for their effects is essential. Using data on actual species abundance and range trends for species listed under the United States Endangered Species Act and changes in threat status of species listed under SARA, we identify several key threats, implemented recovery actions, and
Nearly all stakeholders acknowledge that recovering species at risk will require considerable increases in overall financial resources and a prioritized approach to how these funds are spent.

6 | Species in the Balance: Partnering on tools and incentives to recover species at risk
REPORT | Species in the Balance
threat remediation actions associated with endangered species recovery. Although the findings need to be interpreted cautiously due to the relatively small within-taxon sample sizes and the coarse resolution of the data, we find that recovery actions generally designed to mitigate indirect or direct sources of mortality, including “take” (either direct or indirect), invasive or problematic species, and pollution, are most likely to have detectable positive impacts on SAR recovery. This implies that policy tools or incentives are more likely to be effective if they target threats that induce substantial direct or indirect mortality, such as point and nonpoint source pollution, or transportation infrastructure leading to road or rail mortality.
However, this does not imply that habitat conservation or restoration measures (often a focus of recovery efforts) are of little value. Rather, with existing data, the systemic effects of such measures are difficult to detect. Objectively evaluating the effects of these measures on recovery will require substantially improved data collection, particularly with regards to: (a) identifying habitat elements directly and strongly related to fecundity or survival (e.g. breeding sites, overwintering sites); and (b) using systematic monitoring to assess the extent to which habitat conservation, rehabilitation, enhancement or restoration measures have affected population abundance and distribution. For many species for which habitat conservation measures have been implemented in the past, neither of these conditions is satisfied. This analysis of factors correlated with SAR recovery provides a foundation for understanding the impacts of current recovery practices and, potentially, for prioritizing SAR recovery interventions.
In light of the challenges listed previously, recovering SAR will require bold leadership and collaboration between governments, conservation organizations and industry. This report recommends that policymakers consider eight cross-cutting actions. They are:
I. Governments should fully implement existing SARA provisions (such as section 11 conservation agreements, safety net orders, and emergency orders). This would help ensure backstop protections to SAR on non-federal land and encourage private sector participation in SAR recovery.
II. Harness a suite of economic instruments to promote stewardship on private land and crown land. In the case of provincial and territorial crown land, establishing rigorous and precautionary offset policies for SAR is an important priority. These could be enabled through SARA’s permitting policy, parallel provincial/territorial permitting policies, or signed section 11 conservation agreements between federal, provincial, territorial and Indigenous governments, landowners and industry.
III. Our stakeholders identified three further areas where economic instruments and related tools have the greatest potential for cost-effective impact:
1. leveraging opportunities to restore degraded landscapes;
Western chorus frog, great lakes / St. Lawrence - Canadian Shield population (Pseudacris triseriata) is listed as threatened under the Species at Risk Act. Its range in Canada spans southern Ontario and southwestern Quebec. Source: Species at Risk registry.

| 7
2. using economic instruments to protect CH on private land — including conservation easements and payment for environmental service schemes;
3. tailoring economic instruments to manage broader threats in the landscape, such as point and nonpoint source pollution and invasive species.
This being said, additional studies which explicitly evaluate how economic instruments affect SAR’s abundance and distribution, as well as the quantity and quality of their critical habitat, are essential. Ideally, evidence for the effectiveness (or lack thereof) of these instruments will come from policy interventions that are designed and implemented as experiments, or quasi-experiments. Governments should explicitly prioritize these experimental approaches when funding SAR recovery actions.
IV. Use place-based (multispecies and ecosystem) approaches as appropriate, to improve the biological effectiveness or cost-effectiveness of recovery strategies and action plans. In general, we find that most recovery strategies should continue to proceed on a single-species basis, while action plans should focus on place-based approaches. This being said, several opportunities remain for effective place-based recovery planning that are worth considering.
V. Enhance existing SAR conservation initiatives on private land by making government-funded stewardship programs more directed, flexible, and incentive-based.
VI. Strengthen data collection, sharing, management and dissemination to improve multiple dimensions of SAR decision-making and program implementation. Federal, provincial, territorial and Indigenous governments, academic, industry, and civil society actors should develop a database that would be shared among all stakeholders collecting and housing data relevant to SAR management. This includes data on SAR population abundance and distribution, SAR ranges, habitat associations and critical habitat, signed section 11 conservation agreements, conservation easements and ecological gifts, recovery actions implemented in recovery strategies, as well as projects triggered under section 73 of SARA or section 5 of the Canadian Environment Assessment Act (2012) (and successor legislation).
VII. Complement project-level impact assessments with broader regional impact assessments — as recommended by the Federal Expert Review Panel on Environmental Assessment and currently under consideration by the federal government — to help address the assessment of cumulative effects for projects triggered under section 73 of SARA or section 5 of CEAA (2012). We discuss how the processes required to meet SARA’s legislative requirements, such as recovery strategies and action plans, can also make a positive contribution to these regional impact assessments.
Harnessing a suite of economic instruments to recover species at risk has a strong potential for cost-effective impact.
8 | Species in the Balance: Partnering on tools and incentives to recover species at risk
REPORT | Species in the Balance
We also propose an iterative process for assessing cumulative effects under SARA and CEAA (2012), in which project-scale impact assessments (and other information sources such as action plans) can inform regional impact assessments. These regional impact assessments can subsequently be used to inform future project-scale assessments, action plans, etc.
VIII. Finally, governments should strongly consider increasing overall funding for SAR conservation. These additional funds could be raised through a combination of innovative funding instruments and increased public expenditures. These resources should be guided by an ethos of prioritization and targeted towards action planning and incentives on private land. However, effectively implementing these funding recommendations will require governments to make reporting on combined federal, provincial and territorial funding for SAR recovery a top priority. Over time, it will also require governments to rigorously cost all of the different components of implementing SARA. While conserving and recovering species at risk will not be easy, using the Species at Risk Act’s legislative provisions, creative policy and funding tools, and a prioritized approach to conservation, can go a long way towards ensuring the longevity of Canada’s species at risk for generations to come.
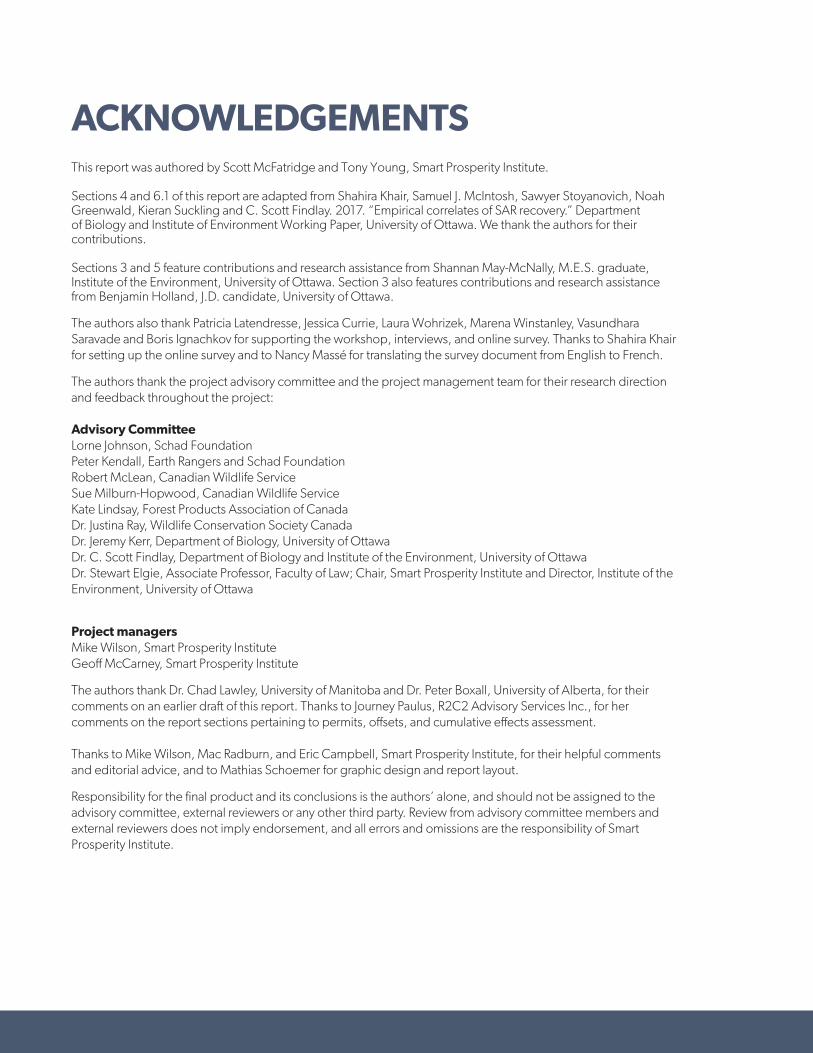
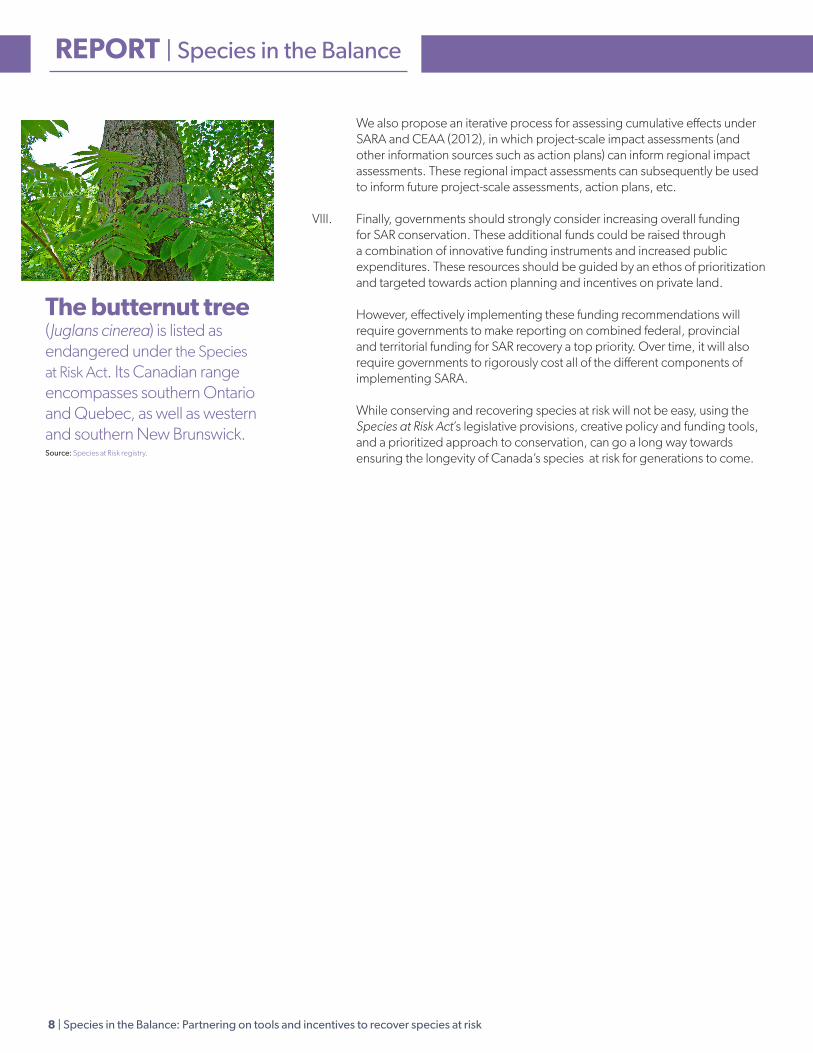
The butternut tree (Juglans cinerea) is listed as endangered under the Species at Risk Act. Its Canadian range encompasses southern Ontario and Quebec, as well as western and southern New Brunswick.Source: Species at Risk registry.

| 9
TABLE OF CONTENTS Species in the Balance: Partnering on tools and incentives to recover species at risk ................................................................. 1About Smart Prosperity Institute ..................................................................................................................2Acknowledgements ..............................................................................................................................3Executive Summary ...............................................................................................................................4Table of Contents .................................................................................................................................9List of Figures ................................................................................................................................... 10List of Boxes: .....................................................................................................................................11List of Tables .....................................................................................................................................11List of Acronyms ................................................................................................................................ 121. Introduction .................................................................................................................................. 132. Threats to SAR ............................................................................................................................... 15
2.1 Threat taxonomy ......................................................................................................................... 152.2 Spatially explicit analyses — the role of land use change .................................................................................. 16 2.3 Review studies – priority threats and industry linkages .................................................................................... 16
3. Challenges facing Species at Risk Act implementation ........................................................................................ 183.1 Gaps in provincial and territorial species at risk protection which are not being addressed by a federal backstop .......................... 183.2. Lack of incentives for species at risk management on private land ........................................................................233.3. Overreliance on a relatively narrow range of tools .......................................................................................253.4 Hurdles to using place-based (multispecies and ecosystem) approaches .................................................................293.5 Stewardship programs provide only short-term funding, are somewhat inflexible, and only selectively incorporate economic incentives ........................................................................................................................303.6 Shortcomings in data collection, sharing, management and dissemination for informing decisions .......................................303.7 Lack of clarity on compliance measures available to proponents for projects triggered under the Canadian Environmental Assessment Act (2012) due to potential impacts on species at risk, including assessing and managing cumulative effects ......................323.8 Underuse of compliance measures – such as rigorous offsets, backed by permits or section 11 conservation agreements – to address impacts to species at risk on federal and provincial crown land, along with unclear requirements for assessing andmanaging cumulative effects ................................................................................................................343.9 Overall resources for implementing the Species at Risk Act are lacking ...................................................................35
4. Empirical Correlates of species at risk recovery ...............................................................................................394.1. Recovery under the United States Endangered Species Act ..............................................................................404.2. Canadian Species at Risk ...............................................................................................................444.3. Discussion..............................................................................................................................474.4 Policy implications ......................................................................................................................48
5. Solutions for species at risk ...................................................................................................................495.1 Governments fully implementing existing provisions under the Species at Risk Act ........................................................495.2 Harnessing economic instruments and incentives to protect and recover species at risk: offset ...........................................525.3 Using economic instruments and related tools for landscape restoration, species at risk recovery on private land, and
addressing non-habitat threats ..............................................................................................................575.4 Making strategic use of place-based (multispecies and ecosystem) approaches to recovery strategies and action plans ..................665.5 Making species at risk stewardship programs more directed, flexible and incentive-based ...............................................685.6 Improving data collection, sharing, management and dissemination for informing decisions ............................................. 715.7. Leveraging data and regional impact assessment processes to manage cumulative effects under the Species at Risk

10 | Species in the Balance: Partnering on tools and incentives to recover species at risk
REPORT | Species in the Balance
Act and the Canadian Environmental Assessment Act (2012) .................................................................................765.8 Increasing overall funding for species at risk conservation, diversifying funding sources and prioritizing expenditures .....................79
6. Areas for further research.....................................................................................................................866.1 Empirical Correlates of SAR recovery .....................................................................................................866.2 Economic instruments ..................................................................................................................87
7. The way forward .............................................................................................................................88Appendix A: List of Workshop Participants ......................................................................................................90Appendix B: List of Interviewees ................................................................................................................ 91Appendix C: Species at Risk Survey .............................................................................................................92References .....................................................................................................................................93 Endnotes ......................................................................................................................................101
LIST OF FIGURESFigure 1: Canadian respondent perceptions of species at risk conservation and recovery outcomes from complementary tools ..................25
Figure 2: Canadian respondent perceptions of overall public support for species at risk policies and programs if complementary tools
were used more frequently ....................................................................................................................26
Figure 3: Public:Private Benefits Framework .....................................................................................................27
Figure 4: Canadian respondents’ ranking of the most important step to improve upon in implementing the Species at Risk Act, by organization
type* ...........................................................................................................................................36
Figure 5: Canadian respondents’ ranking of current species at risk spending areas, by organization type* ........................................37
Figure 6: Canadians respondents’ ranking of most desired factor for improving species at risk outcomes, by organization type* .................38 Figure 7: Examples of trends in population estimates (number of individuals) (symbols) and fitted recovery slopes (RS - lines) for
two different species (Northern Rockies Gray Wolf and Texas Wild Rice) in the United States Endangered Species Act data set. ..................40
Figure 8: Average recovery slope (± 1 standard error) of birds, reptiles and fish in cases where recovery actions to reduce
biological resource use were present or absent. ................................................................................................42
Figure 9: Average recovery slope (± 1 standard error) where recovery actions to mitigate biological resource use invasive or
problematic species or pollution were present (P) or absent (A), for species for which each threat was explicitly identified…………………………… 43
Figure 10: Average recovery slope (± 1 standard error) for vascular plants where recovery actions to mitigate invasive or
problematic species were present or absent ....................................................................................................43
Figure 11. The proportion of species for which recovery was considered feasible in relation to whether a particular
feasibility criterion was satisfied. ................................................................................................................45
Figure 12: The association between recovery feasibility and whether biological resource, pollution, or invasive and
problematic species was considered a threat. ...................................................................................................46
Figure 13. Average status change (± 1 standard error) in relation to the presence or absence of particular threats,
including biological resource use, invasive or problematic species, residential or commercial development,
or natural systems modification .................................................................................................................47
Figure 14: Mitigation Hierarchy for Offsets ......................................................................................................53
Figure 15: Using species at risk management information at multiple scales to inform cumulative effects assessment ..............................78

| 11
LIST OF BOXES: Box 1: Stakeholder terminology used in this report .............................................................................................. 14
Box 2: A note on the report ..................................................................................................................... 14
Box 3: Key legislative tools under the Species at Risk Act .........................................................................................22
Box 4: Survey respondents’ views of economic instruments and place-based approaches .......................................................25
Box 5: Forestry Ecological Certification and Species at Risk ......................................................................................56
Box 6: Ducks Unlimited Canada’s Revolving Land Purchase Program ............................................................................58
Box 7: Reverse Auctions for Conservation Easements in the Canadian Prairies ...................................................................60
Box 8: Species at risk conservation on private land – learning by doing ..........................................................................64
Box 9: The need for a prioritized approach to action planning ...................................................................................67
Box 10: Operational benefits from the database - making recovery strategy processes modular, integrated and database-driven .................75
Box 11: Sovereign and sub-sovereign green bonds ..............................................................................................85
LIST OF TABLES: Table 1: Provincial and territorial species at risk legislation (and related legislation) ................................................................20
Table 2: IUCN threats and associated recovery actions which, if implemented, are considered to at least partially address (mitigate) the threat in question* ................................................................................................................ 41

12 | Species in the Balance: Partnering on tools and incentives to recover species at risk
REPORT | Species in the Balance
LIST OF ACRONYMSAG Agriculture BCtrl Direct/Indirect Biological Control BMP Beneficial Management Practice BRU Biological Resource Use CEAA (2012) Canadian Environmental Assessment Act (2012)CDCs Conservation Data Centres CH Critical Habitat COSEWIC Committee on the Status of Endangered Wildlife in CanadaCSA Canadian Standards Association DFO Fisheries and Oceans Canada F/P/T/I Federal/provincial/territorial/Indigenous ECCC Environment and Climate Change CanadaENGO Environmental Non-Government OrganizationEPMHab Elimination/Prevention of Source of Habitat Modification ENHab Active Enhancement of Habitat EPM Energy Production & Mining ERP Elimination or Reduction of Point/Nonpoint Source Pollution FSC Forest Stewardship Council GIC Governor in CouncilHIM Human Intrusions & Disturbance HIPAA United States Health Information Portability and Accountability Act HSP Habitat Stewardship Program IA Impact AssessmentIOP Invasive & Other Problematic Species, Genes & Diseases IUCN International Union for Conservation of Nature NPV Net Present ValueNSM Natural Systems ModificationOAG CESD Office of the Auditor General of Canada, Commissioner of the Environment and Sustainable Development OSCIA Ontario Soil and Crop Improvement Association POL Pollution PCA Parks Canada Agency PNA Protected Natural Areas ActPRHab Protection of Remaining Habitat RCD Residential & Commercial Development RDEx Reduction of Direct/Indirect Commercial, Subsistence and/or Recreational Exploitation RNI Regulation Respecting Stan dards of Forest Management for Forests in the Domain of the State RRHab Restoration and/or Rehabilitation of Habitat RS Recovery slopeRVec Vector Reduction SAR Species at Risk SARA Species at Risk Act SARFIP Species at Risk Farm Incentive ProgramSARPAL Species at Risk Partnerships on Agricultural LandSF Sites fauniques d’intérêtSFI Sustainable Forestry Initiative US ESA United States Endangered Species ActUS FWS United States Fish and Wildlife ServiceTSC Transportation & Service Corridors VEC Valued Ecosystem Component

| 13
1. INTRODUCTIONCanadians care deeply about wildlife, and recent polling clearly shows that the vast majority of Canadians support the federal government’s efforts to recover species at risk (SAR). But, at the same time, they appreciate the benefits of industrial development and respect the rights of property owners (McCune et al. 2016). This is both the challenge and the opportunity – to improve outcomes for imperilled species while at the same time allowing responsible levels of development and respecting the rights of private property owners.
More than a decade has passed since Canada’s Species at Risk Act (SARA) passed into law. The time is right to take stock of current progress and challenges, and align resources and incentives to meet the challenge of SAR recovery. The Schad Foundation initiated this research to help identify the major challenges, along with the policy tools that governments, industry and civil society could build upon to prioritize conservation decision-making and investments, and improve recovery outcomes. This research uncovers a collection of management practices, incentives and policy tools that, while underused to date, show significant promise for better engaging private landowners, resource developers, governments and stakeholders in solutions that are compatible with both species recovery and private economic interests. Within Canada, population trends for most imperilled species are sobering, with one recent study finding that, of the more than 350 imperilled species assessed by the Committee on the Status of Endangered Wildlife in Canada which have had status reassessments, the status of over 85% is either unchanged or deteriorated (Favaro et al. 2014). Environment and Climate Change Canada also found that, of the 112 SAR Recovery Strategies and Management Plans that have outlined population recovery objectives and re-assessed SAR population trends over time, 43 of them show trends consistent with these objectives, but evidence is mixed for 9 species, and 40 species still have declining populations (Environment and Climate Change Canada 2017a).
Expert stakeholders have noted several hurdles to improving species at risk recovery outcomes. They include patchy efforts to protect SAR on provincial and territorial crown land and private land, insufficient incentives for stewardship among landowners (partially due to inadequate financial resources), and not making the most of available data and tools to inform decision making1.
This report seeks to propose effective and actionable solutions to each of these issues – none of which require any changes to SARA. It draws from multiple sources of insight including a workshop with key stakeholders, a presentation and discussion at a Canadian Wildlife Director’s Committee meeting, a literature review, interviews with over 35 key stakeholders, and an online survey administered to over 100 informants in academia, government, industry and environmental non-government organizations (ENGOs).
This research uncovers a collection of incentives and policy tools that show significant promise for better engaging stakeholders in solutions that are compatible with both species recovery and private economic interests.

14 | Species in the Balance: Partnering on tools and incentives to recover species at risk
REPORT | Species in the Balance
Box 1: Stakeholder terminology used in this report
This report uses the term “stakeholders” when discussing broad opinions shared across interviewees, workshop participants and survey respondents. When discussing more specific groups, we refer to them directly.
This report recognizes that SAR recovery is a shared responsibility between federal, provincial, territorial and Indigenous (F/P/T/I) governments, municipal governments, conservation organizations, industry, and all Canadians. However, it emphasizes federal government policy due to the foundational roles of the National Accord for the Protection of Species at Risk and of the Species at Risk Act, and the federal government’s unique responsibility for ensuring equivalent provincial and territorial protection under the SARA.
The report is structured as follows: Section 2 briefly summarizes the literature on threats to SAR, which is essential for identifying priority conservation actions and incentive measures for recovering SAR.
Section 3 describes the major roadblocks facing SARA implementation, including: (1) gaps in P/T SAR protection which are not addressed by federal backstop legislation; and (2) the lack of incentives for private landowners to recover SAR, and limited use of tools such as (3) economic instruments and (4) place-based (multispecies and ecosystem) approaches; (5) the need for more directed, flexible and incentive-based stewardship programs; (6) shortcomings in data collection, sharing, management and dissemination for informing decisions; (7) lack of clarity on SAR related triggers and the implications for compliance under the Canadian Environmental Assessment Act (2012), including the management of cumulative effects; (8) underuse of compliance measures – such as rigorous offsets, backed by permits or section 11 conservation agreements – to address impacts to SAR on F/P/T crown land, and unclear requirements for assessing and managing cumulative effects; and (9) inadequate levels of resources allocated to SAR conservation (especially for stewardship and recovery actions). Section 4 illustrates how existing data on correlates of SAR recovery can inform decision-making, improve SARA outcomes and guide data collection efforts. Section 5 identifies policy options for removing barriers and providing the system-wide incentives and information needed to enhance SAR recovery outcomes, and for fostering cooperation between governments, industry and private landowners. Section 6 highlights research needs for advancing the SAR recovery agenda. Section 7 concludes by describing the policy implications for various stakeholders.
Box 2: A note on the reportThis report does not address the role of Indigenous communities in recovering species at risk. While Smart Prosperity Institute acknowledges the critical importance that Indigenous knowledge and Indigenous communities play in recovering species at risk, and the need to engage them as full partners in SAR conservation, addressing this topic in a responsible and culturally appropriate manner requires a separate study, which would have been beyond the scope of our expertise to conduct.

| 15
2. THREATS TO SAR
• Recovering species at risk requires remediating and compensating for priority threats.*
• The main threats to imperilled species include residential and commercial development, human disturbance, and natural systems modification.
• Other important threats include invasive and problematic species, genes and diseases, point and nonpoint source pollution, biological resource use, energy production and mining, transportation and service corridors, and agriculture.
• Anthropogenic threats to species at risk are primarily associated with the recreation, construction, hunting and fishing, agriculture, forestry, mining, oil and gas, and transportation industries. *The literature on threats to species at risk is reviewed using the International Union for Conservation of Nature’s (IUCN) Threat Classification System.
Identifying which activities are most threatening to SAR is an essential first step towards designing tools and programs to mitigate these threats. Scientists are in broad agreement that the principal threats to SAR are: residential and commercial development, human disturbance, and natural systems modification. Other important threats include invasive and problematic species, genes and diseases, point and nonpoint source pollution, biological resource use, energy production and mining, transportation and service corridors, and agriculture. Effective actions to stabilize SAR populations and foster recovery need to address these threats.
2.1 Threat taxonomy
The IUCN Threats Classification System, Level 1 (Version 3.1) provides a helpful frame for presenting the literature results. The system consists of 12 key threat categories2:
● Residential and commercial development
● Agriculture and aquaculture
● Energy production and mining
● Transportation and service corridors
● Biological resource use
● Human intrusions and disturbance
● Natural system modifications
● Invasive and other problematic species, genes and diseases
● Pollution
● Geological events
● Climate change and severe weather
● Other threats
Key Takeaways

16 | Species in the Balance: Partnering on tools and incentives to recover species at risk
REPORT | Species in the Balance
2.2 Spatially explicit analyses – the role of land use change
One of the earliest studies (Kerr and Cihlar 2004) used land use data (1 km resolution) along with SAR distribution datasets for Canada’s watersheds and mixedwood plains, and found that land conversion to agriculture and agricultural intensification (an index of agricultural pollution) were the main predictors of SAR loss in Canada. A similar analysis by Kerr and Déguise (2004) found that the number of species at risk within each of Canada’s 15 ecozones was highly correlated with natural habitat loss (largely from agricultural activities), and the low remaining extent of natural habitat could pose significant limits to the recovery of most SAR. Comparing areas where SAR currently occur to where their range has subsequently shifted or contracted, Gibbs, MacKey and Currie (2009) use multiple regression analysis to examine the effects of human population density (an indicator of urbanization), pesticide use (a proxy for agricultural intensification) and habitat loss on SAR range reductions. They found that both agricultural land cover and pesticide use were strongly associated with range reductions, and that the latter is statistically significant even when controlling for the overall area under agriculture. Gibbs, MacKey and Currie (2009) caution that some other factors correlated with pesticide use (e.g. agricultural intensification more generally) could potentially explain these trends, although the findings from the other studies reviewed in this section also indicate that agricultural nonpoint source pollution is a significant threat to SAR. 2.3 Review studies – priority threats and industry linkages
Studies reviewing threats to SAR identified in COSEWIC status reports and finalized recovery strategies have produced broadly similar findings. In a review of data from 488 COSEWIC status reports, Venter et al. (2006) determined that the primary threats to imperilled species* were habitat loss (84%), overexploitation (32%) and native species interactions (31%) — while the specific human activities most related to these losses were agriculture (46%) and urbanization (44%). Pollution and invasive species affected a much smaller number of SAR in Canada at 26% and 22% of all species, respectively. Using a similar COSEWIC report dataset and the IUCN threats classification system, Prugh et al. (2010) identified biological resource use as the most prevalent threat to imperilled species in Canada, followed by invasive species and infrastructure development. They also linked threats to economic sectors under the North American Industry Classification System, and found that the industries most associated with threats to imperilled species (at the time of publication) were agriculture, construction, hunting and fishing, recreation, forestry, transportation and service corridors, manufacturing, mining, oil and gas, and utilities (in that order). Finally, in an analysis of 146 finalized recovery strategies McCune et al. (2013) found that the greatest threats to SAR were residential and commercial development (listed as the primary threat in 32.9% of finalized recovery strategies), natural systems modification (primary threat in 20.5% of recovery strategies), human disturbance (primary threat in 17.8% of recovery strategies), and invasive species (primary threat in 16.4% of recovery strategies).
* Following Prugh et al. (2010), we use the term “imperilled species” to refer to all species designated by COSEWIC as extinct, extirpated, endangered, threatened, or special concern.
Verna’s Flower Moth (Schinia verna) is listed as threatened under the Species at Risk Act. Its range is limited to the Canadian prairies. Source: Species at Risk registry.

| 17
Other key threats included biological resource use and natural threats, although these varied in importance according to the number of other threats listed in recovery strategies. Energy production and mining, and transportation and service corridors were rarely mentioned as a primary threat (primary threat in <10% of finalized recovery strategies), but both were listed as a threat to SAR in 31% of finalized recovery strategies. Climate change was only listed as a primary threat in 3.4% of finalized recovery strategies, although the importance of this threat may increase over time as climate change becomes more severe.
McCune et al. (2013) also compared the threats identified in finalized recovery strategies with those identified in COSEWIC status reports, and found that listed SAR with finalized recovery strategies are less likely to be threatened by biological resource use3, whereas species with a finalized recovery strategy were less likely to be threatened by agriculture or residential and commercial development4. As such, although data sources vary and the ranking of threats differs between studies, we nonetheless find broad consensus across recent studies that habitat loss from residential and commercial development, as well as human disturbance and natural systems modification, are the main drivers of imperilled species loss in Canada. Other important threats include invasive and problematic species, genes and diseases, point and nonpoint source pollution, biological resource use, energy production and mining, transportation and service corridors, and agriculture. Anthropogenic threats to SAR are primarily associated with the recreation, construction, hunting and fishing, agriculture, forestry, mining, oil and gas, and transportation industries
Habitat loss from residential and commercial development, human disturbance, and natural systems modification are the main drivers of imperilled species loss in Canada.

18 | Species in the Balance: Partnering on tools and incentives to recover species at risk
REPORT | Species in the Balance
3. CHALLENGES FACING SPECIES AT RISK ACT IMPLEMENTATION
Ten key barriers are preventing the Species at Risk Act from living up to its potential. This section of the report discusses each of these challenges, while proposed solutions are explored in section 5. Challenges include:
• Gaps in species at risk protection on provincial and territorial crown land that are neither being addressed by provincial or territorial legislation nor by federal backstop legislation.
• Lack of incentives for species at risk management on private land.
• Overreliance on a relatively narrow range of tools, and limited use of complementary tools to protect species at risk, such as:
◦ Economic instruments.
◦ Place-based (multispecies and ecosystem) recovery strategies and action plans.
• Stewardship programs that only provide short-term funding, are somewhat inflexible, and only selectively incorporate economic incentives.
• Shortcomings in data collection, sharing, management and dissemination for informing decisions.
• Lack of clarity on compliance measures available to proponents for projects triggered under the Canadian Environmental Assessment Act (2012) due to potential impacts on species at risk, including assessing and managing cumulative effects.
• Underuse of compliance measures – such as rigorous offsets, backed by permits or conservation agreements – to address impacts to species at risk on federal, provincial and territorial crown land, along with unclear requirements for assessing and managing cumulative effects.
• Inadequate levels of resources allocated to species at risk conservation (especially for stewardship and recovery actions).
This section of the report provides a detailed explanation of nine key challenges facing SARA implementation, while section 5 proposes solutions.
3.1 Gaps in provincial and territorial species at risk protection which are not being addressed by a federal backstop
3.1.1 Canada’s three-tiered approach to species at risk protection
Species at risk protection in Canada is founded on three fundamental pillars: the National Accord on Species at Risk, the Species at Risk Act, as well as stewardship with private landowners. This three-pronged approach was essential, given SARA’s relatively narrow scope. For terrestrial species, SARA’s prohibitions apply only to individuals, their residences and their CH on federal crown land. By contrast, all listed aquatic species (and their residences and CH) are protected under SARA. For migratory bird species listed under the Migratory Birds Convention Act, SARA’s prohibitions apply to individuals and their residences throughout the country, but not their CH. This effectively means that absent the use of federal backstop provisions (see box 3 below), the bulk of terrestrial SAR protection lies in the hands of the provinces (and, to a lesser extent, the territories)5.
Key Takeaways

| 19
While there has been activity under each of the three pillars and there are modest signs of progress, our research has revealed significant issues, each of which is explored further in the next three sections:
1. There are potentially major gaps in SAR protection on P/T crown land, and a lack of incentives and/or penalties to motivate the closing of these gaps (section 3.1.2); 2. At the federal level, signed section 11 agreements could provide a flexible tool for F/P/T cooperation on species at risk conservation. Safety net orders and emergency orders could indirectly incentivize compliance with SARA by providing a federal backstop to P/T SAR protections. But each of these tools are very rarely used, and the use of safety net orders and emergency orders is perceived as so unlikely that it does little to incentivize compliance (section 3.1.3); 3. Private landowners lack incentives and resources to protect habitat on their land (this will be discussed in section 3.2).
3.1.2 Provincial and territorial species at risk legislation (and related legislation)
The first challenge relates to the provincial and territorial role in SAR recovery. Ensuring effective protection of individual SAR, their residences and critical habitat on P/T crown land is essential, since they comprise nearly half of Canada’s land area, and are likely provide CH to a significant number of SAR6. Some progress had been made on the legislative front, but overall results are underwhelming. Seven provinces and territories have enacted legislation to protect SAR, whereas the rest have either enacted broad strategies for managing species at risk, or embedded regulations for protecting SAR within existing wildlife legislation or related legislation (e.g. forestry regulations). However, these laws and regulations differ considerably in terms of their scope and stringency (some of them are discretionary for example), creating a patchwork which poses serious challenges to SAR recovery.
To take the most obvious example, the percentage of SARA-listed species which are also listed under these P/T laws varies widely. Wojciechowski et al. (2011) found that, at the time of writing, only a third of species listed under SARA were also listed under P/T legislation in all of the jurisdictions where they occur. The authors also found that, of the 176 SARA-listed species requiring P/T recovery strategies at the time of writing, only 27% of these species had a recovery strategy for at least one province or territory in which they are found.
Equally importantly, in the absence of information on compliance and enforcement measures, these laws and regulations provide no guarantee that listed SAR are being protected or recovered7. While it is difficult to obtain a comprehensive picture of monitoring and enforcement efforts across P/T governments, several of these laws and regulations have been criticized for their discretionary measures, broad exemptions, and/or weak enforcement provisions (Ecojustice 2012; Environmental Commissioner of Ontario 2013).
The state of P/T species at risk/wildlife legislation is summarized in table 1 below. Not all legislative tools potentially contributing to SAR protection have been included, and the authors recognize that some jurisdictions use a suite of regulatory, legislative and non-regulatory tools to protect and manage species at risk (although some of
There are potentially major gaps in species at risk protection on provincial and territorial crown land, and a lack of incentives and penalties to motivate the closing of these gaps.

20 | Species in the Balance: Partnering on tools and incentives to recover species at risk
REPORT | Species in the Balance
these are discretionary). Nonetheless, the overall trends in SAR populations and in P/T SAR legislation indicate that a combination of collaborative policy and legislative tools – as well as penalties - are needed to promote SAR recovery on non-federal land.
Table 1: Provincial and territorial species at risk legislation (and related legislation)
Jurisdiction Relevant legislation, regulations, or strategies
Scope of protections (individuals, residences, habitat/critical habitat)
Recovery planning required?
Notes
British Columbia British Columbia Wildlife Act Prohibitions on harming individuals only extend to hunting.
No mandatory habitat protection.
The minister may, by regulation, designate land as a wildlife sanctuary or designate the species as at-risk to establish species protections.
No No amendments.
Alberta Alberta Wildlife Act
Forests Act
The independent Endangered Species Conservation Committee makes listing recommendations to the Minister who decides whether to create protections and recovery plans.
Generally prohibits harms to wildlife. No fish, plant, invertebrate, and fungus species included.
The Forest Management Planning Standard, created through the Forests Act, establishes mandatory habitat protections for species at risk.
Discretionary approach-to species recovery planning.
No amendments to species at risk sections.
Saskatchewan Wildlife Act, 1998 The Minister may appoint scientific committees to research whether species are at risk. The minister decides whether to list a species.
Prohibits harm to listed species.
May be implemented for listed species.
No amendments to species at risk sections.
Manitoba Endangered Species Act
Wildlife Act
The Endangered Species and Ecosystems Advisory Committee advises on whether species should be listed, but the Minister uses discretion to decide whether to list a species.
Prohibits harm to listed individuals as well as damaging a natural resource on which the listed species depends.
Listed species must have recovery strategies.
In 2013, the Endangered Species Act was amended to allow for the designation of ecosystems.
Ontario Endangered Species Act
Crown Forest Sustainability Act (CRFS)
Species listing follows automatically from the recommen-dations of the independent Committee on the Status of Species at Risk in Ontario.
Extensive prohibitions apply to species and their habitat.
The Forest Management Planning Manual established through the CRFS, requires that forest management plans contain objectives related to protecting species at risk.
The government is in the process of harmonizing the CRFS and the Ontario Endangered Species Act.
Yes Broad exemptions have been granted for select indus-tries.

| 21
Quebec Wildlife Act Act Respecting Vulnerable and Threatened Species
Regulation Respecting Stan-dards of Forest Management for Forests in the Domain of the State (RNI)
Sites fauniques D’intérêt (SF)
The Minister of Sustainable Development, Environment and Parks makes recommendations to the government who decides which species to list.
Prohibitions on harming listed species and their habitat.
The Wildlife Act is primarily hunting and fishing legislation.
RNI provides mandatory protection measures for several specific wildlife habitats.
Not mandatory, but sometimes conducted.
SF provides additional protection measures for specific regions. The regions have made these measures mandatory through contractual obligation.
Newfoundland and Labrador
Endangered Species Act COSEWIC or the Species Status Advisory Committee make recommendations on listing species to the Minister who has discretion to list the species.
Prohibits killing or harming listed species and prohibits disturbing or destroying their residence.
Recovery plans are man-datory for listed species.
N/a
New Brunswick Species at Risk Act
Protected Natural Areas Act (PNA)
Endangered Species Act (repealed)
The independent Committee on the Status of Species at Risk advises the minister on whether to list species.
Prohibits harming listed species and their habitats.
The minister has discretion to decide whether the prohibitions apply to the species, but the Minister must provide reasons for not listing a species and publish them in the public registry.
The PNA permits (but does not require) recovery activities in protected areas.
Mandatory recovery planning.
The Endangered Species Act was replaced with the New Brunswick Species at Risk Act in 2012 which reduced discretion in listing species and mandated recovery planning.
Nova Scotia Nova Scotia’s Endangered Species Act
The Species-at-risk Working Group decides which species to list as at-risk. The group makes decisions using science and traditional knowledge.
Prohibits harming or interfering with listed species.
Prohibits disturbing or destroying listed species’ residences. The Minister can protect critical habitat, but there is no automatic protection.
The Endangered Species Act requires recovery plans to be developed for listed species.
No amendments.
Prince Edward Island
Wildlife Conservation Act The Minister decides whether to list species as at-risk. None are currently listed
Prohibits harm to listed species and their habitat.
No No amendments.
Northwest Territories
Species at Risk Act The Species at Risk Committee provides an assessment of the status of a species to the Conference of Management Authorities who has discretion to decide whether to list the species.
Species and habitat are not automatically protected upon listing. The conference decides whether to create regula-tions to protect listed species and their habitat.
Listed species receive a recovery strategy.
8 species have been listed with new species being added yearly.
Nunavut Nunavut Wildlife Act The Nunavut Species at Risk Committee makes recom-mendations to the Nunavut Wildlife Management Board on whether to list species as at-risk. The Board has discre-tion to decide whether to list species.
Prohibits harming listed species and its habitat.
Mandatory recovery planning.
New regulations developed for wildlife harvesting in 2015.
Yukon Wildlife Act The Act creates hunting prohibitions for four specially protected wildlife species.
Wildlife sanctuaries can be created using the Act.
No No amendments.
Source: Adapted from Ecojustice (2012); provincial and territorial species at risk, wildlife and forestry legislation (see references)

22 | Species in the Balance: Partnering on tools and incentives to recover species at risk
REPORT | Species in the Balance
3.1.3. Governments are not making full use of existing tools under the Species at Risk Act to ensure backstop protections on provincial and territorial crown land
While the P/T legislative trends mentioned above seem worrying, many of our interview and workshop stakeholders maintained that the fundamentals of SARA remain sound. SARA contains potentially solid measures for protecting SAR on federal land and in aquatic ecosystems, as well as a diverse suite of tools for supporting SAR protection on P/T crown land and private land - the problem is that they remain largely unused (see Box. 3 for a summary of the main SARA tools).
Box 3: Key legislative tools under the Species at Risk Act Section 11 conservation agreements are signed between (a) a competent Minister (either the Minister of Environment, the Minister of Fisheries and Oceans, or the Minister responsible for the Parks Canada Agency) and (b) provincial/territorial governments, organizations or individuals. They are intended to recognize actions being taken to “benefit species at risk or enhance their survival in the wild”, including protection of habitat or critical habitat. Section 13 funding agreements allow a competent Minister to enter into an agreement with any of the previously mentioned entities to assist with funding programs or measures to manage SAR, including programs or measures taken under section 11 agreements. Section 34, article 2, article 3 states that if the Minister of Environment determines that provincial and territorial laws are not effectively protecting species or their residences on non-federal land, then the Governor in Council (GIC) may (following the obligatory recommendation and consultations from the Minister) make an order to impose SARA’s prohibitions against the harming of individuals and their residences to non-federal land. This is commonly referred to as a “safety net order” 8. Section 61, article 4 of SARA states that if the Minister of Environment is of the opinion that the laws and regulations of the province or territory do not protect some portion(s) of critical habitat which requires protection, and if the critical habitat is not otherwise protected via the provisions of any other federal legislation (including section 11 agreements), then the GIC may (following the obligatory recommendation and consultations from the Minister) issue an order whereby SARA’s prohibitions are extended to that portion of CH. It serves a similar objective to section 34, article 3. Section 63 of SARA contains a clause on progress reports on unprotected portions of CH, which states that if the Minister is of the opinion that a SAR’s CH remains unprotected 180 days after it has been identified in a recovery strategy, the Minister must report steps being taken to protect CH, and continue to do so every 180 days thereafter until the CH is protected. Section 80 contains the emergency order clause, which states that if a species faces an imminent threat to its survival or recovery, the GIC may (following the obligatory recommendation and consultations from the Minister) issue an emergency order which identifies the species’ CH in the area designated by the order, thereby extending SARA’s prohibitions to individuals, CH or residences on these portions of non-federal land.
For instance, section 11 and section 13 agreements can provide incentives for P/T governments, organizations or individuals to collaborate with the federal government on SAR recovery, by providing both parties with legal assurances that SAR are being effectively protected on land subject to an agreement (pending compliance). On the other hand, safety net orders and emergency orders indirectly incentivize compliance with SARA by providing a federal backstop to P/T SAR protections. Numerous stakeholders also highlighted the importance of the 180 days clause under section 63 for enhancing overall accountability under SARA. However, our stakeholders also stressed that most of these tools are seldom used, if at all. While the federal government has issued two emergency orders in recent years – one for the western chorus frog in Quebec (ECCC 2016a), the other for the greater sage grouse in Alberta and Saskatchewan (ECCC 2018) — the federal Minister of Environment has never recommended to the GIC that a safety net order be issued (Wojciechowski et al. 2011).
This reticence to recommend safety net orders poses some real problems, since emergency orders are only meant to protect SAR that are at immanent risk of extinction. Emergency orders are not tools for proactively ensuring that SAR are

| 23
receiving equivalent protection on P/T land, and they are not substitutes for safety net orders. Similarly, the federal government has never used the section 63 clause, which would enhance transparency and accountability in the government’s commitment to protecting SAR’s CH once it has been identified in a recovery strategy.
The picture is not much more encouraging with section 11 and section 13 agreements, few of which (if any) have been signed to date. This is particularly unfortunate, since well-conceived and signed section 11 agreements could provide the federal government with at least some assurance that SAR and their CH are being protected on non-federal land. In principle, this would reduce the need for safety net orders or emergency orders. The federal government is currently in the process of drafting additional section 11 agreements with several stakeholders, although when they will be finalized or how effective they are remains to be seen. We outline how F/P/T governments could use SARA’s existing legislative provisions to improve outcomes in section 5.1.
3.2. Lack of incentives for species at risk management on private land
3.2.1 Preamble: Current approaches to species at risk protection will not be enough to recover them
Many of our interviewees and workshop participants were adamant on the need to improve the overall quantity and quality of incentives for SAR conservation on private land*. A brief discussion of some limitations with current SAR management and recovery approaches can help make clear why increasing incentives on private land will be necessary to recover SAR.
Currently, F/P/T protected areas are one of the main policy tools for protecting SAR populations on crown land. Protected areas are extremely important tools for meeting broader conservation objectives, such as making sure that common species stay common, providing ecosystem services, increasing public support for wildlife conservation (through educational and recreational opportunities), and providing additional habitat to those wildlife whose ranges will shift northward under climate change (Lemieux, Beechey, Gray 2011).
Expanding Canada’s protected area network is also essential for Canada to meet its commitments under the Convention on Biological Diversity, particularly the Pathways to Target 1 of the Aichi targets, requiring signatories to establish protected area networks equivalent to 17% of their land and inland waters, and 10% of their coastal and marine areas (Government of Canada 2017a). A recent report has found that Canada is not on track and will need to pick up the pace to meet these important commitments (Canadian Parks and Wilderness Society 2017).
Nevertheless, evidence consistently suggests that existing protected areas play a limited role in SAR recovery, and expanding protected area networks will not be enough to recover SAR populations. The first challenge lies in the fact that most SAR are found in southern Canada, where private land ownership predominates (Kerr and Cihlar 2004)9. Moreover, existing protected areas in southern Canada are often adjacent to private land, meaning that SAR recovery will require policymakers to collaborate with these landowners in order to mitigate threats and protect habitat on these lands (Déguise and Kerr 2005). * They also emphasized the need for additional financial resources to fund these incentive programs,
which we discuss in section 3.9.
24 | Species in the Balance: Partnering on tools and incentives to recover species at risk
REPORT | Species in the Balance
Second, the current protected area network was not primarily established for SAR conservation purposes10. Spatial modelling has shown that the richness of SAR found in F/P/T protected areas is rarely greater than what would have occurred through chance – especially in areas with high biodiversity loss (Déguise and Kerr 2005)11. Another study in Canada’s watersheds and mixedwood plains found no statistically significant relationship between protected area extent and imperilled species richness (Kerr and Cihlar 2004)12 .
Third, the habitat suitability of Canada’s existing protected area network for SAR is also expected to decline over time, due to factors such as shifts in species’ ranges due to temperature and precipitation changes, changes in ecological community composition, trophic mismatch due to changes in phenology, increased susceptibility to pests and pathogens, and other factors (Kharouba and Kerr 2010; Lemieux, Beechey, Gray 2011).
These factors, combined with the fact that many of Canada’s current protected areas are too small to recover SAR - especially in southern Canada (Déguise and Kerr 2005) - demonstrate some limitations in relying too heavily on protected area networks to recover SAR. While expanding protected area networks would probably help some SAR and will become increasingly important as SAR’s ranges shift to more northern latitudes under climate change (Kerr and Cihlar 2004; Lemieux, Beechey, Gray 2011), the problems identified above show that this will not go far enough to recover SAR.
3.2.2 The role of incentives
SAR researchers and advocates have continually emphasized that collaborating with private landowners is essential for recovering SAR (Kerr and Déguise 2004; Miller et al. 2013; Olive 2015). Many of these landowners will require incentives and rewards for protecting SAR on their land.
The federal government has several incentive programs for encouraging SAR management and recovery on private land, including the Species at Risk Stewardship Program (HSP), the Species at Risk Partnership on Agricultural Lands (SARPAL), and the Species at Risk Farm Incentive Program (SARFIP). But several of these programs face serious resource limitations, and data on their overall contribution to SAR recovery is limited (OAG CESD 2013). Several funding streams also exist for beneficial management practice (BMP) adoption under F/P/T agricultural policy frameworks (e.g. Growing Forward 2, the Canadian Agricultural Partnership) which can contribute to SAR recovery.
Ramping up a collaborative, incentives-based approach to private land conservation makes sense. Many of the environmental impacts from economic activities on private land – such as agriculture – are so diffuse that direct regulations would be prohibitively costly to monitor and enforce (Lichtenberg 2004). Restrictive regulations also fail to provide positive incentives for SAR recovery (Adamowicz 2016).
Even if it were administratively feasible to do so, directly regulating activities on private land could seriously damage the political legitimacy of SAR recovery activities. Indeed, such measures could quite possibly be counterproductive, since they might prompt landowners to secretly destroy SAR on their lands, out of concern that these SAR will lead to restrictions on their private property rights. This is famously referred to as “shoot, shovel, and shut up” (Evans et al. 2016).

| 25
Case study evidence suggests that some private land owners are very apprehensive about the federal government regulating their activities should SAR be found on their property, even though SARA’s prohibitions do not (usually) apply directly to private land (Olive 2015). Recent polling has also shown that the Canadian public is more reluctant to support SAR conservation if this implies restricting private property rights (McCune et al. 2017). Both lines of evidence indicate that collaborative and incentive-based approaches are more likely to be productive (see section 5.3 for recommendations).
3.3. Overreliance on a relatively narrow range of toolsThe evidence reviewed in sections 3.1-3.2 demonstrates the considerable challenges facing SAR recovery on both private and public land. At the same time, some of the most commonly used SAR recovery tools have limitations, and a broader set of tools is worth exploring. Two tools stand out for their potential to improve the biological effectiveness and cost-effectiveness of SAR management: greater use of economic instruments and place-based (multispecies and ecosystem-based) approaches (Box. 4). Sections 3.3 and 3.4 will discuss each of these in turn.
Box 4: Survey respondents’ views of economic instruments and place-based approaches Both tools were the subject of intense interest from our survey respondents. Canadian respondents from governments, industry, and ENGOS (including academia) were strongly in agreement that using economic instruments and place-based recovery approaches (including multispecies and ecosystem-based plans) could potentially improve overall SAR management and recovery outcomes (Fig. 1). They also agreed that these tools would increase overall public support for SAR protection (Fig. 2), and subsequently should be further piloted and tested.
0%
10%
20%
30%
40%
50%
60%
70%
80%
90%
100%
Government(n=8) Industry(n=15) ENGOs(n=36) Government(n=10) Industry(n=14) ENGOs(n=32)
Place-BasedApproaches EconomicInstruments
%ofrespo
nden
ts ConservationmanagementandrecoveryoutcomesforSARwould:Getworse
ConservationmanagementandrecoveryoutcomesforSARwould:Nochange
ConservationmanagementandrecoveryoutcomesforSARwould:Improve
Source: Smart Prosperity Institute, Species at Risk survey
Figure 1: Canadian respondent perceptions of SAR conservation and recovery outcomes from complementary tools

26 | Species in the Balance: Partnering on tools and incentives to recover species at risk
REPORT | Species in the Balance
Figure 2: Canadian respondent perceptions of overall public support for SAR policies and programs if complementary tools were used more frequently
0%
10%
20%
30%
40%
50%
60%
70%
80%
90%
100%
Government(n=9) Industry(n=15) ENGOs(n=35) Government(n=10) Industry(n=14) ENGOs(n=28)
Place-BasedApproaches EconomicInstruments
%ofrespondents Publicsupport forSARpolicies and
programswould:Decrease
Publicsupport forSARpolicies andprogramswould:Nochange
Publicsupport forSARpolicies andprogramswould:Increase
Source: Smart Prosperity Institute, Species at Risk survey
3.3.1 Economic instruments
Economic instruments have two main roles to play in SAR recovery, namely: (1) providing cost-effective incentives for SAR management to private landowners, and (2) providing a flexible and cost-effective means for regulatory compliance on crown land. We briefly review some general strengths associated with economic instruments, and then comment on their relevance for SAR recovery on private and public land, respectively. Economic instruments and SAR conservation Canadian economists and policymakers have been advocating for the greater use of economic instruments in conservation policy for quite some time (e.g. Kenney, Elgie and Sawyer 2011; Adamowicz 2016)*. Although rigorous field-level evidence is limited, economic theory and empirical studies suggest that economic instruments have several strengths for promoting SAR management and recovery. These include:
• Providing financial rewards for SAR management and recovery, which may incent conservation at a greater scale than regulatory or strictly voluntary initiatives.
• Offering a continued incentive for landowners and industry to improve their environmental performance (Field and Olewiler 2003; Adamowicz 2016).
* Within the context of this paper, we define economic instruments as those which use monetary values to internalize the social costs and benefits of economic activity. Examples in the conservation context include regulatory price signals (e.g. direct or indirect taxes on point and nonpoint source pollution); targeted environmental subsidies (such as payment for ecological service schemes or tax credits for conservation easements on ecologically significant land); direct markets for SAR habitat (e.g. conservation easements and fee simple acquisition); reverse auctions; and tradeable permits (e.g. offsets for activities harming SAR and their habitat, or tradeable water quality permits). (This definition and list is adapted from Pirard 2012).

| 27
• Well-designed economic instruments can also significantly improve the cost-effectiveness of recovery actions, provided that they are appropriately tailored to mitigate and compensate for priority threats to SAR, and are able to target the actors who can do so at the lowest cost (or use mechanisms to reveal this information) (e.g. Brown et al. 2011; Boxall, Perger and Weber 2013).
• Finally, some economic instruments - such as taxes on point and nonpoint pollution sources, or development cost charges - can potentially raise additional revenues for conservation measures which directly or indirectly benefit SAR*.
Economic instruments and private land Many of the SAR recovery activities funded by F/P/T stewardship programs take the form of subsidies for BMP adoption (e.g. cost-sharing programs), or voluntary farmer outreach and extension activities. While there are cases where these approaches work quite well, they may be less suitable than economic instruments for certain kinds of SAR recovery actions.
For instance, in contrast to some economic instruments, extension programs and subsidies for BMP adoption do not attempt to compensate landowners for the opportunity costs of their management actions – which can seriously limit the uptake of BMPs on private land (Lamba, Filson and Adekunle 2009; Rollins, Simpson and Boxall 2018). Pannell’s (2008) public:private benefits framework for analyzing environmental programs helps underline why positive incentives or negative incentives - many of which are implemented via economic instruments - may show greater promise for recovering SAR on private land (Fig. 3).
* However, this use of the proceeds should be carefully considered alongside other options, such as recycling the revenues back to landowners and industry. Examining trade-offs in the use of proceeds is important, since these affect the total conservation benefits and economic costs of the policy, and may influence the policy’s political acceptability.
Figure 3: Public:Private Benefits Framework
Source: Adapted from Pannell (2008)
Pu
blic
Ne
t B
en
efi
t
PositiveIncentives
NegativeIncentives
Extension
No action orflexible negativeincentives
TechnologyDevelopment or No Action
No action (or extension or negativeincentives)
Private Net Benefit
+
0
+
-
-

28 | Species in the Balance: Partnering on tools and incentives to recover species at risk
REPORT | Species in the Balance
The framework suggests that practices with high public and private net benefits are best promoted through extension programs rather than economic incentives, since landowners would be more willing to pilot or adopt the practice after learning about the private economic benefits. On the other hand, practices with high public net benefits but negative private net benefits — as is likely the case with numerous SAR conservation activities on private land13 — are best promoted through economic instruments (‘positive incentives’)14 . More generally, strictly voluntary programs for providing public goods (such as SAR habitat) run the risk of low participation rates, leading to lower overall environmental benefits (Pannell 1999; Rollins, Simpson and Boxall 2018). For similar reasons, while cost-share programs may induce some relatively straightforward SAR conservation activities such as installing fences for livestock, additional payments may be needed to compensate landowners for engaging in more costly or labor-intensive activities such as conservation easements (for habitat protection or other purposes), residence (or habitat) creation and enhancement, or wetland restoration (Rollins, Simpson and Boxall 2018). Economic instruments such as appropriately priced fee simple acquisition, conservation easements, or payments for environmental service schemes could help address this gap. Economic instruments and public (crown) land Economic instruments for SAR conservation on private land can also complement protected areas and land-use regulations. For instance, modelling studies suggest that economic instruments for protecting sage grouse habitat on private land (such as conservation easements) can be a cost-effective complement to “core area strategies” which limit infrastructure development in areas with high SAR population densities (Copeland et al. 2013)15. Even in the case of industry operations on crown land, properly designed economic instruments for limiting cumulative disturbances can potentially achieve similar or superior biodiversity outcomes to protected area networks at a lower cost (Weber 2004).
These findings suggests that protected area networks need to be complemented by a broader suite of tools to protect SAR and enhance their recovery on both private and crown land (outside of protected areas). This being said, economic instruments are not a one-size fits all set of tools. The choice of instrument and their design needs to be tailored to the priority threats and recovery actions facing the landscape or watershed in question, and they need to be explicitly targeted towards the actors whose intervention is likely to be most cost-effective. Moreover, while payments are often a necessary condition for engaging landowners in stewardship, they may not be a sufficient condition. Policymakers also need to consider demographics, land ownership and land use patterns, as well as local norms and context (Olive 2014).
Thus, economic instruments have considerable potential for improving SARA outcomes. Policy makers would be wise to invest in research to properly design and test these conservation tools. This requires the use of field experiments with suitable evaluation measures included. We provide a number of proposal for better integrating economic instruments into SAR management in sections 5.2 and 5.3.

| 29
3.4 Hurdles to using place-based (multispecies and ecosystem) approaches
Place-based approaches (including multispecies* and ecosystem** approaches) have implications for several aspects of the SAR management process. In particular, many stakeholders are interested in multispecies and ecosystem-based approaches due to their potential for improving the biological effectiveness and cost-effectiveness of SARA’s recovery strategy and action planning processes, since an integrated approach to assessing multiple species can potentially create economies of scale or of scope. Policymakers have recognized for over a decade that placed-based approaches have significant implications for how the three responsible authorities implement SARA. For instance, The Commissioner of Environment and Sustainable Development of the Office of the Auditor General (OAG CESD) has noted that multispecies approaches might speed up the recovery strategy development process, and senior managers from two of SARA’s three responsible authorities have also indicated that they intend to make greater use of these approaches to meet their recovery planning objectives where appropriate (OAG CESD 2013; ECCC 2012). Parks Canada has also developed multispecies action plans for eleven of its national parks containing three or more species at risk, with plans to develop additional multispecies action plans (Parks Canada Agency (PCA) 2017).
Despite this broad interest among stakeholders, several aspects of SARA’s implementation cycle bias recovery strategies towards a single-species approach. For instance, a number of stakeholders have observed that delays associated with SARA’s listing process16 , and COSEWIC’s largely species-by-species approach to species assessment, makes it extremely difficult for the federal government to implement place-based approaches, since recovery planning must be completed within a legally fixed timeline upon listing (OAG CESD 2013). This means that a critical mass of geographically overlapping species need to be listed by the GIC within the same assessment cycle in order for place-based recovery strategies to be viable within SARA’s legislated timelines (OAG CESD 2013).
Moreover, place-based approaches to recovery strategies may take longer to complete than single-species strategies, which compounds the difficulties with finalizing them under legislated timeframes. This suggests that at present, implementation of place-based approaches is to some degree constrained by legal requirements under SARA (see section 5.4 for recommendations).
* Multispecies approaches manage for two or more species within a given geographic area (Clark and Harvey 2002).
** For this report, we define ecosystem-based management approaches as those which target some supra-species set of attributes for a given ecosystem, in addition to managing for multiple species. These criteria may include “maintaining viable populations, ecosystem representation, maintaining ecological process (e.g. natural disturbance regimes), protecting evolutionary potential of species and ecosystems”, etc. (quote and definition adapted from Grumbine 1994).
Parks Canada has developed multispecies action plans for eleven of its national parks.

30 | Species in the Balance: Partnering on tools and incentives to recover species at risk
REPORT | Species in the Balance
3.5 Stewardship programs provide only short-term funding, are somewhat inflexible, and only selectively incorporate economic incentives
As SARA implementation matures and the number of finalized action plans increases, the federal government should look for opportunities to enhance the implementation of its stewardship programs, since these are the main mechanisms through which it finances recovery actions (especially on private land). These programs are also an important vehicle for implementing recovery measures for species which do not yet have finalized recovery strategies or action plans.
Although many interviewees viewed stewardship programs such as the HSP favorably, some of them expressed frustration with certain aspects of these programs. For instance, several stakeholders explained that the current timelines for approving and disbursing funds under the program can significantly delay their projects or force them to change the scope of their activities. Stakeholders also noted the potential for some strategic changes that could improve the overall effectiveness and impact of the program, such as allowing ECCC greater autonomy to target HSP funds towards higher priority SAR, threats or landscapes. Although some prioritization is already in place for stewardship programs, there was an interest in allowing these programs to also identify more specific priorities (see section 5.5 for recommendations).
3.6 Shortcomings in data collection, sharing, management and dissemination for informing decisions
Effective and efficient SAR management and recovery requires collecting and integrating substantial amounts of data from disparate sources. Information and data from multiple stakeholders (F/P/T/I governments, industry, ENGOs and academia) are collected as part of SAR policy processes, including COSEWIC assessments, species listing and related consultations, recovery strategies and action plans, stewardship programs, permitting under section 73 of SARA, as well as project review and approval processes under the Canadian Environmental Assessment Act (2012).
These data are crucial for informing management and recovery actions and evaluating their success. But doing so requires a disciplined, coordinated and systematic approach to (1) data collection, (2) data sharing and (3) data management. It also requires (4) making these data accessible to the broader public and (5) actively using these data to inform decision-making. Our workshop participants and stakeholder interviewees stressed that there is a vital need for improvement across all of these dimensions.
1. With regards to data collection, many of the crucial data are collected by the various players, but in some cases a lack of coordination leads to it being collected in manner which is not necessarily useful to decision-makers and regulators. For instance, one interviewee recalled an incident where inadequate lines of communication between an industry firm and a P/T government led to the former collecting SAR data in a format which the government could not use as part of its decision-making processes. Stakeholders also mentioned that poor coordination sometimes leads to duplicated efforts.

| 31
2. In other important cases, information is collected, but is not shared between organizations – either due to coordination issues, legal complications, or confidentiality concerns. For instance, one stakeholder noted that in some cases data are not even shared within the same government department. Other interviewees noted some of the difficulties that COSEWIC encounters when attempting to share SAR mapping data. Some of these maps are derived from P/T data, which can then create a bottleneck to sharing these maps, since COSEWIC would need to obtain the consent from all of the individuals or organizations who provided the initial data. To provide another example, while stakeholders disagree over the full extent of the problem and its ramifications, one government stakeholder provided a pointed perspective on some challenges with sharing the data used for critical habitat mapping: “The most difficult thing to make right are the maps. Updating SAR maps is difficult because no one individual or institution is responsible for [them] or the data used to make them. There is no dedicated record-keeping for the maps as a GIS document. This has a huge effect on the species recovery and listing. People at the federal level spend lots of time redoing those maps.
There is a lot of talk about making data available but no one wants to keep that data. Everyone wants to avoid risk. If someone is the keeper of data, then that organization is responsible for protection and sharing it, including third-party information with signed contracts and data on sensitive species.
No one wants to keep data because it takes too much time to administer. No one wants to take responsibility. SAR programs are suffering because of a lack of data sharing. Under the current scheme the reasons for not sharing data are stronger than reasons for sharing data…But no one is calculating the impact on species of not [sharing data].” (Personal communication, September 08, 2016)
3. Once these data have been collected, they also need to be managed in a structured and accessible way. There are some important steps being taken towards systematically housing and integrating SAR data amongst various organizations operating in the SAR recovery space, such as COSEWIC, the Government of Canada’s SARA registry, various provincial and territorial Conservation Data Centres, and the University of Ottawa’s SARA database. However, there is no institution which integrates the lion’s share of information gathered from the various players into a single repository.
4. Making information accessible to the public is also an essential part of enhancing accountability and improving overall outcomes, since it allows scientists and civil society to access information to evaluate the extent to which F/P/T governments are upholding their responsibilities The federal government and other stakeholders have already made some important strides towards greater accessibility, such as through the SARA registry, the Open Government portal, various publically accessible SAR maps housed by provincial governments, etc.
Species at risk programs are suffering because of a lack of data sharing.

32 | Species in the Balance: Partnering on tools and incentives to recover species at risk
REPORT | Species in the Balance
However, multiple interviewees noted that there are still several missed opportunities for making additional data available and accessible to the public. One interviewee gave the example that until recently, if a landowner wanted to know if they were operating in the vicinity of any SAR, they had to manually search through each federal recovery strategy document to obtain this information (and even then, the precise locations were not provided)*. As such, providing data in an easily accessible format for non-government stakeholders and the general public – with safeguards for ensuring SAR safety or the confidentiality of the data providers - is an important opportunity.
5. Finally, data collected by various stakeholders need to be used strategically in order to inform decision-making on such matters as which threats are the highest priority to address, whether an incidental harm permit under SARA should be issued on federal land (see section 3.8), or the extent to which conservation easements are ensuring habitat connectivity for SAR, to name but a few applications. In the absence of data for informing these decisions (and transparent documentation on how they were used as an input to the decision-making context), there is a risk that ineffective interventions will be made, or that the public will perceive regulatory decisions as uninformed by scientific evidence.
We outline how the various SARA players might be able to improve on these matters in section 5.6.
3.7 Lack of clarity on compliance measures available to proponents for projects triggered under the Canadian Environmental Assessment Act (2012) due to potential impacts on species at risk, including assessing and managing cumulative effects
3.7.1 Interactions between the Species at Risk Act and the Canadian Environmental Assessment Act (2012)
SARA interacts with the Canadian Environmental Assessment Act (CEAA 2012) in ways which could have significant implications for SAR recovery and for resource development projects. Section 5 of CEAA (2012) contains a list of “Environmental Effects” which require assessment, including changes to fish and fish habitat, aquatic SAR and their habitat, as well as migratory birds and their habitat. Relatedly, section 79 of SARA requires the responsible authorities under CEAA (2012) to identify potential risks to SAR and their CH for any project under review, and to identify appropriate measures to avoid, mitigate and monitor harm to SAR from the proposed project.
Several industry stakeholders have noted that the interaction between the two laws has exposed project proponents to considerable regulatory uncertainty. They noted that federal regulators are often placed in a difficult situation when assessing a project’s potential to harm SAR on non-federal land. This is due to the fact that the federal government does not have the legal authority to issue a permit under section 73 of SARA for activities which might harm SAR on non-federal land (since the prohibitions which form the basis of a section 73 permit generally do not apply)17. On the other hand, they are understandably reluctant to simply approve a project which might harm SAR on non-federal land18. * It should be noted that in some cases, ommitting precise locations is necessary in order to protect SAR
from potential harm.

| 33
Industry stakeholders have claimed that this impasse has led to delays and uncertainty for certain projects (Mining Association of Canada 2016). The upshot is that some of these projects might have been viable if flexible - but scientifically credible - compliance systems were in place for non-federal land, such as offsets backed by permits under P/T legislation, or signed section 11 agreements.
3.7.2 Cumulative effects assessment under the Canadian Environmental Assessment Act (2012)
Properly accounting for and managing cumulative effects amongst all relevant actors at a landscape scale is essential for ensuring that impacts to SAR are avoided and mitigated, and for determining whether a given project will affect SAR’s likelihood of survival and recovery. Cumulative effects assessments for projects triggered by CEAA (2012) are currently undertaken through project-scale impact assessments (IAs)
*. Stakeholders from industry, academic and ENGO communities have expressed frustration with this system since, for project scale assessments, there is no agreed-upon method for aggregating the effects of multiple proposed and active projects to determine overall cumulative effects (c.f. Sinclair, Doelle and Duinker 2017).
These challenges associated with assessing and mitigating cumulative effects also have real economic implications. Several industry proponents (e.g. Mining Association of Canada 2016) claim that CEAA (2012)’s triggering provisions can cause projects to be significantly delayed or have project approvals withheld due to their potential to harm SAR, despite the fact that the project in question may not have a large environmental impact or comprise a major threat to SAR19. As one industry commentator noted, “project proponents subject to CEAA (2012) are now being held responsible for past, present and future cumulative effects, including those on species at risk not caused by the project” (Mining Association of Canada 2016).
One need not take a side in this debate to observe that improving cumulative effects assessment and management has the potential to enhance conservation and economic outcomes associated with the IA process. For instance, improving cumulative effects assessment might provide proponents with some additional room to manoeuvre within the assessment process, by increasing the available set of options for mitigating cumulative effects (e.g. through offsets or other compliance measures), or by broadening the set of actors who are required to mitigate these effects.
Making greater use of multi-stakeholder regional impact assessments (IAs) for informing project-level IAs and associated project approvals, as proposed by the Federal Expert Panel for the Review of Environmental Assessment Processes (“the Expert Panel”; Gélinas 2017) and by many submissions to the panel, would be a positive step forward in addressing this issue. The federal government has indicated that it is taking these recommendations under consideration in its Environmental and Regulatory Reviews Discussion Paper (Government of Canada 2017b). We sketch how such a system might better incorporate SAR processes and considerations in section 5.7.
* In keeping with the Federal Expert Review Panel’s proposal (Gélinas et al. 2017), we use the term “impact assessment” instead of “environmental assessment” throughout this report, since the former is a broader approach which examines the potential effects of proposed projects on the five “pillars” of sustainability (environment, economy, social, cultural and health).
Improving cumulative effects assessment and management has the potential to enhance conservation and economic outcomes.

34 | Species in the Balance: Partnering on tools and incentives to recover species at risk
REPORT | Species in the Balance
3.8 Underuse of compliance measures – such as rigorous offsets, backed by permits or section 11 conservation agreements – to address impacts to species at risk on federal, provincial, and territorial crown land, along with unclear requirements for assessing and managing cumulative effects
3.8.1 Need for compliance mechanisms for activities affecting critical habitat
Offsets are an important policy tool for mitigating and compensating harm to SAR on crown land, while allowing for appropriate economic development activities. Offsets are currently included within SARA’s proposed policy for section 73 permitting, which would allow proponents to undertake projects which might harm SAR on federal land or in aquatic ecosystems, provided that measures are in place to avoid, mitigate and compensate for loss of SAR, their residences and their habitats (Government of Canada 2016a).
In particular, activities with a potential to harm SAR on federal lands (or lands protected under an emergency order or a safety net order) or aquatic SAR are only allowed if a section 73 permit20 is issued by the responsible authority on the grounds that either:
1. the activity is for scientific study of SAR;
2. the activity is meant to benefit a SAR or is necessary to enhance the probability of its survival in the wild;
3. the harm to SAR is incidental to the overall activity.
An incidental harm permit further requires that:
a) all reasonable alternatives to the activity which would reduce the impacts on the SAR have been explored, and the best solution adopted;
b) all feasible measures to minimize the remaining impacts to SAR have been taken;
c) the activity will not further jeopardize the SAR’s recovery.
Establishing a scientifically rigorous, precautionary and risk-based offset system for projects affecting SAR on federal crown land and aquatic ecosystems – and extending their coverage to non-federal land through section 11 agreements and parallel P/T permitting policies - will become increasingly important in the future, as more and more CH are identified and protected on both federal and non-federal lands. The federal government’s proposed permitting and offsets policy provides some helpful steps in the right direction, provided that appropriate measures are in place to ensure net gains to SAR under the policy (see section 5.2.1 for discussion).
3.8.2 Cumulative effects assessment under the Species at Risk Act’s permitting policy
Quantifying and managing cumulative effects to SAR is another important issue which is not fully addressed by SARA’s proposed permitting and offset policy – in fact, the policy makes no explicit mention of cumulative effects assessment at all. The permitting policy does require ECCC to determine whether a proposed activity jeopardizes the survival or recovery of a species, including assessing the other factors impacting SAR’s survival or recovery – which has some similarities to cumulative
Current funding levels are not up to the task of stabilizing and recovering species at risk populations.

| 35
effects assessment21. However, a more explicit requirement to assess and manage cumulative effects at larger spatial scales would likely strengthen the effectiveness of the policy.
Cumulative effects assessment is particularly important for condition (c) of SARA’s proposed permitting policy, since understanding how different threats on the landscape conjointly impact SAR is essential for determining whether a project is likely to jeopardize SAR recovery. As such, this critical aspect of SARA’s overall policy toolkit needs to be resolved. The reforms to cumulative effects assessment currently under consideration by the federal government as part of the CEAA (2012) review process provides instructive lessons for addressing cumulative effects under SARA’s proposed permitting and offset policy (see section 5.7).
3.9 Overall resources for implementing the Species at Risk Act are lacking
SAR planning and recovery processes require significant amounts of resources, and our stakeholders repeatedly emphasized that current funding levels from conservation organizations, industry and governments are not up to the task of stabilizing SAR populations and recovering them. Interview and survey respondents noted that in many cases public awareness of issues relating to SAR protection is lacking, and this low public profile means that increasing resources for implementing SARA has not been a top priority for governments.
The challenge of resourcing SAR recovery activities can be broken down into three components: (1) the high share of resources devoted to “front end” SARA processes (such as listing and recovery strategies) compared to action planning and implementing recovery actions (and evaluating their effectiveness); (2) the need for conservation organizations and all levels of government to identify new sources of revenue; (3) the need for a well-targeted and strategic increase in public spending that is commensurate with the scale of the SAR recovery challenge.
3.9.1 Low share of resources for action planning and recovery actions
Many of our interviewees and workshop participants were clear that recovering SAR will require additional resources at all levels of government - federal, provincial and territorial, Indigenous, and municipal. Several provincial, territorial and municipal governments are facing significant fiscal challenges, which may require them to explore new methods for funding SAR recovery. Numerous stakeholders suggested that new funding could help governments to better fulfill their respective mandates. One government interviewee provided a pithy summary of the challenge, noting that: “Given the expense to secure, enhance and rehabilitate habitats for the benefit of the protection and recovery of species at risk, it is difficult to have a national impact on the conservation actions of others with about $25 million per year (for stewardship programs).” (Personal communication, December 15, 2017)

36 | Species in the Balance: Partnering on tools and incentives to recover species at risk
REPORT | Species in the Balance
Similarly, Robert McLean, Director of the Canadian Wildlife Service noted that: “[The Government is] putting a lot of money into recovery strategies…. We should take the energy that goes into recovery strategies and get it into action plans…if we had action plans…people would be less worried about recovery strategies…[They’d be] putting money into implementation of that [action] plan.” (Personal communication, September 02, 2016)
These opinions were broadly shared by survey respondents. For instance, when asked to identify the most important step in the SARA process to improve upon, recovery strategy implementation (including action plans) was the first or second-most frequently mentioned answer across government, industry and ENGO respondents (Fig. 4).
Figure 4: Canadian respondents’ ranking of the most important step to improve upon in implementing the Species at Risk Act, by organization type*
0%
10%
20%
30%
40%
50%
60%
70%
80%
90%
100%
Firstchoice Topthree Firstchoice Topthree Firstchoice Topthree
GovernmentOrganizations(n=11) IndustryOrganizations(n=15) ENGOOrganizations(n=41)
%ofrespo
nden
ts
Other
Monitoring/reporting
Consultations
RecoveryStrategyImplementation
RecoveryStrategyDevelopment
Listing
Science
*“ Top three” refers to the number of times each step was mentioned in the top three rankings, divided by the total number of mentions for all items in the top three rankings.
Source: Smart Prosperity Institute, Species at Risk survey
On the other hand, when respondents were asked to identify the top areas of current SARA spending for their respective organizations, all three groups were generally more likely to list policy development/advocacy and science/monitoring as their highest spending area, rather than field work (including habitat restoration; see Fig. 5). This is significant since the latter is a key element of SARA implementation. It is also noteworthy that ENGOs were the only category of respondents to rank land acquisition among their priority spending areas (and it was only a small proportion who did so). The relatively low priority assigned to land acquisition and field work across all respondents is even more pronounced when comparing respondents’ lists of top three spending areas for their respective organizations.

| 37
Figure 5: Canadian respondents’ ranking of current species at risk spending areas, by organization type*
(Source: Smart Prosperity Institute, Species at Risk survey)
*“Top three” refers to the number of times each spending area was mentioned in the top three rankings, divided by the total number of mentions for all items in the top three rankings.
3.9.2 Additional public investments are needed to recover species at risk - new funding tools can help
Our stakeholders were clear that the scale of the SAR recovery challenge will require additional resources at all levels of government - federal, provincial, territorial, and municipal. Several jurisdictions and municipal governments are facing significant fiscal challenges, which may require them to explore new tools for funding SAR recovery. Several stakeholders suggested that new models for generating revenue could help governments to better fulfill their mandates.
Our survey respondents were also in broad agreement that additional funding would make a major contribution to meeting SAR recovery objectives. For instance, securing additional resources was the highest ranked factor for improving SARA outcomes among government respondents, and was the second highest ranked factor among ENGO respondents (Fig. 6). However, industry and ENGO respondents generally thought that political will and stakeholder support was the most important factor for improving outcomes (industry respondents rarely cited additional resources as their most desired factor).
0%
10%
20%
30%
40%
50%
60%
70%
80%
90%
100%
Firstchoice Topthree Firstchoice Topthree Firstchoice Topthree
GovernmentOrganizations(n=8) IndustryOrganizations(n=14) ENGOOrganizations(n=41)
%o
fres
pond
ents
Other
Education/Consultation
Landacquisition
FieldWork
Science/Monitoring
Admin/Legal
PolicyDevel/Advocacy

38 | Species in the Balance: Partnering on tools and incentives to recover species at risk
REPORT | Species in the Balance
Figure 6: Canadian respondents’ ranking of most desired factor for improving SAR outcomes by organization type*
(Source: Smart Prosperity Institute, Species at Risk survey)
*“Top three” refers to the number of times each factor for improving SARA outcomes was mentioned in the top three rankings, divided by the total number of mentions for all items in the top three rankings.
The case for increasing overall SAR conservation funding is made even stronger by comparing Canada’s SAR conservation expenditures with those of the United States. The U.S. federal government spent approximately USD $1.7 billion on implementing the Endangered Species Act in 2013-2014 (United States Fish and Wildlife Service (US FWS 2014a). By contrast, in 2013-2014 the Government of Canada spent approximately $84 million on SAR recovery (ECCC 2014; DFO 2014; PCA 2014)*. In real per capita terms, U.S. Federal expenditures in 2013-2014 roughly corresponded to CAD $5.70 per capita, whereas the government of Canada only spent around $2.50 per capita on SARA implementation that same year22. As such, Canada’s federal government spends approximately half as much per capita on imperilled species conservation compared to the US federal government**. This shortfall in SARA funding potentially has serious implications - previous U.S. research has found that increasing expenditures on endangered species conservation reduces the likelihood of further species declines (Kerkvliet and Langpap 2007; Ferraro, McIntosh, and Ospina 2007). Similarly, a recent study found that the increase in international biodiversity spending since the 1992 Earth Summit reduced median endangered bird and mammal species losses per country by approximately 29% (Waldron et al. 2017). * While it is difficult to consistently quantify P/T SAR-related expenditures (especially since several
provinces and territories either lack dedicated SAR legislation and/or do not publish data on SAR conservation expenditures), based on a preliminary literature review we estimate that combined P/T expenditures may be in the range of 50-70% of federal expenditures.
** However, state spending makes up a small fraction of overall US ESA expenditures (approximately 4% of total state-federal ESA expenditures in 2013-2014), whereas the P/T share of SARA expenditures is likely to be much higher, so this is not an apples-to-apples comparison. Nonetheless, even a ‘back of the envelope’ adjustment for estimated Canadian P/T expenditures suggests that Canada may only be
0%
10%
20%
30%
40%
50%
60%
70%
80%
90%
100%
Firstchoice Topthree Firstchoice Topthree Firstchoice Topthree
GovernmentOrganizations(n=11) IndustryOrganizations(n=14) ENGOOrganizations(n=41)
%o
fres
pond
ents
Other
Politicalwill/Stakeholdersupport
Science
Coordination/Communications
HSPandotherprojectapprovals
Developmentprojectapprovals
Resources

| 39
Each of these examples illustrates that Canadian governments can and should be spending more to recover SAR. In section 5.8, we outline possible tools for funding SAR conservation amongst federal, provincial, territorial and municipal governments, and make the case for a strong public investment in SAR conservation.
4. EMPIRICAL CORRELATES OF SPECIES AT RISK RECOVERY*
Better understanding of the threats faced by SAR, their recovery trends and the actions that affect recovery is likely to strengthen conservation efforts (Campbell et al. 2002, Hutchings et al. 2012) through, among other things, prioritization of conservation or recovery actions. A recent survey of conservation managers (Cook et al. 2012) revealed that while conservation managers highly value empirical evidence on which to base their decisions, such data were usually much less readily available than other types of evidence - such as expert opinion, or syntheses of experience and information (Cook et al. 2012).
Here we present an empirical analysis of factors associated with recovery of species at risk in the United States and Canada. For the U.S. analysis, we use changes in population abundance and/or geographical distribution of species listed before 1981 under the United States Endangered Species Act (US ESA). For the Canadian analysis, we use recovery feasibility and changes in status (as these terms are assigned by COSEWIC).
spending around 60-70% per capita on recovering species at risk compared to the U.S.* This section is adapted from Shahira Khair, Samuel J. McIntosh, Sawyer Stoyanovich, Noah
Greenwald, Kieran Suckling and C. Scott Findlay. 2017. “Empirical correlates of SAR recovery.” Department of Biology and Institute of Environment Working Paper, University of Ottawa.
Key Takeaways
• Understanding how recovery actions can address key threats to species at risk or compensate for their effects is essential to improving recovery outcomes.
• This section analyzes several potential correlates of imperilled species recovery, using data on actual species abundance and range trends for species listed under the United States Endangered Species Act, and recovery feasibility and status changes for species listed under the Species at Risk Act.
• For species listed under the United States Endangered Species Act, these correlates consist of identified threats, implemented recovery actions, and threat remediation actions (recovery actions directly addressing threats).
• For species listed under the Species at Risk Act, only recovery correlates for identified threats were analyzed.
• The analysis suggests that recovery actions generally designed to mitigate indirect or direct sources of mortality – such as direct or indirect “take”, invasive or problematic species, and pollution - are most likely to have detectable positive impacts on species at risk recovery.
• These findings do not imply that habitat conservation or restoration – a key focus of many recovery efforts - is without value.
• Instead, the study findings suggest that any systemic effects of habitat protection, restoration and enhancement measures are currently difficult to detect. Objectively evaluating the effects of such measures on recovery will require substantially improved data collection.

40 | Species in the Balance: Partnering on tools and incentives to recover species at risk
REPORT | Species in the Balance
In this analysis, the factors of interest are the threats species face or the actions that have been taken to mitigate these threats. We focus on these factors principally because virtually all species conservation measures are designed either to mitigate threats (i.e., reduce their magnitude, scope or intensity) or to compensate in some manner for their effects (for example, through off-site activities such as captive breeding or species reintroduction).
4.1. Recovery under the United States Endangered Species Act
4.1.1 Methods
To allow sufficient time for recovery in response to recovery actions under the US ESA, we considered species listed before 1981, excluding terrestrial Hawaiian species, species that were considered to be extinct before listing, and species that have been subsequently delisted due to errors in their original listing decision (U.S. FWS 2014b).
In collaboration with the Centre for Biological Diversity in Washington, Oregon, we searched a wide range of sources for quantitative estimates of changes in species abundance, number of populations or range size since U.S. ESA listing23. Using these data, recovery was evaluated by regressing the change in abundance or distribution on time. This index — termed Recovery Slope (RS) - is positive for species that showed an overall increase since listing, and negative for those that continued to decline (Fig. 7).
Figure 7: Examples of trends in population estimates (number of individuals) (symbols) and fitted recovery slopes (RS - lines) for two different species (Northern Rockies Gray Wolf and Texas Wild Rice) in the US ESA data set
-1000
0
1000
2000
3000
4000
5000
1989 1994 1999 2004 2009
Estim
ate
Year
GrayWolf(NorthernRockiesDPS) TexasWildRice

| 41
We extracted threat and recovery action information from each species’ Recovery Plan, Five-Year Review, Plan Action Statuses and/or Post-Delisting Monitoring Plans (hereafter referred to as “ESA recovery documents”). These data allow us to determine the extent to which recovery since listing (RS) is associated with the threats to which a species is exposed; the recovery actions that have been implemented; and whether threats have been addressed through one or more implemented recovery actions. To classify threats, we used the IUCN Threats Classification Scheme, Version 3.2 (Levels 1 and 2)24. In collaboration with the Centre for Biological Diversity, we developed a conservation action classification (Table 2) and scored each species as to whether one or more actions in a given action class had been implemented. Finally, for each threat, we determined which implemented actions - if any - addressed the threat in question (Table 2).
Table 2: IUCN threats and associated recovery actions which, if implemented, are considered to at least partially address (mitigate) the threat in question*
Threat Recovery actions addressing threat
Residential & Commercial Development (RCD)
Agriculture (AG)
Energy Production & Mining (EPM)
Transportation & Service Corridors (TSC)
Elimination/Prevention of Source of Habitat Modification (EPMHab)
Protection of Remaining Habitat (PRHab)
Restoration and/or Rehabilitation of Habitat (RRHab)
Active Enhancement of Habitat (ENHab)
Biological Resource Use (BRU)Reduction of Direct/Indirect Commercial, Subsistence and/or Recreational Exploita-tion (RDEx)
Human Intrusions & Disturbance (HIM)
Natural Systems Modification (NSM)
Elimination/ Prevention of Source of Habi-tat Modification (EPMHab)
Restoration and/or Rehabilitation of Habitat (RRHab)
Invasive & Other Problematic Species, Genes & Diseases (IOP)
Direct/Indirect Biological Control (BCtrl)
Vector Reduction (RVec)
Pollution (POL)Elimination or Reduction of Point/Nonpoint Source Pollution (ERP)
* For example, RCD, AG, EPM and TSC may be — at least in principle - addressed by recovery actions designed to conserve, protect, restore or rehabilitate habitat (i.e. EPMHab, PRHab, RRhab or ENhab).

42 | Species in the Balance: Partnering on tools and incentives to recover species at risk
REPORT | Species in the Balance
4.1.2 Results
Sufficient variation in the sample allowed us to investigate possible associations between RS and biological resource use (BRU), human intrusion and disturbance (HIM), natural systems modification (NSM), invasive or problematic species, genes or disease (IOP) and pollution (POL).
Of those threats investigated, the strongest detected associations were with BRU, IOP and POL. For birds, reptiles and fish, higher average recovery slopes are positively associated with recovery actions to reduce biological resource use (Fig. 8). Moreover, among species threatened by biological resource use, those for which recovery actions to reduce take have been implemented have, on average, a higher recovery slope than those for which no such actions have been taken (Fig. 9). For plants, recovery slope was positively associated with control of invasive or problematic species (Fig. 10). Moreover, among species for which invasive or problematic species were a threat (principally plants and fish), those for which mitigation actions had been implemented had, on average, larger recovery slopes than those which did not (Fig. 9).
Finally, among species (principally birds, fish and reptiles) threatened by pollution, those for which mitigation actions had been implemented had, on average, a larger recovery slope than those that did not (Fig 9)
Figure 8: Average recovery slope (± 1 standard error) of birds (N(P) = 17, N(A) = 15), reptiles (N(P) = 22, N(A) = 9) and fish(N(P) = 20, N(A) = 28) in cases where recovery actions to reduce biological resource use (BRU) were present (P) or absent (A)
Rec
ove
ry s
lop
e
BirdsReptilesFish
-0.04
-0.02
0.00
0.02
0.04
0.06

| 43
Control of invasive or problematic species
Present Absent
Rec
ove
ry s
lop
e
-0.02
0.00
0.02
0.04
0.06
0.08
-0.03
-0.02
-0.01
0.00
0.01
0.02
0.03
BRU mitigationIOP mitigationPOL mitigation
P A P A P A
Figure 9: Average recovery slope (± 1 standard error) where recovery actions to mitigate biological resource use (BRU; N(P)=81; N(A)=26), invasive or problematic species (IOP; N(P) = 109, N(A) = 45)) or pollution (POL; N(P) = 55, N(A) = 55) were present (P) or absent (A), for species for which each threat was explicitly identified. Averages are based on pooling over taxa
Figure 10: Average recovery slope (± 1 standard error) for vascular plants where recovery actions to mitigate invasive or problematic species (IOP) were present (N=16) or absent (N=17)
Rec
ove
ry s
lop
e

44 | Species in the Balance: Partnering on tools and incentives to recover species at risk
REPORT | Species in the Balance
4.2. Canadian Species at Risk
4.2.1 Methods
For the Canadian analysis, data on (i) recovery feasibility and (ii) changes in COSEWIC status were used to quantify the extent to which exposure to specific threats (as identified in COSEWIC assessments and recovery strategies) was associated with SAR recovery.
Under SARA, recovery of a wildlife species is considered feasible if the following four criteria are met:
• Criterion 1. Individuals of the wildlife species that are capable of reproduction are available now or in the foreseeable future to sustain the population or improve its abundance.
• Criterion 2. Sufficient suitable habitat is available to support the species or could be made available through habitat management or restoration.
• Criterion 3. The primary threats to the species or its habitat (including threats outside Canada) can be avoided or mitigated.
• Criterion 4. Recovery techniques exist to achieve the population and distribution objectives or can be expected to be developed within a reasonable timeframe.
Information on IUCN threats, recovery feasibility (feasible, not feasible or unknown), and whether a particular feasibility criterion was satisfied, was extracted from finalized SARA recovery strategies. This allowed us to determine which criteria and threats were most strongly associated with recovery feasibility.
In Canada, COSEWIC has been providing species assessments since 1978. Because a large number of species have been assessed multiple times, we can examine associations between changes in status over time and IUCN threats. Unlike the case of recovery slopes for species listed under the U.S. ESA (see section 4.1), we did not consider potential associations with recovery actions.
Moreover, status changes need not reflect changes in population distribution or abundance. Criteria employed by COSEWIC for assigning status have changed over time. Status assignments may also change because of new information coming to light – for example, the discovery of a previously unknown population(s) with enhanced search effort that was stimulated by listing or by COSEWIC findings of data deficiency. These and other factors reduce the extent to which one can infer changes in abundance or distribution from changes in COSEWIC status; by contrast, recovery slope as outlined in section 4.1. above is a much more direct index of changes in abundance and distribution.
We selected a sample of 95 species (25 birds, 41 vascular plants, 13 herptiles (reptiles and amphibians) and 16 mammals, including 5 marine mammals) that had been assessed at least three times by COSEWIC; whose initial status was extirpated (EX), endangered (EN), threatened (TH), special concern (SC) or not at risk (NR); and for which we had IUCN threat information extracted from the latest COSEWIC status assessment. We assigned values to each status (EX = 1, EN = 2, TH = 3, SC=4, NR = 5) and calculated the difference in these values between successive assessments (e.g. for a species that went from threatened to endangered, the change in status between assessments is 2-3 = -1), with a negative/positive change denoting an increase/decrease in threat status respectively.

| 45
We explored associations between IUCN threats and change in status between the first two COSEWIC assessments (first change), as well as the last two COSEWIC assessments (last change). Because the potential for change between assessment periods depends on the initial status (e.g. a species originally assessed as EN can only increase one threat level (to EX) but can decrease 3 levels (to NR), whereas a species originally assessed as TH can increase and decrease two levels), in evaluating any such associations we controlled for the maximum possible change given the initial status. Moreover, because the likelihood of change in status may increase with the interval between successive assessments, we also statistically controlled for the duration of the interval between successive assessments.
4.2.2. Results
Most species in the sample satisfied the criterion of having a sufficient number of reproductive individuals to sustain the population or improve its abundance (88%), and of having recovery techniques that could in principle achieve population and distribution objectives (72%). Overall recovery feasibility was independently associated with the criteria of sufficient habitat (criterion 2) and feasibility of threat mitigation (criterion 3; Fig. 11). These results indicate that for recovery planners, “unknown” feasibility is related primarily to uncertainty about the availability of sufficient habitat and the extent to which threats can be mitigated.
Figure 11. The proportion of species for which recovery was considered feasible in relation to whether a particular feasibility criterion was satisfied
Recovery feasibility was positively associated with biological resource use (BRU) and pollution (POL), and negatively associated with invasive and problematic species (IOP) (Fig. 12). This suggests that for those evaluating recovery feasibility, biological resource use and pollution are considered to be threats that are more readily mitigated than are invasive or problematic species.
0
0.2
0.4
0.6
0.8
1
Reproduction Habitat Threat Techniques
Proportionfeasiblere
covery
Feasibilitycriterion
Satisfied
Notsatisfied

46 | Species in the Balance: Partnering on tools and incentives to recover species at risk
REPORT | Species in the Balance
Figure 12: The association between recovery feasibility and whether biological resource (BRU), pollution (POL), or invasive and problematic species (IOP) was considered a threat
For plants, change in status was negatively associated with BRU (last change) and IOP (first change; Fig. 13). For mammals, last change was negatively associated with residential and commercial development (RCD; Fig. 13), while for herptiles (reptiles and amphibians), first change was negatively associated with natural systems modification (NSM; Fig. 13). BRU was only associated with the most recent change in COSEWIC status for plants, which may indicate that since the first assessment, actions that have been taken to reduce either direct or indirect take for birds and mammals have been more successful than for plants. This would be consistent with the findings for recovery under the US ESA, which indicated that reducing direct or indirect take is associated with, on average, more positive recovery slopes (Fig. 8). IOP was also not associated with final change for any taxa, perhaps suggesting that actions taken to control invasive or problematic species may have had some success, again consistent with the findings that, under the US ESA, action to control invasive or problematic species is associated with a greater average recovery slope (Fig. 9).
0
0.2
0.4
0.6
0.8
BRU IOP POL
Proportionfeasiblere
covery
Threat
Absent
Present

| 47
Figure 13. Average status change (± 1 standard error) in relation to the presence (P) or absence (A) of particular threats, including biological resource use (BRU; N(P) = 17, N(A) = 24), invasive or problematic species (IOP; N(P)= 34, N(A) =7 ), residential or commercial development (RCD; N(P)=10, N(A)=6), or natural systems modification (NSM; N(P)=8, N(A) = 5)
4.3. Discussion
Our analysis of recovery slope under the US ESA and recovery feasibility and changes in COSEWIC status in Canada suggest that reducing or eliminating biological resource use (including both direct and indirect take) and eradicating invasive or problematic species and disease are both likely to promote recovery and enhance recovery feasibility. For fish, results from the US ESA also suggest that recovery actions targeting habitat restoration/rehabilitation may well be effective*, as may pollution reduction.
The above notwithstanding, several caveats apply. Our analysis involves comparing the average values of variables such as recovery slope or changes in COSEWIC status of species that are, versus those that are not, exposed to a particular threat, or for which a particular class of recovery actions is, or is not, regarded as contributing to recovery. But the lack of exposure to a particular threat, or the lack of a recovery action, is not a bona fide control. By contrast, the analysis of threat mitigation - such as in Figs. 8, 9, and 10 - provides somewhat stronger evidence. In this case, the comparison is within a group of species that share a common threat - e.g. invasive or problematic species - and the question is: do those for which threat mitigation has been implemented seem to be doing better on average than those where there has been apparently little or no attempt to mitigate the threat?
Moreover, the lack of detectable associations between changes in abundance or distribution (i.e. recovery slope), or COSEWIC status, and specific threats or recovery actions should not be interpreted as indicating that particular threats or recovery
* Results of this analysis not shown here.

48 | Species in the Balance: Partnering on tools and incentives to recover species at risk
REPORT | Species in the Balance
actions are not important or effective respectively. Rather, comparatively low data quality and/or resolution, comparatively small within-taxon sample sizes25, and likely substantial differences among taxa or guilds in scope, magnitude and severity of different threats, and the extent to which different recovery actions have been implemented, mean that only comparatively strong associations will be detected. This means that in practice, associations with threats and recovery actions that do not have an immediate effect on survival and/or reproduction will be more difficult to detect.
4.4 Policy implications
Our findings have several implications for managing species at risk. First, we detected, on average, systematic positive effects of recovery actions generally designed to mitigate indirect or direct sources of mortality, including “take” (either direct or indirect), invasive or problematic species, and pollution. By extrapolation, any threat that induces substantial direct or indirect mortality (e.g. transportation infrastructure leading to road or rail mortality, habitat changes that increase predation rates or overwintering mortality, etc.) should be a focus of conservation management.
The above should not be taken to imply that habitat conservation or restoration (often a focus of recovery efforts) is of little value. But compelling evidence of their effectiveness (or lack thereof) is most likely to be forthcoming only when (a) habitat elements directly and strongly related to fecundity or survival (e.g. breeding sites, overwintering sites) have been identified; (b) substantial efforts are made to preserve, rehabilitate or restore these elements; and (c) systematic monitoring clearly shows an increase in the quality or quantity of these elements in response to habitat conservation, rehabilitation, enhancement or restoration measures. For many SAR, none of these conditions are satisfied. The consequence is that in many cases, we are unable to evaluate the effectiveness - let alone cost-effectiveness - of habitat conservation or restoration efforts*.
These considerations lead to a second policy implication: habitat conservation, rehabilitation or restoration initiatives should be implemented in a manner that permits the testing of hypotheses concerning the importance of particular habitat elements to species recovery. Any such testing necessarily requires systematic monitoring of both changes in (1) abundance or quality of those elements hypothesized as being important; and (2) changes in population abundance or distribution, using an experimental design that permits observed changes (if any) to be reasonably – ideally, compellingly – attributed to implemented habitat conservation, restoration, rehabilitation or enhancement measures. Policymakers should strongly consider integrating both sets of considerations into the design of SAR stewardship programs and of economic instruments for recovering SAR.
* The reason the analysis did not find habitat effects may be because existing habitat conservation ac-tions were not implemented in a rigorous or systematic fashion. This is one hypothesis. Alternatively, it may be that because different types of habitat conservation measures may have different strengths of association with fecundity or survival, detecting the effects thereof may be difficult to do because, unlike (say) reducing take, the effects are more diffuse and indirect - and hence, more challenging to detect.

| 49
5. SOLUTIONS FOR SPECIES AT RISK
Policymakers should consider eight actions to address the challenges facing Species at Risk implementation identified in section 3. These are:
• Governments fully implementing existing provisions under the Species at Risk Act.
• Using offsets – backed by permits and section 11 conservation agreements - to protect species at risk on federal, provincial and territorial crown land and offer greater certainty to project proponents under the Species at Risk Act and the Canadian Environmental Assessment Act (2012).
• Harnessing a suite of economic instruments and related tools to incentivize species at risk habitat protection on private land, restore large landscapes, and remediate non-habitat threats to species at risk.
• Making greater use of place-based (multispecies and ecosystem) approaches where appropriate.
• Ensuring that that federal and provincial species at risk stewardship programs (and related programs) are more directed, flexible and incentive-based.
• Improving data collection, sharing, management and dissemination for informing decisions, including through the creation of an online species at risk database.
• Leveraging data and regional impact assessment processes to manage cumulative effects under the Species at Risk Act and the Canadian Environmental Assessment Act (2012).
• Increasing overall species at risk conservation funding, diversifying funding sources and prioritizing expenditures towards implementing stewardship and recovery actions.
We identify eight actions for governments, environmental organizations and businesses to consider in order to address the challenges mentioned in section 3. Some of these are short-to medium term operational changes or policy changes, whereas others are long-term policy changes. While each of these actions has strong potential for improving SARA implementation, many of them are mutually reinforcing and will probably be most effective if they are implemented as a “package” of reforms to SARA. 5: Operational and policy changes e define operational and minor policy changes as those which a government 5.1 Governments fully implementing existing provisions under the Species at Risk Act
The Species at Risk Act has a wide range of tools for promoting transparency in SAR protection, encouraging cooperation between P/T governments, industry and land trust organizations, and for compelling P/T government compliance with SARA. Stakeholders noted that this powerful set of tools could be used to leverage considerable SAR protection; however, many stakeholders stressed that the federal government should be making much greater use of these tools. They were not naïve in believing the federal government simply must “do more”, but had useful views on where the federal government should increase the use of certain legal tools to more fully implement SARA, and on the need for increasing internal capacity and flexibility to allow easier use of these tools.
The federal government should consider prioritizing tools to facilitate greater cooperation and stewardship with the P/T governments and private land holders (such as section 11 and 13 agreements), followed by backstop protection measures in the event of P/T noncompliance with SARA (safety net orders, emergency orders and the section 63 clause).
Key Takeaways
50 | Species in the Balance: Partnering on tools and incentives to recover species at risk
REPORT | Species in the Balance
Most of SARA’s existing provisions consist of minor policy changes which could be implemented in the short term, although fully implementing section 11 and 13 agreements may require more time. We recommend that the federal government use the following tools more extensively:
• Section 11 & 13 agreements provide a mechanism for F/P/T cooperation in the spirit of the National Acord for the Protection of Species at Risk. Effective section 11 and 13 agreements would enable the federal government to extend SARA’s habitat protections (including critical habitat) to P/T crown land and private land – provided that they are sufficiently robust and backed by monitoring for compliance and effectiveness. If well-conceived, this could reduce the need for safety net orders, and provide P/T governments, ENGOs, industry and private landowners with better assurances that their actions are compliant with the requirements of SARA26. Improving linkages between the use of economic instruments and section 11 and section 13 agreements would also be strategic (see section 5.3.2). While the federal government has signed few (if any) finalized section 11 agreements to date, it is in the process of developing several of them in partnership with key stakeholders27. One interviewee explained that the slow progress on this file reflects the fact that each agreement has been unique, addressing the particular circumstances of different stakeholders and landscapes.
Another stakeholder explained that one of the main impediments to signed section 11 agreements has been the conflicting interests and mandates of industry and the federal government, respectively. For instance, some industry players have been reluctant to sign section 11 agreements which would commit them to implementing management or conservation measures (such offsets) in the absence of assurances that this will help them secure regulatory compliance (such as a section 73 permit or a project approval under CEAA (2012). On the other hand, the federal government cannot provide such assurances due to the convention that the Crown cannot bind itself to an outcome in advance of its project review process and related deliberations.
Providing a flexible template for section 11 agreements which states that proponents will implement the SAR conservation measures enumerated in the signed agreement, conditional on project approval from the Crown (such as a permit under section 73 of SARA), will be essential to resolve this impasse.
Effective section 11 and 13 agreements would enable the federal government to extend the Species at Risk Act’s habitat protections to provincial and territorial crown land, and private land.

| 51
In order to facilitate the development and signing of section 11 agreements, the federal government should also strongly consider establishing two dedicated pools of financial resources. One pool would be allocated to developing a set of legal templates or framework documents that help codify section 11 and 13 agreements for the usual circumstances under which they may be signed. Templates could be structured according to the tenure of the land under the agreement (P/T crown land, private land, Indigenous land), the organization that is co-signing the agreement (e.g. P/T/I government, NGO, private firm), or the threat remediation and/or recovery actions outlined in the agreement.
A second pool of resources should be devoted to legal and technical capacity-building amongst interested parties in areas such as drafting and implementing section 11 agreements, as well as monitoring and enforcement. Funding or in-kind support could be provided to parties who have shown a concrete commitment to partnering on section 11 agreements, including conservation organizations, municipalities, the private sector and P/T/I governments.
• Consistently applying the 180 days clause under section 63 - in which the Minister must report steps being taken to protect CH every 180 days, if the Minister believes that a SAR’s CH remains unprotected 180 days after it has been identified in a recovery strategy - is one possible means of ensuring that the government transparently reports on measures that it is taking to protect CH. It would also provide a public source of information on the federal government’s progress in closing any ‘gaps’ in CH protection (including through section 11 agreements). This being said, some stakeholders had mixed views on increasing the use of section 63 reporting. While many acknowledged that it would improve overall transparency, some argued that the federal government is already spending the bulk of its resources on meeting the legislative and procedural requirements of SARA, and that this would only increase the burden on staff and divert resources away from other important aims. However, others have pointed out that these burdens could be substantially reduced if there was a streamlined and well-designed template for such reporting.
• In cases where P/T governments are not effectively protecting SAR and their CH, using the safety net order could provide an effective backstop mechanism for ensuring compliance with SARA. One litmus test could be for the Minister of Environment to recommend that the GIC begin its deliberations on whether to issue a safety net order (preceded by the relevant consultations) for any federally listed SAR that meet the following criteria28:

52 | Species in the Balance: Partnering on tools and incentives to recover species at risk
REPORT | Species in the Balance
1. their range includes P/T land
2. they have been listed for two or more years AND
3. a. they have not been listed under P/T SAR legislation (or cognate wildlife legislation), (and) b. they have not been listed under a P/T recovery strategy (or compelling evidence is provided that their CH has not been fully identified) OR
4. no section 11 (or similar agreements) have been drafted or signed in order to ensure the relevant protections to SAR29
• The federal government should consider making greater use of emergency orders, but only for SAR which are in too dire a situation to benefit from a safety net order. Ideally, emergency orders would be issued sparingly, with signed section 11 agreements and safety net orders taking precedence (in that order), so that the overall number of required emergency orders declines over time as greater numbers of SAR populations approach stabilization and recovery.
5.2 Harnessing economic instruments and incentives to protect and recover species at risk
Economic instruments have the potential to unlock conservation (by the actors needed to engage to protect SAR) at greater scale and to improve overall cost-effectiveness. The right package of economic instruments can help address several of the issues facing SAR recovery mentioned in section 3, including the need for greater cooperation with the provinces to protect SAR and their CH on provincial crown land, and providing incentives to mitigate threats on private land. Our research identified four key areas where economic instruments and related tools are likely to have substantial impact: (1) using offsets to manage SAR on F/P/T crown land; (2) leveraging opportunities to restore degraded landscapes on both public and private land; (3) protecting SAR and their CH on private land; (4) managing non-habitat threats in the landscape. Section 5.2.1 discusses offsets and related measures, while section 5.3 discusses the other recommendations for using economic instruments and related tools to recover SAR.
5.2.1 Using offsets, permits and section 11 conservation agreements to enhance species at risk protection on federal, provincial and territorial crown land
The proposed federal permitting and offset policy
Although the section 11 Conservation Agreement for the Conservation of the Southern Mountain Caribou30 recently drafted between the governments of Canada and British Columbia is a promising first step, ensuring that SAR are effectively protected on F/P/T crown land remains a pressing challenge. Some recent developments on the use of biodiversity offsets – which are explicitly identified and embedded within SARA’s proposed permitting policy - could provide an instructive model for the provinces to emulate. It may also provide greater certainty to project proponents under both SARA and CEAA (2012).

| 53
Biodiversity offsets intend to adhere to a rigorous mitigation hierarchy which mandates avoiding harms to SAR, their residences and CH arising from a proposed project*, followed by mitigating any remaining harms to SAR. Any residual impacts to SAR which cannot be avoided or mitigated are offset through compensation measures such as residence or habitat creation, enhancement or restoration (see Fig. 14)31. Said another way, offsets have an important place in the hierarchy of techniques to mitigate impacts to SAR, but they are less desirable than actual protection of existing habitat and, when used, there is a level of rigour required to ensure that they are protecting SAR. This is reflected in SARA’s proposed permitting policy which, if properly designed and implemented, would significantly advance the use of effective offsets for SAR management by the federal government.
SARA’s proposed permitting policy has the stated goal of ensuring a net gain to SAR32, meaning that the expected recovery benefits from offset measures must be greater than the expected harm to SAR from the project. This is achieved by using a multiplier, which specifies the ratio of compensation (e.g. habitat enhancement or restoration measures) required to achieve a net gain to SAR (Brownlee 2014).
* For simplicity, the rest of this section uses the term “SAR” as a short-hand for individuals, residences and critical habitat.
Figure 14: Mitigation Hierarchy for Offsets
(Source: Brownlee 2014; adapted from the Biodiversity Consultancy, undated)
The proposed policy also allows for the creation of offset credit banks, enabling proponents to develop credits (or purchase them from a third party) for habitat or residence creation, enhancement or restoration measures that were undertaken in advance of the project. This an important and welcome development, since purchasing credits from restoration projects that have already been underway for several years increases the likelihood of successfully ensuring a net gain (or no net
Ne
ga
tiv
eB
iod
ive
rsit
yIm
pa
ct
Po
sto
tiv
eB
iod
ive
rsit
yIm
pa
ct
Projectedimpacts
Avoidedimpacts
Mitgatedimpacts
Net Positiveimpacts

54 | Species in the Balance: Partnering on tools and incentives to recover species at risk
REPORT | Species in the Balance
loss) to SAR (Bekessy et al. 2010). Evidence also suggests that banking increases the flexibility and cost-effectiveness of offset policies by mitigating credit price volatility and potential delays in project development (Perger et al. 2009; Weber et al. 2011). Harmonizing offset policies across federal, provincial and territorial governments, and implications for compliance under the Species at Risk Act and the Canadian Environmental Assessment Act (2012) If sufficiently stringent once finalized, the proposed federal offset policy could provide an important template for the provinces and territories to ensure a net gain (or at least no net loss) to SAR on P/T crown land. Given the importance of effective SAR protection on P/T crown land and the complex interactions between SARA and CEAA (2012)’s project review process, the federal government should consider using the finalized offset policy as a “template” for P/T governments to opt-in to through parallel permitting or offset policies, or through section 11 agreements.
In light of the fact that SAR listed under P/T legislation only partially overlap with those listed under SARA (and not all provinces and territories extend their prohibitions to individuals, residences and CH), over the short term section 11 agreements are likely to be the most effective policy for ensuring that measures for avoiding, mitigating and offsetting harms to SAR on P/T crown land are in place*.
This proposal for advancing P/T offset policies would have a number of advantages. First, a rigorous P/T offset SAR policy could help demonstrate that SAR are being effectively managed on P/T crown land, thereby providing assurances to both P/T governments and proponents whose projects have been triggered by CEAA (2012). It would simultaneously allow the federal government to respect P/T jurisdiction and responsibility, while also enabling the former to approve projects triggered under CEAA (2012) in good conscience (since harms SAR are being avoided, mitigated and compensated).
As a second advantage, biodiversity offsets have the potential for cost-effectively managing SAR’s CH at a landscape scale (e.g. over large tracts of crown land). Evidence from integrated economic-ecological modelling suggests that coarse-scale biodiversity offsets33 for activities from the forestry, oil and gas sectors could minimize biodiversity loss on provincial crown land in the boreal region at reasonable cost relative to business-as-usual (Weber, Hauer, and Farr 2015)34. Finally, this offset policy could avoid potential project delays, as well as potential litigation costs from environmental organizations which might otherwise bring F/P/T governments to court for purported failures to protect SAR on P/T crown land.
A harmonized and rigorous F/P/T offset system - buttressed by section 11 agreements, section 73 permits and P/T permits - may also be appealing to conservation organizations, by providing greater assurances that F/P/T governments are ensuring a net gain (or at least no net loss) to SAR on P/T crown land, and by securing a larger pool of capital for these groups to fund their habitat creation enhancement, conservation and restoration efforts.
* This could be achieved through a conditional section 11 conservation agreement as discussed in section 5.1 – in which the proponent agrees to implement the SAR conservation measures (such as rigorous avoidance, mitigation and offset measures) laid out in the signed agreement, provided that the Crown has approved of the proposed project. The signed agreement would also explicitly state that the proponent’s conditional offer to implement SAR conservation measures does not bind the outcome of the Crown’s review of the project, or its decision whether or not to approve the project.

| 55
Under this proposal, offset credits issued under suitable P/T offset policies and signed section 11 agreements would provide a clear signal that impacts to SAR are being managed for projects triggered under CEAA (2012). However, some flexibility will be necessary to accommodate temporary offsets on provincial crown land, since the Crown (or Minister responsible for developing natural resources) cannot be prohibited from authorizing resource development (both surface and sub-surface) on provincial crown land - at least in some provinces such as Alberta (Adamowicz 2016). Allowing proponents to create, restore or enhance SAR habitat or residences on private land (and secure it through a permanent easement or fee simple acquisition) could be another option for accommodating this issue. Other considerations Despite the potential for offsets to improve SAR conservation outcomes, it bears repeating that the rigour of the system – as acknowledged in the proposed SARA permitting policy - will be critical in determining their effectiveness. Past biodiversity offsets have failed to meet their stated no net loss goals, due to limitations in scientific knowledge on ecological restoration (Maron et al. 2012; Pickett et al. 2016), projects setting habitat multipliers lower than the levels recommended by scientists (Curran, Hellweg, and Beck 2014; Laitila, Moilanen, and Pouzols 2014; Bull, Lloyd and Strange 2016)*, and shortcomings in record-keeping, monitoring and enforcement for compliance and effectiveness (Harper and Quigley 2005; Burgin 2010). It is unclear whether the proposed permitting policy will set the multipliers high enough to ensure that a net gain (or at least no net loss) is attained, and F/P/T governments should consider a broad set of offset design options to ensure that the stated net gain goals are realized**. They should also carefully monitor the outcomes of these offsets in order to learn lessons and take corrective actions.
Measures for reducing various transaction costs associated with market power and ‘lumpy’ purchases also need to be considered – such as where offset and impact sites differ in size, or where the value of an offset site is more attractive as a whole rather than as a set of individual credits. However, recent advances in computer technology provide some promising precedents for setting up efficient offset credit trading platforms (Nemes et al. 2008; Weber et al. 2011).
While biodiversity offsets are not a panacea or a substitute for rigorous adherence to the mitigation hierarchy, and they do not provide any simple answers to the difficult questions on whether and how to trade off benefits from economic development with environmental protection, they can increase the effectiveness of SARA’s permitting system by enhancing the likelihood that projects ensure a net gain to SAR (or at least ensure no net loss arising from the project). However, high-quality monitoring for compliance and for the effectiveness of SAR compensation measures is essential to the success of these programs.
* For instance, Laitila, Moilanen, and Pouzols (2014) note that rigorously ensuring no net loss can easily entail multipliers of ≥12:1. Similarly, Curran, Hellweg, and Beck (2014) found that ensuring no net loss for old-growth forest offsets could lead to multipliers ranging from 20:1-100:1. These multipliers are much higher than those typically prescribed by governments (or undertaken through voluntary offset projects) in Canada and abroad.
** In our commentary on the proposed permitting policy, we identify four broad strategies to reduce the risk of failed offset projects. They are: (1) recognizing that not all types of ecosystems can have their structure, functions or biodiversity fully restored based on current knowledge (e.g. assemblage composition in old growth forests - Curran, Hellweg, and Beck (2014)); (2) allowing for credit banking; (3) using scientifically rigorous, precautionary and consistent multipliers to adjust for time lags and risks of ecosystem restoration failure; (4) threatening to penalize underperforming offset projects (relative to proponents’ predictions) with higher offset multipliers, in order to elicit credible information from project proponents on the effectiveness of their proposed restoration or threat remediation actions. For more information, see Smart Prosperity Institute (2017). Another option could be to require that offset credits only be issued after a predetermined length time (e.g. ≥5 years), although this would dramatically increase policy costs as analyzed in Weber et al. (2011) and Weber, Hauer, and Farr (2015).

56 | Species in the Balance: Partnering on tools and incentives to recover species at risk
REPORT | Species in the Balance
While ecological certification schemes can potentially address some threats to SAR, such as habitat fragmentation, consumptive uses, and access management, very few studies have assessed the field-level impacts of forestry ecological certification schemes on biodiversity (Visseren-Hamakers and Pattberg 2013). Consequently, while they may provide other environmental benefits or mitigate some threats to SAR, the impact of these ecological certification schemes on SAR management or recovery objectives would benefit from rigorous field research.
5.3 Economic instruments and related tools for landscape restoration, species at risk recovery on private land, and addressing non-habitat threats
Box 5: Forestry Ecological Certification and Species at Risk
Since their emergence in the mid-1990s, Canada’s forest industry has been a leader in adopting eco-certification schemes. The total area under certified forestry in Canada is approximately 168 million hectares (Certification Canada 2016a), or 72% of Canada’s managed forest area (NRCAN 2017) and around 43% of the global total for certified forest area (Certification Canada 2016b).
There are three main forest certification schemes operating in Canada: the Canadian Standards Association’s (CSA) Sustainable Forestry label, the Forest Stewardship Council (FSC) and the Sustainable Forestry Initiative (SFI). Although not all schemes require direct certified operators to engage in SAR conservation activities, as a voluntary tool they can still play an indirect role for protecting SAR on provincial crown land (and on private forest lands). For instance, all three standards provide guidelines on managing pesticide use, protecting biodiversity, respecting and protecting reserves and high conservation value forests (Clark and Kozar 2011), protecting water quality, ensuring prompt reforestation, continual improvement, and providing the assurances of third-party audit.
FSC has proposed SAR indicators as part of their first revised draft of their national forestry standard. These indicators would require that forest managers implement management actions or act within their sphere of influence (depending on the context) to minimize harms to SAR from certified forestry operations, including controlling consumptive uses of SAR, collaborating with other organizations to co-manage SAR, aggregating disturbances, maintaining core areas, and safeguarding connectivity by limiting linear disturbances (Wedeles et al. 2014).
The second draft of the FSC Canada Forest Management Standard outlines a dedicated indicator for woodland caribou (Rangifer tarandus caribou), with three methods for achieving compliance (one of which is implementing a range plan consistent with the federal recovery strategy). The management requirements for the indicator were informed by an expert science panel and were devised to be consistent with the management and recovery actions outlined in the federal recovery strategy (Wedeles et al. 2014). The FSC is currently testing these indicators to inform the final version of the standard and consultation process.
The SFI standard has been in place in Canada since 1999 and over 89 million hectares are currently certified under the scheme, corresponding to the most certified forest area in Canada. The SFI Forest Management standard is systematically revised every 5 years, with SFI launching the SFI 2015-2019 Standards and Rules in January 2015. The Forest Management Standard offers a systems approach to SAR to ensure that a variety of SAR can be managed in different ecosystems across Canada. SAR management relies heavily on stand (e.g., presence of coarse woody debris and snag trees) and landscape scale forest management (e.g., ensuring a spatial distribution of forest types and age classes) as well as other conservation and protection strategies (e.g., riparian zones for water quality). Seven of the 15 SFI Forest Management Objectives contribute directly to SAR management, and these objectives have 18 on-the-ground indicators that support species at risk management. The SFI Forest Management standard also has a stand-alone objective on the Conservation of Biological Diversity – along with 15 on-the-ground indicators, including indicators related to stand and landscape level management, forest cover types, inclusion of high level conservation plans, and addressing invasive species. The requirement for inclusion of high level conservation plans ensures that Program Participants (users of the SFI standards) will meaningfully contribute to these plans.
The SFI Forest Management standard is unique in the world in requiring research as one of its objectives — with funding frequently directed toward SAR management. SFI is also unique in requiring training for harvesting professionals — SFI’s Implementation Committees contribute to this training. Across Canada this training frequently includes species at risk. SFI is also unique in having a conservation grants partnerships program to further support its research and outreach objectives. Since 2010 the grants program has contributed to SAR training in British Columbia, and conservation projects for species such as bats, grizzly bears and boreal caribou. To date, the SFI Conservation partnership grants program has significantly contributed to boreal caribou research that has informed caribou nutrition needs for promoting calf survival, helped prioritize caribou habitat restoration objectives in Alberta, and informed land managers about overlaps in caribou and grizzly bear habitat needs.
The CSA Sustainable Forest Management Standard is Canada’s National Standard, approved by the Standards Council of Canada in 1996 when first published and again following a revised Standard in 2002. The CSA Standard was developed by a multi-disciplinary technical committee through extensive input from the Canadian public at large. This Standard includes a continual improvement approach based on ISO 14001, requires a rigorous public participation process, as well as practical demonstration of sustainable forest management practices based on internationally recognized sustainable forest management criteria. CSA’s Standard for sustainable forest management is the standard that gives the community a voice in the way their forests are managed. The CSA standard considers a breath of topics concerning SAR which include conserving ecosystem diversity, conserving species diversity, conserving genetic diversity, respecting protected areas and identifying sites of special biological significance within the defined forest area. It also includes implementing management strategies appropriate to the long-term maintenance of the defined forest area, conserving ecosystem resilience, and conserving forest ecosystem productivity and productive capacity.

| 57
5.3 Using economic instruments and related tools for landscape restoration, species at risk recovery on private land, and addressing non-habitat threats 5.3.1 Restoring large-scale landscapes on public and private landAnother major opportunity lies in using economic instruments and other tools to restore large scale landscapes on both private and public lands. Over the past several decades, Canada has seen significant SAR habitat loss arising from land-use changes. To give one notable example, rehabilitating roads and seismic lines in the boreal forest is essential for stabilizing woodland caribou populations, and it will cost hundreds of millions of dollars over the next several decades (Schneider et al. 2010)35.
These challenges suggest that policymakers need to direct their energy towards restoring large landscapes and achieving net conservation gains. Possibilities to consider include:
• Intensive habitat restoration efforts by governments and industry, possibly financed through green bonds (see box 11 in section 5.8 for more on green bonds).
• Habitat restoration programs modelled on Ducks Unlimited Canada’s revolving land purchase program may provide a viable approach for private land (see box 6 below).
• Third-party SAR habitat banking with an aim to ensuring net gains in habitat (as mentioned in the previous section).
• In order to prevent future loss of SAR habitat and landscape degradation, policymakers could also consider making industry responsible for restoring all lands impacted by their operations as part of their remediation obligations.
For jurisdictions considering conservation offset programs which cover a broader set of environmental benefits (not limited to SAR habitat) – such as Alberta under its Land Stewardship Act – enabling proponents to “trade up” for SAR habitat could be an attractive option. This could be done by rewarding proponents with lower mitigation ratios if they opt to restore or enhance SAR habitat, or by explicitly targeting SAR habitat (or potential habitat) for habitat creation, enhancement or restoration*. Integrated economic-ecological modelling suggests that with the appropriate flexibility measures in place, additional costs from targeting offset measures towards priority habitats and/or ecosystems are manageable (Habib et al. 2013).
* However, care still needs to be taken to safeguard overall biodiversity and ensure that common species stay common.

58 | Species in the Balance: Partnering on tools and incentives to recover species at risk
REPORT | Species in the Balance
Box 6: Ducks Unlimited Canada’s Revolving Land Purchase Program
Ducks Unlimited Canada’s (DUC) revolving land purchase program acquires properties containing degraded or converted wetlands, which the program subsequently restores and secures through a permanent conservation easement. The land is then sold to agricultural landowners and the public through an online auction. The program was developed by Ducks Unlimited Canada as a tool for restoring and permanently easing wetlands, with the hope that it would be more cost-effective than a continued series of renewable easements. Preliminary financial analysis suggests that revolving funds are most likely to be cost-effective if proponents are able to access low-interest finance for purchasing the property, and if the land is rented to farmers during the restoration phase. Under other conditions, temporary easements or permanent easements secured through more conventional means may be more cost-effective. Although decisions about whether to pursue the revolving land purchase strategy need to be made on a case-by-case basis, the program provides an important model for land restoration and should be considered in every conservation policymaker’s toolkit. Adapted from Noga and Adamowicz (2014); Ducks Unlimited Canada (2016)
5.3.2 Focus on incentivizing species at risk conservation on private lands
Private landowners need additional incentives to protect SAR. Federal and provincial governments and conservation organizations are already using several tools and programs to protect private land with significant conservation value (including SAR habitat), such as payment for environmental service schemes and conservation easements – including easements donated under the Ecological Gifts Program, and easements acquired by land trusts such as the Natural Areas Conservation Program36.
Experience with these tools and programs in other conservation contexts suggest that they have the potential to cost-effectively protect and recover SAR on private land (e.g. Whitten, Wunsher, and Shogren 2017), although policy makers are still making limited use of these tools and programs. Many of these tools and programs are leveraging a mix of public and private funds, and this model could be expanded for further impact.
While the potential to learn from these programs and scale them up to enable SAR recovery on private land is considerable – and likely highly recommended - important gaps in our understanding of their effectiveness for SAR recovery remain. To a certain extent this is understandable, since these programs and tools were designed to serve broader conservation objectives, and many of the programs have lacked data collection and tracking that would allow a proper assessment of their outcomes. This speaks to the need for improved program design to encourage monitoring and data collection on their effectiveness (see box 8 for discussion).
This section summarizes current knowledge of how these tools and programs have been implemented to date in Canada and other jurisdictions, discusses the existing findings on their effectiveness, and highlights some considerations for better tailoring these tools to recover SAR.
Our overarching recommendation is for the federal government to consider outlining clear criteria which, if satisfied, would allow landowners adopting economic instruments to easily “opt-in” to section 11 agreements. These agreements would require signatories to specify the SAR found on the land subject to the agreement, along with relevant SAR protection measures and their anticipated effects.

| 59
• Conservation easements (or covenants or servitudes)* are voluntary legal agreements between a landowner and the easement holder (which may be a government or a conservation organization), in which the landowner commits to using the land in ways agreed to in the easement (such as wildlife habitat protection) while retaining formal ownership rights (Atkins, Hillyer and Kwasniak 2004). Easements can be purchased, donated, or a combination of the two (selling the easement for less than its fair market value, commonly referred to as “split receipting” (Good and Michalsky 2008)). They are a widely used tool for protecting or restoring land with significant conservation value, and could be harnessed to further benefit SAR. Easements have also been shown to be a sound conservation policy tool in many contexts. Modelling studies have found that $100 million in targeted easements could reduce potential future losses of sage grouse on farmland in several mid-western and northwestern U.S. states by around 80%, resulting in only 1% of the population still threatened by cropland expansion (Smith et al. 2011). Another study concluded that spatially targeted conservation easements in tandem with core area management can reduce sage grouse loss more effectively than exclusively relying on the latter (Copeland et al. 2013). And a Manitoba study found that land with high suitability for waterfowl habitat was more likely to be targeted for easements (Lawley and Towe 2014). Other studies in the United States and the Canadian prairies suggest that agricultural easements generally target habitats that are at higher risk of conversion or intensification, rather than economically marginal farmland (Fishburn et al. 2009; Lawley and Towe 2014). Easements also appear to scale more cost-effectively over large landscapes (Mallon, Cutlac, and Weber 2016).
There are several methods for setting the price of easements, each with their own strengths and weaknesses. Reverse auctions are a tool which can potentially drive down the costs of purchasing easements (see Box 7). However, reverse auctions tend to have high transactions costs compared to other approaches such as fixed payments. If these transactions costs are too high they can discourage participation, which may undermine their cost-saving potential.
For instance, Palm-Forster et al. (2016) built a behavioural model using data from an actual reverse auction in Ohio to examine the impact of transaction costs on reverse auction participation. They found that if transaction costs are too high, then it is more effective to use targeted fixed payment schemes, where participants are paid at a fixed rate when their land meets specific spatial or ecological criteria. Determining which schemes – uniform fixed payment, targeted fixed payment, reverse auctions, or other approaches - work best under which circumstances is an important area where further piloting and experimentation is needed.
* For simplicity, we will refer to all three instruments as “easements” in this document.

60 | Species in the Balance: Partnering on tools and incentives to recover species at risk
REPORT | Species in the Balance
Box 7: Reverse Auctions for Conservation Easements in the Canadian Prairies
A field experiment using reverse auctions to target landowners for perpetual conservation easements in wetlands and grasslands was conducted in Alberta, Manitoba and Saskatchewan on behalf of Ducks Unlimited Canada. Reverse auctions enable project proponents to specify the level of an environmental good or service that they are looking to secure, and then encourage private landowners to submit their bids for providing these services. Having landowners compete to provide the service incentivizes them to reveal their opportunity costs for conserving habitat or ecologically sensitive areas – information which is essential to maximize the cost-effectiveness of the easement program, but which is inaccessible to the conservation organization or the regulator. Participants’ bids were graded according to their share of the fair market value of the land, and the auction administrators also announced that they would use a reserve price to grade bids (this reserve price was concealed from participants). The auction enabled the authors to construct a supply curve for conservation easements, and this analytical approach enabled Ducks Unlimited Canada to reap considerable cost savings compared to a fixed price scheme for acquiring easements. Ducks Unlimited Canada subsequently used this methodology to set maximum bid values for their easement program. At the time of Brown et al.’s publication, this had helped Ducks Unlimited Canada increase the number of easements acquired each year by a factor of ten, leading to a total of approximately 1 million hectares of conserved habitat. Adapted from Brown et al. (2011)
Although conservation easements appear to be a promising instrument for conserving SAR, the information required to rigorously evaluate their conservation impacts – such as their contribution to SAR habitat protection objectives – are not always part of the required documentation for submitting the easement to P/T registries. Documentation for most easements include general administrative information on the land parcel, a general statement of the conservation intent of the easement, the date at which the easement was signed, the fair market value of the land, and so on (Atkins, Hillyer and Kwasniak 2004).
Another issue lies in the fact that conservation easements are confidential documents – meaning that it is always not possible for third parties to access data on the value of the purchased or donated easement, which is essential to assessing their cost-effectiveness. While several of the case studies above suggest that easements have significant potential for cost-effectively recovering SAR, improving access to data on the value of purchased and donated easements is essential for systematically assessing their conservation benefits per dollar spent.
In light of these issues, it would be advisable for policymakers and land trusts to require that all easements signed for the purpose of SAR conservation contain documentation on the relevant conservation benefits secured by the easement. More specifically, the easement should specify (i) the SAR present on the property (or which are likely to be present, or have the potential to be present); (ii) the easement restrictions that will be implemented; as well as (iii) a clear demonstration that these restrictions will enhance the quality or quantity of available habitat or mitigate other threats to the relevant SAR.
Policymakers should also consider making those elements of easement documents which are relevant to SAR conservation accessible to scientists and evaluators. They should also require that, at a minimum, landowners grant permission for the easement holder to undertake compliance monitoring, and ideally follow-up monitoring as well. Given that landowners must register the easement to take advantage of tax breaks for their donation (e.g. under the Ecological Gifts Program and related programs), policymakers have a clear rationale for requiring the registration document to explicitly outline the SAR conservation benefits (and other ecological benefits)

| 61
provided by the easement. Policymakers and land trusts should also make data on the economic value of the purchased or donated easements available to researchers37. Further scaling up the use of easements for SAR conservation will require creativity and ingenuity, since several sources have mentioned that land-holders in some regions are reluctant to further adopt permanent conservation easements (Good and Michalsky 2008)38. Increasing easement adoption for SAR conservation will likely require an adroit combination of approaches which: (i) harness farmers’ pro-conservation attitudes and social norms39; (ii) increase payments for land containing SAR habitat (including bonuses for groups of landowners providing agglomerations of habitat); (iii) use flexible mechanisms for lowering implementation costs (such as revolving land funds or reverse auctions, where appropriate). Policymakers could also further pilot the use of temporary easements, as the South of the Divide Conservation Action Program, Inc. is doing (SODCAP, Inc. undated). Conservation easements can also impose significant transaction and monitoring costs for budget-constrained land trusts. These have ranged from several thousand dollars to tens of thousands of dollars per project (Good and Michalsky 2008). However, it’s quite possible that these projects also provide commensurate conservation benefits. Some land trusts have also created specific endowment funds to help deal with these monitoring costs (Good and Michalsky 2008). Governments could also consider providing land trusts with financial support for monitoring costs incurred by easements that meet certain environmental quality thresholds (including for SAR habitat).
• Payment for environmental service (PES) schemes are a potential policy instrument for recovering SAR which are currently are being piloted by the Alternative Land Use Services Program (McCracken et al. 2014). PES schemes warrant further study and piloting, especially since some landowners might be more willing to adopt PES schemes than permanent conservation easements. Potential applications include rewards for protecting and enhancing SAR habitat or their residences on private land, or for remediating non-habitat related threats to SAR (see section 5.3.3 for discussion). Although PES schemes have become increasingly popular in recent decades, their impacts on biodiversity generally and SAR in particular are less well understood.
A review of studies from Europe suggest that PES schemes are most effective for biodiversity conservation when they explicitly target and tailor their prescribed management actions to SAR and their biological needs. By contrast, PES schemes prescribing broad-based management practices often fail to help rare or imperilled species (Kleijn et al. 2006; Batary et al. 2015) and frequently benefit common species instead (Reid, McDonald, and Montgomery 2007). Consequently, PES schemes for recovering SAR are more likely to be successful if they are based on priority recovery actions identified in recovery strategies and action plans. The SARFIP and the HSP – along with their provincial cognates, and related programs under F/P agricultural policy frameworks - are natural vehicles for piloting such an approach to PES schemes. However, these schemes are likely to be more effective if landowners are eligible to be compensated for their opportunity costs from measures such as taking land out of production, or reducing agricultural intensification – which would require changing some of the eligibility criteria under the SARFIP and HSP programs (see section 5.5 for discussion).
Further scaling up the use of easements for species at risk conservation will require creativity and ingenuity.
62 | Species in the Balance: Partnering on tools and incentives to recover species at risk
REPORT | Species in the Balance
On the other hand, Mallon, Cutlac, and Weber (2016) suggests that PES may be an effective means for managing SAR on smaller parcels of private land. They found that PES schemes are generally more cost-effective for managing ecosystem services on smaller parcels of land (approximately 3 acres) than easements or fee simple acquisition, but the marginal costs for managing additional land increases more rapidly under PES schemes than under easements. However, PES remained more cost-effective than outright purchase for both large and small projects (Mallon, Cutlac, and Weber 2016). As with conservation easements, when setting the payment mechanism (e.g. uniform payment versus reverse auction), policymakers will need to carefully analyze trade-offs between maximizing cost-effectiveness and increasing program participation (Palm-Forster et al. 2016).
• The Ecological Gifts Program (EGP) enables any individual or corporation to donate land, or an eligible right or interest in the land (e.g. conservation easement, covenant or real servitude) to a qualified recipient that has been certified by the Minister of Environment and Climate Change or a delegated certification authority (Canadian Wildlife Service 2011). The value of the eco-gift is assessed in terms of the fair market value of the donated land. The EGP has spurred a significant volume of donations over the program’s lifetime – from 1995 to October 31, 2016, the EGP has received 1260 eco-gifts across Canada. These lands have been valued at more than $807 million and protect over 180,000 hectares of wildlife habitat (Government of Canada 2017c), including habitat for at least sixteen SAR (ECCC 2016b)40. Although these trends appear to be encouraging, to our knowledge there has been no formal assessment of the EGP’s (or similar programs in other jurisdictions) conservation effectiveness or cost-effectiveness, although a recent theoretical study sheds some light on the latter issue. Vercammen (2017) uses a mathematical model to assess the social welfare implications of tax credits for conservation easements (which are similar to the EGP). The analysis raises three important questions on their overall cost-effectiveness, some of which are relevant for SAR conservation.
◦ First, tax credits appear to be least effective in securing land with high environmental values, since land trusts will probably attempt to pay for most (or all) of the easement, which lowers the ‘gifted’ portion of the easement (the difference between the assessed value of the easement and the actual price paid for it by the land trust).
◦ Second, local land trusts have considerable market power in setting offer prices for easements. This means that increasing the easement tax credit might actually discourage easement donations if the decreased offer price from the land trust more than offsets the value of the increased tax credit.
◦ Third, easement tax credits could lead to undesirable outcomes in which the tax credit incentivizes landowners to donate land with a high market value - but relatively low environmental value - to land trusts, at the public’s expense.

| 63
However, Vercammen (2017) notes several factors which mitigate these concerns. First, he concedes that it is probably unrealistic to assume that land trusts exercise all of the bargaining power when making an offer to purchase easements from landowners. Second, Vercammen (2017) also notes that some of these problems could be ameliorated through better landowner targeting, or by requiring land donated for easements to pass some basic threshold for environmental quality.
Certain key pieces of information for assessing the cost-effectiveness of EGP tax credits for SAR conservation are also missing. To some extent this includes the ecological value of the possible SAR habitat donated through the easement, as discussed previously. Equally significantly, data on the value of individual land donations are confidential and are not shared with the research community. Making data on the value of EGP donations accessible to researchers in a manner that respects confidentiality concerns is an essential next step for the federal government if it wishes to make informed decisions on how to spend scarce public funds for conservation, be it for SAR conservation or other environmental benefits.
Formally reviewing the EGP in light of the considerations mentioned above should be an important priority for policymakers41. A program review also provides an opportunity to further leverage the EGP in a way that enhances SAR recovery. For instance, policymakers could consider introducing additional regional criteria for all provinces to render land containing SAR residences or CH eligible in the program. This, combined with improved documentation on the potential SAR conservation values of the donated land, could go some way towards satisfying the basic threshold for environmental quality mentioned previously. The federal government could also consider providing a premium tax incentive for donated lands known to contain SAR or their CH42.
• The Natural Areas Conservation Program also contributes to SAR conservation objectives. The Program was established in 2007 as a public-private partnership between the federal government, the Nature Conservancy of Canada, and other ENGO partners, with the stated goal of protecting ecologically sensitive lands at risk, focusing on southern Canada. From the years 2007-2016, the federal government has contributed $277.5 million to the program, and the program has leveraged an additional $500 million from provincial governments, industry and philanthropic partners. These funds have enabled them to acquire 418,000 hectares of land, including habitat for 181 imperilled species43 (Nature Conservancy of Canada 2016).
While any assessment of the effectiveness of the Natural Areas Conservation Program’s role in SAR conservation needs to keep in mind its broader conservation mandate, attempting to map and quantify the overall hectarage of SAR habitat conserved under the program, and tracking the SAR-related restrictions associated with the easements or purchased properties, are important next steps for advancing the program’s SAR conservation goals. The constraints against assessing the economic value of the land donated under easement or fee simple purchase – as well as the recommended solutions - are likely to be similar to those mentioned for the EGP.
The Natural Areas Conservation Program has leveraged $500 million in funding and acquired 418,000 hectares of land, including habitat for 181 imperilled species.

64 | Species in the Balance: Partnering on tools and incentives to recover species at risk
REPORT | Species in the Balance
Box 8: SAR conservation on private land – learning by doing
In the absence of increased stewardship on private land, more and more species are likely to become extinct, extirpated, and endangered. The opportunity to harness economic instruments to manage and recover SAR on these lands - along with the knowledge gaps on the effectiveness of these measures - highlights the need for improved data collection.
But SAR recovery cannot afford to be put on hold until better data arrives. F/P/T governments need to strike a balance by establishing thresholds for proof of effectiveness which economic instruments (and the threat mitigation and recovery actions they incentivize) must satisfy if they are to be promoted through section 11 agreements and stewardship programs. This being said, while adherence to the precautionary principle is advisable as a general rule, policymakers should be willing to take calculated risks when promoting SAR conservation measures on private land. Some initial leeway should be granted in the face of uncertainty, provided that appropriately robust monitoring, enforcement, compliance and impact assessment measures are in place. This would enable governments and conservation organizations to treat these interventions like scientific experiments, in order to obtain additional information on the effectiveness of these instruments.
Ideally, any assessment of an economic instrument’s effectiveness for SAR recovery should identify its impacts on SAR abundance and distribution, the costs associated with using the instrument, as well as a counterfactual – either in the form of a control group, or a baseline rate of threats to SAR such as land use conversion and loss (Newburn et al. 2005) – in order to ensure that they are not rewarding landowners for actions they would have taken anyways. These thresholds for proof effectiveness could then be fine-tuned over time as more information on the efficacy of these measures (or lack thereof) for recovering SAR becomes available. The upshot of this approach is that policy makers will need to operate with a broader understanding of success when intervening to recover SAR on private land. While recovering SAR remains the ultimate goal, policymakers should adopt an experimental attitude which recognizes that unsuccessful interventions are not necessarily ‘failures’, if appropriate processes are in place to learn from past efforts.
For example, if follow-up monitoring demonstrates that a certain project funded under the HSP is unsuccessful, policymakers should still consider the effort a success if it has provided rigorous and credible information for informing future decision-making. Put differently, when recovering SAR on private land, the real failure consists of: (1) refusing to fund potentially promising intervention - or promising section 11 agreements - due to risk aversion (since the status quo will likely lead to further SAR loss); (2) not collecting the appropriate data for assessing the effectiveness of these interventions, in order to improve subsequent policies and programs.
5.3.3 Remediating non-habitat threats to species at risk (pollution, invasive or problematic species, etc.)
So far our discussion of the role of economic instruments in SAR protection and recovery has focused on habitat protection. However, as we saw in sections 2 and 4, point and nonpoint source pollution, invasive and problematic species and biological resource use are also important drivers of SAR loss, and effective measures to mitigate or compensate for these threats to SAR can produce substantial conservation dividends. Economic instruments can also play an important role in addressing these non-habitat related threats.
The role of economic instruments in addressing point and nonpoint sources of pollution is well known – this section discusses water pollutants since they are a common source of pollution harming SAR. Further research and pilot studies on using economic instruments (and other measures) to address invasive and problematic species should be a key priority for governments, conservation organizations and academics.

| 65
Nonpoint source pollution – the role of agriculture Agriculture is an important contributor to nonpoint source pollution (Prugh et al. 2010). Designing policies to effectively manage agricultural pollution is notoriously difficult, since its impacts vary across time and space, and according to different weather conditions (Lichtenberg 2004). This makes it a poor candidate for managing through regulation, but a very good candidate for managing through economic instruments.
For instance, imposing levies on pesticides to internalize the environmental damages they impose on watersheds is a relatively straightforward solution to the problem of excessive pesticide use. Although these damages vary across watersheds, implementing differential pesticide levies in various districts or watersheds might be administratively feasible, since the United States Environmental Protection Agency already implements regionally differentiated regulations for pesticide use (Lichtenberg 2004). The collected fees then could be rebated back to farmers – either prorated to the value of agricultural output, or as a lump sum payment - in order to help compensate for the costs of the policy, while still providing an incentive to reduce input use (Adamowicz and Olewiler 2016).
The case of nutrient runoff and leaching from fertilizers poses different challenges, since the damages strongly depend on soil, weather and other conditions (such as slope) and farmers can find ways to ‘work around’ more stringent fertilizer pricing schemes (Lichtenberg 2004). This suggests that it might be more helpful to address the lion’s share of nutrient runoff and leaching by compensating farmers for nutrient management BMPs in key watersheds. These BMPs (e.g. installing riparian buffer strips) could be promoted through a cost-sharing model, or through targeted payment for environmental service schemes (Lankoski, Lichtenberg, and Ollikainen 2008)44. Another option could be to encourage farmers to reduce their fertilizer use by providing insurance against possible yield decreases (Kenny, Elgie and Sawyer 2011). However, funding additional nutrient BMP schemes for the purpose of SAR recovery would likely require significant F/P/T program funding. At a minimum, they would require a significant reallocation of ECCC’s departmental expenditures on e.g. SAR recovery actions and the SARFIP. Leveraging funding for nutrient management BMPs which are promoted through F/P/T agricultural policy frameworks is another avenue worth exploring.
Introducing a modest levy on fertilizers could be an alternative strategy for funding these stewardship schemes (c.f. Helm 2001), which would have the added benefit of ensuring a slight reduction in fertilizer use. For provinces or territories which do not have deposit return schemes for plastic drink bottles (such as Ontario), another possibility for funding such a BMP program could be through a deposit return scheme for these bottles, where the proceeds from the unclaimed deposits would be dedicated to promoting farm stewardship (Environmental Defence Canada 2017).
If policymakers see new fees or expenditure programs as too politically costly, then yet another option could be to promote environmental cross-compliance schemes - where existing agricultural support expenditures are made dependent upon adopting BMPs (Eagle, Rude and Boxall 2016; Adamowicz and Olewiler 2016). Given that Canadian agricultural households have incomes close to the urban and rural averages - partly as a consequence of Canada’s agricultural support policies (Eagle, Rude and Boxall 2016) – some might argue that this is a reasonable demand to be made of farmers. Regardless of which approach is taken, balancing policy costs, program effectiveness and acceptability to the agricultural community will be essential.
Addressing point and nonpoint source pollution, invasive and problematic species, and biological resource use can produce substantial conservation dividends.

66 | Species in the Balance: Partnering on tools and incentives to recover species at risk
REPORT | Species in the Balance
Addressing point source pollution remains an important priority A high proportion of SAR are also threatened by point source pollution stemming from industry activities such as manufacturing and construction (Prugh et al. 2010). This could be addressed through a system of taxes and levies. Another potentially attractive option for larger watersheds would be to implement a system of tradeable water quality permits, in which a cap is set on point source pollution emissions (corresponding to the total number of permits)45, along with the requirement that firms must purchase any additional permits from other emitters (Field and Olewiler 2003; Lankoski, Lichtenberg, and Ollikainen 2008).
With a few modifications, these schemes could be extended to cover both point and nonpoint source emitters. Alternatively, one could design the program so that only point source emitters are regulated, while allowing them to meet their compliance obligations by purchasing nutrient abatement ‘offsets’ from landowners and other nonpoint pollution sources.
Including nonpoint source emitters in a water quality trading scheme would have the twin merits of lowering overall abatement costs (by providing point source emitters with the lower-cost option of paying landowners to reduce nonpoint source pollution), and providing financial incentives for landowners to reduce their nonpoint source pollution (Lankoski, Lichtenberg, and Ollikainen et al. 2008; Fisher-Vanden and Olmstead 2013). But there are important distributional impacts to consider –choices on which pollution sources to cover under the scheme and how the permits are allocated will determine which groups (e.g. landowners, municipalities, industry) are net beneficiaries from the scheme (Lankoski, Lichtenberg, and Ollikainen 2008).
5.4 Making strategic use of place-based (multispecies and ecosystem) approaches to recovery strategies and action plans
Place-based (multispecies and ecosystem) approaches are more likely to be biologically effective and cost-effective in recovering SAR if they meet certain key requirements, such as shared threats and recommended recovery actions (Clark and Harvey 2002; Evans, Possingham, and Wilson 2011; Auerbach, Tulloch and Possingham 2014) and shared habitat associations (Poos, Mandrak, and McLaughlin 2008). They also require adequate resources in order to ensure that each species’ unique biological and ecological requirements are taken into account. While stakeholders generally wished to see greater use of place-based approaches, there was no strong consensus among them on which stage of the SARA process – COSEWIC assessment, recovery strategy, or action plan – should these approaches be used more frequently. While far from a silver bullet, there is considerable scope for strategically using place-based approaches, which may improve the efficiency and effectiveness of SAR recovery planning and action planning.
This being said, the performance of place-based approaches in actual practice has been mixed – possibly because existing plans and strategies are not always designed and implemented in line with the above recommendations. For instance, within the United States, single-species recovery strategies were several times more likely to improve recovery outcomes relative to multispecies plans (Boersma et al. 2001; Clark and Harvey 2002; Taylor, Suckling, and Rachlinski 2005). However, this may simply be a result of selection bias - in other words, it’s possible that species at greater risk of extinction are simply more likely to be included in multispecies recovery strategies (Schwartz 2008). U.S. multispecies recovery strategies were also less likely to contain information on species’ specific biology and were revised less frequently compared

| 67
to single-species plans (Clark and Harvey 2002; Moore and Wooler 2004). Canadian multispecies recovery strategies were also less likely to identify species’ CH (Brassard 2014)46. Langpap and Kerkvliet (2012) quantify the incremental recovery benefits of multispecies habitat conservation plans, and found that they generally lead to very small improvements in recovery status47. In Australia, Moore and Wooler (2004) found that single-species and multispecies plans were approximately equivalent in terms of improvements to species’ status; however, species close to extinction showed more improved statuses under single-species plans. Moore and Wooler (2004) also recommended single-species plans if habitat requirements (especially CH) are the focus of recovery planning.
We previously discussed how the current structure of the SARA process (including listing delays) makes it difficult to undertake multispecies recovery strategies. In light of this fact, the bulk of recovery strategies should probably continue operating on a single-species basis, with place-based approaches instead being used for action plans. This two-step approach makes sense for a number of reasons:
• It would ensure that adequate resources are devoted to identifying species’ unique needs during the recovery strategy process – which should be done regardless since recovery strategies are mandated under SARA to be scientifically rigorous documents.
• The area-based approaches of many action plans make them more amenable to multispecies and ecosystem approaches, since they provide a natural boundary for identifying overlapping CH or habitat associations for multiple SAR.
Finally, given that priority recovery actions are identified and costed at the action planning stage, this is the stage where it is most important to identify trade-offs, complementarities and synergies between various SAR threat remediation and recovery actions (see text Box. 9 for discussion).
Box 10: The need for a prioritized approach to action Box
Box 9: The need for a prioritized approach to action planning
Using a rigorous decision support framework is essential for prioritizing recovery actions in the action planning process, especially for multispecies and ecosystem-based plans. The framework should include key variables such as the expected benefits and costs of recovery actions for all relevant SAR, the likelihood of stakeholders adopting the recommended management actions, the probability of project failure, as well as the time lag before benefits accrue (Pannell and Gibson 2016; c.f. Auerbach, Tulloch and Possingham 2014). Choosing the right variables for analyzing conservation decisions is important, since the foregone benefits from omitting key variables such as costs can be very large (Pannell and Gibson 2016; Auerbach, Tulloch and Possingham 2014). For instance, Pannell and Gibson (2016) found that omitting cost information from a decision support framework reduced overall benefits from chosen projects by up to 35%48.
Nevertheless, there may still be some strategic opportunities for bundling multiple SAR into recovery strategies. First, place-based approaches make good sense for Parks Canada, since they are usually already managing for multiple species within park or protected area boundaries, and managing these places for a broader set of ecological (and often recreational) outcomes. Another possible approach could be for COSEWIC to strategically assess groups of SAR with shared threats and ranges during the same assessment period, in order to make it easier for them to be “bundled” in a single recovery strategy (since they would all have been listed at the

68 | Species in the Balance: Partnering on tools and incentives to recover species at risk
REPORT | Species in the Balance
same time). However, some stakeholders have argued that COSEWIC already makes efforts to do this, and that the delays in listing species under SARA remain the major impediment to multispecies recovery planning. Second, governments should consider piloting approaches wherein poorly understood SAR are bundled into multispecies and ecosystem-based recovery strategies, alongside other taxonomically similar species and/or species with overlapping threats and recovery actions. The United States already uses this approach for threatened but poorly understood species (Leonard 2003; Evans et al. 2016), and it would help ensure that imperfect scientific understanding of these species does not lead to further delays in recovering them. While this strategy carries the risk of implementing ineffective or unintentionally harmful actions to recover poorly understood SAR, the risk cuts both ways insofar as additional delays could lead these SAR populations to decline further.
Adopting this approach to multispecies and ecosystem-based planning requires adaptive management, in which decisions to retain poorly understood SAR in multispecies recovery strategies are revisited once additional schedules of studies have been completed by COSEWIC, or when the recovery strategy is updated every five years. If at a later date a poorly understood SAR which is currently “bundled” into a multispecies or ecosystem-based recovery strategy is discovered to have either highly unique habitat requirements or a highly dissimilar threat profile then, where appropriate, this species can be removed from the multispecies plan and have its own uniquely tailored single-species plan to reflect these new developments.
5.5 Making species at risk stewardship programs more directed, flexible and incentive-based
Many of our stakeholders emphasized the importance of the Habitat Stewardship Program and other funding programs, since these are the key vehicles through which governments advance SAR conservation on the ground and in the water. From 2000-2013, the HSP managed to secure49 approximately 1800 square kilometres of private land, which may benefit as many as 603 species assessed by COSEWIC as endangered, threatened or of special concern (Government of Canada 2017d). The stewardship programs also have a strong track record in leveraging additional funds for SAR conservation, with the Habitat Stewardship Program and the Aboriginal Fund for Species at Risk leveraging a combined average of $27 million per year for fiscal years 2008-2009 to 2011-2012 (OAG CESD 2013).
However, our stakeholders also identified several key areas for improving SARA stewardship programs such as the Habitat Stewardship Program and the Species at Risk Farm Incentive Program. These mostly consist of operational and policy changes that could be implemented in the short-to-medium term.
• The first major suggestion was for more timely and flexible grant approvals from ECCC, such as the ability to disburse funds in the middle of the year in addition to the end of the fiscal year. Interviewees noted that this flexibility would provide proponents with earlier access to funding, making it easier for them to undertake time-sensitive inventorying and monitoring activities. Greater flexibility on the reporting end dates for the program would also be helpful.

| 69
• A number of government interviewees noted that it would be strategic to complement the smaller-scale, project-based interventions with longer-term programmatic interventions which address key threats to SAR at a landscape or watershed-scale. This could allow for a more integrated approach to conservation on private and public land in key places and regions, which will be important as more SAR approach the action planning stage.
• Similarly, stakeholders saw value in extending the length of grants funded by the program to five years or longer. While project-based interventions still have an important role to play in recovering SAR, allowing more long-term grants could be very beneficial for the programmatic interventions mentioned above.
• Another major recommendation endorsed by several knowledgeable stakeholders was the need to complement the current system of open-application based grants with more directed grants. In particular, these directed grants would contribute to implementing finalized action plans, or addressing high priority threats, species or regions. Some prioritization is already in place for stewardship programs, since the HSP explicitly prioritizes species listed under schedule 1 of SARA (Government of Canada 2017d) and prioritizes projects which implement priority recovery actions (as identified in recovery strategies or actions plans) or ecosystem-based approaches (ECCC 2017b), and the SARFIP provides a list of management practices eligible for funding under the program. But allowing these programs further flexibility in specifying key species, taxa or landscapes for intervention could also be strategic in some cases. For instance, it would be helpful to enable F/P/T governments to issue calls for applications to implement priority recovery actions, or programs for specific species or landscapes with high risk of SAR loss. In certain cases, bilateral contracts with proven partners could also be considered, although this would need to be a rigorous and transparent process, in which governments provide evidence that other organizations or researchers were unable to implement the relevant project.
• Based on the literature review of the economics of extension and cost-share projects, the HSP and related stewardship programs should also reconsider their policy of not compensating participating landowners for the opportunity costs of their conservation actions (at least for the programmatic interventions outlined in the previous paragraph). Stewardship programs commonly provide payments to landowners through cost-sharing activities, but these usually only cover relevant implementation and construction costs (e.g. ECCC 2017b; Ontario Soil and Crop Improvement Association (OSCIA) 2017; OSCIA 2018).50, rather than opportunity costs from measures such as taking land out of production. This should be reconsidered, since there are limits to relying exclusively on social norms, voluntary actions and modest payments to conserve and recover SAR*.
* However, this could lead to much higher project and program costs (but with a potential for correspondingly high SAR recovery benefits). This once again highlights the need for more funding and/or new funding sources.
From 2000-2013, the Habitat Stewardship Program managed to secure approximately 1800 square kilometres of private land, which may benefit up to 603 imperilled species.

70 | Species in the Balance: Partnering on tools and incentives to recover species at risk
REPORT | Species in the Balance
Of course, opportunity costs are not directly observable by land trusts or regulators, and this invites the prospect of land-holders “gaming” the program by overstating the opportunity costs of their SAR management and recovery measures, or the quality of SAR habitat on their property51. However, there are ways to mitigate this risk, such as requiring that the program explicitly target landowners whose parcels meet strict ecological criteria, or by establishing reverse auctions to incentivize more accurate information about the opportunity costs/willingness to accept payment for SAR management and recovery measures.
• One government interviewee noted that, in some instances, smaller stewardship organizations struggle to meet the matching funds requirements of the HSP, which indirectly gives larger organizations an advantage when applying for funding. Another stakeholder noted that even larger organizations sometimes struggle to meet this requirement, due to the restricted nature of the available funding and the inherent difficulties in funding conservation projects.
ECCC could consider relaxing this requirement by making the matching funds criteria an asset for proposed projects rather than an obligation, or by reducing the amount of leveraging required. Both of these measures would help ensure that funds can still be disbursed to promising projects or programs that are less well-resourced. However, this does have a trade-off, since it is harder to justify the relatively high costs of data collection for smaller projects.
• Another significant opportunity lies in ECCC sharing data on the recovery actions implemented through ECCC’s stewardship programs. The 2013 report of the Commissioner of Environment and Sustainable Development of the Office of the Auditor General (OAG CESD) noted that, at the time of audit, ECCC was developing a tool which would link projects funded under the three main SAR funding programs52 to recovery actions recommended in SAR’s recovery strategies (OAG CESD 2013). The tool would also overlay or compare CH maps with maps of projects funded under the three programs. Allowing the conservation and research communities to access these data (with safeguards to protect sensitive and confidential information where appropriate) would be an important complement to these activities, and would dovetail with the government’s commitment to open data as well as our broader recommendations on data collection, sharing and dissemination (see section 5.6 for discussion).
• As mentioned throughout this report, the F/P/T governments should also prioritize interventions that take an experimental or quasi-experimental approach (i.e. with appropriate baseline information and control groups).
Bobolink (Dolichonyx oryzivorus) is listed as threatened under the Species at Risk Act. Within Canada, its range spans all provinces, but not the territories. Source: Species at Risk registry.

| 71
5.6 Improving data collection, sharing, management and dissemination for informing decisions*
Effectively managing and recovering SAR will require a new vision for how the private sector, conservation organizations and governments collect, share, manage and disseminate data, as well as how they use this data to inform decision making. Here we highlight some key considerations for policymakers.
5.6.1 Harmonizing data collection and analysis efforts
Ensuring that all of the key players in the SAR recovery space are measuring and gathering data in a consistent fashion is an essential first step. For instance, F/P/T governments should consider aligning their criteria for identifying CH in F/P/T recovery strategies. Governments should also strongly consider collaborating with conservation organizations and the private sector to ensure that the latter are informed on which kinds of data (and which means of collecting and encoding it) are most useful for policymakers.
5.6.2 Making data sharing the norm
We have already discussed how failing to share data is hindering progress on SAR recovery. While there will be no one-size fits all solution to these problems, several promising avenues have been highlighted by stakeholders. For instance, one interviewee representing the Conservation Data Centres (CDCs) noted that NatureServe Canada and the network of CDCs are engaging with industry to promote the two-way flow of biodiversity information. These are important efforts to build trust and a common understanding amongst two major stakeholder groups. Over the longer term, two far-reaching solutions could be considered – one more of a “top-down” approach between governments, the other a “bottom-up” approach starting from the data providers. The first solution would be for F/P/T governments, COSEWIC, and CDCs to consider adopting a comprehensive, “negative list” approach for sharing all SAR-related data that they collect and manage (possibly through a binding intergovernmental agreement). The negative list approach has been used in recent negotiations for removing interprovincial trade barriers53. In the context of SARA data sharing agreements, a negative list approach would entail making unencumbered data sharing the default option amongst F/P/T government agencies and related bodies such as COSEWIC and the CDCs – but parties would be free to identify specific types of data which they do not wish to share with other governments or organizations (e.g. for reasons of confidentiality or due to previously signed non-disclosure agreements). A similar model could perhaps be rolled out amongst key industry and ENGO stakeholders such as members of the recently reformed SARA Advisory Committee (with appropriate safeguards for sensitive and proprietary information). The SARA Advisory Committee has already established a knowledge plan for improving data sharing between private sector committee members, which could lay a foundation for addressing this issue amongst industry players and ENGOs more broadly.
* This section draws from unpublished material by Dr. Scott Findlay and Sue McKee (Findlay and McKee 2013) and from several discussions with Dr. Findlay. It has been further refined through interviews with various SARA stakeholders. Dr. Findlay and Sue McKee’s contributing materials to the report does not necessarily imply their endorsement, and all errors and omissions remain the responsibility of Smart Prosperity Institute.
Effectively managing andrecovering species at risk will require a new vision forhow stakeholders collect, share, and manage data.

72 | Species in the Balance: Partnering on tools and incentives to recover species at risk
REPORT | Species in the Balance
The second, “bottom-up” approach would be modelled after the informed consent process for collecting personal medical data from clinical trials or personal medical care, which aims to protect participants’ right to privacy and security, while facilitating secondary use of the data for research purposes. In these fields, it is increasingly common practice for informed consent forms to feature a set of options among which participants can choose - these options generally specify the types of research for which the signatories’ data will be used and/or the type of institutions that can undertake such research.
For example, the US Health Information Portability and Accountability Act (HIPAA) and the Canadian Personal Information Protection and Electronic Documents Act all require patients to specify whether they give permission for secondary use of their personal data for research purposes, as part of the informed consent process. HIPAA was updated as of September 2013 such that newly enrolled participants who need to sign a HIPAA authorization must “opt-in” to allow the use of their personal health information for additional studies (i.e. additional to the original intent of data collection) and future secondary use for research purposes.
One could envision a similar model for SARA data providers. For instance, a set of options could be listed in the informed consent section of the CDC data submission form, specifying the types of research projects for which the signatory consents that their data be used (e.g. internal reference information for the CDC only, range maps with or without precise locations identified, etc.). Another field in the informed consent form might identify the types of organizations or institutions whom the signatory consents to secondary use of the data they have provided – for example, F/P/T/I governments, associated agencies or organizations such as CDCs and COSEWIC, non-governmental organizations, academia, or industry associations.
This approach would not be able to guarantee anonymity for all data providers. For instance, data relating to specific parcels of land would require information on their location and size, making it fairly easy to identify data providers. This problem could be mitigated to some degree by including an option in the informed consent process requiring that users of the data sign non-disclosure agreements that prevent them from publishing the data in a format that allows for easy identification of data providers (for example, publishing in an aggregated form that effectively precludes individual identification).
This option would allow organizations tasked with collecting and curating SAR-related data to have greater flexibility in sharing data (from those who have “opted in”) with other interested parties. It also has the potential for reducing the administrative costs of sharing secondary data, since data providers would not need to be approached for their consent in every case where the data might be used for new research purposes or shared with another organization.

| 73
5.6.3 Setting up a comprehensive database for accessing and analyzing species at risk data
There are already several databases which house important information related to SAR, such as CDCs, F/P/T registries of conservation easements and ecological gifts, the list of permits issued under section 73 of SARA in the SARA Registry, the SAR CH maps in the federal Open Government portal, the University of Ottawa’s Species at Risk database, as well as various species at risk databases housed internally by F/P/T government ministries. Locating and accessing these data across the various data sources can create considerable transaction costs (in part due to access to information requests). Furthermore, not all of this information is encoded in formats amenable to geospatial or statistical analysis.
Some of these issues could be resolved by means of: (1) a set of structured formats and processes for encoding, managing and updating data relevant to SARA; and (2) an online database for storing these data. The database would have the greatest impact if it were accessible to F/P/T/I governments, municipal governments, as well as ENGOs, industry, and academia. We envision the database containing spatially explicit and geo-referenced data (where feasible and appropriate) on the following*:
1. SAR range and critical habitat maps.
2. SAR habitat associations.
3. Data on SAR population and range trends.
4. Information for permits issued (or under consideration) for projects under section 73 of SARA.
5. Information on projects approved (and under review) under CEAA (2012).
6. Data on any section 11 and section 13 agreements signed between the federal government and P/T governments, conservation organizations, industry and landowners.
7. Data on the effectiveness of any undertaken recover actions, mitigation measures, and compensation measures, whether for signed section 11/13 agreements or section 73 permits under SARA, regulatory compliance measures under CEAA (2012), or otherwise.
8. Data on land purchased for SAR conservation - or conservation easements signed with F/P governments and conservation organizations - including their costs54, their current management, and information on their habitat potential.
9. Data on properties donated under the Ecological Gifts Program (and their costs)55, their current management, and information on their habitat potential.
10. Data on any habitats created or protected under a habitat banking or restoration program (and related programs), and their associated costs.
11. Information on projects implemented under the HSP, SARFIP, SARPAL, the Aboriginal Fund for Species at Risk, the Interdepartmental Recovery Fund, as well as projects under the Growing Forward Environmental Stewardship programs that may be relevant for SAR conservation – including the threat remediation and recovery actions implemented by the projects, and their associated costs.
12. Any new maps or data developed as part of Regional Impact Assessment processes (see section 5.7. for discussion).
* While some of this data is not collected at present, we hope that this framework can help inform future data collection, data sharing, and data management efforts.

74 | Species in the Balance: Partnering on tools and incentives to recover species at risk
REPORT | Species in the Balance
There are other spatial data that are not directly related to SAR but which warrant inclusion in the database (where feasible and appropriate) for the analysis of specific issues such as cumulative effects assessment. These include:
1. Land tenure maps.
2. Land cover maps.
3. Land use plans and maps, including urban development, natural resource plays, etc.
There are also several other datasets which are not always spatially explicit at the moment, but which could in principle become geo-referenced over time:
1. Threats to SAR survival or recovery, including their scope, severity, magnitude and imminence (and changes therein over time) – from both COSEWIC assessments and finalized recovery strategies.
2. Implemented recovery actions, including their nature, geographical/spatial scale, duration and cost – however, this would require federal and provincial governments to make a much more concerted effort to track these actions than they have to date.
The database would be developed as a full partnership between F/P/T/I governments, the CDCs, COSEWIC and the academic community. Governments should also strongly consider mechanisms for enabling industry and ENGO data submissions, although this would require additional resources to vet these data (however, having an agreed upon framework for measuring, collecting and analyzing these data should help make these costs more manageable). While all partners would be expected to provide appropriate contributions of monetary and/or in-kind support, we are agnostic as to which of these institutions (or a newly created secretariat) should house the database and curate its website. The organizations managing these different data sets would continue to operate as separate entities, while coordinating closely on data collection and vetting procedures. Ensuring that all of the existing data is housed in an accessible and dedicated database will require some effort, but the payoff in the form of potential applications is likely to vastly exceed the costs.
5.6.4 Making the data available and accessible to the public (where appropriate)
Much of the data collected for SAR management is funded by F/P/T governments, who in turn are funded by taxpayers. The government’s commitment to open data creates a strong presumption in favour of making these data accessible to the public, excepting those datasets containing confidential or proprietary information (e.g. value of land donated under the Ecological Gifts Program), or those which might put SAR further at risk if they were publicized (e.g. maps identifying specific locations for certain SAR’s CH)56.
Moreover, policymakers should consider communicating and visualizing these data in a manner that is easily understood by the public. The SAR range and CH maps housed within the federal Open Government portal, and other recent initiatives are promising examples for the government to build upon. The government should also take measures to provide other relevant data (e.g. projects approved or under review under CEAA (2012), or permits issued under section 73 of SARA) as they become available.

| 75
Box 10: Operational benefits from the database - making recovery strategy processes modular, integrated and database-driven
One potential application of the database would be to further streamline and integrate the recovery strategy process. Many stakeholders noted that considerable progress has been made in streamlining and simplifying recovery strategy documents, through e.g. the recovery strategy template documents circulated by the responsible authorities, and this database could build off and strengthen these efforts. The template for recovery strategies would consist of a set of data entry fields (e.g. on IUCN threats, species’ ranges, etc.) that would simultaneously populate the database and provide the main content for recovery strategy documents. The body of the recovery strategy document then would be produced from the relevant fields in the database. The responsibility of the recovery strategy author(s) would be to provide a brief narrative context for the report, as well as to provide complementary qualitative information from consultations with field experts, Indigenous and community stakeholders (including Indigenous traditional knowledge), and other sources of information that are not always captured in database format.
The template could also be modular, providing the flexibility to incorporate any additional fields or information necessary to satisfy provincial or territorial recovery strategy requirements. With sufficient coordination and flexibility, provincial/territorial recovery strategies could be based off existing federal recovery strategies and vice versa, allowing a coordinated approach that integrates previous efforts. Such an approach might also lead to considerable savings in document translation costs. This approach would have the added benefit of making recovery strategies into living documents which would be flexible enough to provide updated information (where appropriate) on shorter time scales than the mandated five-year intervals for updating recovery strategies. For instance, the database could be updated annually to track information on recovery actions funded under the HSP or other funding streams. Using the appropriate metadata to link different elements in the database could facilitate this task– for example, the information on recovery actions implemented under the HSP could be automatically incorporated into the finalized recovery strategy for the relevant SAR.
5.6.5 Using this information to inform species at risk decision-making and investments
This database would be invaluable for informing decision-making and investments – both by reducing the transaction costs necessary to acquire the data and by providing a “dashboard” for much of the information necessary for trade-off analysis and decision-making. While the database could have many potential applications, here we mention one application which we think is particularly important.
Multispecies recovery strategies and action plans – the University of Ottawa has used its Species at Risk database to provide support to ECCC recovery planning processes, and a similar function could be played by the database proposed in this report. In the University of Ottawa database, information on threats (using the IUCN threat classification system) extracted from COSEWIC assessments and recovery strategies are used to construct hierarchical threat profiles for species. Conservation action profiles are also constructed for species, consisting of threat remediation actions (e.g. reducing take) or compensating actions (e.g. habitat restoration). Using digitized species range maps, species with overlapping ranges can then be assessed in terms of their proximity and overlap in threat space and recovery action space, thereby identifying species and places which have significant potential for multispecies or ecosystem-based recovery planning (Findlay and McKee 2016). By incorporating data on the costs of recovery actions through the database partnership proposed in this report, the above approach could be expanded to support multispecies and ecosystem-based action planning. Recovery actions could then be prioritized to maximize the expected recovery benefits across a suite of SAR in the planning area, relative to the overall conservation budget (Auerbach, Tulloch and Possingham et al. 2014; c.f. Pannell and Gibson 2016).

76 | Species in the Balance: Partnering on tools and incentives to recover species at risk
REPORT | Species in the Balance
The database could also serve as a key input to cumulative effects assessment under section 73 of SARA as well as CEAA (2012) – which we outline in the next section.
5.7. Leveraging data and regional impact assessment processes to manage cumulative effects under the Species at Risk Act and the Canadian Environmental Assessment Act (2012)
There are several ways in which cumulative effects assessment under both SARA and CEAA (2012) could potentially inform one another. For instance, the recent reforms recommended by the Expert Panel for the Review of Environmental Assessment Processes and other commentators - which are currently under consideration by the federal government (Government of Canada 2017b) - provide some helpful parallels for integrating cumulative effects assessment into SAR policy. By the same token, commentators have noted that various documents related to SARA implementation (e.g. recovery strategies) can also make a meaningful contribution to cumulative effects assessment (Sinclair, Doelle and Duinker 2017).
5.7.1 Federal-provincial-territorial cooperation in regional impact assessment
Managing cumulative effects requires understanding how multiple threats and drivers of change interact in a landscape, since their combined impact potentially exceeds the impact of each threaten taken separately (Crain, Kroeker, and Halpem 2008; Halpern et al. 2013)57. Understanding the broader context of current and projected impacts on the landscape is therefore necessary for understanding how a project is likely to contribute to cumulative effects. This has led to difficulties within the current impact assessment (IA) context in Canada, since numerous stakeholders have noted the deficiencies of CEAA’s (2012) project-scale framework for assessing cumulative effects (e.g. Sinclair, Doelle and Duinker 2017).
To deal with these issues, the Expert Panel and many others recommend complementing project scale IAs with regional IAs, since this spatial and temporal scale is arguably more suitable for assessing cumulative effects (Gélinas et al. 2017; Ray, Chetkiewicz and Green 2016; Sinclair, Doelle and Duinker 2017)58. The federal government has recently signalled that it is seriously considering such an approach, which would be informed by a set of national environmental frameworks (e.g. the Pan-Canadian Framework on Clean Growth and Climate Change) (Government of Canada 2017b).
The Expert Panel also recommends that the federal government engage in a full partnership with P/T governments in developing regional IAs, since many projects will have impacts on valued ecosystem components (VECs) which are not exclusively within the federal government’s jurisdiction. This is especially important within the context of SAR management, since many SAR have at least some of their CH on provincial crown land.
These regional IAs would take stock of key drivers of change in landscapes and assess the sustainability impacts of projects - including current and projected impacts on the abundance and distribution of SAR and their CH. They would also draw on the full range of scientific knowledge and evidence, including Indigenous knowledge. Such an approach would help provide a credible baseline for all future project-scale IAs, by providing a better understanding of how project-level impacts interact with broader-

| 77
scale processes. Regional IAs would also enable stakeholders to identify priorities for avoiding, mitigating and compensating for threats such as direct harm to SAR from land-use change, linear disturbances, climate change, and so on.
Conducting alternatives assessments which envision different social, economic and ecological scenarios, or which identify ecological sustainability thresholds and economic development objectives for key landscapes, would be important components of these regional IAs. The federal government clearly has the jurisdictional authority to conduct regional IAs in cases where the VECs (including SAR) cross jurisdictional boundaries, or are found exclusively on federal lands or in federal waterways. They also have the authority to use the information gathered therein to inform project reviews, including decisions on whether or not the project should be approved. The federal government would also have the authority to conduct regional IAs on P/T crown land if P/T governments agree to partner with the federal government. To help ensure these partnerships, the federal government should provide resources (financial and in-kind) to encourage cooperation with the provinces and territories (EPA Caucus 2017).
This being said, both the Expert Panel (Gélinas et al. 2017) and the Government of Canada (2017c) are arguably interpreting the federal role in regional IAs on non-federal land too narrowly (EPA Caucus 2017). In particular, the federal government’s convening and information-gathering role in conducting regional IAs needs to be distinguished from its jurisdictional authority to make project-level IA approvals on the basis of these regional IAs. Even in cases where the candidate places for regional IAs are found exclusively on provincial crown land - meaning that the federal government does not necessarily have the regulatory authority to make project-level IA decisions - the federal government still has a legitimate fiduciary duty to conduct alternatives assessments for these regions, in order to inform potential future project reviews which might impact VECs under federal jurisdiction, such as fish and fish habitat, migratory birds or SAR (EPA Caucus 2017; c.f. Findlay 2016).
5.7.2 Aligning impact assessment processes with species at risk recovery processes
Aligning SAR recovery processes with regional impact assessments would be strategic for several reasons, including reducing duplication and ensuring that SAR management is integrated into much broader economic and sustainability planning. Moreover, many aspects of SARA implementation could provide important and valuable information (often at multiple spatial scales) for these regional IAs, including:
• SAR population and recovery objectives (as laid out in COSEWIC assessments).
• maps of SAR’s CH (as identified in recovery strategies and action plans).
• anthropogenic threats to SAR (as identified in COSEWIC assessments and recovery strategies).
• implemented recovery actions (as identified in action plans, and occasionally in recovery strategies).
To that effect, we propose an iterative process whereby information generated through SAR recovery processes and regional IAs would mutually inform one another. This would proceed in two broad steps:
First, as part of a strategy for identifying priority areas for conservation and developing
Aligning species at risk recovery processes with regional impact assessments would reduce duplication and ensure that species at risk management is integrated into much broader economic and sustainability planning.

78 | Species in the Balance: Partnering on tools and incentives to recover species at risk
REPORT | Species in the Balance
Figure 15: Using species at risk management information at multiple scales to inform cumulative effects assessment*
* We recognize that the spatial scales implied by the concentric circles are somewhat arbitrary. They are meant to be an illustrative device.
baseline information, regional IAs would build off existing processes for managing and recovering SAR, such as section 73 permits, COSEWIC assessments, Recovery Strategies and Action Plans (a process we refer to as “upscaling”). Once these regional IAs were finalized, they would be used as a key input for assessing cumulative effects from projects seeking a permit under section 73 of SARA or an approval (with associated conditions) under CEAA (2012). Governments could also consider incorporating quantitative decision support tools – such as Bayesian networks (e.g. Wilson 2012) – to support both project-level and regional IAs. Second, these regional IAs would also provide baseline information for future SARA recovery documents such as action plans (and to a lesser extent, recovery strategies)59 - a process we refer to as “downscaling”60. Fig. 15 visualizes these various SARA and CEAA (2012) processes as groups of concentric circles, with the spatial scale being represented by the size of the circles. Information from processes at lower spatial scales (smaller circles) would be used to inform assessments and decisions at higher spatial scales (larger circles), and vice-versa.
RegionalIAs
SARAPermits
RecoveryStrat.ActionPlans
DownscalingU
pscaling
ProjectIAs

| 79
These regional IAs would be most effective if they were managed as living documents. At the very minimum, some kind of mechanism would be needed for keeping track of any section 73 permits or CEAA (2012) approvals (and their associated conditions) issued after the regional assessment has been finalized - along with the predicted impacts of these projects, the predicted effectiveness of the measures taken to mitigate these impacts and, over time, the measured outcome of these mitigation actions. This information could then be used to inform decisions such as:
• Whether additional mitigation or compensation measures should be put in place for existing projects, or whether a section 73 permit under SARA or project approval under CEAA (2012) should be revoked
• The potential cumulative effects of any new projects under SARA’s section 73 permitting policy, signed section 11 agreements, or the successor legislation to CEAA (2012).
Ensuring that these regional IAs proceed in a timely and efficient matter, without getting bogged down in process, will be of the upmost importance. To give an example of what’s at stake, one of our interviewees who participated in the Great Sand Hills Regional Environmental Study noted that the study took years to complete, and was out of date by the time it was finalized. The consequence was that the impacts from projected activities had changed, along with the projected revenues that would have financed some conservation actions.
The database outlined in the previous section could potentially help with the process of collecting and updating data for these regional IAs, since the information on SAR and their threats would be formatted in a manner that was harmonized, accessible to stakeholders and amenable to spatial and quantitative analysis61. However, some stakeholders have noted limitations to what such a database could accomplish, since many SAR do not have the full extent of their CH identified on non-federal land. Moreover, in many cases more detailed site work is needed to actually identify SAR habitat (including critical habitat) on “the ground and in the water”.
Before these regional IAs have been finalized, some “bridging” principles might be needed for informing project-scale assessments under section 73 of SARA or for informing project-level IAs under CEAA (2012). At a minimum we would propose that during this interim period, any project-scale assessments conducted under section 11 or section 73 of SARA, or under CEAA (2012), should incorporate all relevant information from COSEWIC assessments, recovery strategies and action plans, as well as any existing section 73 permits, section 11 agreements, and project-level IA decisions.
5.8 Increasing overall funding for species at risk conservation, diversifying funding sources and prioritizing expenditures
SARA stakeholders broadly agree that current funding is not up to the challenge of SAR recovery. Throughout this report, we’ve attempted to identify solutions that will optimize current public spending, achieve improved SAR outcomes with that public investment, and effectively leverage private funding. But even if current investment and efforts are optimized, our stakeholders widely believed that ambitious financing for SAR recovery actions would strain the capacity of all stakeholders under current funding levels.
Regional impact assessments would be most effective if they were managed as living documents.

80 | Species in the Balance: Partnering on tools and incentives to recover species at risk
REPORT | Species in the Balance
We identified three key issues related to resourcing SAR recovery efforts that would benefit from being addressed: (1) the small share of resources devoted to action planning and implementing recovery actions; (2) the need for conservation organizations and all levels of government to identify new sources of revenue through economic instruments and other funding tools; (3) the need for new public investment which recognizes the importance of the issue and motivates a strategic and well-targeted increase in public spending. We discuss each of these issues, and we conclude by highlighting the need for improving our understanding of the cost requirements for implementing SARA.
5.8.1 Increasing resources for stewardship and action planning
While many stakeholders acknowledged that other SARA processes (such as COSEWIC assessments) still require additional resources to reach their full potential, many of them also argued that the priority should be to allocate the majority of additional revenues towards action plans and stewardship. Stakeholders stressed that increasing resources towards stewardship is already needed even with current funding levels, and more still will be required once a critical mass of SAR “graduate’’ from the recovery strategy stage to the action planning stage. These additional expenditures should be rigorously prioritized and targeted to maximize impact.
5.8.2 Finding new sources of revenue
Few estimates of the resources necessary for improving SARA implementation exist. EcoJustice and Nature Canada recommend a short-term infusion of $225 million in additional Federal ‘B-base’ funding over five years to bolster SARA implementation (Green Budget Coalition 2016). By contrast, Dr. Ric Taylor of COSEWIC estimates that successfully implementing SARA might require up to one billion dollars per year (personal communication, March 20, 2017). The difficulty in coming up with a reliable estimate partially stems from the fact that it is currently impossible to comprehensively estimate the costs of implementing SARA, since only a fraction of the total number of necessary action plans have been completed to date, and data on financial resources devoted to SAR recovery are not always publicly available (especially P/T government expenditures, or per-species expenditures).
Nonetheless, the current range of estimates for the funding needed to improve SARA implementation (or to fully implement it) makes clear that significant increases in resources will be necessary. Many of our stakeholders expressed an interest in different funding tools and how they might be used to generate additional revenue for SAR conservation.
We highlight some potential funding solutions for municipal, provincial/territorial and federal governments to consider below. Governments will need to carefully assess the merits and trade-offs associated with each of these different funding instruments, as well as any potential interactions between the chosen tools. Local and Municipal Governments Local and municipal governments face some unique challenges in financing and implementing SAR recovery activities. Our stakeholders noted that as a general rule, municipal governments are less knowledgeable about the implications of SARA for their day to day operations. They also have fewer instruments at their disposal to raise funds for SAR conservation. This being said, a number of municipalities in Canada and the United States have had some success in financing imperilled species conservation, through such tools as:
Atlantic Salmon, Inner Bay of Fundy population (Salmo salar) is listed as endangered under the Species at Risk Act. They spawn in the rivers of New Brunswick and Nova Scotia and migrate to the Bay of Fundy in early autumn. Source: Species at Risk registry.

| 81
• Municipal referenda for local bonds and tax increases – state governments, local governments and municipalities throughout North America have used municipal referenda to raise funds for acquiring and conserving local land for decades, with the Trust for Public Lands estimating that approximately USD $76 billion in bonds and taxes has been raised for land conservation in the United States from years 1988-2017 (Trust for Public Lands, undated).
Fewer of these funds have been established in Canada, but noteworthy examples include the Regional Park Acquisition Fund established within British Columbia’s Capital Regional District, the Regional District of East Kootenay (Sandborn et al. 2015), and the Regional District of Okanaga-Similkameen (2017). Using these bonds and tax increases to acquire additional SAR habitat should be an important consideration. These revenues could also be used to finance programs which provide property tax rebates for landowners to maintain ecologically significant lands on existing properties, such as wetlands and forests which might be considered nuisance areas for agriculture. These local ballot measures are most likely to be successful if they create broad coalitions of interests (such as between conservation, health, community and hunters’ organizations), if SAR habitat acquisition is packaged with other measures for providing green space or enhancing water quality and other ecosystem services, and if they communicate the full suite of potential recreational, environmental and health benefits to voters (Hartwell 2017; Zieper 2017).
Although opposition to property tax increases can pose a challenge, it is not insurmountable. Previous research has demonstrated that acquiring open areas close to residential properties can increase local property values, which may enable homeowners to capitalize a sizable share of the conservation benefits that are financed through the municipal property tax (see Ando and Shah 2015 for a review). Communicating to homeowners – ideally through an analysis of local property values – that SAR conservation measures may provide these and other benefits may help defray some of this opposition.
• Development cost charges – these impose a levy on new developments as a means of financing the infrastructure costs associated with municipal growth (Elgie et al. 2016). Although development cost charges are typically used to recover municipalities’ financial costs associated with building new infrastructure to service the new developments, development cost charges could also be used to finance nearby land protection or restoration measures (e.g. wetlands, riparian vegetation), some of which could indirectly benefit SAR. The Town of Gibsons in British Columbia recently reformed its policy for implementing development cost charges, enabling the municipality to allocate some of the proceeds for conservation purposes where the conservation of natural areas supported service delivery – such as storm water management - to the new development (Town of Gibsons 2017). In addition to potentially increasing funds for habitat protection and restoration, development cost charges have the added benefit of discouraging sprawl and encouraging more compact urban form at the economic margin (Elgie et al. 2016).
Approximately USD $76 billion inmunicipal bonds and taxes has been raised for land conservation in the United States over the past three decades.

82 | Species in the Balance: Partnering on tools and incentives to recover species at risk
REPORT | Species in the Balance
Provincial and territorial governments Given their extensive tracts of crown land and shared jurisdiction with the federal government over agriculture62 , P/T governments will require significant additional resources for recovering SAR. Fortunately, these governments also have several means of financing additional SAR conservation, including:
• Carbon pricing revenues – four Canadian provinces have implemented carbon pricing schemes and several others plan to do so, and the federal carbon pricing backstop under the Pan Canadian Framework comes into effect on March 30, 2018 (ECCC 2018). The federal backstop consists of an initial $10/tonne carbon price which will increase in annual increments of 10$/tonne until it reaches $50/tonne in 2022 - combined with output-based allocations, a tradeable intensity standard for heavy industry (Government of Canada 2018). The federal government has committed to remitting all carbon pricing revenues back to provinces covered by the backstop, although it is not yet clear what form this will take. P/T governments need to carefully consider how to recycle carbon pricing proceeds between household transfers, tax cuts, transitional support for industry, or other government priorities (such as investments in low carbon technology). However, the new revenues generated by these carbon pricing schemes could provide a political window for P/T governments to increase their expenditures on SAR conservation. To provide an illustrative example, Canada’s Ecofiscal Commission estimates that an economy-wide carbon price of $30/tonne (applied to P/T greenhouse gas combustion emissions for 2013) would raise approximately $15.8 billion* in revenue across all provinces and territories (Ecofiscal Commission of Canada 2016). If each province and territory allocated half a per cent of these revenues towards SAR recovery actions, this would create an additional $79 million per year in SAR funding across all provinces and territories – almost matching current federal funding for SARA implementation. Although the federal government lacks the constitutional authority or political legitimacy to earmark the proceeds from the carbon pricing backstop to SAR conservation, it could communicate to the provinces and territories that they are expected to increase their share of funding for SAR recovery, and that the carbon price is a viable and politically expedient means of achieving this63. Governments could also convey to the public that spending some of the proceeds on SAR conservation has the potential to create multiple benefits, such as enhancing terrestrial carbon stocks, fostering climate resilience, and improving drinking water quality.
• Modest fraction of P/T resource royalties – The federal government of the United States has been a leader on this front and provides an inspiring example for Canada’s provinces and territories. The United States federal government has dedicated up to US $900 million annually from its offshore oil and gas royalties towards the Land and Water Conservation Fund (Land and Water Conservation Fund, undated). Allocating a small share of P/T natural resource royalties to SAR recovery would provide P/T governments
* This estimate differs from the likely amount of revenue generated by provincial carbon pricing schemes and the federal carbon price backstop for several reasons. Nonetheless, the Ecofiscal Commission’s estimate provides a reasonable illustrative example in the absence of official revenue projections from provincial carbon pricing schemes combined with the federal backstop.
Woodland Caribou (Boreal population; Rangifer tarandus) is listed as threatened under the Species at Risk Act. Source: Species at Risk registry.
Their range encompasses the Northwest Territories, British Columbia, Alberta, Saskatchewan, Manitoba, Ontario, Quebec, and Newfoundland and Labrador.Source: Species at Risk registry.
Author: Steve Forrest

| 83
with a major source of funds for implementing these activities. For instance, if all provincial, territorial and local governments had allocated half a percent of their natural resource royalties towards SAR conservation in 2015, this would have generated approximately $38 million in revenue (Statistics Canada 2017). Given the links between natural resource extraction, processing and transportation on the one hand and impacts to SAR habitat and ecosystems on the other, the rationale for allocating money from resource royalties to SAR conservation has a fair chance of garnering public support. However, this potential funding source will be smaller for provinces which have smaller or less diversified portfolios of natural resource wealth. An alternative approach could be for P/T governments to consider a very modest increase in the overall royalty rate (i.e. a fraction of a percent). Such measures may be more likely to succeed if they are included in a broader discussion of royalty reforms – especially those which have the potential to reduce the distortionary effects of some existing royalty regimes.
• Deposit return schemes – Many U.S. states and Canadian provinces have implemented deposit-return schemes for goods such as beer bottles, wine bottles, soda cans, or plastic water bottles, and a few U.S. states have dedicating the proceeds to environmental and conservation efforts (Sandborn et al. 2015; Environmental Defence Canada 2017). While most provinces already have deposit-return schemes in place, there is untapped opportunity in some provinces to introduce additional types of container materials. For instance, environmental organizations in Ontario are advocating for the introduction of a deposit-return scheme for plastic soft drink bottles, with the revenues targeted towards environmental stewardship programs – such as nutrient management - for farmers operating along the Great Lakes (Environmental Defence Canada 2017). These types of programs would provide multiple benefits simultaneously, such as discouraging solid waste pollution, encouraging recycling, improving water quality, and providing much needed funds for SAR stewardship on private land and in aquatic ecosystems.
• Wildlife hunting and fishing licenses and stamps – the provinces and territories are already creatively leveraging various hunting, fishing and recreational licenses and stamps to finance conservation activities, including activities that benefit SAR. For instance, Ontario raised $6 million for wildlife management, research, and outreach from the sale of hunting and fishing licenses in 2014/2015 (Ontario Ministry of Natural Resources and Forestry 2015). Increasing hunting and fishing license fees and earmarking the revenues towards SAR conservation would increase available funding for SAR management, although the sporting community might not be particularly receptive to such a proposal. However, a variety of softer mechanisms could still be used. For instance, P/T governments could levy an additional voluntary fee on hunting and fishing licenses (for non-SARA listed species), and hunting and fishing gear, on an opt-out basis (Sandborn et al. 2015). Explaining to hunters and anglers that measures to protect and conserve habitat for (some) SAR will also conserve habitat for exploited wildlife species could make the sporting community more respective to these fees. This case is particularly strong for many fish and other aquatic species.
Allocating a small share of provincial and territorial natural resource royalties to species at risk recovery would provide these governments with a major source of funds for implementing these activities.

84 | Species in the Balance: Partnering on tools and incentives to recover species at risk
REPORT | Species in the Balance
Federal government The federal government has extensive powers of general taxation for financing SAR recovery. However, given that the provinces and territories have jurisdiction over most natural resources, and carbon pricing proceeds are being rebated to P/T governments, the range of revenue tools available to the federal government which are notionally tied to activities affecting SAR (such as natural resource extraction, etc.) is relatively small.
In addition to fishing license and stamp fees for marine and aquatic species, the federal government has some other fees which it could levy. To provide one notable example:
• Taxes on agricultural inputs – a small tax on fertilizers and/or pesticides could be used to create a pool of funds for SAR stewardship programs. While the typical goal of environmental pricing schemes (such as input taxes) is to change behaviour rather than generate revenue, using the proceeds to fund stewardship schemes can still potentially enhance social welfare in cases where technical or social constraints prevent policymakers from setting input taxes high enough to fully reflect environmental damages.
On this model, the taxes could be set very low to minimize impacts to the agricultural sector. Instead, the majority of environmental improvements would come from stewardship activities funded by the tax itself, such as payments for BMP adoptions to reduce nutrient loading or nutrient concentrations in various watersheds (c.f. Helm 2001). A similar model for pesticides has been successful implemented in European jurisdictions such as Denmark, whose pesticide tax raised approximately CAD 120 million (nominal) in 2013 - much of which was recycled back into agricultural and environmental programs (Böcker and Finger 2016). In addition to remediating priority threats to SAR, reducing nonpoint source pollution in key watersheds could potentially generate important co-benefits such as improved water quality or increased fish stocks for recreational angling. However, as discussed in section 5.3.3 on controlling nonpoint source pollution, such a program would need to be carefully designed and fully cognizant of the trade-offs between: (1) rebating the revenues directly to farmers (based on farm output or as a lump-sum payment); (2) using the revenues to fund agricultural stewardship programs; (3) requiring greater environmental cross-compliance for e.g. manure and input management as part of agricultural support schemes. For this to work in practice, tailoring the policy (and revenue recycling mechanism) to secure buy-in from the agricultural sector will be essential.
Federal, provincial, territorial, Indigenous and municipal governments should also consider making use of sovereign and sub-sovereign green bonds to finance their SAR conservation efforts (see box 11).

| 85
Box 12: Sovereign and sub-sovereign green bonds
Green bonds are a form of debt capital for financing environmental projects. Canada is already active within the green bond space, with Ontario and Quebec issuing a combined $1.3 billion worth of sub-sovereign green bonds for low carbon infrastructure projects in 2017 (Boulle and Marcano 2017). Green bonds continue to be oversubscribed, suggesting potential demand for sovereign and sub-sovereign green bonds issued by federal and municipal governments (as well as additional P/T governments).
Issuing green bonds dedicated exclusively to SAR recovery could be a promising avenue for policymakers to explore, especially if the proceeds were used to finance resource-intensive activities such as extensive habitat restoration, or compensating private landowners for SAR conservation. A variant of this approach was recently proposed to the government of Alberta, in order to raise the $100 million in funding needed for restoring caribou habitat and establishing a caribou breeding facility (Denhoff 2016).
Governments could also conduct market research to see if they could attract a more selective audience of values-based retail investors who care about biodiversity, and who might be willing to purchase green bonds with a slightly lower interest rate than conventional government bonds, thereby reducing the overall cost of issuing the bonds (c.f. Moffatt 2013). As such, these bonds could possibly attract a very keen market of eco-savy buyers who are seeking a reasonable rate of return, but are willing to accept a slightly lower interest rate to promote conservation activities. Even if governments are unable to sell these bonds at a ‘premium’ however, they would still be well worth considering since they would likely comprise a miniscule fraction of total government bond issuances for any given year.
Over the longer term, another potentially attractive option could be for policymakers to consider issuing environmental performance bonds64 (also known as “pay for success contracts”) for select species conservation activities. Performance bonds function as contracts between governments and the private sector, in which policy options are identified for tackling a government priority, along with agreed-upon performance metrics. The policy options outlined in the contract are typically expected to lead to substantial long-term cost savings relative to the status quo policy or scenario. Payment on the contract is then made conditional upon (or pro-rated to) governments meeting or exceeding the contract’s performance objectives (Nicola 2013). Performance bonds were initially piloted to tackle social issues such as homelessness or criminal recidivism (“social impact bonds”), but extending them to tackle conservation problems such as SAR loss could be a possibility.
Contracts could potentially be structured as follows: in cases where there is compelling evidence that a bundle of protection measures implemented at time t1 (e.g. habitat protection and restoration) would achieve SAR population and distribution objectives at a lower cost than measures implemented at time t2 (e.g. a combination of captive breeding programs and habitat restoration), then the government can use these projected cost savings as the basis of payment for the contract. Although the structure of the contract would need to be worked out in much greater detail, this could be a promising approach to financing habitat restoration for wide-ranging species.
5.8.3 Identifying overall resource requirements for implementing the Species at Risk Act will become increasingly important over time
Any comprehensive assessment of the resources needed to implement SARA should be based on a solid understanding of the existing resources allocated to SAR conservation and recovery at the F/P/T levels. Unfortunately, consistent and systematic reporting on SAR-related expenditures across F/P/T governments is sorely lacking. While the federal government consistently reports on SARA-related expenditures incurred by DFO, PCA and ECCC, these public reports do not itemize expenditures by species. Provincial and territorial reporting is much less transparent. Indeed, several stakeholders that we interviewed noted that their respective organizations had attempted to compile information on combined F/P/T expenditures on SAR programming, but discontinued these efforts due to the difficulties in obtaining consistent and high-quality data.

86 | Species in the Balance: Partnering on tools and incentives to recover species at risk
REPORT | Species in the Balance
Things do not have to be this way. The federal government used to publish annual RENEW reports which summarized F/P/T expenditures on SAR conservation, but these reports have been discontinued since 2005/6 (Khair et al. 2017). By contrast, the United States Fish and Wildlife Service publishes annual reports of combined federal and state spending on implementing the US ESA, including expenditure estimates for individual endangered species (US FWS 2014a).
These shortcomings in reporting on SAR conservation expenditures can have significant consequences. For instance, a recent study published in Nature which estimated the impacts of global conservation spending on endangered species (birds and mammals) recovery worldwide was unable to estimate the efficacy of Canadian conservation spending, due to inadequate public documentation of F/P/T government spending on biodiversity conservation (Waldron et al. 2017).
To remedy these flaws, F/P/T governments should agree upon a harmonized set of requirements for reporting on SAR expenditures, along with timelines and performance indicators, so that reports containing comparable spending information are made available to the Canadian public on an annual basis. Compiling a database for tracking these expenditures and making reasonable extrapolations on how they will change over time (to try and anticipate future funding needs) should be another top priority for governments and researchers.
6. AREAS FOR FURTHER RESEARCH
Although we have found some encouraging preliminary trends across a range of studies, we are still only beginning to understand the empirical correlates of SAR recovery, or the potential for place-based (multispecies and ecosystem) approaches and economic instruments to manage and recover SAR. Important areas for further research are outlined below. In our view, the most useful future research will focus on providing the evidence required for biologically effective and cost-effective interventions for managing and recovering SAR, including:
6.1 Empirical Correlates of SAR recovery*
• Using information extracted from COSEWIC status reports, recovery strategies, and other sources to develop systematic qualitative, if not quantitative, indices of species at risk population and range trends, as well as inventories of implemented conservation actions, to evaluate the effects of specific types of conservation actions on recovery.
• Evaluating the effects of listing under the US ESA or SARA on species recovery (e.g. Taylor, Suckling, and Rachlinski 2005; Ferraro, McIntosh, and Ospina 2007). This will, minimally, require comparison of population abundance or range trends prior to listing, with those post-listing. Such an analysis might also include examination of specific elements of the legislation, including, for example, associations between population or range trends and the timing of recovery strategies or action plans, or the timing and extent of critical habitat identification (e.g. Taylor, Suckling,
* This sub-section is adapted from Shahira Khair, Samuel J. McIntosh, Sawyer Stoyanovich, Noah Greenwald, Kieran Suckling and C. Scott Findlay. 2017. “Empirical correlates of SAR recovery.” Department of Biology and Institute of Environment Working Paper, University of Ottawa.
Federal, provincial and territorial governments should agree upon a harmonized set of requirements for reporting on species at risk expenditures.

| 87
and Rachlinski 2005; Gibbs and Curie 2012). If multispecies, ecosystem or place-based recovery planning and implementation becomes more common, recovery slopes could also be used to examine the comparative effectiveness of such approaches versus single-species approaches (e.g. Boersma et al. 2001; Taylor, Suckling, and Rachlinski 2005; c.f. Langpap and Kerkvliet 2012).
• Evaluate the effects of species-specific expenditures on SAR recovery in Canada and/or the U.S. (e.g. Ferraro, McIntosh, and Ospina 2007; Langpap and Kerkvliet 2010; Gibbs and Curie 2012). Because the US Fish and Wildlife Service must produce an annual report to Congress of species-specific spending under the US ESA, such an investigation is much easier to do. As noted elsewhere in this report, in Canada such data are not publicly available, and it is uncertain whether indeed they even exist. We strongly recommend that F/P/T governments work together to rectify this situation.
• Investigate associations between changes in species distribution and abundance on the one hand, and threats and implemented recovery actions on the other - as identified in recovery strategies (and, over the longer term, action plans) - as well as COSEWIC status reports. This is particularly important given that the set of threats to SAR identified in finalized recovery strategies (or the importance assigned to them) may differ from those identified in COSEWIC status reports (e.g. McCune et al. 2013).
6.2 Economic instruments
• Researchers should develop an inventory of implemented economic instruments, along with appropriately structured, annotated and codified descriptions thereof. Such descriptions should include, minimally, their “domain of application” (e.g. economic sector); geospatial, temporal, and jurisdictional context; the threats which such measures are designed to mitigate and/or the conservation actions that they are designed to encourage/incentivize; and the associated set of performance indicators, as well as any and all monitoring data on compliance and/or effectiveness.
• Further studies which specifically quantify the effects of different economic instruments on SAR recovery is a major priority. Many of the studies we examined used indicators that are, at best, indirect surrogates for their possible effects on SAR management and recovery, such as species richness, ecological function, habitat intactness, and so on. Additional studies designed explicitly to evaluate the effects on SAR’s abundance and distribution, as well as the quantity and quality of their CH are sorely needed. Ideally, such evidence for the effectiveness (or lack thereof) of such economic instruments will come from interventions which are designed and implemented as experiments, or quasi-experiments.
• Studying the effects these instruments have on different species and taxa is another important next step, since much of the research on the role of economic instruments in SAR recovery has focused on charismatic megafauna (such as woodland caribou) or on bird species. Additional research on the potential of these instruments for recovering diverse taxa such as plants, fish, invertebrates and amphibians should be an ongoing priority.

88 | Species in the Balance: Partnering on tools and incentives to recover species at risk
REPORT | Species in the Balance
• More evaluative research – ideally, in the form of field experiment with controls - is also needed to analyze trade-offs and interactions between different policy instruments. Only a handful of studies have examined the effects of formally protected areas (or land use regulations) alongside economic instruments (e.g. Weber 2004; Copeland et al. 2013; Lawley and Yang 2015), and even fewer studies have examined the effects of combining two or more economic instruments for SAR protection. Additional research from various disciplinary perspectives is needed to provide a fuller understanding of interactions and trade-offs amongst different policy instruments in terms of biological effectiveness, total policy costs, transaction costs, and social acceptability (although there are exceptions, e.g. Wilman 2013 and Mallon, Cutlac, and Weber 2016).
• Improving our understanding of the economic impacts of different conservation policy instruments is also important. Most integrated ecological-economic studies have examined the economic impacts of SAR recovery on a select few industries, namely forestry, agriculture, oil and gas. Well-designed studies estimating economic impacts (with appropriate counterfactuals) on the mining, transportation infrastructure, fisheries and aquaculture, recreation, and construction sectors would be extremely helpful for informing decision making. The recreation and construction sectors are a particularly glaring gap, since they have been identified as two of the primary threats to SAR and their CH in finalized recovery strategies (Prugh et al. 2010; McCune et al. 2013).
7. THE WAY FORWARDTrends in species at risk populations are not encouraging and strong action is needed to recover them. This will require concerted efforts by all actors – F/P/T/I governments, civil society, private landowners, industry, municipalities, and researchers.
While some of the actions outlined in this report will take considerable time to implement, there are opportunities to move quickly on a number of different fronts, while laying the foundation for more far-reaching and systematic policy reforms. We highlight some policy implications for each of these stakeholder groups:
• Federal, provincial and territorial government policymakers should consider: (1) a general shift in focus towards implementing recovery actions; (2) developing new revenue sources for SAR conservation, and strategically targeting these additional revenues towards priority recovery actions and stewardship; (3) using a broader policy toolkit for meeting their SAR recovery objectives on crown land; (4) increasing outreach efforts and incentives towards private landowners; (5) ensuring rigorous data collection and analysis, as well as monitoring of recovery and mitigation actions; (6) spearheading regional IAs and strategic IAs in cooperation with other jurisdictions and stakeholders, mainstreaming SAR-related data and obligations into these processes, and using their findings to inform project-level IAs and project reviews.

| 89
• Industry and private land holders should consider: (1) showing early leadership by engaging in voluntary measures to reduce the impacts of industry on SAR (e.g. BMPs, ecological certification, implementing the mitigation hierarchy and biodiversity offsets); (2) communicating to policymakers that additional incentives and flexibility mechanisms can foster cost-effective SAR recovery; (3) working with other industry associations and governments to ensure that credible data collected by industry (e.g. inventorying, monitoring and evaluation) is used to inform SAR decision-making. The Species at Risk Advisory Committee provides an important avenue for industry associations to liaise with one another and with other stakeholders, in order to identify opportunities and good practices in data collection, management and dissemination, and stewardship actions; (4) participating in regional IAs and accepting the results on limits to human activity that can be tolerated by SAR and their ecosystems.
• Municipal planners and policymakers should consider: (1) performing a stock-taking analysis to better understand whether and how their municipalities’ activities are affecting SAR (e.g. through urban expansion, point source pollution discharges into waterways, etc.); (2) looking for opportunities to align SAR conservation with other municipal objectives (e.g. water quality improvements, providing green spaces, asset management through green infrastructure, limiting urban sprawl); (3) identifying the right mix of economic instruments and incentives for meeting these objectives (e.g. offsets, property development charges, building density bonuses, municipal property tax breaks, etc.)
• Civil society actors and the philanthropic community should consider: (1) recognizing the broader suite of tools available for stewardship and recovery that grant makers could be funding (e.g. revolving land programs; habitat restoration and banking); (2) prioritizing which threats and species your organization wishes to focus on in key landscapes; (3) using mechanisms to target the right landowners and looking for ways to leverage social norms in your projects and programs; (4) communicating how complementary tools increase the cost-effectiveness of conservation in your value proposition to funders, partners and the general public; (5) working with governments to propose policies and legislative changes to increase incentives and funding for SAR conservation and recovery.
• Scientists and policy analysts should consider: (1) statistically assessing the impact of different threat remediation and recovery actions on SAR abundance and distribution at multiple spatial and temporal scales; (2) rigorously mapping economic instruments to different threat remediation and recovery actions; (3) using field experiments and modelling studies to better understand the potential for different policy instruments to foster SAR recovery (and their cost implications); (4) communicating the potential of economic instruments for recovering SAR to policymakers, while highlighting knowledge gaps and uncertainties.
Recovering species at risk will require concerted efforts by all actors – governments, civil society, Indigenous peoples, private landowners, industry, and researchers.

90 | Species in the Balance: Partnering on tools and incentives to recover species at risk
REPORT | Species in the Balance
APPENDIX A: LIST OF WORKSHOP PARTICIPANTSOn October 12, 2016, Smart Prosperity Institute and the Schad Foundation convened a workshop with approximately 25 stakeholders to discuss policies options for improving outcomes under the Species at Risk Act. Participants mostly comprised of industry and ENGO stakeholders, along with select participants from government and academia.
A list of workshop participants is provided below. Note that participation in the workshop does not imply endorsement of this report or its recommendations.
Name InstitutionAndrew de Vries Sustainable Forestry Initiative
Anne Bell Ontario Nature
Anne-Raphaëlle Audouin Canadian Hydropower Association
Bevin Sears ●Inter Pipeline Ltd.
David Browne Canadian Wildlife Federation
Fawn Jackson Canadian Cattlemen’s Association
Journey Paulus ●Inter Pipeline Ltd.
Justina Ray Wildlife Conservation Society Canada
Lara Ellis Alternative Land Use Services
Lorne Johnson Schad Foundation
Mercedes Serna Canadian Electricity Association
Mike Wilson Smart Prosperity Institute
Pierre Sadik EcoJustice
Peter Kendall Earth Rangers and Schad Foundation
Robert McLean Canadian Wildlife Service, Environment and Climate Change Canada
C. Scott Findlay Department of Biology and Institute of the Environment, University of Ottawa
Scott McFatridge Smart Prosperity Institute
Shannan May-McNally Institute of Environment
Sherry Sian Canadian Association of Petroleum Producers
Stewart Elgie Faculty of Law and Institute of Environment, University of Ottawa
Susan Pinkus BC Hydro
Susanna Fuller Ecology Action Centre
Tara Shea Mining Association of Canada
Tony Young Smart Prosperity Institute

| 91
APPENDIX B: LIST OF INTERVIEWEESFrom September 2016 to January 2017, Smart Prosperity Institute undertook semi-structured interviews with over 35 experts in Species at Risk policy from governments, industry, environmental non-government organizations, and academia. Interviews with two Australian stakeholders were also undertaken, to obtain insights from their experience using economic instruments for biodiversity conservation.
An interview protocol was developed to help structure discussion (and evolved over the process of the interviews), but participants were free to choose among the topics they found most interesting, or where they had the most expertise.
The list of interviewees who agreed to be listed in the report appendix is provided below. Note that participation in the interviews does not imply endorsement of this report or its recommendations.
Name InstitutionAl Thorne Tembec
Alain Branchaud SNAP Québec (CPAWS Québec )
Arne Mooers Department of Biological Sciences, Simon Fraser University
Brad Downey MULTISAR: A Multispecies Conservation Strategy For Species at Risk
Bruce Bennett Yukon Conservation Data Centre
C. Scott Findlay Department of Biology and Institute of the Environment, University of Ottawa
Dave Fraser Ministry of Environment, Government of British Columbia; COSEWIC
David Browne Canadian Wildlife Federation
David Ewing Teck Resources Limited
David Pannell School of Agriculture and Environment, University of Western Australia
Drew Black Canadian Federation of Agriculture
Drikus Gissing Department of Environment, Government of Nunavut
Eric B. (Rick) Taylor Department of Zoology, University of British Columbia
Florence Daviet Canadian Parks and Wilderness Society
Grant Hogg Canadian Wildlife Service, Environment and Climate Change Canada
Jeremy Kerr Department of Biology, University of Ottawa
Journey Paulus Inter Pipeline Ltd.
Julie Stewart Fisheries and Oceans Canada
Justina Ray Wildlife Conservation Society Canada
Kate Lindsay Forest Products Association of Canada
Ken Harris Canadian Wildlife Service, Environment and Climate Change Canada
Kim Barrett Conservation Halton
Martin-Hugues St-Laurent Département de biologie, chimie et géographie, Université du Québec à Rimouski
Nicholas Winfield Fisheries and Oceans Canada
Patrick Henry NatureServe Canada
Robert McLean Canadian Wildlife Service, Environment and Climate Change Canada
Ron Bennett Canadian Wildlife Service, Environment and Climate Change Canada

92 | Species in the Balance: Partnering on tools and incentives to recover species at risk
REPORT | Species in the Balance
Sarah (Sally) Otto Department of Zoology, University of British Columbia
Sherry Sian Canadian Association of Petroleum Producers
Stephen Casselman Ontario Ministry of Natural Resources and Forestry
Stephen Virc Fisheries and Oceans Canada
Stewart Elgie Faculty of Law and Institute of Environment, University of Ottawa
Stuart Whitten Commonwealth Scientific and Industrial Research Organisation Ecosystem Sciences
Susan Milburn-Hopwood Canadian Wildlife Service, Environment and Climate Change Canada
Susanna Fuller Ecology Action Centre
Suzanne Carrière Environment and Natural Resources, Government of Northwestern Territories
Tara Shea Mining Association of Canada
APPENDIX C: SPECIES AT RISK SURVEYFrom July 2016 to October 2016, Smart Prosperity Institute circulated a survey on imperilled species policy to approximately 300 stakeholders from governments, industry, EGNOS, and academia in Canada, the United States and Australia. Copies of the survey were circulated in both English and French.
The survey consisted of a series of ordinal-scale questions, Likert-scale questions, and open-ended questions. The survey was divided into four components:
(i) general respondent information;
(ii) resources devoted to species at risk conservation by respondents’ organization/employer;
(iii) operationalization of species at risk activities;
(iv) species at risk approaches and instruments (e.g. regulatory instruments, protected areas, place-based approaches, voluntary instruments, economic instruments).
The survey had a response rate of approximately 45%, of which the completion rate was 50%. Only the results from the Canadian respondents are presented in this report.
For more information on the survey, please contact Scott McFatridge ([email protected]).

| 93
REFERENCES Adamowicz, Wiktor L. (Vic). 2016. “Economic Analysis and Species at Risk: Lessons Learned and Future Challenges.” Canadian Journal of Agricultural Economics 64: 21–32. Adamowicz, Wiktor L. (Vic), and Nancy Olewiler. 2016. “Helping Markets Get Prices Right: Natural Capital, Ecosystem Services, and Sustainability.” Canadian Public Policy 42: S32–38. Alberta Biodiversity Monitoring Institute. 2014. “Manual for species modeling and intactness.” Edmonton: Alberta Biodiversity Monitoring Institute. Retrieved from http://ftp.public.abmi.ca//home/publications/documents/47_ABMI_2014-09-25_SpeciesModelingAndIntactnessManual_ABMI.pdf (January 08, 2018).
Ando, Amy and Payal Shah. 2015. “The Economics of Conservation and Finance: A Review of the Literature.” International Review of Environmental and Resource Economics 8: 321-357. Atkins, Judy, Ann Hillyer, Arlene Kwasniak. 2004. “Conservation easements, covenants and servitudes in Canada: a legal review.” Report No. 04–1 North American Wetlands Conservation Council (Canada). Ottawa: North American Wetlands Conservation Council (Canada) and Canadian Wildlife Service. Retrieved from http://nawcc.wetlandnetwork.ca/conseasecov04-1.pdf (January 08, 2018).
Auerbach, Nancy A., Ayesha I. T. Tulloch, and Hugh P. Possingham. 2014. “Informed Actions: Where to Cost-effectively Manage Multiple Threats to Species to Maximize Return on Investment.” Ecological Applications 24(6): 1357–73.
Batáry, Péter, Lynn V. Dicks, David Kleijn, and William J. Sutherland. 2015. “The Role of Agri-Environment Schemes in Conservation and Environmental Management.” Conservation Biology 29(4): 1006–16.
Bekessy, Sarah A. et al. 2010. “The Biodiversity Bank Cannot Be a Lending Bank.” Conservation Letters 3(3): 151–58.
Böcker, Thomas and Robert Finger. 2016. “European Pesticide Tax Schemes in Comparison: An Analysis of Experiences and Developments.” Sustainability 8:378.
Boersma, P. Dee, et al. 2001. “Ho-w Good Are Endangered Species Recovery Plans?” BioScience 51(8): 643–49.
Boulle, Bridget, and Mercedes Marcano. 2017. “Bonds & Climate Change: The State of the Market 2017.” London: Climate Bonds Initiative and Smart Prosperity Institute. Retrieved from http://institute.smartprosperity.ca/2017greenbonds. (January 08, 2018). Boxall, Peter C., Orsolya Perger, and Marian Weber. 2013. “Reverse Auctions for Agri-Environmental Improvements: Bid-Selection Rules and Pricing for Beneficial Management Practice Adoption.” Canadian Public Policy 39(2): S23-S36.
Brassard, Christopher. 2014. “Recovery planning under Canada’s Species at Risk Act.” Thesis submitted to the Faculty of Graduate and Postdoctoral Studies in partial fulfillment of the requirements for the degree of Master of Science, Department of Biology, University of Ottawa.
Brown, Laura K. et al. 2011. “A Uniform Price Auction for Conservation Easements in the Canadian Prairies.” Environmental and Resource Economics 50(1): 49–60.
Brownlee, Michelle. 2014. “Getting Biodiversity Offsets Right: A Research Agenda for Canada.” Ottawa:Smart Prosperity Institute (formerly Sustainable Prosperity). Retrieved from http://institute.smartprosperity.ca/sites/default/files/publications/files/Agenda%20for%20Biodiversity%20Offsets%20Oct%202014.pdf (January 08, 2018).
Bull, Joseph William, Samuel Pelham Lloyd, and Niels Strange. 2016. “Implementation Gap Between the Theory and Practice of Biodiversity Offset Multipliers.” Conservation Letters. 10(6): 656-669.
Burgin, Shelley. 2010. “‘Mitigation Banks’ for Wetland Conservation: A Major Success or an Unmitigated Disaster?” Wetlands Ecology and Management 18: 49–55.
Cairns, Stephanie. 2017. “Opinion: Tax Balances Protecting Poor with Cutting Carbon Use.” Edmonton Journal January 17, 2017. Retrieved from http://edmontonjournal.com/opinion/columnists/opinion-tax-balances-protecting-poor-with-cutting-carbon-use (January 08, 2018). Campbell, Steven P. et al. 2002. “An Assessment of Monitoring Efforts in Endangered Species Recovery Plans.” Ecological Applications 12(3): 674-681.
Canadian Wildlife Service. 2011. “The Canadian Ecological Gifts Program Handbook: A Legacy for Tomorrow-a Tax Break Today.” Retrieved from https://www.canada.ca/en/environment-climate-change/services/environmental-funding/publications/canadian-handbook.html. (January 08, 2018).
Canadian Parks and Wilderness Society. 2017. “From Laggard to Leaders? Canada’s Renewed focus on Protecting Nature Could Deliver Results.” Ottawa: CPAWS. Retrieved from http://cpaws.org/uploads/CPAWS-Parks-Report-2017.pdf (January 08, 2018).
Certification Canada. 2016a. “Canadian Statistics.” Retrieved from http://certificationcanada.org/en/statistics/canadian-statistics/ (January 08, 2018).
Certification Canada. 2016b. “Forest Management Certification.” Retrieved from http://certificationcanada.org/en/certification/forest-management-certification/ (January 08, 2018).

94 | Species in the Balance: Partnering on tools and incentives to recover species at risk
REPORT | Species in the Balance
Clark, Alan J., and Erik Harvey. 2002. “Assessing Multispecies Recovery Plans under the Endangered Species Act.” Ecological Applications 12(3): 655–62.
Clark, Michael R. and Joelyn S. Kozar. 2012. “Comparing Sustainable Forest Management Certifications Standards: A Meta-analysis.” Ecology and Society 16(1): 3.
Cook, Carly N., Bill Carter, Richard A. Fuller and Marc Hockings. 2012. “Managers Consider Multiple Lines of Evidence Important for Biodiversity Management Decisions.” Journal of Environmental Management 113: 341-346 .
Copeland, Holly E. et al. 2013. “Measuring the Effectiveness of Conservation: A Novel Framework to Quantify the Benefits of Sage-Grouse Conservation Policy and Easements in Wyoming.” PLoS ONE 8(6): e67261.
Coristine, Laura E., and Jeremy T. Kerr. 2011. “Habitat Loss, Climate Change, and Emerging Conservation Challenges in Canada.” Canadian Journal of Zoology 89(5): 435–51.
Crain, Caitlin M., Kroeker, Kristy, and Halpem, Benjamin S. 2008. “Interactive and Cumulative Effects of Multiple Human Stressors in Marine Systems.” Ecology Letters 11:1304-1315.
Curran, Michael, Stefanie Hellweg, and Jan Beck. 2014. “Is There Any Empirical Support for Biodiversity Offset Policy?” Ecological Applications 24(4): 617–32.
Daviet, Florence, and Alain Branchaud 2017. Commentary: the Policy on Critical Habitat Protection on Non-federal Lands. Ottawa and Montreal: Canadian Parks and Wilderness Society.
Déguise, Isabelle E., and Jeremy T. Kerr. 2005. “Protected Areas and Prospects for Endangered Species Conservation in Canada.” Conservation Biology 20(1): 48–55.
Denhoff, Eric. 2016. “Setting Alberta on the Path to Caribou Recovery. Report prepared for Alberta Environment and Parks.” Edmonton: Alberta Environment and Parks. Retrieved from https://albertawilderness.ca/wordpress/wp-content/uploads/2016/06/20160530_rp_goa_car_mediators_report_setting_ab_caribou_path_to_recovery.pdf (January 08, 2018).
Ducks Unlimited Canada. 2016. “Revolving Land Conservation Program.” Retrieved from http://www.ducks.ca/resources/landowners/revolving-land-conservation-program/ (January 08, 2018).
Eagle, Alison J., James Rude, and Peter C. Boxall. 2016. “Agricultural Support Policy in Canada: What Are the Environmental Consequences?” Environmental Reviews 24: 13–24.
Ecofiscal Commission of Canada. 2016. Choose Wisely: Options and Trade-offs in Recycling Carbon Pricing Revenues. Montreal: Ecofiscal Commission of Canada. Retrieved from https://ecofiscal.ca/reports/choose-wisely-options-trade-offs-recycling-carbon-pricing- revenues/ (January 08, 2018).
Ecojustice. 2012. “Failure to protect: Grading Canada’s species at risk laws.” Toronto: Ecojustice. Retrieved from https://www.ecojustice.ca/wp-content/uploads/2014/08/Failure-to-protect_Grading-Canadas-Species-at-Risk-Laws.pdf (January 08, 2018). Elgie, Stewart, Michelle Brownlee, Sara Jane O’Neill, and Mercedes Marcano. 2016. Pricing Works: How pricing of municipal services and infrastructure can lead to healthier and more efficient cities. Ottawa: Smart Prosperity Institute (formerly Sustainable Prosperity). Retrieved from https://metcalffoundation.com/wp-content/uploads/2016/07/Pricing-WorksJuly5-16.pdf (January 08, 2018).
Environment and Climate Change Canada. 2012. “Report on Plans and Priorities 2012-2013.” Gatineau:Environment and Climate Change Canada. http://www.tbs-sct.gc.ca/rpp/2012-2013/index-eng.asp?acr=1960 (January 08, 2018).
Environment and Climate Change Canada. 2014. “Departmental Performance Report 2013-14.” Gatineau:
Environment and Climate Change Canada. Retrieved from http://ec.gc.ca/Content/3/1/D/31D9FF32-\8842-4CC6-A008-231DEBE41F40/2013-14%20DPR_for%20Posting_EN_Error%20Corrected.pdf (January 08, 2018).
Environment and Climate Change Canada. 2016a. “Emergency Order for the Protection of the Western Chorus Frog (Great Lakes / St. Lawrence – Canadian Shield Population).” Ottawa: Environment and Climate Change Canada. Retrieved from https://www.registrelep-sararegistry.gc.ca/492FC2D6-A09A-4D07-8EF8-E50AA6AAA896/OrderSummaryWcf-v00-2016Jul11-Eng.pdf (January 08, 2018).
Environment and Climate Change Canada. 2016b. “The Canadian Ecological Gifts Program: A Legacy for Tomorrow – a Tax Break Today.” Ottawa: Environment and Climate Change Canada. Retrieved from http://publications.gc.ca/site/eng/9.824448/publication.html (January 08, 2018).
Environment and Climate Change Canada. 2017a. “Canadian Environmental Sustainability Indicators: Species at Risk Population Trends.” Gatineau: Environment and Climate Change Canada. Retrieved from http://www.registrelep-sararegistry.gc.ca/virtual_sara/files/orders/g2-15122.pdf (January 08, 2018).
Environment and Climate Change Canada. 2017b. “Habitat Stewardship Program – Species at Risk Stream. 2017-2018 application guidelines.” Ottawa: Environment and Climate Change Canada. Retrieved from http://www.ec.gc.ca/hsp-pih/2E4F3860-C114-4FB7-ADEC-36C393D8017F/HSP%20SAR%20App%20Guidelines%202017-2018.pdf (January 08, 2018).

| 95
Environment and Climate Change Canada. 2018. “Emergency Order for the Protection of the Greater Sage-Grouse.” Ottawa: Environment and Climate Change Canada. Retrieved from http://www.registrelep-sararegistry.gc.ca/document/default_e.cfm?documentID=1736 (January 08, 2018).
Environment and Climate Change Canada, British Columbia Minister of Environment and Climate Change Strategy, British Columbia Minister of Forests, Lands and Natural Resource Operations and Rural Development. 2017. “Species at Risk Act (SARA) Section 11 Conservation Agreement for the Conservation of the Southern Mountain Caribou.” Retrieved from https://www.registrelep-sararegistry.gc.ca/virtual_sara/files/agreements/Aa-SmcCaribouBc-v00-2017Nov-Eng.pdf (January 08, 2018).
Environment and Climate Change Canada and British Columbia Minister of Environment and Climate Change Strategy. 2017. “Canada-British Columbia Southern Mountain Caribou (Central Group) Protection Study.” Retrieved from http://www.registrelep-sararegistry.gc.ca/document/default_e.cfm?documentID=3106 (January 08, 2018).
Environment and Climate Change Canada. 2018. “Ministers McKenna and Morneau Outline Next Steps in Pricing Carbon Pollution.” Retrieved from https://www.canada.ca/en/environment-climate-change/news/2017/12/ministers_mckennaandmorneauoutlinenextstepsinpricingcarbonpollut.html (January 08, 2018).
Environmental Defence Canada (EDC). 2017. “Turning the Plastic Tide: How to Protect the Great Lakes and Fight Plastic Pollution.” Toronto: Environmental Defence Canada. Retrieved from https://environmentaldefence.ca/report/turning-the-plastic-tide/ (January 08, 2018).
EPA Caucus. 2017. “Consensus Report of the RCEN EPA Caucus in Response to the Report of the Expert Panel Reviewing Federal Environmental Assessment Processes” Ottawa: Canadian Environmental Network (RCEN). Retrieved from https://www.discussionpaper.ca/3730/documents/7380 (January 08, 2018).
Evans, Daniel M. et al. 2016. “Species Recovery in the United States: Increasing the Effectiveness of the Endangered Species Act.” Ecological Society of America 20: 1–28.
Evans, Megan C., Hugh P. Possingham, and Kerrie A. Wilson. 2011. “What to Do in the Face of Multiple Threats? Incorporating Dependencies within a Return on Investment Framework for Conservation.” Diversity and Distributions 17(3): 437–50.
Favaro, Brett et al. 2014. “Trends in Extinction Risk for Imperiled Species in Canada.” PLoS ONE 9(11): e113118.
Ferraro, Paul, Craig McIntosh, and Monica Ospina. 2007. “The Effectiveness of the US Endangered Species Act: An Econometric Analysis Using Matching Methods.” Journal of Environmental Economics and Management 54: 245-261. Field, Barry and Nancy Olewiler. “Environmental Economics: Second Canadian Edition.” Toronto: McGraw-Hill Ryerson Limited.
Findlay, C. Scott, Stewart Elgie, Brian Giles, and Linda Burr. 2009. “Species Listing under Canada’s Species at Risk Act.” Conservation Biology 23(6): 1609–17.
Findlay, C. Scott. 2016. “Some Comments on the Federal Environmental Assessment Process.” Ottawa: Institute of the Environment, University of Ottawa. Retrieved from http://eareview-examenee.ca/wp-content/uploads/uploaded_files/nov.1-14h10-scott-findlay-federal-ea-panel-review...ct-2016.pdf (January 08, 2018).
Findlay, C. Scott, and Sue Mckee. 2013. “Proposal for the Creation of an Open Species at Risk Act (SARA) Database.” Unpublished manuscript. Ottawa: Institute of the Environment, University of Ottawa.
Findlay, C. Scott, and Sue McKee. 2016. “Place-Based Recovery and Conservation Management Planning.” Research report submitted to Environment and Climate Change Canada, March 31, 2016. Ottawa: Institute of the Environment, University of Ottawa.
Fishburn, Isla S., Peter Kareiva, Kevin J. Gaston, and Paul R. Armsworth. 2009. “The Growth of Easements as a Conservation Tool.” PLoS ONE 4(3): e4996.
Fisheries and Oceans Canada (DFO). 2007. “Revised Protocol For Conducting Recovery Potential Assessments.” Canadian Science Advisory Secretariat Science Advisory Report 2007/039. Ottawa: Fisheries and Oceans Canada. Retrieved from http://www.dfo-mpo.gc.ca/csas/Csas/status/ 2007/SAR-AS2007_039_e.pdf (January 08, 2018).
Fisheries and Oceans Canada (DFO). 2010. Guidelines for Terms and Concepts Used in the Species at Risk Program.“ Canadian Science Advisory Secretariat Science Advisory Report 2009/065.” Ottawa: Fisheries and Oceans Canada. Retrieved from http://waves-vagues.dfo-mpo.gc.ca/Library/340596.pdf (January 08, 2018). Fisheries and Oceans Canada (DFO). 2014. Departmental Performance Report 2013-14. Ottawa: Fisheries and Oceans Canada. Retrieved from http://www.dfo-mpo.gc.ca/dpr-rmr/2013-14/2013-2014- dpr-eng.pdf (January 08, 2018).
Fisher-Vanden, Karen and Olmstead, Sheila. 2013. “Moving Pollution Trading from Air to Water: Potential, Problems, and Prognosis.” The Journal of Economic Perspectives 27(1): 147-171.
Gélinas, Johanne, et al. 2017. “Building Common Ground: A New Vision for Impact Assessment In Canada.” Ottawa: Canadian Environmental Assessment Agency. Retrieved from https://www.canada.ca/en/services/environment/conservation/assessments/environmental-reviews/environmental-assessment-processes/building-common-ground.html (January 08, 2018).
Government of Canada. 2016a. “Species at Risk Act Permitting Policy [Proposed].” Ottawa: Government of Canada. Species at Risk Act: Policies and Guidelines Series. Retrieved from http://registrelep-sararegistry.gc.ca/virtual_sara/ files/policies/Permitting_EN.pdf (January 08, 2018).
Government of Canada. 2016b. “Policy on Critical Habitat Protection on Non-federal Lands.” Species at Risk Act:Policies and Guidelines Series. Ottawa: Government of Canada. Retrieved from https://registrelep-sararegistry.gc.ca/virtual_sara/files/policies/CH_Protection_NFL_EN.pdf (January 08, 2018).

96 | Species in the Balance: Partnering on tools and incentives to recover species at risk
REPORT | Species in the Balance
Government of Canada. 2017a. “2020 Biodiversity Goals and Targets for Canada.” Ottawa: Government of Canada. Retrieved from http://biodivcanada.ca/default.asp?lang=En&n=9B5793F6-1 (January 08, 2018).
Government of Canada. 2017b. “Environmental and Regulatory Reviews Discussion paper.” Ottawa: Government of Canada. Retrieved from https://www.canada.ca/content/dam/themes/environment/conservation/environmental-reviews/share-your-views/proposed-approach/discussion-paper-june-2017-eng.pdf (January 08, 2018).
Government of Canada. 2017c. “Ecological Gifts Program: Overview.” Retrieved from https://www.canada.ca/en/environment-climate-change/services/environmental-unding/ecological-gifts-program/overview.html (January 08, 2018).
Government of Canada. 2017d. “Habitat secured for species at risk.” Retrieved from https://www.canada.ca/en/environment-climate-change/services/environmental-indicators/habitat-secured-species-risk.html (January 08, 2018).
Government of Canada. 2018. “Technical Paper: Federal Carbon Pricing Backstop.” Retrieved from https://www.canada.ca/en/services/environment/weather/climatechange/technical-paper-federal-carbon-pricing-backstop.html (January 08, 2018).
Gibbs, Katherine E., Robin L. MacKey, and David J. Currie. 2009. “Human Land Use, Agriculture, Pesticides and Losses of Imperiled Species.” Diversity and Distributions 15(2): 242–53.
Gibbs, Katherine E, and David J. Curie. 2012. “Protecting Endangered Species: Do the Main Legislative Tools Work?” PLoS ONE 7(5): e35730.
Grumbine, R Edward. 1994. “What Is Ecosystem Management?” Conservation Biology 8(1): 27–38.
Habib, Thomas J., Daniel R. Farr, Richard R. Schneider, and Stan Boutin. 2013. “Economic and Ecological Outcomes of Flexible Biodiversity Offset Systems.” Conservation Biology 27(6): 1313–23.
Halpern, Benjamin S. and Rod Fujita. 2013. “Assumptions, Challenges, and Future Directions in Cumulative Impact Analysis.” Ecosphere 4(1):131.
Harper, David J., and Jason T. Quigley. 2005. “No Net Loss of Fish Habitat: A Review and Analysis of Habitat Compensation in Canada.” Environmental Management 36(3): 343–55.
Hartwell, David. 2017. “Minnesota’s Road to a Legacy Amendment: How We Created and Passed a Constitutional Amendment with Vision, Partnerships, Strategy, Promotion, and Perseverance.” Cambridge: Lincoln Institute of Land Policy. Retrieved from https://www.lincolninst.edu/ sites/default/files/pubfiles/hartwell_wp17dh1_0.pdf (January 08, 2018).
Hatt, Charles. 2016. “Ecojustice Commentary on the Draft Listing Policy for Terrestrial Species at Risk” Toronto: Ecojustice.
Helm, Dieter. 2000. “Next Steps in Environmental Policy and Economic Instruments.” Prepared for the DETR Academic Panel. Retrieved from http://www.dieterhelm.co.uk/assets/secure/documents/ DETR-EnvrnmntlPolicy-EconomicInst.pdf (January 08, 2018).
Hutchings, Jeffery A. et al. 2012. “Life‐history Correlates of Extinction Risk and Recovery Potential.” Ecological Applications 22(4): 1061-1067. International Union for the Conservation of Nature. Undated. “Threats Classification Scheme (Version 3.2).” Retrieved from http://www.iucnredlist.org/technical-documents/classification-schemes/threats-classification-scheme (January 08, 2018).
Kenny, Alex, Stewart Elgie, and Dave Sawyer. 2011. “Advancing the Economics of Ecosystems and Biodiversity in Canada: A Survey of Economic Instruments for the Conservation & Protection of Biodiversity.” Ottawa: Smart Prosperity Institute (formerly Sustainable Prosperity). Retrieved from http://institute.smartprosperity.ca/sites/default/files/publications/files/Advancing% 20the%20Economics%20of%20Ecosystems%20and%20Biodiversity%20in%20Canada.pdf (January 08, 2018).
Kerkvliet, Joe, and Christian Langpap. 2007. “Learning from Endangered and Threatened Species Recovery Programs: A Case Study Using U.S. Endangered Species Act Recovery Scores.” Ecological Economics 63(2–3): 499–510.
Kerr, Jeremy T., and Josef Cihlar. 2004. “Patterns and Causes of Species Endangerment in Canada.” Ecological Applications 14(3): 743–53.
Kerr, Jeremy T., and Isabelle Déguise. 2004. “Habitat Loss and the Limits to Endangered Species Recovery.” Ecology Letters 7(12): 1163–69.
Khair, Shahira, Samuel J. McIntosh, Sawyer Stoyanovich, Noah Greenwald, Kieran Suckling and C. Scott Findlay. 2017. “Empirical correlates of SAR recovery.” Department of Biology and Institute of Environment Working Paper, University of Ottawa.
Kharouba, Heather and Kerr, Jeremy. 2010. “Just Passing Through: Global Change and the Conservation of Biodiversity in Protected Areas.” Biological Conservation 143: 1094-1101.
Kleijn, David, et al. 2006. “Mixed Biodiversity Benefits of Agri-Environment Schemes in Five European Countries.” Ecology Letters 9(3): 243–54.
Laitila, Jussi, Atte Moilanen, and Federico M. Pouzols. 2014. “A Method for Calculating Minimum Biodiversity Offset Multipliers Accounting for Time Discounting, Additionality and Permanence.” Methods in Ecology and Evolution 5(11): 1247–54. Lamba, Pamela, Glen Filson and Bamidele Adekunle. 2009. “Factors affecting the adoption of best management practices in southern Ontario. ”Environmentalist 29: 64–77.

| 97
Land and Water Conservation Fund. Undated. “About LWCF.” Retrieved from https://www.lwcfcoalition.com/about-lwcf/. (January 08, 2018).
Langpap, Christian and Joe Kerkvliet. 2010. “Allocating Conservation Resources Under The Endangered Species Act.” American Journal of Agricultural Economics 92(1):110-124.
Langpap, Christian and Joe Kerkvliet. 2012. “Endangered species conservation on private land: Assessing the effectiveness of habitat conservation plans.” Journal of Environmental Economics and Management 64: 1–15.
Lankoski Jussi, Erik Lichtenberg, Markku Ollikainen. 2008. “Point/Nonpoint Effluent Trading With Spatial Heterogeneity.” Agricultural and Applied Economics Association 90(4): 1044-1058.
Lawley, Chad, and Charles Towe. 2014. “Capitalized Costs of Habitat Conservation Easements.” American Journal of Agricultural Economics 96(3): 657–72.
Lawley, Chad, and Wanhong Yang. 2015. “Spatial Interactions in Habitat Conservation: Evidence from Prairie Pothole Easements.” Journal of Environmental Economics and Management 71: 71–89.
Legislative Assembly of Alberta, Wildlife Act. RSA 2000. C.w-10.
Legislative Assembly of British Columbia, Wildlife Act. RSBC 1996. C.488.
Legislative Assembly of Manitoba, The Endangered Species and Ecosystems Act. CCSM 1989. C. E-111.
Legislative Assembly of New Brunswick, Species at Risk Act. QPNB 2012. C.6.
Legislative Assembly of Nunavut, Wildlife Act, SNU 2003, C.26.
Legislative Assembly of Ontario, Endangered Species Act. SO 2007. C.6.
Legislative Assembly of Quebec, Act Respecting Conservation and Development of Wildlife. CQLR 2014. C.C-61.1.
Legislative Assembly of Quebec, Act Respecting Vulnerable and Threatened Species. CQLR 1989. C.E-11.01.
Legislative Assembly of Saskatchewan, The Wildlife Act. SS 1998. C. W-13.12.
Legislative Assembly of the Northwest Territories, Species at Risk Act. SNWT 2006. C.16.
Lemieux, Christopher J., Thomas J. Beechey, and Paul A. Gray. 2011. “Prospects for Canada’s Protected Areas in an Era of Rapid Climate Change.” Land Use Policy 28(4): 928–41. Leonard, Patrick. 2003. “Letters.” Conservation Biology 17(3): 655-656.
Lichtenberg, Erik. 2004. “Some Hard Truths About Agriculture and the Environment” Agricultural and Resource Economics Review 33(1): 24-33.
Mallon, Christopher, Marius Cutlac, and Marian Weber. 2016. “A Cost Assessment of Ecosystem Services Procurement Using Three Mechanisms: Outright Purchases, Conservation Easements, and ALUS.” Calgary: Alberta Innovates Technology Futures. Retrieved from https://alus.ca/wp-content/uploads/2017/04/A-Cost-Assessment-of-Ecosystem-Services-Procurement-Using-Three-Mechanisms-copy.pdf (January 08, 2018).
Maron, Martine et al. 2012. “Faustian Bargains? Restoration Realities in the Context of Biodiversity Offset Policies.” Biological Conservation 155: 141–48. McCune, Jenny L. et al. 2013. “Threats to Canadian Species at Risk: An Analysis of Finalized Recovery Strategies.” Biological Conservation 166: 254–65.
McCune, Jenny L. et al. 2017. “Assessing Public Commitment to Endangered Species Protection: A Canadian Case Study.” FACETS 2: 178-194.
McGregor, Janyce. 2017. “5 Things to Watch in Today’s Interprovincial Trade Deal.” CBC News April 07, 2017. Retrieved from http://www.cbc.ca/news/politics/cfta-toronto-friday-list-1.4058328 (January 08, 2018).
Mcracken, Jon D., Stuart A. Mackenzie, Sonya Richmond & Eva Jenkins. 2014. Studies of Bobolink and Related Bird Habitats on Agricultural Lands in Norfolk
County. Report produced for Norfolk Alternative Land Use Services (ALUS). Retrieved from https://alus.ca/wp-content/uploads/2016/08/BobolinkStudy.pdf
Miller, David, et al. 2013. “Letter to the Minister of the Environment Re: Improving Performance of Canada’s Species at Risk Act (SARA).” Retrieved from http://cwf-fcf.org/assets/pdf/en/Industry_ENGO_Letter_to_Agglukkaq_re__SARA_andRecommendations.pdf (January 08, 2018).
Mining Association of Canada. 2016. “MAC Submission to the Expert Panel Review of Environmental Assessment Processes.” Ottawa: Mining Association of Canada. Retrieved from http://mining.ca/sites/default/files/documents/MAC-Submission-CEAA-Expert-Panel-Nov-2016.pdf (January 08, 2018).
Mintz, Joel. 2014. “Measuring Environmental Enforcement Success: The Elusive Search for Objectivity.” Washington: Environmental Law Institute. Retrieved from https://papers.ssrn.com/sol3/papers.cfm?abstract_id=2522427 (January 08, 2018).
Moffatt, Mike. 2013. What’s the Point of ‘Green Bonds’ for Transit?” Canadian Business. Toronto: Rogers. Retrieved from http://www.canadianbusiness.com/economy/whats-the-point-of-green-bonds-for-transit-mike-moffatt/ (January 08, 2018).
Mooers, A. Ø L. R. Prugh, M. Festa-Bianchet, and J. A. Hutchings. 2007. “Biases in Legal Listing under Canadian Endangered Species Legislation.” Conservation Biology 21(3): 572–75.

98 | Species in the Balance: Partnering on tools and incentives to recover species at risk
REPORT | Species in the Balance
Moore, Susan A. and Susan Wooller. 2004. “Review of Landscape, Multi- and Single Species Recovery Planning for Threatened Species.” Sydney: WWF Australia. Retrieved from http://communities.earthportal.org/files/154501_154600/154535/review-of-landscape-multi-and-single-species-recovery-planning-2003.pdf (January 08, 2018).
Muzyka, Kyle. 2016. “Alberta Plans to Restore Caribou Habitat Disturbed by Industrial Use.” CBC News Oct 01, 2016. Retrieved from http://www.cbc.ca/news/canada/edmonton/alberta-caribou-habitat-program-1.3787613 (January 08, 2018).
Natural Rresources Canada (NRCAN). 2017. “Forest Resources: Statistical Data.” Retrieved from https://cfs.nrcan.gc.ca/statsprofile/overview/ca (January 08, 2018). Nature Conservancy of Canada. 2016. “Natural Areas Conservation Program: 2014-2016 Impact Report.” Ottawa: Nature Conservancy Canada. Retrieved from http://www.natureconservancy.ca/assets/documents/nat/NACP-Impact-Report-2016-EN-web.pdf (January 08, 2018).
Nature Conservancy Canada. 2017. “Natural Areas Conservation Program: Frequently Asked Questions.” Toronto: Nature Conservancy of Canada. Retrieved from http://www.natureconservancy.ca/en/ what-we-do/conservation-program/frequently-asked-questions.html (January 08 2018).
Newfoundland and Labrador House of Assembly, Endangered Species Act. SNL 2001. C.E-10.1.
Nicola, David. 2013. “Environmental Impact Bonds.” CASE i3 Working Paper #1. Durham: Duke University. Retrieved from https://centers.fuqua.duke.edu/case/wp-content/uploads/sites/7/2015/01/Report_Nicola_EnvironmentalImpactBonds_2013.pdf (January 08, 2018).
Nixon, Sean. 2017. “Ecojustice Commentary on Proposed Policy on Critical Habitat Protection on Non-federal Lands.” Vancouver: Ecojustice.
Nova Scotia House of Assembly, Endangered Species Act. SNS 1998. C.11.
Nemes, Veronika, Plott, Charles R. and Stoneham, Gary. 2008. “Electronic BushBroker Exchange: Designing a Combinatorial Double Auction for Native Vegetation Offsets.” Retrieved from http://ssrn.com/abstract=1212202 (January 08, 2018).
Office of the Auditor General, Commissioner of the Environment and Sustainable Development (OAG CESD). 2013. Fall Report of the Commissioner of the Environment and Sustainable Development.” Ottawa: Office of the Auditor General. Retrieved from http://www.oag-bvg.gc.ca/internet/English/parl_cesd_201311_e_38658.html (January 08, 2018).
Olive, Andrea. 2015. “Urban and Rural Attitudes Toward Endangered Species Conservation in the Canadian Prairies: Drawing Lessons From the American ESA.” Human Dimensions of Wildlife 20:189–205.
Ontario Ministry of Natural Resources and Forestry. 2015. “Fish and Wildlife Special Purpose Account: Annual Report 2014-15.” Toronto: Ontario Ministry of Natural Resources and Forestry. Retrieved from https://files.ontario.ca/spa_annual_report_final_05_17_final-adoa_done_1.pdf (January 08, 2018).
Ontario Soil and Crop Improvement Association. 2017. “Species At Risk Farm Incentive Program.” Guelph: Ontario Soil and Crop Improvement Association. Retrieved from https://www.ontariosoilcrop.org/wp-content/uploads/2017/06/SARFIP-2017-BROCHURE-June-5-2017-REDUCED.pdf (January 08, 2018).
Palm-Forster Leah. et al. 2016. “Too Burdensome To Bid: Transaction Costs And Pay-for-Performance Conservation.” American Journal of Agricultural Economics 98(5): 1314-1333.
Pannell, David J. 1999. “Economics, Extension and the Adoption of Land Conservation Innovations in Agriculture.” International Journal of Social Economics 26 (7/8/9): 999-1012.
Pannell, David J. 2008. “Public Benefits, Private Benefits, and Policy Mechanism Choice for Land-Use Change for Environmental Benefits.” Land Economics 84(2): 543-8325. Pannell, David J., Anna Roberts, Geoff Park, and Jennifer Alexander. 2013. “Improving Environmental Decisions: A Transaction-costs Story.” Ecological Economics 88: 244-252.
Pannell, David J., and Gibson, Fiona L. 2015. “Environmental Costs of Using Poor Decision Metrics to Prioritize Environmental Projects.” Conservation Biology 30(2): 382-391.
Parks Canada Agency. 2014. “Departmental Performance Report 2013-14.” Ottawa: Parks Canada Agency. Retrieved from https://www.pc.gc.ca/en/docs/pc/rpts/rmr-dpr/03312014/index (January 08, 2018).
Parks Canada Agency. 2017. “2016-17 Departmental Results Report.” Ottawa: Parks Canada. Retrieved from https://www.pc.gc.ca/en/docs/pc/rpts/rmr-dpr/03312017 (January 08, 2018).
Parliament of Canada, Canadian Environmental Assessment Act (CEAA), S.C. 2012, c. 19, s. 52.
Parliament of Canada, Species at Risk Act (SARA), S.C. 2002, C.29.
Perger, Orsolya, Marian Weber, Wiktor L. (Vic) Adamowicz, and Peter C. Boxall. 2009. “Transferable Disturbance Permits for Biodiversity Conservation: Assessment of Implementation Options.” In 11th BioEcon Conference, Economic Instruments to Enhance the Conservation and Sustainable Use of Biodiversity. Retrieved from http://bioecon-network.org/pages/11th_2009/Weber.pdf (January 08, 2018).
Pickett, Evan J. et al. 2013. “Achieving No Net Loss in Habitat Offset of a Threatened Frog Required High Offset Ratio and Intensive Monitoring.” Biological Conservation 157: 156–62.

| 99
Pirard, Romain. 2012. “Market-Based Instruments for Biodiversity and Ecosystem Services: A Lexicon.” Environmental Science and Policy 19–20: 59–68..
Poos, Mark S., Nicholas E. Mandrak, and Robert L. McLaughlin. 2008. “A Practical Framework for Selecting among Single-Species, Community-, and Ecosystem-Based Recovery Plans.” Canadian Journal of Fisheries and Aquatic Sciences 65(12): 2656–66.
Prugh, Laura R. et al. 2010. “Reducing Threats to Species: Threat Reversibility and Links to Industry.” Conservation Letters 3(4): 267–76.
Ray, Justina C., Cheryl Chetkiewicz and Stephanie Green. 2016. “Submission to the Expert Panel for the Review of Environmental Assessment Processes.” Toronto: Wildlife Conservation Society Canada. Retrieved from http://eareview-examenee.ca/wp-content/uploads/uploaded_files/ea-expert-panel-submission_ray_wcscanada_23dec2016.pdf (January 08, 2018).
Reid, Neil, Robbie A. McDonald, and W. Ian Montgomery. 2007. “Mammals and Agri-Environment Schemes: Hare Haven or Pest Paradise?” Journal of Applied Ecology 44(6): 1200–1208.
Regional District of Okanagan Similkameen. 2017. South Okanagan Conservation Fund: Terms of reference. Retrieved from https://soconservationfund.ca/wp-content/uploads/2017/08/Conservation-Fund-ToR-FINAL-Approved-June-1_2017.pdf (January 08, 2018).
Rollins, Curtis L., Stephanie R. Simpson, and Peter C. Boxall. 2018. “Evaluating an Agricultural Extension Program Aimed at Improving Biodiversity in Alberta, Canada.” Forthcoming in the Canadian Journal of Agricultural Economics.
Sadik, Pierre and Stephen Hazell. 2016. “Protecting Canada’s Species at Risk: Proper Species at Risk Act (SARA) Implementing Funding.” Ottawa : Green Budget Coalition. Retrieved from http://greenbudget.ca/wp-content/uploads/2016/01/GBC-SARA.pdf (January 08, 2018).
Sandborn, Calvin, Megan Presnail, Erin Gray, and Matt Hulse. 2015. “Finding the Money to Buy and Protect Natural Lands.” Victoria: University of Victoria Environmental Law Centre. Retrieved from http://www.elc.uvic.ca/wordpress/wp-content/uploads/2015/12/FindingMoneyForParks- 2015-02-08-web.pdf (January 08, 2018).
Schwartz, Mark W. 2008. “The Performance of the Endangered Species Act.” Annual Review of Ecology, Evolution, and Systematics 39(1): 279–99.
Schneider, Richard R., Grant Hauer, W. L V Adamowicz, and Stan Boutin. 2010. “Triage for Conserving Populations of Threatened Species: The Case of Woodland Caribou in Alberta.” Biological Conservation 143: 1603–11.
Sinclair, John A., Meinhard Doelle, and Pete N. Duinker. 2017. “Looking Up, Down, and Sideways: reconceiving Cumulative Effects Assessment as a Mindset.” Environmental Impact Assessment Review 62.
Smart Prosperity Institute. 2017. “Smart Prosperity Institute commentary on Environment and Climate Change Canada’s proposed Species at Risk policies and guidelines.” Ottawa: Smart Prosperity Institute.
Smith, J.T., J.S. Evans, B.H. Martin, S. Baruch-Mordo, J.M. Kiesecker, D.E. Naugle. 2016. “Reducing Cultivation Risk for At-risk Species: Predicting Outcomes of Conservation Easements for Sage-grouse.” Biological Conservation 201: 10–19.
Statistics Canada. 2017. “Table 385-0042: Canadian government finance statistics (CGFS), statement of operations and balance sheet for consolidated governments annual (dollars x 1,000,000), CANSIM (database).” Retrieved from http://www5.statcan.gc.ca/cansim/a26?lang=eng&id=3850042 (January 08, 2018).
South of the Divide Conservation Action Program, Inc. Undated. “Term Conservation Easements.” Retrieved from http://www.pcap-sk.org/rsu_docs/documents/term-conservation-eastements-fact-sheet.pdf (January 10, 2018).
Taylor, Martin F J, Kieran F Suckling, and Jeffrey J Rachlinski. 2005. “The Effectiveness of the Endangered Species Act: A Quantitative Analysis.” BioScience 55(4): 360–67.
The Biodiversity Consultancy. Undated. “The Mitigation Hierarchy.” Retrieved from http://www.thebiodiversityconsultancy.com/approaches/mitigation-hierarchy/ (January 08, 2018).
The Constitution Act, 1867 (U.K.), 30 & 31 Victoria.
Town of Gibsons. 2017. “Eco-Asset Strategy – Update to Council, Staff Report.” Retrieved from https://gibsons.civicweb.net/document/42076 (January 08, 2018).
Trust for Public Lands. Undated. “TPL LandVote Database.” Retrieved from https://tpl.quickbase.com/db/bbqna2qct?a=dbpage&pageID=8 (January 08, 2018).
United States Fish and Wildlife Service. 2014a “Federal and State Endangered and Threatened Species Expenditures.” Washington DC: United States Fish & Wildlife Service. Retrieved from https://www.fws.gov/endangered/esa-library/pdf/20160302_final_FY14_ExpRpt.pdf (January 08, 2018).
United States Fish and Wildlife Service. 2014b. “Delisting report.” Washington DC: United States Fish & Wildlife Service. Retrieved from https://ecos.fws.gov/ecp0/reports/delisting-report (January 08, 2018).
Venter, Oscar et al. 2006. “Threats to Endangered Species in Canada.” BioScience 56(11): 903–10.
Vercammen, James. 2017. “A Welfare Analysis of Conservation Easement Tax Credits.” Sauder School of Business and Resource Economics (working paper), University of British Columbia. Retrieved from http://blogs.ubc.ca/jvercammen/files/2017/06/Conservation_Easement_Spring_2017.pdf (January 08, 2018).

100 | Species in the Balance: Partnering on tools and incentives to recover species at risk
REPORT | Species in the Balance
Visseren-Hamakers, Ingrid, and Philipp Pattberg. 2013. “We Can’t See the Forest For the Trees: The Environmental Impact of Global Forest Certification is Unknown.” GAIA 22(1): 25-28.
Waldron, Anthony, Daniel C. Miller, Dave Redding, et al. (2017). “Reductions in global biodiversity loss predicted from conservation spending.” Nature 551: 364–367.
Weber, Marian. 2004. “Assessing the Effectiveness of Tradable Landuse Rights for Biodiversity Conservation: An Application to Canada’s Boreal Mixedwood Forest.” Paper Presented at the 4th BioEcon Workshop on “Economic Analysis of Policies for Biodiversity Conservation”, Venice, Italy. Retrieved from http://bioecon-network.org/pages/4th_2003/papers/weber.pdf (January 08, 2018).
Weber, Marian, Dan Farr, Grant Hauer, Veronika Nemes, & Orsolya Perger. 2011. “Experimental Economic Evaluation of Offset Design Options for Alberta.” Alberta Innovates Technology Futures. Retrieved from https://landuse.alberta.ca/LandUse%20Documents/Experimental%20Evaluation%20of%20Offset%20Design%20Options%20Research%20-%202011-11.pdf (January 08, 2018).
Weber, Marian, Grant Hauer, and Dan Farr. 2015. “Economic-Ecological Evaluation of Temporary Biodiversity Offsets in Alberta’s Boreal Forest.” Environmental Conservation 42(4): 315–24.
Wedeles, Chris, Justina Ray, Elston Dzus, Christine Korol, and Steve Morel. 2014. “FSC Canada Public Forum to Discuss: Proposed Indicators to Address Species at Risk, Including Woodland Caribou in FSC Canada’s Forest Management Standard.” Toronto: Forest Stewardship Council. Retrieved from https://ca.fsc.org/preview.proposed-indicators-to-address-species-at-risk-including-woodland-caribou-in-fsc-canadas-forest-management-standard.a-675.pdf (January 08, 2018).
Whitten, Stuart, Tobias Wunsher, and Jason Shogren. 2017. “Conservation Tenders in Developed and Developing Countries: Status Quo Challenges and Prospects” Land Use Policy 63: 552–560.
Wilman, Elizabeth A. 2013. “Instruments for Forest Habitat Connectivity.” The University of Calgary School of Public Policy: SPP Research Papers 6(1): 1–24. Retrieved from https://www.policyschool.ca/wp-content/uploads/2016/03/wilman-forest-habitat.pdf (January 08, 2018).
Wilson, Steven. 2012. “South Peace Northern Caribou Management Model.” Victoria: BC Ministry of Environment. Retrieved from http://www.env.gov.bc.ca/wld/speciesconservation/nc/documents/Final_Wilson%20%202012%20%20PNCP%20management%20model.pdf (January 08, 2018).
Wojciechowski, Stéphane et al. 2011. “SARA’s Safety Net Provisions and the Effectiveness of Species at Risk Protection on Non-Federal Lands.” Journal of Environmental Law and Practice 22: 203-222.
Yukon Legislative Assembly, Wildlife Act, RSY 2002, C.229.
Zieper, Matthew. 2017. “Public Funding for Land Conservation: The Key Role of Local Governments”. Trust for Public Land presentation to Conservation Finance Bootcamp, 12 June 2017, Duke University, Durham, North Carolina.

| 101
ENDNOTES1 Many also mentioned long lead times in moving from SAR listing and recovery planning on the one hand, to action planning, stewardship and
implementing recovery actions on the other. Some of this pertains to legal issues (such as listing delays) which are beyond the scope of this report.
2 The IUCN classifies threats at multiple levels of resolution. For a more detailed list of threats, see
http://www.iucnredlist.org/technical-documents/classification-schemes/threats-classification-scheme (January 08, 2018).
3 This is likely due to biases against listing species which have commercial or subsistence harvesting values under SARA, despite their being designated as threatened or endangered by COSEWIC. See the analyses by Mooers et al. (2007); Findlay et al. (2009); McCune et al. (2013).
4 McCune et al. (2013) do not speculate as to why species with finalized recovery strategies are less likely to be threatened by residential and commercial development or agriculture, but Prugh et al’s (2010) judgment that threats from the agriculture and construction sectors are among the most politically difficult to abate suggests that policymakers may be somewhat reluctant to regulate these sectors or engage them in SAR recovery.
5 While most territorial land is managed by the federal government under the Territorial Lands Act, wildlife management outside of national parks (excepting migratory birds as defined by the Migratory Birds Convention Act, and fish and aquatic mammals as defined by the Fisheries Act) has been devolved to the governments of the Northwest Territories and the Yukon. Nunavut is still in the process of negotiating devolution.
6 However, most species presently have very little CH identified on non-federal land within federal recovery strategies, although there are some important exceptions (boreal caribou, marbled murrelet).
7 Interpreting data on the enforcement of environmental regulations poses some methodological challenges, since an increase in the number of enforcement actions taken by regulators does not indicate whether compliance with environmental regulations is increasing or decreasing. Addressing this complex topic is beyond the scope of this report. For a helpful overview, see Mintz (2014).
8 For the sake of brevity, we use the term “safety net order” to refer to orders made under both section 34, article 3 and section 61, article 4 of SARA.
9 For instance, agriculture – which is mostly practiced in southern parts of Canada - makes up approximately 7% of Canada’s overall land area and is estimated to provide habitat for half of Canada’s SAR (Kenny, Elgie and Sawyer 2011).
10 To be fair, many of Canada’s national parks and other protected areas were initially established for more general conservation, recreational and educational purposes, well before endangered species concerns entered public consciousness, so this is not entirely surprising.
11 Again, this is not surprising given the distribution of SAR and landownership patterns
12 However, it should be noted these effects would need to be very strong for the analysis used in Kerr and Cihlar (2004) to be able to detect them.
13 Other practices or technologies with positive private net benefits and negative public net benefits - which might include some practices or technologies which harm SAR, such as point and nonpoint source pollution - could potentially be addressed through economic instruments (‘flexible negative incentives’) such as tradeable water quality permits.
14 Including public and private transaction costs generally reduces the economic viability of extension projects (since the private benefits may be outweighed by the transaction costs) to a greater extent than projects using positive incentives (see Fig. 6 in Pannell et al. 2013).
15 Other studies have estimated that land under government protection only modestly crowds out conservation easements (Lawley and Yang 2015), which might imply that conservation easements can complement formal protected areas. However, the authors note that their study findings are not necessarily transferable to other contexts.
16 Under section 27 of SARA, the Governor in Council (GIC) must decide on whether to list a species under the act within 9 months of the Minister of Environment’s receiving a listing recommendation from COSEWIC. However, in actual practice the government has interpreted the legislation as requiring the GIC to make a decision on whether to list a species within 9 months of the competent minister sending COSEWIC’s recommendation to the GIC. Critics argue that since the Minister of Environment does not always send COSEWIC’s recommendation to the GIC immediately, this practice has allowed the federal government to extend the timeline for its species listing decisions far beyond the 9 month time limit outlined in SARA (excepting cases where the GIC explicitly requests for an extension). This has led to a situation whereby, as of November 2016, over 100 species had overdue listing decisions. See Hatt (2016) for further discussion.
17 Excepting areas on non-federal land that are subject to a safety net order or an emergency order.
18 Interviewees have also noted that a similar dynamic sometimes occurs before CH is identified and protected on non-federal land. In this instance, a SAR expert from a provincial or territorial government identifies some geographic area as possible CH for one or more SAR. This places the federal government in a similar predicament – it cannot require a section 11 agreement (or a permit under P/T legislation) since the CH has not been identified in a recovery strategy, but it is reluctant to approve a project which might potentially harm SAR’s CH. Moving forward, the solution to this problem partially lies in adequately identifying the full extent of CH on both federal and non-federal land within F/P/T recovery strategies.
19 However, it should be noted that in many cases where the cumulative effects of a project are found to be significant, these have nonetheless been justified through cabinet decisions, and projects proceed.

102 | Species in the Balance: Partnering on tools and incentives to recover species at risk
REPORT | Species in the Balance
20 Other potential approaches to regulatory compliance under SARA exist but have not been explored to date. These include codes of practice, national standards, or guidelines for the protection of CH under section 56 of SARA, and exemptions for activities permitted in recovery strategies, action plans and management plans as described in section 83, article 4 of SARA. However, these codes, exemptions etc. would need to meet rigorous requirements (including monitoring for effectiveness and, where relevant, compliance) in order to be credible.
21 One stakeholder also noted that DFO’s Recovery Potential Assessment (DFO 2007) – with its rigorous, science-based scenarios for assessing how SAR recovery targets could be achieved under different SAR mortality (including threat avoidance and mitigation measures) and productivity scenarios - could potentially be used for demonstrating compliance under section 73, article 3.c. of SARA (not further jeopardizing SAR recovery). However, this would arguably retain some of the drawbacks associated with project-scale cumulative effects assessments mentioned above.
22 Similarly, McCune et al. (2017) used expenditure data from Environment and Climate Change Canada to estimate that the federal government spent approximately $2 per capita per year on SARA implementation from 2006-2014.
23 Sources included peer-reviewed publications, government reports (both state and federal), online databases, and published theses. In addition, we identified scientists who worked on individual species and requested population and abundance data.
24 International Union for the Conservation of Nature. (Undated). “Threats Classification Scheme (Version 3.2).” Retrieved from
http://www.iucnredlist.org/technical-documents/classification-schemes/threats-classification-scheme (January 08, 2018).
25 For instance, recall that there was insufficient variation in the sample to investigate potential associations between RS and a number of habitat-related threats such as residential & commercial development (RCD), agriculture (AG), energy production & mining (EPM), or transportation & service corridors (TSC).
26 However, if the signatories to these agreements are found not to be in compliance with SARA, then corrective measures will need to be taken.
27 For instance, ECCC, the British Columbia Minister of Environment and Climate Change Strategy, and the British Columbia Minister of Forests, Lands and Natural Resource Operations and Rural Development (2017) have recently drafted a Section 11 Conservation Agreement for the Conservation of the Southern Mountain Caribou. The Species at Risk Partnerships on Agricultural Land Program (SARPAL) is also piloting section 11 conservation agreements on private land, by making signed section 11 conservation agreements a requirement for participating in its Grassland Stewardship Program (Ontario Soil and Crop Improvement Association 2018).
28 The Government of Canada’s proposed policy for assessing effective protection of CH on non-federal land (Government of Canada 2016b) could perhaps provide an alternative means of testing whether a safety net order should be recommended. However, several organizations have argued that the proposed policy’s residual risk approach runs the risk of being impractical and discretionary (Nixon 2017). Some commentators have also argued that it is either unlawful (e.g. Nixon 2017), or at least has no foundation in the legislation (Daviet and Branchaud 2017).
29 These criteria are adapted from Wojciechowski et al. (2011), although we have included not fully identifying CH in P/T recovery strategies and the absence of signed section 11 conservation agreements as additional conditions.
30 See Environment and Climate Change Canada, British Columbia Minister of Environment and Climate Change Strategy, Minister of Forests, Lands and Natural Resource Operations and Rural Development (2017). This draft section 11 conservation agreement builds off the jointly authored Canada-British Columbia Southern Mountain Caribou (Central Group) Protection Study (Environment and Climate Change Canada and British Columbia Minister of Environment and Climate Change Strategy 2017).
31 Some sections of the proposed permitting policy seem to imply that remediating non-habitat threats to SAR - e.g. predator control or disease management - could also count as eligible offset measures. However, the policy explicitly forbids activities which “[transform] a naturally self-sustaining population to one that is dependent on ongoing human intervention.” (Government of Canada 2016a, Supplemental Information, Annex p. 10).
32 “Applicants must propose an offset that replaces or protects more individuals, residences or critical habitat than are likely to be adversely affected by the activity” (Government of Canada 2016a, Section 3.2.3.3.1, p.10).
33 E.g. schemes targeting an index of species abundance for a parcel of land (relative to a counterfactual, undisturbed condition), rather than targeting specific SAR (Alberta Biodiversity Monitoring Institute, 2014).
34 Weber et al. (2011) model several offset scenarios corresponding to different levels of flexibility in policy design (e.g. restoration-only offsets vs. avoided loss-only offsets vs. both kinds of offsets combined) and find that policy costs across scenarios range from <1% - 38% of total forest, oil and gas sector net present values (NPV) over a fifty year time period. The scenario which only allowed for restoration offsets was the most expensive (at 38% of NPV), although this cost is largely due to the foregone NPV from the five-year delay required before offset credits are issued to developers (as stipulated by the scenario). The authors note that a restoration-only scenario which immediately issued offset credits would mitigate some of these policy costs (this scenario was not modelled), although we note that this would require a higher multiplier to compensate for the additional risk and ensure no net loss. Moreover, this scenario would probably still be more expensive than scenarios which also allowed for avoided loss offsets, where the policy costs ranged from <1% - 1.5% of NPV. However, avoided loss offsets would presumably not satisfy the proposed permitting policy’s additionality requirements.
35 Industry is currently not liable for restoring these lands, but is contributing funds to help restore them. See Muzyka, Kyle. 2016. “Alberta Plans to Restore Caribou Habitat Disturbed by Industrial Use.” CBC News Oct 01, 2016. Retrieved from http://www.cbc.ca/news/canada/edmonton/alberta-caribou-habitat-program-1.3787613 (January 08, 2018).

| 103
36 The Ecological Gifts Program (Canadian Wildlife Service 2011) and the Natural Areas Conservation Program also acquire properties through fee simple acquisition (Nature Conservancy Canada, undated).
37 Requiring these scientists and analysts to sign non-disclosure agreements - which prevent them from publishing the data in a format wherein land owners could easily be identified - would help ensure that these data are accessed, analyzed and published in a manner that respects the confidentiality of data providers.
38 These limitations persist in prairie ranch lands where SAR are concentrated (Karl Zimmer and Robin Bloom, Environment and Climate Change Canada, personal communication, January 18, 2018).
39 For instance, Lawley and Yang (2015) find evidence that experience with conservation easements can increase uptake by neighbors, possibly due to a combination of improved local attitudes towards easements and to active spatial targeting on the part of the conservation agency.
40 SAR whose CH has been protected as part of the EGP include: (1) piping plover; (2) eastern loggerhead shrike; (3) western chorus frog; (4) Massasauga rattlesnake; (5) acadian flycatcher; (6) butternut tree; (7) burrowing owl; (8) Sprague’s pipit; (9) western blue flag iris; (10) leopard frog; (11) ferruginous hawk; (12) yellow-breasted chat; (13) western screech owl; (14) red-headed woodpecker; (15) bobolink; and (16) northern prairie skink (ECCC 2016b).
41 It should be kept in mind that the program aims to acquire many kinds of ecologically sensitive land (not just those containing SAR habitat), so the program ought to be assessed for its cost-effectiveness in securing a suite of environmental benefits.
42 There is a sound rationale for introducing a premium tax incentive for eco-gifts contributing to SAR conservation, even if one believes that the current level of tax incentives under the EGP is too generous (which may or may not be the case).
43 This estimate is based on imperilled species observed on the property – and thus may be subject to the limitations mentioned in the previous discussion on easements.
44 Such as reverse auctions for nutrient abatement – e.g. Boxall, Perger and Weber (2013).
45 These permits could be allocated through a number of methods, including auctioning, allocations based on historical emissions, equal shares per polluter, etc.
46 However, Brassard (2014) also notes that, after the Supreme Court decisions regarding Sage Grouse and Nooksack Dace, multispecies recovery plans appear just as likely to identify CH as single-species plans.
47 This being said, recovery effects were somewhat dependent on the choice of statistical model and were not entirely robust across different model specifications.
48 Pannell and Gibson (2016) also found that using faulty functional forms for calculating overall project benefits significantly reduced the benefits from the projects chosen for funding (by up to 23%). They also found that omitting parameters from the decision framework was more costly (in terms of foregone benefits) than faulty estimates of the parameter value (in other words, an uncertain number was usually better than no number).
49 ‘Secured’ habitat refers to that which “has been protected through purchase, donation, or other legally binding agreements such as conservation easements and leases” (Government of Canada 2017d).
50 However, the 2018 Grasslands Stewardship Program administered by SARPAL is a partial exception (OSCIA 2018), since applicants appear to be eligible for compensation due to foregone income from implementing BMP 4: Forage Harvesting Management (Delayed Haying). But this does not appear to be true of the other BMPs funded by the program.
51 In the literature, this is referred to as extracting ‘information rents’.
52 The Habitat Stewardship Program for Species at Risk, the Aboriginal Fund for Species at Risk, and the Interdepartmental Recovery Fund.
53 For an accessible summary of the negative list approach, see McGregor, Janyce. 2017. “5 Things to Watch in Today’s Interprovincial Trade Deal.” CBC News April 07, 2017. Retrieved from http://www.cbc.ca/news/politics/cfta-toronto-friday-list-1.4058328 (January 08, 2018).
54 These data currently have some limitations, due to the somewhat inconsistent documentation on the ecological value of these easements – see discussion in section 5.3.2.
55 Similar to easements, data on donations under the EGP currently have some limitations, due to the somewhat inconsistent documentation on the ecological value of the donated land or easement – see discussion in section 5.3.2.
56 However, some of the latter data could perhaps be made accessible to researchers and evaluators who have signed non-disclosure agreements with the data custodians.
57 These are sometimes referred to as “super-additive” or “synergistic” effects.
58 The Expert Panel also proposes complementing project-level IAs with strategic IAs, which would outline how existing federal policies, plans and programs ought to be implemented in a project or regional IA (Gélinas et al. 2017). These may also be relevant to SAR policy but they are not the focus of this discussion.

104 | Species in the Balance: Partnering on tools and incentives to recover species at risk
REPORT | Species in the Balance
59 Approximately 65 recovery strategies remain to be drafted, and while these strategies could in principle be informed by regional IAs, many of them are likely to be drafted and finalized before the regional IAs are drafted (assuming a 2-3 year lag for the former). However, regional IAs could potentially be incorporated into updated recovery strategies (where relevant).
60 The baseline information provided by these regional IAs could also support the assessment of effective protection of SAR on non-federal lands.
61 As noted previously, this database would also dovetail with the Expert Review Panel’s call for establishing a database and public registry of information related to all current and proposed IA processes – another recommendation which the federal government is actively considering (Government of Canada 2017b).
62 The Constitution Act, 1867 (U.K.), 30 & 31 Victoria, s. 95.
63 Although some economists might balk at the suggestion of earmarking a share of the carbon pricing proceeds towards SAR conservation - rather than cutting distortionary taxes on labour and capital - our recommendations should be understood in a broader context. Unless the increased funding for SAR conservation is made through a reallocation of current departmental budgets, implementing a revenue-neutral carbon tax – and increasing the budget for SAR conservation by raising additional revenue elsewhere – arguably amounts to an accounting choice (c.f. Cairns 2016). Moreover, these additional revenues for SAR conservation would need to be financed through other taxes or fees (or deficit financing), which may well be equally distortionary.
64 It should be noted that these are not bonds in the strict sense of the term, but performance contracts (Nicola 2013).

| 105
