spectral properties of h-reflex recordings after an …€¦ · · 2017-06-10spectral properties...
TRANSCRIPT
Marquette Universitye-Publications@Marquette
Exercise Science Faculty Research and Publications Health Sciences, College of
7-1-2012
Spectral Properties of H-Reflex Recordings After anAcute Bout of Whole-Body VibrationKristof KippMarquette University, [email protected]
Samuel T. JohnsonOregon State University
Mark A. HoffmanOregon State University
Accepted version. Journal of Strength and Conditioning Research, Vol. 26, No. 7 (2012): 1915-1919.DOI. © Lippincott Williams & Wilkins, Inc. 2012. Used with permission.This is not the final published version.
NOT THE PUBLISHED VERSION; this is the author’s final, peer-reviewed manuscript. The published version may be accessed by following the link in the citation at the bottom of the page.
Journal of Strength and Conditioning Research, Vol. 26, No. 7 (July 2012): pg. 1915-1919. DOI. This article is © Lippincott Williams & Wilkins, Inc. and permission has been granted for this version to appear in e-Publications@Marquette. Lippincott Williams & Wilkins, Inc. does not grant permission for this article to be further copied/distributed or hosted elsewhere without the express permission from Lippincott Williams & Wilkins, Inc.
1
Spectral Properties of H-Reflex
Recordings after an Acute Boot of
Whole-Body Vibration
Kristof Kipp Department of Physical Therapy, Marquette University
Milwaukee, WI
Sam T. Johnson Department of Nutrition and Exercise Sciences
Oregon State University
Corvallis, OR
Mark A. Hoffman
Department of Nutrition and Exercise Sciences
Oregon State University
Corvallis, OR
Abstract
Although research supports the use of whole-body vibration (WBV) to
improve neuromuscular performance, the mechanisms for these
improvements remain unclear. The purpose of this study was to identify the
effect of WBV on the spectral properties of electrically evoked H-reflex
recordings in the soleus (SOL) muscle. The H-reflex recordings were
measured in the SOL muscle of 20 participants before and after a bout of
WBV. The H-reflexes were evoked every 15 seconds for 150 seconds after
WBV. A wavelet procedure was used to extract spectral data, which were then
quantified with a principle components analysis. Resultant principle
component scores were used for statistical analysis. The analysis extracted 1
principle component associated with the intensity of the myoelectric spectra
NOT THE PUBLISHED VERSION; this is the author’s final, peer-reviewed manuscript. The published version may be accessed by following the link in the citation at the bottom of the page.
Journal of Strength and Conditioning Research, Vol. 26, No. 7 (July 2012): pg. 1915-1919. DOI. This article is © Lippincott Williams & Wilkins, Inc. and permission has been granted for this version to appear in e-Publications@Marquette. Lippincott Williams & Wilkins, Inc. does not grant permission for this article to be further copied/distributed or hosted elsewhere without the express permission from Lippincott Williams & Wilkins, Inc.
2
and 1 principle component associated with the frequency. The scores of the
principle component that were related to the myoelectric intensity were
smaller at 30 and 60 milliseconds after WBV than before WBV. The WBV
transiently decreased the intensity of myoelectric spectra during electrically
evoked contractions, but it did not influence the frequency of the spectra. The
decrease in intensity likely indicates a smaller electrically evoked muscle
twitch response, whereas the lack of change in frequency would indicate a
similar recruitment pattern of motor units before and after WBV.
Key Words: neuromuscular, frequency, motor unit, vibration
Introduction The use of whole-body vibration (WBV) training is a popular
exercise modality used to enhance the performance of the
neuromuscular system (6,7,13,14). Research supports the use of WBV
to increase strength and power after acute exposure (4,10,11,14).
Nevertheless, despite there being a plethora of applied studies, the
underlying mechanisms responsible for improvements after WBV
exposure remain unclear. Because a lack of mechanistic information
may impede the optimization and application of WBV as an exercise
modality, elucidation of such mechanisms is paramount.
Because WBV has acute positive effects on neuromuscular
function, a primary mechanism that has been suggested for improved
performance is the potentiation of neuromuscular function through
either altered motor neuron pool excitability or motor unit recruitment
patterns (2,8,12). Although several studies have investigated the
changes in motor neuron pool excitability after WBV (2,8,12), the
findings in these studies have been equivocal. The other potential
mechanism that has been proposed to account for WBV-induced
changes is an altered motor unit recruitment pattern. It is known that
direct tendon vibration promotes the ability to generate high firing
rates in high-threshold motor units (3). In addition, tendon vibration is
suggested to alter the threshold of motor unit recruitment and result in
more rapid muscle activation (15). Although based on tendon vibration
rather than on WBV, these findings implicate altered motor unit
recruitment patterns, specifically in high-threshold motor units, as a
basis for observed changes in muscle activation after vibration
exposure (3,15). Little, however, is known about the effects of WBV on
the recruitment patterns of motor units.
Although motor unit recruitment patterns are difficult to study,
recent studies show that wavelet analysis of the electromyographic

NOT THE PUBLISHED VERSION; this is the author’s final, peer-reviewed manuscript. The published version may be accessed by following the link in the citation at the bottom of the page.
Journal of Strength and Conditioning Research, Vol. 26, No. 7 (July 2012): pg. 1915-1919. DOI. This article is © Lippincott Williams & Wilkins, Inc. and permission has been granted for this version to appear in e-Publications@Marquette. Lippincott Williams & Wilkins, Inc. does not grant permission for this article to be further copied/distributed or hosted elsewhere without the express permission from Lippincott Williams & Wilkins, Inc.
3
signal provides a means to study the recruitment patterns of motor
units across a variety of different tasks (9,18,19). In particular, when
combined with principle component analysis, wavelet analysis can be
used to determine the time-varying intensity and frequency of
myoelectric signals during volitional or reflexively evoked contractions
(9,18,19). Electrically evoked reflex contractions (i.e., H-reflex) appear
to preferentially recruit faster motor units with higher recruitment
thresholds than those with mechanically evoked reflex contractions
(i.e., Tendon tap) as evidenced by a shift toward higher myoelectric
frequency spectra (18). In addition, these methods are also sensitive
enough to differentiate between different types of twitch contractions
(i.e., tendon tap vs. supramaximal twitch) based on the intensity of
the myoelectric spectra (9). Collectively, the combination of principle
component and wavelet analyses therefore captures the time-varying
spectral properties of electromyographic signals and delineates
between changes in spectral intensity and frequency content, which in
turn have been linked to motor unit recruitment patterns (9,18,19).
Considering that these methods provide a viable approach to study the
changes in motor unit recruitment patterns, application of these
methods would provide a novel insight into mechanistic changes in
neuromuscular function after WBV.
The purpose of this study was therefore to determine if an acute
bout of WBV affects the spectral properties of H-reflex recordings of
the soleus (SOL) muscle. Because the variables derived from the
combined wavelet and principle component analyses provide
information about motor unit recruitment patterns, it was
hypothesized that any such changes after WBV would be present in the
time-varying intensity and frequency content.
Methods
Experimental Approach to the Problem To determine the effects of WBV on the spectral properties of
the myoelectric signal of H-reflexes, percutaneous peripheral nerve
stimulations were used to elicit the H-reflex in the SOL muscle of the
participants during quiet standing before and after a brief bout of
WBV. Wavelet and principle component analyses were used to quantify
the changes in the time-varying myoelectric intensity and frequency of
the H-reflex signal to determine the effect of WBV on motor unit
recruitment patterns. In addition, baseline measures were compared
NOT THE PUBLISHED VERSION; this is the author’s final, peer-reviewed manuscript. The published version may be accessed by following the link in the citation at the bottom of the page.
Journal of Strength and Conditioning Research, Vol. 26, No. 7 (July 2012): pg. 1915-1919. DOI. This article is © Lippincott Williams & Wilkins, Inc. and permission has been granted for this version to appear in e-Publications@Marquette. Lippincott Williams & Wilkins, Inc. does not grant permission for this article to be further copied/distributed or hosted elsewhere without the express permission from Lippincott Williams & Wilkins, Inc.
4
with several recordings after WBV to assess the time course of WBV-
induced neuromuscular changes.
Subjects Twenty (11 men, 9 women) healthy young adults (27.4 ± 4.4
years) who were recreationally active (Tegner Activity Level Scale
>=5) and had no known neurological deficits were recruited for this
study. The participants were asked to refrain from intense exercise on
the day of the testing. Each participant signed a written informed
consent document that was approved by the University's Institutional
Review Board before participating in the study.
Procedures Data Collection Procedures. Before the bout of WBV, 10
electrical stimulations were delivered to elicit and establish baseline H-
reflex values. Stimulations were delivered while the participants stood
quietly with their hands hanging at their side. The participants were
instructed to limit any extraneous head and limb movement. Baseline
stimulations were made with 15-second interstimuli intervals. For the
WBV, the participants stood quietly, with the same posture as during
the reflex recordings, on a vibration plate for 5 minutes (TurboSonic,
Hood River, OR, USA). The WBV plate was set to vibrate at a
frequency of 25 Hz and at an amplitude of 2–4 mm. H-reflex
stimulations and recordings started again immediately after the
cessation of the 5-minute bout of WBV and were continued every 15
seconds for 150 seconds to a total of 10 recordings.
Electromyography. The electromyogram (EMG) of the SOL
muscle was recorded with lubricated Ag/AgCl surface-recording
electrodes (Biopac Systems Inc., Goleta, CA, USA) at a frequency of
2,000 Hz. Electrodes were placed in series along the midline of the
muscle belly with an interelectrode distance of approximately 2 cm. H-
reflex responses were elicited with a stimulating electrode (2 cm2) that
was placed in the popliteal fossa, and a carbon-rubber dispersal
electrode (3 cm2) was placed just superior to the patella on the distal
thigh (Biopac Systems Inc.). H-reflexes were elicited with an s88
Grass stimulator (Grass Technologies, West Warwick, RI, USA) that
delivered a square wave pulse (1 milliseconds) to the tibial nerve while
the participants were standing quietly in a normal posture (i.e., hands
hanging at the side, knees slightly flexed). A condensed recruitment

NOT THE PUBLISHED VERSION; this is the author’s final, peer-reviewed manuscript. The published version may be accessed by following the link in the citation at the bottom of the page.
Journal of Strength and Conditioning Research, Vol. 26, No. 7 (July 2012): pg. 1915-1919. DOI. This article is © Lippincott Williams & Wilkins, Inc. and permission has been granted for this version to appear in e-Publications@Marquette. Lippincott Williams & Wilkins, Inc. does not grant permission for this article to be further copied/distributed or hosted elsewhere without the express permission from Lippincott Williams & Wilkins, Inc.
5
curve was used to identify the maximum H-reflex and M-wave. The
stimulation intensity was then adjusted to produce an H-reflex equal to
10% of the maximum M-wave and remained at this setting for the
duration of the study.
Data Processing. A wavelet analysis with subsequent principle
component analysis was used to extract information about the spectral
properties of the H-reflex recordings from each individual before and
after WBV (9,18,19). Preliminary analysis indicated that the presence
of stimulation artifact and small M-waves influenced the results of the
wavelet analysis. All the recordings were therefore trimmed to exclude
the first 20 milliseconds of the recorded EMG where the stimulation
artifact and M-wave would be present. This step left a 50-millisecond
sample of EMG data that was used for the remainder of the analysis.
Given an approximate latency of 30–35 milliseconds for the H-reflex,
the ‘trimming’ of the trial did not affect H-reflex recording (Figure 1).
The EMG data were resolved into the time-frequency domain with a
wavelet technique developed in Matlab (The MathWorks, Inc. Natick,
MA, USA) at the University of Colorado
(http://atoc.colorado.edu/research/wavelets). This wavelet algorithm
uses a Morlet wavelet to calculate the time-varying power or intensity
across a range of frequencies for the duration of the signal (Figure 1).
The time-varying power is then summed into a global wavelet
spectrum that gives the myoelectric power or intensity across all the
frequencies for the given signal. The global wavelet spectra (i.e.,
intensity spectra) from all the individuals were then transposed and
then pooled into data matrix A that consisted of 220 rows (20 subjects
× 11 recordings per subject [i.e., baseline average + 10
postvibration]) and 29 columns (arbitrary number of down-sampled
frequencies). As part of the principle component analysis, the unit
eigenvectors and eigenvalues were then extracted from covariance
matrix B of the original data matrix A (18,19). Principle components
were retained for analysis if the given eigenvalues for an eigenvector
were greater than 1 (i.e., unity). The extracted eigenvectors were then
multiplied with each individual's global wavelet spectra. The
summation of the multiplication products then gave a set of principle
component scores that determined how much of each eigenvector
(i.e., principle component) was present within a given global wavelet
spectrum. Because the principle components are extracted through an
orthogonal matrix decomposition method, they provide unique
NOT THE PUBLISHED VERSION; this is the author’s final, peer-reviewed manuscript. The published version may be accessed by following the link in the citation at the bottom of the page.
Journal of Strength and Conditioning Research, Vol. 26, No. 7 (July 2012): pg. 1915-1919. DOI. This article is © Lippincott Williams & Wilkins, Inc. and permission has been granted for this version to appear in e-Publications@Marquette. Lippincott Williams & Wilkins, Inc. does not grant permission for this article to be further copied/distributed or hosted elsewhere without the express permission from Lippincott Williams & Wilkins, Inc.
6
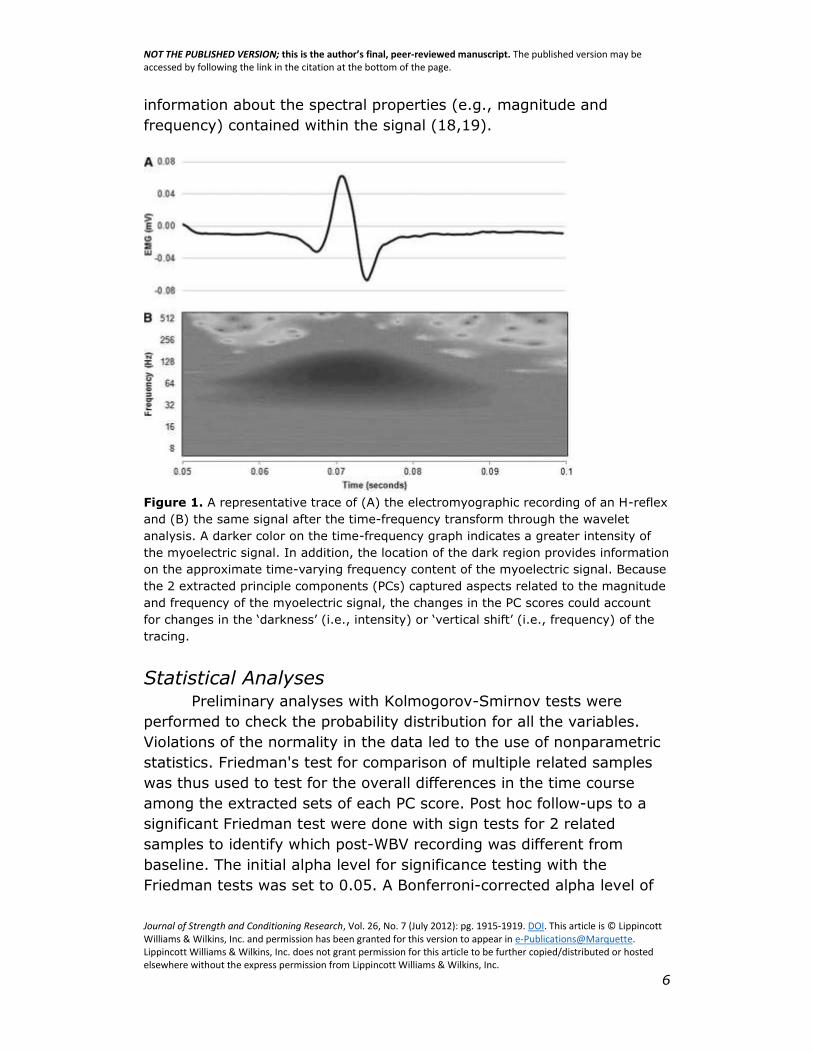
information about the spectral properties (e.g., magnitude and
frequency) contained within the signal (18,19).
Figure 1. A representative trace of (A) the electromyographic recording of an H-reflex
and (B) the same signal after the time-frequency transform through the wavelet
analysis. A darker color on the time-frequency graph indicates a greater intensity of
the myoelectric signal. In addition, the location of the dark region provides information
on the approximate time-varying frequency content of the myoelectric signal. Because
the 2 extracted principle components (PCs) captured aspects related to the magnitude
and frequency of the myoelectric signal, the changes in the PC scores could account
for changes in the ‘darkness’ (i.e., intensity) or ‘vertical shift’ (i.e., frequency) of the
tracing.
Statistical Analyses Preliminary analyses with Kolmogorov-Smirnov tests were
performed to check the probability distribution for all the variables.
Violations of the normality in the data led to the use of nonparametric
statistics. Friedman's test for comparison of multiple related samples
was thus used to test for the overall differences in the time course
among the extracted sets of each PC score. Post hoc follow-ups to a
significant Friedman test were done with sign tests for 2 related
samples to identify which post-WBV recording was different from
baseline. The initial alpha level for significance testing with the
Friedman tests was set to 0.05. A Bonferroni-corrected alpha level of
NOT THE PUBLISHED VERSION; this is the author’s final, peer-reviewed manuscript. The published version may be accessed by following the link in the citation at the bottom of the page.
Journal of Strength and Conditioning Research, Vol. 26, No. 7 (July 2012): pg. 1915-1919. DOI. This article is © Lippincott Williams & Wilkins, Inc. and permission has been granted for this version to appear in e-Publications@Marquette. Lippincott Williams & Wilkins, Inc. does not grant permission for this article to be further copied/distributed or hosted elsewhere without the express permission from Lippincott Williams & Wilkins, Inc.
7
0.005 was used to account for multiple comparisons (n = 10) between
the pre-WBV baseline recordings and the 10 post-WBV recordings
made at 15-second intervals (e.g., Pre-15sec, Pre-30sec … Pre-
150sec). All analyses were run in SPSS Statistics 17.0 (IBM
Corporation, Somers, NY, USA).
Results The principle component analysis extracted 2 principle
components that cumulatively explained 98.8% of the variance in the
data. The first principle component explained 93.0% of the variance
and had a positive weighting across all the frequencies, whereas the
second principle component explained 5.2% of the variance and
transitioned between a negative and positive weighting.
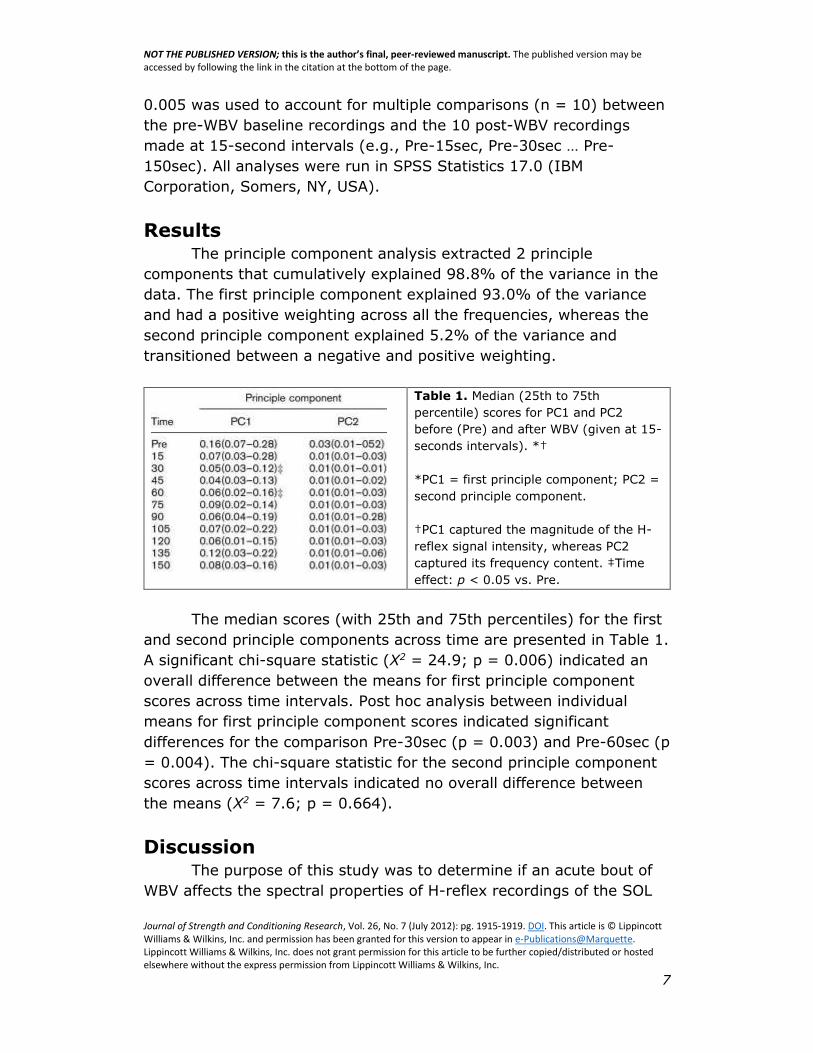
Table 1. Median (25th to 75th
percentile) scores for PC1 and PC2
before (Pre) and after WBV (given at 15-
seconds intervals). *†
*PC1 = first principle component; PC2 =
second principle component.
†PC1 captured the magnitude of the H-
reflex signal intensity, whereas PC2
captured its frequency content. ‡Time
effect: p < 0.05 vs. Pre.
The median scores (with 25th and 75th percentiles) for the first
and second principle components across time are presented in Table 1.
A significant chi-square statistic (Χ2 = 24.9; p = 0.006) indicated an
overall difference between the means for first principle component
scores across time intervals. Post hoc analysis between individual
means for first principle component scores indicated significant
differences for the comparison Pre-30sec (p = 0.003) and Pre-60sec (p
= 0.004). The chi-square statistic for the second principle component
scores across time intervals indicated no overall difference between
the means (Χ2 = 7.6; p = 0.664).
Discussion The purpose of this study was to determine if an acute bout of
WBV affects the spectral properties of H-reflex recordings of the SOL
NOT THE PUBLISHED VERSION; this is the author’s final, peer-reviewed manuscript. The published version may be accessed by following the link in the citation at the bottom of the page.
Journal of Strength and Conditioning Research, Vol. 26, No. 7 (July 2012): pg. 1915-1919. DOI. This article is © Lippincott Williams & Wilkins, Inc. and permission has been granted for this version to appear in e-Publications@Marquette. Lippincott Williams & Wilkins, Inc. does not grant permission for this article to be further copied/distributed or hosted elsewhere without the express permission from Lippincott Williams & Wilkins, Inc.
8
muscle. It was hypothesized that the changes in spectral properties, as
measured through variables derived from wavelet and principle
component analyses, would provide information about motor unit
recruitment patterns after WBV. The analyses extracted 2 principle
components that cumulatively explained 98% of the variance, which
indicated that this technique was able to account for almost all of the
spectral information contained within the myoelectric signals and
therefore proved to be suitable to analyze spectral properties of the H-
reflex recordings. Moreover, the 2 extracted components were similar
to those described for EMG signals during electrically and mechanically
stimulated contractions (18) and during stationary cycling across a
range of contraction intensities (19). The results indicated that WBV
had a significant effect on the scores of the first principle component
but not on the scores of the second principle component. Because the
first and second principle components captured aspects related to the
intensity and frequency of the myoelectric spectrum, respectively,
these results indicate that the intensity, but not the frequency content
of the myoelectric spectrum of H-reflex recordings, is affected by WBV.
Because changes in myoelectric frequency spectra are related to the
recruitment of motor units with different firing thresholds (18), it is
unlikely that WBV affects the recruitment order of motor units.
The WBV transiently influenced the scores of the first principle
component. In particular, the scores of the first principle component
were significantly smaller 30 and 60 milliseconds after the cessation of
WBV. Wakeling and Rozitis (18) found that a similar principle
component was related to the intensity of muscle contraction.
Specifically, these authors showed that a progressive increase in
muscle activation during ramp contractions leads to a concomitant
increase in the spectral intensity and the scores of the associated
principle component (18). The first principle component therefore
appeared to capture the intensity of the myoelectric signal, which
indicated that the smaller scores after WBV point to a lower magnitude
of the intensity of the signal's spectrum. Because an H-reflex recording
essentially represents a muscle twitch response, it is likely that the
vibration protocol used in this study led to a decrease in muscle twitch
response and H-reflex amplitude. Indeed several other studies have
demonstrated that acute WBV is associated with a decrease in H-reflex
amplitude (2,8). Although contrary to reports of increased functional
performance after WBV (e.g., vertical jump), it has recently been

NOT THE PUBLISHED VERSION; this is the author’s final, peer-reviewed manuscript. The published version may be accessed by following the link in the citation at the bottom of the page.
Journal of Strength and Conditioning Research, Vol. 26, No. 7 (July 2012): pg. 1915-1919. DOI. This article is © Lippincott Williams & Wilkins, Inc. and permission has been granted for this version to appear in e-Publications@Marquette. Lippincott Williams & Wilkins, Inc. does not grant permission for this article to be further copied/distributed or hosted elsewhere without the express permission from Lippincott Williams & Wilkins, Inc.
9
suggested that segmental spinal mechanisms (e.g., reduced
presynaptic inhibition) may in fact overcompensate for the decrease in
reflex excitability and thereby still potentiate muscular performance
(8). The extent to which this is the case, however, still remains to be
determined. The novel application of the techniques used in this study
may facilitate future efforts that aim to study segmental spinal
mechanisms after WBV.
The analyses also indicated that WBV did not influence the
scores for the second principle component. This principle component
captured a transition between a positive and negative weighting,
Wakeling and Rozitis (18) found that a similar principle component can
be used to describe the main frequency components of the myoelectric
intensity spectra because greater scores of this component are
associated with a higher frequency content of the spectra. Because
higher myoelectric frequencies correspond to greater recruitment of
faster motor units with higher recruitment thresholds (9,18,19), a
change in the scores of such a principle component would indicate an
altered motor unit recruitment strategy. The lack of effect of WBV on
the scores of the second principle component, however, indicated that
the frequency content of the intensity spectra remained unchanged
after WBV. It is consequently unlikely that WBV affects the recruitment
order of motor units during electrically evoked contractions. In
contrast, it should be noted that tendon vibration may increase the
recruitment of high-threshold motor units (3,15). The discrepancy in
the effects of these modes of vibration should therefore caution
researchers and practitioners from generalizing between the
mechanism and outcomes associated with the respective type of
vibration.
A general limitation to the conclusions made in this study relates
to the chosen vibration settings for the WBV protocol. Because the
vibration amplitude and frequency used in WBV protocols have
differential effects on the functional response (1,5), it may well be that
exposure to WBV at other frequencies or amplitudes has differential
effects on the frequency content of the myoelectric spectra.
Delineating between the differential effects of such ‘programming-
variables’ on neuromuscular measures would subsequently appear to
be an important consideration in future studies. Furthermore, the H-
reflex recordings during this study were made during quiet standing.
Because H-reflexes are subject to task-dependent modulation (16,17),
NOT THE PUBLISHED VERSION; this is the author’s final, peer-reviewed manuscript. The published version may be accessed by following the link in the citation at the bottom of the page.
Journal of Strength and Conditioning Research, Vol. 26, No. 7 (July 2012): pg. 1915-1919. DOI. This article is © Lippincott Williams & Wilkins, Inc. and permission has been granted for this version to appear in e-Publications@Marquette. Lippincott Williams & Wilkins, Inc. does not grant permission for this article to be further copied/distributed or hosted elsewhere without the express permission from Lippincott Williams & Wilkins, Inc.
10
it would be of interest to investigate spectral properties under more
dynamic situations than in standing or lying postures. Indeed, the
application of these methods to dynamic tasks (e.g., jumping) similar
to those in applied studies, which examine the effects of WBV on
neuromuscular performance, would provide a much needed insight and
improve the understanding of the neuromuscular effects of WBV. The
aforementioned limitations therefore warrant additional research and
provide future direction on the examination of mechanisms associated
with changes in neuromuscular performance after WBV.
Practical Applications The optimal application of WBV as an exercise modality depends
on a thorough mechanistic understanding of the underlying
neuromuscular responses and their effects on functional performance.
The analyses used in this study helped characterize the intensity and
frequency of myoelectric signals of the SOL muscle in response to an
acute bout of WBV. Together, these variables identified the
neuromuscular aspects related to motor unit recruitment strategies.
The results indicated that only the intensity, but not the frequency
content of the myoelectric spectrum, was affected by WBV.
Specifically, the intensity of the myoelectric spectrum was depressed
at various time points during the first minute after the WBV protocol.
Therefore, it appears that the acute WBV protocol used in this study
was associated with a short-term decrease in the intensity of
electrically evoked muscle contraction. The recruitment of motor units
during electrically evoked contractions, however, does not appear to
be altered after WBV. Assessing the neuromuscular function after an
‘optimal’ WBV protocol and during dynamic paradigms should be at the
center of future efforts by coaches and researchers who aim to study
the efficacy of WBV as an exercise modality.
Acknowledgements
The authors wish to thank Jeffrey Doeringer for help with data
collection.
References
1. Adams JB, Edwards D, Serravite DH, Bedient AM, Huntsman E, Jacobs KA,
Del Rossi G, Roos BA, Signorile JF. Optimal frequency, displacement,
duration, and recovery patterns to maximize power output following
acute whole-body vibration. J Strength Cond Res 23: 237–245, 2009.

NOT THE PUBLISHED VERSION; this is the author’s final, peer-reviewed manuscript. The published version may be accessed by following the link in the citation at the bottom of the page.
Journal of Strength and Conditioning Research, Vol. 26, No. 7 (July 2012): pg. 1915-1919. DOI. This article is © Lippincott Williams & Wilkins, Inc. and permission has been granted for this version to appear in e-Publications@Marquette. Lippincott Williams & Wilkins, Inc. does not grant permission for this article to be further copied/distributed or hosted elsewhere without the express permission from Lippincott Williams & Wilkins, Inc.
11
2. Armstrong WJ, Nestle HN, Grinnell DC, Cole LD, Van Gilder EL, Warren GS,
Capizzi EA. The acute effect of whole-body vibration on the Hoffmann
reflex. J Strength Cond Res 22: 471–476, 2008.
3. Bongiovanni LG, Hagbarth KE. Tonic vibration reflexes elicited during
fatigue from maximal voluntary contractions in man. J Physiol 423: 1–
14, 1990.
4. Cormie P, Deane RS, Triplett NT, McBride JM. Acute effects of whole-body
vibration on muscle activity, strength, and power. J Strength Cond Res
20: 257–261, 2006.
5. Di Giminiani R, Manno R, Scrimaglio R, Sementilli G, Tihanyi J. Effects of
individualized whole-body vibration on muscle flexibility and
mechanical power. J Sports Med Phys Fitness 50: 139–151, 2009.
6. Issurin VB. Vibrations and their applications in sport. A review. J Sports
Med Phys Fitness 45: 324–336, 2005.
7. Jordan MJ, Norris SR, Smith DJ, Herzog W. Vibration training: An overview
of the area, training consequences, and future considerations. J
Strength Cond Res 19: 459–466, 2005.
8. Kipp K, Johnson ST, Doeringer JR, Hoffman MA. Spinal reflex excitability
and homosynaptic depression after a bout of whole-body vibration.
Muscle Nerve 43: 259–262, 2011.
9. Lee SS, de Boef Miara M, Arnold AS, Biewener AA, Wakeling JM. EMG
analysis tuned for determining the timing and level of activation in
different motor units. J Electromyogr Kinesiol, 21: 557–565, 2011.
10. Marin PJ, Rhea MR. Effects of vibration training on muscle power: A meta-
analysis. J Strength Cond Res 24: 871–878, 2010.
11. Marin PJ, Rhea MR. Effects of vibration training on muscle strength: A
meta-analysis. J Strength Cond Res 24: 548–556, 2010.
12. McBride JM, Nuzzo JL, Dayne AM, Israetel MA, Nieman DC, Triplett NT.
Effect of an acute bout of whole body vibration exercise on muscle
force output and motor neuron excitability. J Strength Cond Res 24:
184–189, 2010.
13. Nordlund MM, Thorstensson A. Strength training effects of whole-body
vibration? Scand J Med Sci Sports 17: 12–17, 2007.
14. Rhea MR, Kenn JG. The effect of acute applications of whole-body
vibration on the iTonic platform on subsequent lower-body power
output during the back squat. J Strength Cond Res 23: 58–61, 2009.
NOT THE PUBLISHED VERSION; this is the author’s final, peer-reviewed manuscript. The published version may be accessed by following the link in the citation at the bottom of the page.
Journal of Strength and Conditioning Research, Vol. 26, No. 7 (July 2012): pg. 1915-1919. DOI. This article is © Lippincott Williams & Wilkins, Inc. and permission has been granted for this version to appear in e-Publications@Marquette. Lippincott Williams & Wilkins, Inc. does not grant permission for this article to be further copied/distributed or hosted elsewhere without the express permission from Lippincott Williams & Wilkins, Inc.
12
15. Romaiguere P, Vedel JP, Pagni S. Effects of tonic vibration reflex on motor
unit recruitment in human wrist extensor muscles. Brain Res 602: 32–
40, 1993.
16. Stein RB, Thompson AK. Muscle reflexes in motion: How, what, and why?
Exerc Sport Sci Rev 34: 145–153, 2006.
17. Tokuno CD, Garland SJ, Carpenter MG, Thorstensson A, Cresswell AG.
Sway-dependent modulation of the triceps surae H-reflex during
standing. J Appl Physiol 104: 1359–1365, 2008.
18. Wakeling JM, Rozitis AI. Spectral properties of myoelectric signals from
different motor units in the leg extensor muscles. J Exp Biol 207:
2519–2528, 2004.
19. Wakeling JM, Uehli K, Rozitis AI. Muscle fibre recruitment can respond to
the mechanics of the muscle contraction. J R Soc Interface 3: 533–
544, 2006.