spheres: water
DESCRIPTION
A periodic magazine covering the broad range of research done at the Cooperative Institute for Environmental Sciences at the University of Colorado at Boulder.TRANSCRIPT

Western water outlook:
grimFLOATiNg A FLOODTHEOrY WATEr LAWbATTLEsbrEWiNg
sTuDYiNgWATEr FrOm
sPACE
sph res 20 09
editio
n 01
water
COOPERATIVE INSTITUTE FOR RESEARCH IN ENVIRONMENTAL SCIENCES

34
4
6
689
1011
121314
This IssueDraining Asia Heavy irrigation lowers crucial water tables
Trees, Bugs and Water Water Blitz assesses streams in Rocky Mountain National Park
StudentFocus: Leigh Cooper CIRES interdisciplinary environment provides unique environment for students
Custom Tools for better forecasting NOAA/CIRES Hydrometeorology Testbed targets storms below the radar
Rainy Day Science Does pollution in California push rains into Nevada?
Western water forecast: 2057 Usable water from reservoirs could be a 50-50 proposition
Calm before the storm Changing climate might compromise decades-old water agreements
Floating flood theory Small watersheds may unlock secrets of a region’s flood risk
Fingerprints in water Hawaiian mountaintop is homebase for studying most prevalent greenhouse gas: water
H2OrbitTandem satellites measure central Asia’s melting glaciers
Errant Outcome Researchers discover and fix a major climate model glitch
MySphereWestern Water Assessment’s Brad Udall opens the door to his “reorganized” office
On the cover: Boaters slice through low water in a canyon at Lake Powell. Bureau of reclamation
2

2620 irrigation lowering asian water tablesIn heavily irrigated Northern India, Paki-
stan, and Bangladesh, groundwater is disap-pearing at a rate of about 54 km3 per year, according to new satellite measurements. “This is probably the largest rate of
groundwater loss in any comparably sized region on Earth,” CIRES Fellow John Wahr and colleagues wrote in a paper published in Geophysical Research Letters this year.
The research team—Wahr, Virendra Ti-wari at the National Geophysical Research Institute in India, and Sean Swenson at the National Center for Atmospheric Science in Boulder, Colo.—used NASA’s GRACE satellite (see p. 12), to calculate the rate of groundwater loss in the region, where water availability is known to be declining. From satellite gravity measurements, the scien-tists found an extremely high rate of water loss—54 km3 per year, +/- 9 km3—enough to make the regional water table drop about 10 cm a year.“This trend, if sustained, will lead to a ma-
jor water crisis in this region,” the research-ers concluded. The figures are comparable with ground-
truth, according to the International Water Management Institute. More and more farmers are growing irrigated crops in the region, and the use of small, electrical pumps to pull up water is growing quickly. In some aquifers, groundwater is increas-ingly tainted with salts and other chemicals, including the toxin arsenic, Wahr and his colleagues noted. Regional water use is very difficult to
estimate from the ground-up for lack of consistent monitoring. The new study sug-gests that the Indian Central Ground Water Board’s latest estimate, from the 1990s, is no longer accurate, that groundwater extraction rates are about 70 percent higher today. But the findings also mean that satellite data could be used to get regional water managers up-to-date information on groundwater storage in the region—an im-portant step toward creating a sustainable water-management plan for the 600 million people who live there.
Potential height of a flash flood’s wall of water.
chance of a home suffering flood damage during a 30-year mortgage.
9perce
nt
chance of a home suffering fire damage during a 30-year mortgage.
Water particles grow, collide, break apart and reform within a cloud be-fore falling as rain.the smallest mea-sure that could be called a drop—able to fall from the sky— is 0.5 mm. the larg-est? about 5.5 mm before the drop is likely to split apart.
0.5 mm
5.5 mm
Actual size
Pacific Ocean
feet
percent
Since the reservoir lake Powell started filling in the mid-1960s, the colorado river has rarely reached the sea. a flow gage at the begin-ning of the river’s delta, still miles from the sea, recorded no water
at all in 23 of the 35 years between 1965 and 2000.
in the years leading up to the 1922 colorado river compact (the law that still regulates the river’s water allocations), the river’s flow was unusu-ally high, and negotiators expected they’d always have about 16.4 million acre feet to divvy up. During 2000-2004, the most severe drought on record, the average flow was 9.6 million acre feet.
16.4 > 9.6
3

Pine beetles are turning large swaths of forest in the western United States and Canada red. While many people worry about how the beetle kill will affect forest fires, CIRES graduate student Leigh Cooper wants to know what effect beetle kill is having on water quality.
“When forest disturbances like logging or fire oc-cur, you usually see a large influx of nitrate into local streams, since the trees in the area no longer actively take up the nutrient,” Cooper said. “I wanted to explore whether you would see a similar influx of nutrients into streams in Colorado watersheds affected by beetle kill.”
Cooper is working towards a Ph.D. in Ecology and Evolutionary Biology at the University of Colorado at Boulder. Her research was partly supported by a 2008 CIRES Graduate Research Fellowship.
So far, Cooper’s stream chemistry tests have not revealed a straightforward link between beetles and nitrate, but the results suggest interesting hypotheses she can test further. “Within CIRES’ interdisciplinary research environment, I’m able to study freshwater ecology,” Cooper said, “and soil and watershed chem-istry, too.”
WaterBlitz 2009Scientists study water-quality variation and disturbance impacts in Colorado’s biggest park
On an August day in 2009, roughly 100 hikers fanned out across Rocky Mountain National Park (RMNP) carrying water bottles—not to quench their thirst, but to collect water samples for scientists.By analyzing water collected simultane-
ously from 250 loca-tions on both sides of the Continental Divide, CIRES and National Park Service researchers hope to better understand how climate, pollution, and ecological disturbances affect water quality. “We want to under-
stand how water quality varies spatially in Rocky Mountain National Park and refine our under-standing of what’s caus-ing these differences,” said project leader James McCutchan, Associate Director of CIRES’ Center for Limnology.Basic environmental factors, such as
hill slope, vegetation type, and bedrock mineral composition affect stream chem-istry, said McCutchan, but he also expects to see significant differences between watersheds that have been disturbed by wildfire or mountain pine beetle, and undisturbed watersheds.
The removal of a watershed’s natural vegetation by fire reduces the ability of plants to take up nitrogen and other soil nutrients, McCutchan said. As a result, rain and snowmelt tend to flush nitrogen directly into the stream channel.
“Nitrogen is a very important nutrient in streams and can alter the growth of photosyn-thetic organisms,” said McCutchan. “Ultimately this may affect the whole food chain, including top-level fish like Colo-rado’s threatened green-back cutthroat trout.”Nutrient changes in
the park’s high-altitude streams also can affect water quality far down-stream. The headwaters of the Colorado, St. Vrain
and Big Thompson rivers, which supply drinking and irrigation water to Colorado communities, are all located in RMNP. CIRES conducted “Water Blitz” in both 2008 and 2009. “It’s a great study because it combines
questions about current stream chemis-try…with questions about how to best monitor streams into the future,” said RMNP Research Administrator Judy Visty.
TheScience How does stream chemistry vary across Rocky Mountain National Park? Can connections be made to climate, pollution, or ecological disturbances?
StudentFocus: leigh cooper
4

CIRES offers two graduate fellowships, ranging in support from a summer or single semester to four years. The new ESRL-CIRES fellowship allows students to work with world-class researchers at NOAA’s Earth System Research Labora-tory while earning a degree at the University of Colo-rado at Boulder.
Learn more
about cireS fellowships at cires.colorado.edu/education
PHotoS courteSY JameS mccutcHanIn just two years, nearly 200 volunteers have collected water samples throughout Rocky Mountain National Park for the WaterBlitz.
5
Ecology student Leigh Cooper studies the effects of beetle kill on Rocky Mountain water quality.
cireS

custom tools for better forecastingWeather forecasters know that conven-
tional instrument suites aren’t always enough to accurately predict severe weath-er. Deadly storms can sneak in literally below radar, and runoff models sometimes don’t capture an imminent flood. NOAA’s Hydrometeorology Testbed
(HMT) program, which involves CIRES scientists and research products, is infusing new science and technology into the daily operations of the National Weather Ser-vice and its River Forecast Centers. CIRES researchers have helped design and place custom instrument packages (from disdrom-eters and radars to weather instruments launched on balloons) and run experimen-tal models in regions of California that are prone to winter floods. Following the California demonstration,
HMT will be deployed in other regions of the country with other severe weather forecasting challenges. In each deployment, instruments and models that improve fore-casts will remain in place.
6

rainy-day scienceCIRES’ Christopher Williams aims to improve understanding, prediction of precipitation
TheScience Is pollution in California changing precipitation patterns?
Development of a more economical radar system for weather and climate research.
California with less. Williams suspects the story is
more complicated. He and col-leagues in NOAA’s Earth System Research Laboratory, the Scripps Institution of Oceanography, and the University of California in San Diego, hope to have a clearer picture of the relationship between air quality and water resources within five years. They’re setting up sophisticated instruments across California to determine how and when precipitation is affected by aerosols and other factors, such as atmospheric rivers and barrier jets. Williams is also building a
prototype dual-frequency, verti-cal profiling radar for less than $20,000 (one-tenth the cost of off-the-shelf commercial units), to feed demand in the weather and climate research community for affordable, sophisticated instruments to study precipitating clouds. Improved ground measurements of precipitat-ing systems would help address regional questions such as those of concern in California, Williams said, and could also help calibrate rainfall measured by satellite.
Rain affects every aspect of human life, from agriculture to recreation, but it’s difficult to get it right in weather forecast and climate models. Several funda-mentally different processes can pour rain or snow to the ground, and it’s not always clear which process is at work. Storms still slip through weather radars, causing unexpected havoc, and air pol-lution can complicate the picture further, by affecting cloud and rainfall physics. It is this complexity that draws CI-
RES’ Christopher Williams to study the dynamics of rainfall. “Think about rain falling on a lake,” Wil-liams said. “It’s not at all uniform. You see these cat paw patterns...” Scientists may not hope to repro-duce such small-scale patterns in computer models, but it is possible to improve the way the models represent rainfall. Williams ana-lyzes small-scale observations and then uses “upscaling” techniques to more accurately depict regional and global processes. Today, Williams is working on
two key projects to improve scien-tific understanding and prediction of “precipitating cloud systems”—a study in California to determine the effect of air pollution, such as aero-sols, on water resources there, and the development of an inexpensive radar system, which could be de-ployed widely to improve forecast-ing, especially around airports. Aerosols can increase the number
of small drops of moisture in clouds, Williams said, and in some cases, tinier drops mean precipita-tion may take longer to form and fall. In California, that has led some researchers to conclude that air pollution has changed the pat-tern of rainfall in the state, letting water-rich clouds travel over the Sierra Nevada into Nevada before dropping their rain, and leaving
cireSCIRES’ Christopher Williams works on the prototype of his inexpensive vertical-profiling radar. The system uses a Sony PlayStation to process information captured by a set of three, $200 radar dishes.
7

Future of Western supplies grim, but not unmanageableStreamflows and reservoirsReservoirs could have too little water to draw from in any given year as stream-flows decrease:
Flow Chance of depletionreduction per year after 20570% 1-in-1310% 1-in-420% 1-in-2
Water forecast 2057: a 50-50 proposition?
8
As the West warms, a drier Colorado River system could see as much as a 1-in-2 chance of fully depleting all of its reservoir storage by mid-century, assuming current management practices continue on course. That’s grim news for the roughly 30 million people who depend on the Colorado River for drinking and irrigation water.A research team, led by CIRES
Fellow Balaji Rajagopalan, exam-ined how vulnerable the Colorado River system is to water supply variability and to projected changes in water demand. The team found that through 2026, the risk of fully depleting reservoir storage in any given year remains less than 10 per-cent under any scenario of climate fluctuation or management alterna-tive. During this period, reservoir storage could even recover from its current low level, about 65 percent of capacity in the summer of 2009. But if climate change results
in a 10 percent reduction in the Colorado River’s average stream
flow, the chances of fully deplet-ing reservoir storage will exceed 25 percent by 2057. If climate change results in a 20 percent reduction, the chances of fully depleting reservoir storage will exceed 50 percent by 2057, Rajagopalan said. “On average, drying caused by
climate change would increase the risk of fully depleting reservoir stor-age nearly ten times more than the risk we expect from population pres-sures alone,” said Rajagopalan. A 50 percent chance in any given year is an enormous risk and huge water management challenge, he said. But even under the most extensive
drying scenario, threats to water supplies won’t be felt immediately, he said. Total storage capacity of reser-
voirs on the Colorado exceeds 60 million acre feet, almost 4 times the average annual flow on the river, and the two largest reservoirs—Lake Mead and Lake Powell—can store up to 50 million acre feet of water. As a result, the risk of full reservoir depletion will remain low through 2026, even with a 20 percent stream flow reduction induced by climate change. Between 2026 and 2057, if
current management practices continue, the risks of fully depleting reservoir storage would be about 7 times the risk expected otherwise. Implementing more aggressive
management practices—reducing downstream releases during short-ages, for example—would lessen the additional depletion risk in the future, to just twice what would be expected from pouplation increases. The magnitude of the risk will
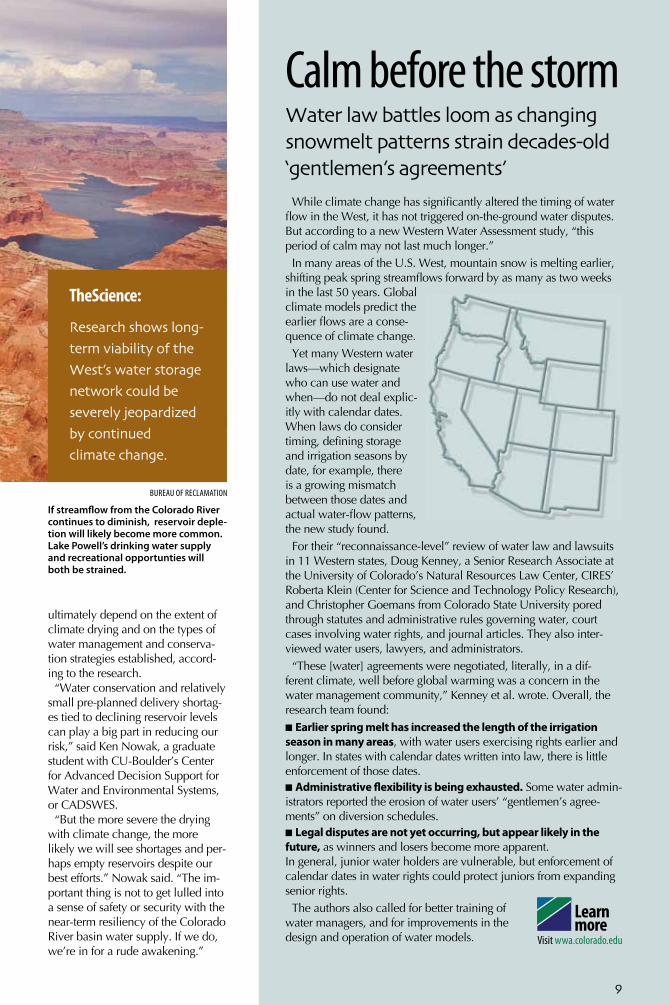
calm before the stormWater law battles loom as changing snowmelt patterns strain decades-old ‘gentlemen’s agreements’While climate change has significantly altered the timing of water
flow in the West, it has not triggered on-the-ground water disputes. But according to a new Western Water Assessment study, “this period of calm may not last much longer.”In many areas of the U.S. West, mountain snow is melting earlier,
shifting peak spring streamflows forward by as many as two weeks in the last 50 years. Global climate models predict the earlier flows are a conse-quence of climate change. Yet many Western water
laws—which designate who can use water and when—do not deal explic-itly with calendar dates. When laws do consider timing, defining storage and irrigation seasons by date, for example, there is a growing mismatch between those dates and actual water-flow patterns, the new study found. For their “reconnaissance-level” review of water law and lawsuits
in 11 Western states, Doug Kenney, a Senior Research Associate at the University of Colorado’s Natural Resources Law Center, CIRES’ Roberta Klein (Center for Science and Technology Policy Research), and Christopher Goemans from Colorado State University pored through statutes and administrative rules governing water, court cases involving water rights, and journal articles. They also inter-viewed water users, lawyers, and administrators. “These [water] agreements were negotiated, literally, in a dif-
ferent climate, well before global warming was a concern in the water management community,” Kenney et al. wrote. Overall, the research team found:n Earlier spring melt has increased the length of the irrigation season in many areas, with water users exercising rights earlier and longer. In states with calendar dates written into law, there is little enforcement of those dates.n Administrative flexibility is being exhausted. Some water admin-istrators reported the erosion of water users’ “gentlemen’s agree-ments” on diversion schedules. n Legal disputes are not yet occurring, but appear likely in the future, as winners and losers become more apparent. In general, junior water holders are vulnerable, but enforcement of calendar dates in water rights could protect juniors from expanding senior rights. The authors also called for better training of
water managers, and for improvements in the design and operation of water models.
ultimately depend on the extent of climate drying and on the types of water management and conserva-tion strategies established, accord-ing to the research.“Water conservation and relatively
small pre-planned delivery shortag-es tied to declining reservoir levels can play a big part in reducing our risk,” said Ken Nowak, a graduate student with CU-Boulder’s Center for Advanced Decision Support for Water and Environmental Systems, or CADSWES. “But the more severe the drying
with climate change, the more likely we will see shortages and per-haps empty reservoirs despite our best efforts.” Nowak said. “The im-portant thing is not to get lulled into a sense of safety or security with the near-term resiliency of the Colorado River basin water supply. If we do, we’re in for a rude awakening.”
Bureau of reclamation
If streamflow from the Colorado River continues to diminish, reservoir deple-tion will likely become more common. Lake Powell’s drinking water supply and recreational opportunties will both be strained.
Learn more
Visit wwa.colorado.edu
TheScience:
Research shows long-term viability of the West’s water storage network could be severely jeopardized by continued climate change.
9

floating a flood theoryTheScience
Can studying a watershed’s topography and streamflow help predict a larger region’s flood risk?
10
When water topped the Upper Mississippi’s banks in June 2008, more than 30,000 people were evacuated from Iowa City and Cedar Rapids, Iowa. The soaked cities and surrounding communi-ties suffered more than $2 billion in damages. Today, recovery efforts are ongoing.The catastrophic event offered a
rare opportunity to test a nonlinear geophysical theory of floods, 20 years in the making. Spearheaded by CIRES Fellow Vijay Gupta, also a professor of civil and environ-mental engineering, the theory links spatial-temporal statistics of rainfall, streamflow, and flood-ing with physical watershed and channel network characteristics over spatial scales ranging from small tributary watersheds to large basins. According to Gupta, the theory seeks to resolve ques-tions such as those involving the relationship between a watershed’s topography, the geometry of its river network, and spatial statistical streamflow variation. Gupta’s motivation is to improve
real-time flood prediction, which is more art than science. Today’s fore-cast models typically rely on sparse precipitation data, and predictions are often compromised by a poor understanding of the hydrologic processes that govern rainfall and streamflow generation. “We still don’t understand the spatial vari-ability in these hydrologic processes well enough because it changes with spatial scales,” said Gupta.That’s shifting. Using flood data
from the Iowa River and Cedar basins, and an experimental basin in Mississippi, Gupta and his col-leagues have discovered a remark-able property: stream networks and floods are mutually related through self-similarity. As a result, scientists can extrapolate findings from a
small study area to a much larger one; relationships between stream network and flooding remain similar and can be quantified and predicted. “This gives us a foundation for ex-
tending our theories of flooding to ungauged catchments, where little data are available,” said Gupta.Gupta is now applying his theory
to the Whitewater Basin in west-ern Kansas. Using the watershed as a natural laboratory, he and his collaborative research team are test-ing relationships between rainfall intensities, estimated from radar and rain gauge data, and physical characteristics of the basin. They’ve selected 12 stream gauging sites, representing watersheds ranging from a few square kilometers to several hundred. Eventually, the researchers hope
to generalize the geophysical theory from describing individual flooding events to predicting annual flood statistics. They also hope to learn how the hydrology, landscape, and ecology of Whitewater respond to changes in climate, agriculture, and

fingerprints in waterWater might get little public attention for its role in climate
change, but water vapor is just as important a greenhouse gas as carbon dioxide. In 2008, CIRES’ David Noone and colleagues set up the first real-time experiments to measure water vapor on Hawaii’s Mauna Loa Mountain.There, at the high-altitude Mauna Loa Observatory, researchers
can make measurements of a part of the atmosphere where the relative humidity is very low. Understanding the water cycle in this low-humidity environment is important for evaluating water-vapor’s role in amplifying Earth’s greenhouse effect.Noone spent October on the mountain, using a trio of new
optical sensors to measure isotopic differences of hydrogen and oxygen atoms in the water molecules of Hawaii’s air.
What are isotopes? Isotopes are different versions of the same atom, with
slightly different weights and slightly different behaviors. Water molecules with heavy isotopes preferentially con-dense, for example.
How do isotopes help science?Because condensation and evaporation occur in different
locations, and those processes favor different isotopes of water, scientists can use isotopes to “fingerprint” air masses, revealing where moisture is added and removed from the atmosphere. Isotopes of hydrogen and oxygen can help put constraints on the water budget, Noone said, and can also reveal cloud processes and the histories of air masses as they travel the globe.
What’s next?Ultimately, Noone plans to develop a long-term monitor-
ing network and use isotopes to learn about how changing humidity conditions–and the processes that drive them–will affect Earth’s climate.
cireSAtmospheric sciences professor David Noone “chills” by the cryo-genic trap, which collects water vapor molecules by freezing them.
Don Becker/u.S. GeoloGical SurVeY
2008’s record flood waters in Cedar Rapids, Iowa, and across the mid-west caused billions in damage and raised health concerns.
Awards
The American Geophysical Union awarded Vijay Gupta the prestigious 2008 Robert E. Horton Medal for his influential research in hydrology.
residential development.“The fundamental issue is whether
we can generalize what we see at Whitewater to other watersheds,” said Gupta. “Success on this front would break new ground in flood prediction.”
11

Imagine a climate model as a black box. You put something in, you get something out. But what happens when the output is com-pletely unexpected? “If you don’t get the results you
expect, that’s when you start to ask why,” said Peter Lawrence. Work-ing with CIRES Fellow Tom Chase, Lawrence was comparing climate simulations from the Community Land Model – part of a select group of global models used in the In-tergovernmental Panel on Climate Change’s 2007 climate change report – against observations.The model simulations weren’t
checking out.Despite adding more leafy vegeta-
tion to the modeled planet’s land surface, Lawrence and Chase found the simulated climate consistently produced less rainfall. “Imagine adding more tropical rainforest to
TheScience
CIRES researchers discover a glitch in an important climate system model.
H2orbittandem satellites monitor effects of glacial meltingIn South and Central Asia, more than half a
billion people rely on glacier-fed streams for drinking water, irrigation, and power genera-tion. A changing climate could put much of the region’s water supply at risk. That’s why researchers, including CIRES
graduate student Sam Dorsi, are now keeping an eye on Asia’s glaciers from space. Dorsi is working towards a doctoral degree in Atmo-spheric and Oceanic Sciences at the University of Colorado at Boulder.“Satellites offer researchers a way to capture
information from remote areas around the globe,” said Dorsi. They are a particularly im-portant tool for studying regions where ground measurements are sparse and complex terrain
and limited infrastruc-ture complicate field work efforts, he said. Dorsi works with
GRACE, or the Gravity Recovery and Climate Experiment, a satellite system capable of sensing changes in water storage both above and below ground. Using GRACE data, he found that Asia’s high mountain glaciers are shedding more than 30 billion
tons of water every year, enough to raise global sea levels 0.85 millimeters in a decade. But quantifying the exact contribution of Asian
glacial melt to sea level rise is tricky, he said. “Landlocked basins in South and Central Asia may store large amounts of runoff currently draining from the high mountains, and this could prevent runoff from contributing to sea level change,” said Dorsi. How can GRACE detect changes in water
storage? Orbiting the planet in tandem, the twin satellites sense tiny variations in Earth’s gravity field. Aquifers and ice fields add mass to the planet, creating pockets of stronger gravitational pull. Regions with stronger gravity fields tug on the satellite pair, increasing the speed of the first, and then the other, altering the normal distance between them. Researchers use these changes in the distance between the satellites to determine how much water has been lost from one region and added to another.
TheScience
A satellite that senses gravity variations gives CIRES researchers and others insight into Earth’s changing water cycle.
output: less rainfall?
12
input: more leafy vegetation

the planet and getting a drier, more desert-like climate,” said Chase. “It just didn’t make sense.” Their hunch? There was a snag in
the model’s water cycle. Water on land eventually makes
its way into the atmosphere through two processes. In one, the sun’s heat directly evaporates mois-ture from leaf surfaces, soils, and open-water sources. In the other, water is lost from plants by transpi-ration, a gas exchange associated with photosynthesis. Together, the two processes are called evapo-transpiration.Transpiration is an important
global humidifier, contributing nearly 50 percent of all evapotrans-piration worldwide, Chase said. But in the Community Land Model, transpiration was contributing just 15 percent. Evaporation from bare soils was putting three times as much water into the atmosphere. “Water is a very strong climate
modifier,” said Chase. “It impacts surface temperature, precipitation, and cloud formation. If we can’t capture fundamental hydrological processes in our climate models, we have no way to determine how human activities are affecting the
climate system.”Lawrence and Chase discovered
that the model’s hydrology was based on drainage patterns typical of watersheds just a few square miles in area. Yet, a single point in a global climate model can repre-sent several hundred square miles of Earth’s surface. The hydrology simply wasn’t scal-
ing to size in the model. Too much water was draining laterally, leav-ing little moisture for plants to take up through their root systems. The atmosphere, in turn, was spong-ing up most of its moisture from bare ground instead of from lush vegetation.To tackle the problem, Lawrence
and Chase borrowed a simpler hydrology scheme from a less com-plex biosphere model. Program-ming this simpler hydrology into the Community Land Model, they were able to simulate global tem-perature and precipitation patterns that matched observations. “Complexity doesn’t always get
you a better large-scale simulation. If you aren’t correctly representing complex interactions, you can be much better off keeping it simple,” said Lawrence.
Peter Lawrence, a
CIRES Visiting Fellow in
2004 and CIRES scientist
until 2008, is now with
the National Center for
Atmospheric Research,
working on the
integration of landcover
and climate.
Learn more
about cireS opportunities at cires.colorado.edu/jobs
13

1
When did you first become a fan of science?I’ve always enjoyed science. My biggest laboratory
was when I was a Grand Canyon river guide during and after college. Nowhere on the planet is more inspiring for asking huge questions about the history of the Earth than the depths of the Grand Canyon’s inner gorge with its nearly 2 billion-year-old schist and gneiss.
What are your favorite subjects?I’m a glutton for all knowledge. Amazon.com light-
ens my wallet on a regular basis. All forms of science, public policy, politics, economics, and medicine grab my interest.
Who inspires you?My wife. She is an unbelievably dedicated teacher at
Fairview High School, who works long hours to ben-efit the community, the state, the nation—all without much recognition.
Where has science taken you over the years?In recent years, all over the Southwest, including all
the major metropolitan areas that use Colorado River water—Los Angeles, Las Vegas, Tucson, Phoenix, Denver, Albuquerque.It has also taken me to Lee’s Ferry, the all-important
dividing line in the Colorado River Basin between the
2
3
4
14

MySphere Brad Udall, Western Water Assessment
coffee filters: coffee and dark chocolate are two things that “can make a huge mental dif-ference in almost any environ-ment,” says udall.
tupperware: Standard lunch includes bring-your-own pasta and fruit.
Side Desk: collection space for works in progress
the ties that Bind: udall takes pride in binding reports himself using his comb-binding machine.
mapping Water: “there’s not enough wall space for the post-ers i’d like to hang,” udall says.
the futon: the place of power naps, good ideas, and papers.
limes: udall adds zest to plain water with a little citrus.
Behavioral theory of the firm: a key reference guide for udall’s work on the nearly 40-person regional science consortium for the colorado river Basin.
1
2
3
4
5
6
7
8
Upper and Lower Basins. Lee’s Ferry is named for my great great grandfather, John D. Lee, the founder of the ferry.
What are you working on right now?I’m working on establishing a regional science con-
sortium with the key decision makers in the region to address large-scale Colorado River Basin water issues. Nearly 40 major players showed up to a meeting to begin talking about how we can establish this entity to help advance the science in the region of the United States most threatened by climate change, including assistant Secretaries, the head of the U.S. Geological
Survey, the Commissioner of Reclamation, and key water managers from Los Angeles, Las Vegas, Arizona, and Colorado.
What’s a key take home message from your research?Water will be the delivery mechanism for many of
the most important impacts of climate change. We’ll see all kinds of changes in the amounts, timing, and distribution of water as the globe heats during the 21st century. Many of these changes will challenge hu-mans, animals, and plants as we try to adapt to a very different world brought on by climate change.
5
6
7 8
How people work, research, and relax at CIRES
15

C I R E S
Printed on 100% recycled paper
The Cooperative Institute for Research in Environmental Sciences is a research institute dedicated to better understanding the Earth system.
Our research is essential for understanding the processes and feedbacks in many Earth science disciplines, and to foster cross-disciplinary understanding of the cryosphere, biosphere, atmosphere, geosphere, and hydrosphere. CIRES scientists are identifying and quantifying changes in a warming climate, providing baseline data against which to measure change, and informing the public and the policy makers about these changes.
CIRES is a joint institute of the University of Colorado at Boulder and the National Oceanic and Atmospheric Administration.
http://cires.colorado.edu twitter.com/theCIRESwire