spinning reserve requirements optimization based on an
TRANSCRIPT

Research ArticleSpinning Reserve Requirements Optimization Based onan Improved Multiscenario Risk Analysis Method
Liudong Zhang12 Yubo Yuan1 Xiaodong Yuan1 Bing Chen1 Dawei Su3 and Qiang Li1
1Electric Power Research Institute State Grid Jiangsu Electric Power Company Nanjing Jiangsu 211103 China2School of Electrical Engineering Southeast University Nanjing Jiangsu 210096 China3Electric Power Dispatch and Control Center State Grid Jiangsu Electric Power Company Nanjing Jiangsu 210024 China
Correspondence should be addressed to Liudong Zhang zldon_1987126com
Received 9 October 2016 Revised 20 February 2017 Accepted 27 February 2017 Published 15 March 2017
Academic Editor Paolo Crippa
Copyright copy 2017 Liudong Zhang et alThis is an open access article distributed under the Creative Commons Attribution Licensewhich permits unrestricted use distribution and reproduction in any medium provided the original work is properly cited
This paper proposes a novel security-constrained unit commitment model to calculate the optimal spinning reserve (SR) amountThe model combines cost-benefit analysis with an improved multiscenario risk analysis method capable of considering variousuncertainties including load and wind power forecast errors as well as forced outages of generators In this model cost-benefitanalysis is utilized to simultaneously minimize the operation cost of conventional generators the expected cost of load sheddingthe penalty cost of wind power spillage and the carbon emission cost It remedies the defects of the deterministic and probabilisticmethods of SR calculation In cases where load and wind power generation are negatively correlated this model based onmultistepmodeling of net demand can consider the wind power curtailment tomaximize the overall economic efficiency of system operationso that the optimal economic values of wind power and SR are achieved In addition the impact of the nonnormal probabilitydistributions of wind power forecast error on SR optimization can be taken into account Using mixed integer linear programmingmethod simulation studies on a modified IEEE 26-generator reliability test system connected to a wind farm are performed toconfirm the effectiveness and advantage of the proposed model
1 Introduction
Wind power generation has been used in many countriesas the most promising sustainable energy source to reducethe consumption of fossil fuels and curb emissions of car-bon dioxide However because of the stochastic volatil-ity and limited predictability of wind speed power sys-tem operations are significantly challenged by the large-scale wind power integration The influences include powerquality operating reserve transient stability and frequencyand voltage control [1 2] In particular the traditionalunit commitment (UC) with deterministic spinning reserve(SR) requirements cannot adequately cope with uncertainwind power generation Additional SR needs to be pro-vided to ensure operational reliability [3 4] Thereforevarious new methods taking into account wind poweruncertainty in [5ndash20] have been presented to determine SR
requirements These methods can mainly be divided intothree types
(i) The deterministic methods [5ndash9] in [5ndash9] the min-imum amount of SR is set to be the largest capacityof online generators or some proportion of thestandard deviation of the net demand or wind powerforecast error or their combination Although thesedeterministic methods are easy to implement theyare inadequate in dealing with the stochastic natureof various uncertainties in power systems and theeconomic efficiency of system operation
(ii) The probabilistic methods [10ndash13] in the reliability-constrained UC [10 11 13] and method [12] proba-bilistic reliability criteria that are defined by the lossof load probability (LOLP) or the expected energy not
HindawiMathematical Problems in EngineeringVolume 2017 Article ID 6510213 12 pageshttpsdoiorg10115520176510213
2 Mathematical Problems in Engineering
served (EENS) implicitly determine the SR require-ments In each time period the probabilistic methodcan ensure that the system will maintain a specifiedreliability level under which the optimal economicefficiency of system operation can be achieved How-ever this method neglects the setting of the reliabilitymetrics and the rationality of such metrics
(iii) The methods based on cost-benefit analysis [14ndash20] by introducing the notion of value of lost load(VOLL) the optimization of the SR requirementsbased on cost-benefit analysis conducts an economicvalue analysis for the cost and benefit of providingSR so as to achieve a tradeoff between economicsand reliability Thus the experiential settings of therequired SR amount [5ndash9] and reliability metrics [10ndash13] are avoided
It is well known that wind power generation needs tobe controlled by ldquospilling windrdquo owing to the transmissioncongestion Due to the fact that there is no fuel consumptionin wind power generation wind power spillage which is alsocalled ldquowind power curtailmentrdquo increases the load suppliedby conventional generators and thereby increases the fuelcost and emission cost of these generators On the otherhand in cases where load and wind power generation arenegatively correlated wind power spillage will diminish thepeak-valley difference of net demand so that the start-up andshutdown costs of peaking generators can be reduced [5]Moreover wind power spillage reduces the underestimationof wind power output which may decrease the system EENSand thus reduce additional SR amount Therefore besidessecurity issues these two conflicting and opposite effects ofwind power spillage should be considered while optimizingSR requirements from the overall economic and low-carbonefficiency of system operation
The UC in [5 6 14ndash18] comprehensively consider theeffects of wind power spillage on the total cost of systemoperation and SR quantification Nevertheless these studieshave other various limitations in system EENS calculationThe following are specifically mentioned
(i) Modeling a stochastic planning method based ona scenario tree is adopted in [14ndash16] to simulatethe probability distribution of forecast errors of netdemand or wind power so that the EENS of everyscenario can be determined However the forcedoutage rates (FOR) of generators are not taken intoaccount whichmay lead to an underestimation of SRSimilarly Lee [17] used a capacity outage probabilitytable to calculate the system EENS based on the sim-plified assumptions of wind power and load forecasterrors
(ii) Optimization process Ortega-Vazquez [18] consid-ered the load and wind power forecast errors as wellas FOR of generators in determining the optimal SRamount for each time period In reserve-constrainedUC these SR requirements are then set as constraints
However based on a time-decoupled UC prob-lem the preprocessing may result in a suboptimalsolution
The aforementioned conservative methods [14ndash18] canbe improved by using a multiscenario risk analysis method[20] that is capable of taking into account the probabilisticdistribution of load and wind power forecast errors as wellas FOR of generators However wind power spillage andthe nonnormal probability distributions of load and windpower forecast errors cannot be taken into account in thesystem EENS calculation in [20] This may affect the optimaldetermination of SR requirements
Therefore based on [20] and by combining cost-benefit analysis with an improved multiscenario risk analysismethod this paper proposes a novel security-constrainedunit commitment (SCUC) model to determine the opti-mal SR amount Specifically in order to consider windpower spillage and the nonnormal probability distributionof wind power forecast error in system EENS calculationthe single discretization of net demand forecast error in[20] is extended into the respective discretization of windpower and load forecast errors After the EENS undereach scenario is calculated the system EENS can be deter-mined by probability-weighted aggregation The proposedUC model can be formulated as mixed integer linear pro-gramming (MILP) and solved with a commercial solverlike CPLEX to improve the computational efficiency androbustness
The contributions and added value of this paper com-pared with the respective cited methods are threefold (1)an improved multiscenario risk analysis method capable ofconsidering various uncertainties including load and windpower forecast errors as well as forced outages of generatorsis proposed to optimize the spinning reserve requirements(2) comparedwith the respective citedmethods including thedeterministic methods [5ndash9] and probabilistic methods [10ndash13] as well as the cost-benefit analysis [14ndash20] the proposedmethod can consider the impacts of various uncertaintiesincluding the nonnormal probability distributions and cur-tailments of wind power on the overall economic efficiencyof system operation via combining cost-benefit analysis withthe proposed improved multiscenario risk analysis methodso that the optimal economic values of wind power and SRare achieved (3) the proposed UC model is formulated as aMILP which can be solved effectively via commercial solversHowever it should be noted that the practical limitation ofthe proposed method is its computational efficiency Becauseof the huge number of decision variables caused by variousuncertainties including forecast errors of load and windpower as well as FOR of generators the simulation timesof [20] and the proposed method are larger than the onesof the deterministic methods and probabilistic methodsHence the method in [20] and the proposed method arenot suitable for online applications of a large-scale powersystem
The remainder of this paper is laid out as followsFirst of all Section 2 presents the procedure of improved
Mathematical Problems in Engineering 3
EENS calculation method with consideration of wind powerspillage and the nonnormal probability distribution of windpower forecast error Then the SCUC model is proposedin Section 3 After that in Section 4 the case studies andsimulation results analysis are presented At last in Section 5main conclusions are summarized
2 Formulation of EENS
In this section based on multistep modeling of net demandan improved multiscenario risk analysis method capable oftaking into account different probability distributions of theload and wind power forecast errors as well as FOR ofgenerators is proposed to determine the system EENS withconsideration of wind power spillage The formulation ofEENS is later transformed into an equivalent MILP form
21 Improved EENS Calculation Method with Considerationof Wind Power Spillage The system EENS is caused by theavailable SR not being able to meet the excess of load andwind power forecast errors plus shortfalls in the power outputof online generators [20] In this paper the unit of EENS isMWh
In [20] the generator outages are a series of binary vari-ables whereas the net demand forecast error is a continuousvariable In general the EENS formulation can be dividedinto three steps
Step 1 Based on ldquo119873 minus 1rdquo or ldquo119873 minus 2rdquo contingency rules ascenario set is constructed
Step 2 The normal distribution of net demand forecast erroris discretized into NL (NL = 7) intervals and then combinedwith the contingency events in each scenario
Step 3 By summing the expectations of NL intervals result-ing in some loss of load the EENS in a scenario is determinedThe total system EENS is the summation of all EENS ofeach scenario weighted by probabilities of correspondingscenarios
Unlike [20] wind power spillage and the nonnormaldistribution of load and wind power forecast errors areconsidered in the system EENS calculation of the proposedmethod The method in [20] is unable to combine windpower spillage with net demand forecast error and deal withdifferent probability distributions Consequently the singlediscretization of net demand forecast error in Step 2 of [20]needs to be extended into the respective discretization ofwind power and load forecast errors Therefore the threesteps in [20] are extended into four steps in the proposedmethod as shown in Figure 1
In Step 1 only single-outage random events are consid-ered because multiple-outage random events have relativelysmall probabilities in the scheduling horizon while consum-ing far more computational resources In addition the prob-ability distribution of wind power and load forecast errors inSteps 2 and 3 can be divided into smaller intervals Though
Step 1Contingency
events
Step 2Discretization of
net demandforecast error
Step 1Contingency
events
Step 2Discretization of
wind powerforecast error
considering windpower spillage
Step 3Discretization of
load forecasterror
Method of [20]
e proposed method
Step 3Total system
EENS calculationStep 4
Total systemEENS calculation
Figure 1 Comparison of EENS calculation process between themethod of [20] and the proposed method
higher accuracy of the result can be achieved with smallintervals more computational resources will be required
22 Procedure of Improved EENS Calculation Method withConsideration of Wind Power Spillage and the NonnormalProbability Distribution The improved EENS calculationprocess with consideration of wind power spillage and thenonnormal probability distribution can be described asfollows
Step 1 Note that the random outage events among NIgenerators are independent of each other The probability 119875119905119894of all scheduled generators available except generator 119894 is
119875119905119894 = 119906119905119894119880119894NIprod119895=1119895 =119894
(1 minus 119906119905119895119880119895) asymp 119906119905119894119880119894 (1)
NI + 1 fault scenarios can be constructed according tono contingency event and single-order contingency eventsDuring period t taking scenario 119904 as an example the deficientor redundant SR amount 120583119905119904 of other generators in accordancewith the outage generator 119894 under scenario 119904 can be calculatedas
120583119905119904 =NIsum119895=1
119903119905119895 minus (119901119905119894 + 119903119905119894 ) (2)
Note that the scenario of no contingency event is the basescenario when 119904 = 0Step 2 Wind power forecast error is considered to follow anonnormal distribution in [21 22] similar to load forecasterror But for the convenience of description and withoutloss of generality the normal distribution is still chosen asan example in this paper The normal distribution of wind
4 Mathematical Problems in Engineering
a1 a3 a3 a4 a5 a6 a7
휇tW minus 3휎t
W 휇tW minus 2휎t
W 휇tW minus 휎t
W 휇tW 휇t
W + 휎tW 휇t
W + 2휎tW 휇t
W + 3휎tW
Figure 2 Seven-interval discretization of normal distribution of wind power forecast error
power forecast error is approximately discretized into NL(NL = 7) intervals Figure 2 shows typical seven-intervaldiscretization of wind power forecast error modeled as acontinuous normally distributed random variable with zeromean 120583119905119882 and a standard deviation 120590119905119882 The probability ofinterval 1198971 is 1205791198971 and the width of each interval is 120590119905119882 For eachinterval 1198971 (1198971 = 1 2 7) the midvalue 1198861198971 = 120583119905119882 + (1198971 minus(NL + 1)2)120590119905119882 represents the value of corresponding wholeinterval Figure 2 shows typical seven-interval discretizationof continuous normal distribution of wind power forecasterror
Combining the realization of uncertainties of generatorsin fault scenarios with NL intervals of wind power forecasterror (NI + 1) timesNL new scenarios can be constructed Thenafter adding 1198861198971 to 120583119905119904 the system forecast error 1205831199051199041198971 caused bythe uncertainties of generators and wind power forecast errorcan be formulated as
1205831199051199041198971=
120583119905119904 + 1205821199051198971 [(1198971 minus (NL + 1)2 ) 120590119905119882 + 119904119905119882] 1198971 isin [1 4]120583119905119904 + (1198971 minus (NL + 1)2 ) 120590119905119882 1198971 isin [5NL]
(3)
In (3) a binary variable 1205821199051198971 is introduced to judge whether 119904119905119882has effects on the value ofwind power forecast error (1198971minus(NL+1)2)120590119905119882 (1198971 le 4) When 1198971 ge 5 wind power spillage has noeffect on the overestimation ofwind power outputThebinaryvariable 1205821199051198971 (1198971 le 4) satisfies
1205821199051198971 = 1 if (1198971 minus (NL + 1)2 ) 120590119905119882 + 119904119905119882 lt 00 otherwise (4)
The nonlinear conditional expression in (4) can be equiv-alent to the following linear inequalities
minus [(1198971 minus (NL + 1) 2) 120590119905119882 + 119904119905119882]sumNI119894=1 119901max119894
le 1205821199051198971le 1 minus [(1198971 minus (NL + 1) 2) 120590119905119882 + 119904119905119882]sumNI
119894=1 119901max119894
(5)
Step 3 Load forecast error is similarly modeled as a nor-mally distributed random variable with zero mean 120583119905119871 anda standard deviation 120590119905119871 The probability distribution of loadforecast error can be similarly discretized into NL intervalsand the probability of interval 1198972 is denoted as 1205791198972 In eachinterval 1198972 1205831199051199041198971 is subtracted from (1198972 minus (NL + 1)2)120590119905119871 tocalculate the total system forecast error The intervals onlyneed to satisfy
(1198972 minus (NL + 1)2 ) 120590119905119871 minus 1205831199051199041198971 gt 0 (6)
In order to differentiate the intervals satisfying (6) fromothers it is necessary to introduce another new binaryvariable 11988711990511990411989711198972 which satisfies
1198871199051199041198971 1198972 = 1 if (1198972 minus (NL + 1) 2) 120590119905119871 minus 1205831199051199041198971 gt 00 otherwise (7)
The nonlinear formulation above can be linearized to
[(1198972 minus (NL + 1) 2) 120590119905119871 minus 1205831199051199041198971]sumNI119894=1 119901max119894
le 11988711990511990411989711198972le 1 + [(1198972 minus (NL + 1) 2) 120590119905119871 minus 1205831199051199041198971]sumNI
119894=1 119901max119894
(8)
Step 4 During period t the EENS in each scenario con-structed in Step 2 can be determined by summing theexpectations of all intervals causing some loss of load asexpressed in
EENS1199051199041198971 =NLsum1198972=1
[(1198972 minus NL + 12 ) 120590119905119871 minus 1205831199051199041198971] 12057911989721198871199051199041198971 1198972 (9)
Then during period 119905 the total system EENS is thesummation of EENS1199051199041198971 weighted by probabilities of corre-sponding scenarios
EENS119905 = NIsum119904=0
NLsum1198971=1
EENS11990511990411989711205791198971119875119905119904 (10)
Mathematical Problems in Engineering 5
It is worth noting that when the assumptive normaldistribution of wind power forecast error is not correctthe aforementioned EENS calculation method will still bevalid By discretizing the new probability distribution of windpower forecast error into several intervals in Step 2 1198861198971 in (3)(4) and (5) and 1205791198971 in (10) can be replaced by the values ofwind power forecast error and probability in each intervalrespectively In the same way the load forecast error whichfollows the nonnormal distribution can be similarly treated
23 EENS Linearization In (10) EENS119905 are formulated asthe sum of products of a continuous variable and threebinary variables According to the linearization methodin [23] EENS119905 can be transformed into a series of linearinequalities
The linearization process can be described as follows
Step 1 A binary variable 11991011990511990411989711198972 and a continuous variable 1199041199051198821198971are introduced Let1199101199051199041198971 1198972 be the product of the binary variable11988711990511990411989711198972 and the binary variable 119906119905119894 and let 1199041199051198821198971 be the product ofthe bounded continuous variable 119904119905119882 and the binary variable1205821199051198971 Then EENS119905 will be transformed into the summation ofproducts of a binary variable and a continuous variable Theabove new variables 11991011990511990411989711198972 and 1199041199051198821198971 can be equivalent to thefollowing linear constraints
0 le 11991011990511990411989711198972 le 119887119905119904119897111989721199101199051199041198971 1198972 le 1199061199051198941199101199051199041198971 1198972 ge 11988711990511990411989711198972 + 119906119905119894 minus 1
(11)
minus1205821199051198971119882119905119891 le 1199041199051198821198971 le 12058211990511989711198821199051198911199041199051198821198971 le 119904119905119882 + (1 minus 1205821199051198971)1198821199051198911199041199051198821198971 ge 119904119905119882 minus (1 minus 1205821199051198971)119882119905119891
(12)
Step 2 Let EENS119905 = sumNI119904=0sumNL1198971=1
sumNL1198972=1
1198641199051199041198971 1198972 and 1198641199051199041198971 1198972 can beformulated as
1198641199051199041198971 1198972 = [(1198972 minus (NL + 1)2 ) 120590119905119871 minus 1205831199051199041198971] 120579119897112057911989721199101199051199041198971 1198972119880119894 (13)
where 1205831199051199041198971 = sumNI119895=1 119903119905119895 minus 119903119905119894 minus 119901119905119894 + 1205821199051198971(1198971 minus (NL + 1)2)120590119905119882 + 1199041199051198821198971
when 1198971 isin [1 4] It can be observed from (13) that 11986411990511990411989711198972is a nonlinear formulation consisting of the product of a
bounded continuous variable and a binary variable whichcan be equivalent to the following linear constraints
minus 1198801198941205791198971120579119897211991011990511990411989711198972NIsum119895=1
119901max119895 le 11986411990511990411989711198972
le 119880119894120579119897112057911989721199101199051199041198971 1198972 [119901max119894 + 3 (120590119905119871 + 120590119905119882)]
1198641199051199041198971 1198972le 11988011989412057911989711205791198972 [(1198972 minus NL + 12 ) 120590119905119871 minus 1205831199051199041198971]
+ 11988011989412057911989711205791198972 (1 minus 1199101199051199041198971 1198972)NIsum119895=1
119901max119895
1198641199051199041198971 1198972ge 11988011989412057911989711205791198972 [(1198972 minus NL + 12 ) 120590119905119871 minus 1205831199051199041198971]
minus 11988011989412057911989711205791198972 (1 minus 1199101199051199041198971 1198972) [119901max119894 + 3 (120590119905119871 + 120590119905119882)]
(14)
3 Problem Formulation of SCUC Based onCost-Benefit Analysis
In this section the mathematical formulation of the SCUCproblem is presented The expected cost of load shedding(ECLS) is expressed as the approximation of EENS given inSection 2multiplied byVOLL and then added to the objectivefunction of the proposed SCUC model so that the optimalwind power spillage and the optimal quantification of SR areachieved
31 Objective Function The objective function of conven-tional UC usually only considers the generation cost (GC)of conventional generators over all scheduling periods Thisgeneration cost contains the fuel cost start-up cost andSR cost of generators However in the proposed formu-lation based on cost-benefit analysis the SR requirementsare determined by minimizing the sum of generation costof generators and ECLS In addition though wind powerspillage results in additional fuel cost and carbon emissioncost (CC) of conventional generators the penalty cost (PC)of wind power spillage is still considered in the objectivefunction from the wind powerrsquos priority in scheduling policyand other environmental benefits of it Thus the objectivefunction of the proposed SCUC is defined as
minNTsum119905=1
(GC119905 + ECLS119905 + CC119905 + PC119905) (15)
311 Generation Cost of Conventional Generators The gener-ation cost consists of the start-up cost fuel cost and SR costof conventional generators which is calculated by
GC119905 = NIsum119894=1
(119888119894 (119906119905119894 119901119905119894) + 119888su119894119906119905119894 (1 minus 119906119905minus1119894 ) + 119888119903119894119903119905119894 ) (16)
6 Mathematical Problems in Engineering
where 119888119894(119906119905119894 119901119905119894 ) is the fuel cost of generator 119894 during period 119905which is described by the consumption characteristic curveof a quadratic function 119888su119894119906119905119894(1 minus 119906119905minus1119894 ) is the start-up costof generator 119894 during period 119905 119888119903119894119903119905119894 is the reserve cost ofgenerator 119894 to supply SR amount 119903119905119894 during period t
312 ECLS Here
ECLS119905 = EENS119905 times VOLL (17)
where VOLL is the generator outage loss value for users thatis the loss for outage of 1MWh electricity usually estimatedvia consumer survey [24]
313 Carbon Emission Cost of Conventional Generators Inthis paper it is supposed that CleanDevelopmentMechanism(CDM) in Kyoto Protocol [25] is the carbon trading mech-anism employed The carbon emission cost during period119905 CC119905 can be calculated by
CC119905 = 119870CDM (119872119905119862 minus 119872119905119863) (18)
The calculation of carbon emission cost (18) can bedivided into two cases
(i) When 119872119905119862 gt 119872119905119863 the carbon emission of powersystems exceeds the credit and119872119905119862 minus119872119905119863 is the exces-sive part Supplementary carbon emission allowanceobtained byCDM is then required thereby increasingthe cost for system operation
(ii) When 119872119905119862 le 119872119905119863 the carbon emission of powersystems is lower than the credit that is there issurplus which can be sold through emission transac-tion and the system operation cost is then decreasedequivalently
The total carbon emission 119872119905119862 during period 119905 is com-monly calculated by
119872119905119862 = NIsum119894=1
[120572119894 (119901119905119894)2 + 120573119894119901119905119894 + 120574119894 + 120585119894119890120582119894119901119905119894 ] (19)
Because (19) is too complex for calculation it can be replacedby the following equation given in [25]
119872119905119862 = NIsum119894=1
119865119888119894 [119888119894 (119906119905119894 119901119905119894 ) + 119888su119894119906119905119894 (1 minus 119906119905minus1119894 )]119870119865 (20)
where the unit of 119865119888119894 is tCO2tce where tce refers to the tonof standard coal equivalent
The carbon emission credit 119872119905119863 during period 119905 andthe total carbon emission credit 119872119863 of power systems aredetermined by the load of each period that is
119872119905119863 = (119872119863119871119905119891)sum119879119905=1 119871119905119891 (21)
314 Penalty Cost of Wind Power Spillage The penalty costof wind power spillage during period 119905 PC119905 is calculated by
PC119905 = 119881119878119904119905119882 (22)
32 Constraint Conditions
321 Power Balance Constraint One has
119871119905119891 minus 119882119905119891 + 119904119905119882 minus NIsum119894=1
119906119905119894119901119905119894 = 0 (23)
where 119904119905119882 satisfies 0 le 119904119905119882 le 119882119905119891322 SR Constraints of Generators Here one has
0 le 119903119905119894 le min (119906119905119894119901max119894 minus 119906119905119894119901119905119894 11987910119903119894119906) (24)
where 11987910119903119894119906 is the maximum 10-minute SR supplied bygenerator 119894 [17]323 Upper and the Lower Limits for the Power Output ofGenerators One has
119906119905119894119901min119894 le 119901119905119894 le 119906119905119894119901max
119894 (25)
324 Ramp-Rate Limits of Generators One has
minus119903119894119889 le 119901119905119894 minus 119901119905minus1119894 le 119903119894119906 (26)
325 Minimum Up- and Down-Time Constraints of Genera-tors One has
(119906119905minus1119894 minus 119906119905119894) (119879on119894119905minus1 minus 119879on
119894min) ge 0(119906119905119894 minus 119906119905minus1119894 ) (119879off
119894119905minus1 minus 119879off119894min) ge 0 (27)
326 Transmission Flow Limits Modeled by Direct CurrentPower Flow One has
119901119905119892119896 + (119901119905119908119896 minus 119901119905sw119896) minus 119901119905119889119896 = sum119895
(120575119905119895 minus 120575119905119896)119883119896119895minus119901max119896119895 le (120575119905119895 minus 120575119905119896)119883119896119895 le 119901max
119896119895 (28)
327 Carbon Trading Constraint Due to the restrictions offinancial and technical levels the carbon emission reductionby CDM has an upper bound expressed by
10038161003816100381610038161003816119872119905119862 minus 11987211990511986310038161003816100381610038161003816 le 10038161003816100381610038161003816119872119905119862 minus 11987211990511986310038161003816100381610038161003816max (29)
33 UC Problem Solution UC is a large-scale nonlinearnonconvexmixed integer programming problemwith a largenumber of discrete and continuous variables At presentvarious methods have been proposed for its solution from
Mathematical Problems in Engineering 7
the early complete enumeration priority list method anddynamic programming to the current branch-and-boundmethod and intelligent optimization algorithm in [8 17] Inrecent years the commercial software CPLEX has utilizedbranch-cutting on the basis of branch-and-bound methodand combined various techniques such as the heuristicmethod and cutting-plane algorithm to solve the MILPproblem So far CPLEX has been widely used to solve UCproblems in [5 7 14ndash16 18ndash20] by approximately linearizingthe UC problem to a MILP model Therefore this paper alsoadopts this solver for the solution of the proposed SCUCproblem where the operation cost in objective function givenby (15) and constraints (23)ndash(29) are linearized in accordancewith the method proposed in [18] which is presented in theAppendix
The deterministic methods and probabilistic methodsare incomplete without the inclusion of a discussion onthe impact of FOR From a computational point of viewthe addition of generator contingencies would render thesolution process of the UC problem of [20] and the proposedUC problem much more challenging The addition of asingle generator contingency also considering its possibletimes of failure would multiply the number of scenariosby the number of periods of the scheduling horizon Itcan be recalled that with each extra scenario there arecorresponding extra variables and constraints As a resultrealistically sized problems such as the European intercon-nected power systemmay be very hard to handle with currentcomputing tools in a reasonable amount of time requiredfor day-ahead UC However some modeling simplificationscould be considered One possibility is to make use of thescenario reduction techniques [26] Secondly decompositiontechniques [27] are promising because they exploit theintrinsic decomposable structure of the problem wherebyeach scenario is optimized individually under the commandof a master coordinating problem These aspects need to befurther investigated in subsequent researches
4 Case Studies and SimulationResults Analysis
The proposed method for determining SR in this sectionis tested and verified on a modified IEEE 26-generatorreliability test system Simulation studies are carried outto draw comparisons of UC results between the proposedmethod and method of [20] to verify the effectiveness andadvantage of the proposed SCUC model
41 Modified IEEE 26-Generator Reliability Test System Amodified IEEE 26-generator reliability test system is adoptedin this paper to verify the effectiveness of the proposedmodel In this system there are 26 thermal generators witha total capacity of 3105MW The hydro generating unitshave been omitted The transmission limits failure ratesramp rates cost coefficients and minimum up and downtime are obtained from [18 28] The power output of thegenerators committed at 119905 = 0 is obtained by the economicdispatch of the committed generators at a load level of
Table 1 Forecast data of load and power output of wind farm
Hour Load (MW) Power output of wind farm (pu)1 1700 08452 1730 09283 1690 09234 1700 08535 1750 08206 1850 07157 2000 04988 2430 04249 2540 033810 2600 037011 2670 019312 2590 038613 2390 059714 2050 069615 1820 081016 1750 095617 1700 089518 1730 069319 1860 058320 2150 046821 2400 039122 2480 027623 2200 056224 1840 0752
1840MW One wind farm is added at bus 14 Its capacity isset at 800MW 257 of the total conventional generationcapacity To illustrate the effect of wind power spillage on thedetermination of SR requirements Table 1 lists the forecastload and power output of wind farm used for testing It canbe observed from the table that the wind power output andload are negatively correlated The standard deviations ofload and wind power forecast error can be approximatelycalculated according to [18] VOLL is set at 4000 $MWh [20]119881119878 is set at 10 $MWh The CDM transaction price 119870CDMis 50 $tCO2 119865119888119894 is 3 tCO2tce and 119870119865 is 100 $tce [25]Considering the effects of maximizing carbon emission coston SR optimization the carbon emission credit 119872119879119863 is set at0
The proposed model is solved on a 266GHz Windows-based workstation with 8GB of RAM using a MILP solverCPLEX 125 under MATLAB environment When the dualitygap tolerance for CPLEX solver is set at 05 the computa-tion time is about 112 s
42 Comparison of the Proposed Method andthe Method of [20]
421 Necessity Analysis with Consideration of Wind PowerSpillage Wind power has been given priority in schedulingHowever the development of Chinese power grid in regionswith abundant wind energy resources (Xinjiang Ningxia
8 Mathematical Problems in Engineering
Table 2 Comparison of different costs between the proposedmethod and the method presented in [20]
Cost The proposed method Method in [20]Fuel cost ($) 22872181 22754548Start-up cost ($) 492900 615060SR cost ($) 5818561 6202223ECLS ($) 1577994 1596019Penalty cost ($) 8565 0Carbon emission cost ($) 19543341 19347031Total cost ($) 50390628 50514881
Transmission flow capacity limit 250MWTransmission flow capacity limit 500MW
020406080
100120140160180200
Win
d po
wer
curt
ailm
ent (
MW
)
5 10 15 20 250Time period (h)
Figure 3 Wind power curtailments with different capacity limits oftransmission lines
Gansu etc) is far behind the increase of installed wind powercapacity at present and thereby the large-scale wind poweraccommodation capacity of power systems is insufficientWind power spillage must be adopted to ensure the securityand stability of systems operation
When the capacity limit 500MW of the transmissionlines between buses 14 and 11 and 14 and 16 is modified to250MW in the test system it can be seen from Figure 3that the transmission flow capacity is insufficient and therebythe wind power cannot be completely accommodated inthe proposed method At this time the network securityconstraints in [20] which has no solution are not satisfiedThis verifies the necessity of utilizing multistep modeling ofnet demand to improve the traditional multiscenario riskanalysis method of SR optimization
422 Economic Analysis with Consideration of Wind PowerSpillage Compared with the method presented in [20] windpower spillage is taken into account Table 2 comparesdifferent costs (fuel cost start-up cost SR cost ECLS penaltycost carbon emission cost and total cost) between theproposedmethod and themethod of [20] over thewhole timeperiods It can be observed from this table that although thefuel cost of conventional generators the penalty cost and thecarbon emission cost increase when wind power spillage isconsidered reductions in ECLS SR cost start-up cost andtotal cost are achieved Therefore the optimal determination
Win
d po
wer
The proposed methodMethod of [20]
0 10 15 20 2550
102030
curt
ailm
ent (
MW
)
200300400500600
SR (M
W)
5 10 15 20 250Time period (h)
Figure 4 Comparison of wind power curtailments and SR betweenthe proposed method and the method in [20]
The proposed methodMethod of [20]
0005
01015
02025
03035
04045
05
EEN
S (M
Wh)
5 10 15 20 250Time period (h)
3 42 165 1716001002003
001002003004005
Figure 5 Comparison of EENS between the proposed method andthe method of [20]
of SR requirements and the optimal economic value of windpower are realizedThis verifies the advantage of the proposedmodel The lower total cost of the proposed method can beexplained in detail as in Table 2
Firstly Figure 3 shows the variation of wind powerspillage during all periods in the proposed method Figures4 and 5 compare the SR and EENS respectively between theproposed method and the method of [20]
(i) When the load level is low and wind power outputis large during periods 1ndash5 16 and 17 the amountof wind power spillage is not equal to zero This isbecause the cost of providing additional SR is higherthan the sum of increased fuel cost of conventionalgenerators the penalty cost and the carbon emissioncost caused by wind power spillage during theseperiods Consequently by increasing a small amountof wind power spillage the amount of SR is reducedand the system EENS is reduced simultaneouslyTake periods 3 and 16 as an example On the one handthismethod curtails wind power values 1187MWand2489MW respectively which leads to the penalty
Mathematical Problems in Engineering 9
The proposed methodMethod of [20]
5 10 15 20 250Time period (h)
5
10
15
20
25
Uni
t num
ber
Figure 6 Comparison of the generation schedules between theproposed method and the method of [20]
cost increase by 11870$ and 24890$ respectivelyand the carbon emission cost increase by 25640$and 57570$ respectively as well as the fuel costof conventional generators increase by 15262$ and35337$ respectively On the other hand the SR costdecreases by 53923$ and 110952$ respectively andECLS decreases by 3006$ and 5537$ respectively Insummary during period 3 the total scheduling costcan reduce by 4157$ During period 16 the amountof wind power spillage is larger and the sum ofthese costs increases by 1308$ caused by wind powerspillage However Figure 6 compares the generationschedules between the two methods It can be seenfrom this figure that when the system load level is lowduring periods 16 and 17 the outages of generators 13and 15 are avoided in the proposed method due toadditional wind power curtailments Consequentlythe start-up cost of generators during the next periodcan be reduced (see the comparison of start-up costshown in Table 2) and the overall economic efficiencyof system operation will be improved
(ii) When the load level is high and wind power outputis small during other periods more expensive gener-ators are committed As a result the sum of increasedfuel cost and the penalty cost caused by wind powerspillage is higher than the cost of providing additionalSR Hence the wind power will be completely accom-modated during high load levels
423 Simulation Analysis considering Different ProbabilityDistributions of Wind Power Forecast Error The study in[21] shows that the tail of the actual day-ahead wind powerforecast error data curve is situated between the Laplacedistribution and the normal distribution curve Kurtosis ischosen as the statistical parameter to evaluate the tail ofthe studied probability density function and the kurtosisof the actual wind power forecast error ranges from 3 to6 Therefore in this paper the kurtosis value of the newwind power forecast error is set at 48 which has thesame mean and standard deviation as the normal distri-bution in [18] This new probability density function is
Normal distributionProbability distribution with kurtosis 48
200250300350400450500550
SR (M
W)
5 10 15 20 250Time period (h)
Figure 7 Comparison of SR between different probability distribu-tions
Table 3 Parameters of seven-interval approximation for probabilitydistribution with kurtosis 48
Interval number Median (times120590119882119905) Range (times120590119882119905) Probability1 minus4 [minus5 minus3] 000492 minus235 [minus3 minus17] 004013 minus11 [minus17 minus05] 022644 0 [minus05 05] 045725 11 [05 17] 022646 235 [17 3] 004017 4 [3 5] 00049
similarly divided into seven probability intervals and themedian range and probability of each interval are shown inTable 31198861198971 in (3) (4) and (5) and 1205791198971 in (10) are taken from themedian and probability values of each wind power forecasterror interval in Table 3 respectively Figure 7 comparesthe SR capacity between the normal distribution and theprobability distribution with kurtosis 48 It can be seen fromthis figure that the tail region of forecast error will affect thedetermination of SR and using the normal distribution tomodel the wind power forecast error will lead to an increaseof the probability of SR insufficiency
5 Conclusions
Combining cost-benefit analysis with an improved multisce-nario risk analysis method capable of taking into accountthe load and wind power forecast errors as well as FOR ofgenerators a novel SCUC model with consideration of windpower spillage is proposed in this paper to determine theoptimal amount of SR
In order to consider wind power spillage and the nonnor-mal distribution of wind power forecast error in systemEENScalculation based on multistep modeling of net demandthe single discretization of net demand forecast error in[20] is extended into the respective discretization of windpower and load forecast errors From the results of simulationstudies in cases where load and significant wind power
10 Mathematical Problems in Engineering
generation are negatively correlated this model can curtailwind power to maximize the overall economic efficiency ofsystem operation so that the optimal economic value of windpower and the optimal quantification of SR are achievedFurthermore case studies show that the tail region of windpower forecast error will affect the determination of SR andusing the normal distribution to model the wind powerforecast error may lead to an increase of the probability ofSR insufficiency
Appendix
The fuel cost 119888119894(119906119905119894 119901119905119894 ) of generator 119894 in objective function canbe linearized to
119888119894 (119906119905119894 119901119905119894) = (NKsum119896=1
119888119896119894119901119905119896119894 + 119888min119894119906119905119894)
119901119905119894 = 119906119905119894119901min119894 + NKsum
119896=1
119901119905119896119894(A1)
where 119888119896119894 and 119888min119894 are cost slope of segment 119896 andminimumfuel cost respectively of generator 119894 and 119888119896119894 meets 1198881119894 le 1198882119894 lesdot sdot sdot le 119888NK119894 119901119905119896119894 is the power output of generator 119894 in segment119896 during period 119905
The start-up cost 119888su119894119906119905119894(1minus119906119905minus1119894 ) of generator 119894 in objectivefunction can be linearized to
119888su119894119906119905119894 (1 minus 119906119905minus1119894 ) = 119888su119894 (119906119905119894 minus 119909119905119894)119909119905119894 le 119906119905119894119909119905119894 le 119906119905minus1119894119909119905119894 ge 119906119905119894 + 119906119905minus1119894 minus 1
(A2)
where 119909119905119894 is an auxiliary binary variableThe upper and lower limits (25) for the power output of
generators can be linearized to
0 le 1199011199051119894 le 119906119905119894 (1199011198921119894 minus 119901min119894 )
0 le 1199011199052119894 le 119906119905119894 (1199011198922119894 minus 1199011198921119894)
0 le 119901119905NK119894 le 119906119905119894 (119901max119894 minus 119901119892(NKminus1)119894)
(A3)
where 119901min119894 1199011198921119894 1199011198922119894 119901119892(NKminus1)119894 and 119901max
119894 are the NKpower points respectively of linearized power output inter-val [119901min
119894 119901max119894 ] of generator 119894
The ramp-rate limits (26) of generators can be linearizedto
119901119905119894 minus 119901119905minus1119894 le (1 minus 119904119905119894) 119903119894119906 + 119904119905119894119901min119894 (A4)
119901119905minus1119894 minus 119901119905119894 le (1 minus 119889119905119894) 119903119894119889 + 119889119905119894119901min119894 (A5)
119904119905119894 minus 119889119905119894 = 119906119905119894 minus 119906119905minus1119894 (A6)
119904119905119894 + 119889119905119894 le 1 (A7)
where the binary variables 119904119905119894 and 119889119905119894 are introduced to judgewhether the generator 119894 is in the start-up or shutdown processduring period 119905 respectively
The minimum up- and down-time constraints (27) ofgenerators can be linearized to
119906119898119894 = 1forall119898 isin [1 119879up
119894min minus 1198791198940] 119879off119894min gt 1198791198940 gt 0
119906119905119894 minus 119906119905minus1119894 le 119906119905+1119894119906119905119894 minus 119906119905minus1119894 le 119906119905+2119894
119906119905119894 minus 119906119905minus1119894 le 119906min119905+119879up
119894minminus1NT119894
forall119905 = 2 3 NT119906119898119894 = 0
forall119898 isin [1 119879off119894min + 1198791198940] minus119879off
119894min lt 1198791198940 lt 0119906119905minus1119894 minus 119906119905119894 le 1 minus 119906119905+1119894119906119905minus1119894 minus 119906119905119894 le 1 minus 119906119905+2119894
119906119905minus1119894 minus 119906119905119894 le 1 minus 119906min119905+119879off
119894minminus1NT119894
forall119905 = 2 3 NT
(A8)
where 1198791198940 denotes the number of periods in which generator119894 was committed or decommitted up to 119905 = 0 depending onthe sign
Nomenclature
119906119905119894 Binary variable denoting the onoffschedule of generator 119894 during period 119905119901119905119894 Power output of generator 119894 duringperiod 119905119903119905119894 Spinning reserve amount of generator 119894during period 119905120583119905119904 Deficient or redundant spinning reserveamount of other generators inaccordance with the outage generator 119894under scenario 1199041205831199051199041198971 System forecast error caused by theuncertainties of generators and windpower forecast error
Mathematical Problems in Engineering 11
119904119905119882 Amount of wind power spillage duringperiod 119905119882119905119891 Forecast value of wind power duringperiod 119905119871119905119891 Forecast value of load during period 119905120583119905119882 120590119905119882 Mean and standard deviation of windpower forecast error120583119905119871 120590119905119871 Mean and standard deviation of loadforecast error1198861198971 1205791198971 Value and probability of wind powerforecast error in interval 11989711205791198972 Probability of load forecast error ininterval 1198972119875119905119894 Probability of all scheduled generatorsavailable except generator 119894119903119894119906 119903119894119889 Ramp-up and ramp-down rates ofgenerator 119894 in MWh119879on
119894min 119879off119894min Minimum up and down time of
generator 119894119879on119894119905minus1 119879off
119894119905minus1 Up and down time which have beenaccumulated up to period 119905 minus 1119901119905119892119896 Power output of conventionalgenerators connected to bus 119896 duringperiod 119905119901119905119908119896 119901119905sw119896 Power output of wind farm connectedto bus 119896 and the corresponding amountof wind power spillage during period 119905119901119905119889119896 Load at bus 119896 during period 119905119883119896119895 Reactance of the transmission line 119896119895120575119905119896 Phase angle of voltage at bus 119896119901max
119896119895 Capacity limit of line 119896119895119901max119894 119901min
119894 Maximum and minimum power outputof generator 119894119880119894 Unavailability or forced outage rate ofgenerator 119894119888su119894 Start-up cost coefficient of generator 119894119888119903119894 Spinning reserve cost coefficient ofgenerator 119894119872119905119862 119872119905119863 Total amount of carbon emission andthe carbon emission credit of powersystems during period 119905119870CDM Clean Development Mechanismtransaction price120572119894 120573119894 120574119894 120585119894 and 120582119894 Carbon emission coefficients of thermalgenerator 119894119865119888119894 Equivalent carbon emission factor offuel for generator 119894119881119878 Unit penalty cost of wind power spillagein $MWh119870119865 Price of each ton of standard coal
NT Number of time periods in thescheduling horizon
NL Number of intervals of discrete windpower or load forecast error
SR Spinning reserveUC Unit commitmentSCUC Security-constrained unit commitment
VOLL Value of lost loadEENS Expected energy not servedLOLP Loss of load probabilityFOR Forced outage rateMILP Mixed integer linear programmingECLS Expected cost of load sheddingGC Generation costPC Penalty costCC Carbon emission costCDM Clean Development Mechanism
Conflicts of Interest
The authors declare that there are no conflicts of interestregarding the publication of this paper
Acknowledgments
The work described in this paper was supported by theProject Supported by State Grid Corporation of China (no5210EF150010) and Jiangsu Province Key Technologies RampDProgram (BE2014023)
References
[1] P B Eriksen T Ackermann H Abildgaard P Smith WWinter and J M R Garcia ldquoSystem operation with high windpenetrationrdquo IEEE Power and EnergyMagazine vol 3 no 6 pp65ndash74 2005
[2] J Kabouris and F D Kanellos ldquoImpacts of large-scale windpenetration on designing and operation of electric powersystemsrdquo IEEE Transactions on Sustainable Energy vol 1 no 2pp 107ndash114 2010
[3] D Liu Y Huang W Wang and J Guo ldquoAnalysis on provincialsystem available capability of accommodating wind powerconsidering peak load dispatch and transmission constraintsrdquoAutomation of Electric Power Systems vol 35 no 22 pp 77ndash812011
[4] G Dany ldquoPower reserve in interconnected systems with highwind power productionrdquo in Proceedings of the IEEE Porto PowerTech Conference 2001 Porto Portugal September 2001
[5] M H Albadi and E F El-Saadany ldquoComparative study onimpacts of wind profiles on thermal units scheduling costsrdquo IETRenewable Power Generation vol 5 no 1 pp 26ndash35 2011
[6] M AOrtega-Vazquez andD S Kirschen ldquoAssessing the impactof wind power generation on operating costsrdquo IEEE Transac-tions on Smart Grid vol 1 no 3 pp 295ndash301 2010
[7] X S Wu B H Zhang X M Yuan et al ldquoSolving unit com-mitment problems in power systems with wind farms usingadvanced quantum-inspired binary PSOrdquo Proceedings of theCSEE vol 33 no 4 pp 45ndash52 2013 (Chinese)
[8] C Wang Y Qiao and Z Lu ldquoA method for determination ofspinning reserve in wind-thermal power systems consideringwind power benefitsrdquoAutomation of Electric Power Systems vol36 no 4 pp 16ndash21 2012
12 Mathematical Problems in Engineering
[9] K Methaprayoon C Yingvivatanapong W-J Lee and J RLiao ldquoAn integration of ANN wind power estimation into unitcommitment considering the forecasting uncertaintyrdquo IEEETransactions on Industry Applications vol 43 no 6 pp 1441ndash1448 2007
[10] J Ge F Wang and L Z Zhang ldquoSpinning reserve model in thewind power integrated power systemrdquo Automation of ElectricPower Systems vol 34 no 6 pp 32ndash36 2010 (Chinese)
[11] N Menemenlis M Huneault and A Robitaille ldquoComputationof dynamic operating balancing reserve for wind power inte-gration for the time-horizon 1ndash48 hoursrdquo IEEE Transactions onSustainable Energy vol 3 no 4 pp 692ndash702 2012
[12] W Zhou H Sun H Gu Q Ma and X Chen ldquoDynamiceconomic dispatch of wind integrated power systems based onrisk reserve constraintsrdquo Proceedings of the Chinese Society ofElectrical Engineering vol 32 no 1 pp 47ndash55 2012
[13] M AMatos and R J Bessa ldquoSetting the operating reserve usingprobabilistic wind power forecastsrdquo IEEETransactions on PowerSystems vol 26 no 2 pp 594ndash603 2011
[14] F Bouffard and FDGaliana ldquoStochastic security for operationsplanning with significant wind power generationrdquo IEEE Trans-actions on Power Systems vol 23 no 2 pp 306ndash316 2008
[15] J M Morales A J Conejo and J Perez-Ruiz ldquoEconomicvaluation of reserves in power systems with high penetration ofwind powerrdquo IEEE Transactions on Power Systems vol 24 no2 pp 900ndash910 2009
[16] A Tuohy and M OrsquoMalley ldquoPumped storage in systems withvery high wind penetrationrdquo Energy Policy vol 39 no 4 pp1965ndash1974 2011
[17] T-Y Lee ldquoOptimal spinning reserve for a wind-thermal powersystem using EIPSOrdquo IEEE Transactions on Power Systems vol22 no 4 pp 1612ndash1621 2007
[18] MAOrtega-VazquezOptimizing the SpinningReserve Require-ments University of Manchester Manchester UK 2006
[19] P Su T Q Liu andX Y Li ldquoDetermination of optimal spinningreserve of power grid containing windrdquo Power System Technol-ogy vol 34 no 12 pp 158ndash162 2010 (Chinese)
[20] G Liu and K Tomsovic ldquoQuantifying spinning reserve insystems with significant wind power penetrationrdquo IEEE Trans-actions on Power Systems vol 27 no 4 pp 2385ndash2393 2012
[21] C Monteiro R Bessa V Miranda et al Wind Power Forecast-ing State-of-the-Art 2009 ArgonneNational Laboratory (ANL)2009
[22] R Billinton and R N Allan Reliability Evaluation of PowerSystems Plenum Press New York NY USA 2nd edition 1996
[23] J A Gubner Probability and random processes for electrical andcomputer engineers Cambridge University Press Cambridge2006
[24] K K Kariuki and R N Allan ldquoEvaluation of reliability worthand value of lost loadrdquo IEE ProceedingsmdashGeneration Transmis-sion and Distribution vol 143 no 2 pp 171ndash180 1996
[25] S Lu Y Wu S Lou and X Yin ldquoA model for optimizing spin-ning reserve requirement of power system under low-carboneconomyrdquo IEEE Transactions on Sustainable Energy vol 5 no4 pp 1048ndash1055 2014
[26] H Heitsch and W Romisch ldquoScenario reduction algorithmsin stochastic programmingrdquo Computational Optimization andApplications vol 24 no 2-3 pp 187ndash206 2003
[27] J R Birge and F Louveaux Introduction to Stochastic Program-ming Springer Series in Operations Research Springer NewYork NY USA 1997
[28] M A Ortega-Vazquez D S Kirschen and D Pudjianto ldquoOpti-mising the scheduling of spinning reserve considering the costof interruptionsrdquo IEE Proceedings Generation Transmissionand Distribution vol 153 no 5 pp 570ndash575 2006
Submit your manuscripts athttpswwwhindawicom
Hindawi Publishing Corporationhttpwwwhindawicom Volume 2014
MathematicsJournal of
Hindawi Publishing Corporationhttpwwwhindawicom Volume 2014
Mathematical Problems in Engineering
Hindawi Publishing Corporationhttpwwwhindawicom
Differential EquationsInternational Journal of
Volume 2014
Applied MathematicsJournal of
Hindawi Publishing Corporationhttpwwwhindawicom Volume 2014
Probability and StatisticsHindawi Publishing Corporationhttpwwwhindawicom Volume 2014
Journal of
Hindawi Publishing Corporationhttpwwwhindawicom Volume 2014
Mathematical PhysicsAdvances in
Complex AnalysisJournal of
Hindawi Publishing Corporationhttpwwwhindawicom Volume 2014
OptimizationJournal of
Hindawi Publishing Corporationhttpwwwhindawicom Volume 2014
CombinatoricsHindawi Publishing Corporationhttpwwwhindawicom Volume 2014
International Journal of
Hindawi Publishing Corporationhttpwwwhindawicom Volume 2014
Operations ResearchAdvances in
Journal of
Hindawi Publishing Corporationhttpwwwhindawicom Volume 2014
Function Spaces
Abstract and Applied AnalysisHindawi Publishing Corporationhttpwwwhindawicom Volume 2014
International Journal of Mathematics and Mathematical Sciences
Hindawi Publishing Corporationhttpwwwhindawicom Volume 2014
The Scientific World JournalHindawi Publishing Corporation httpwwwhindawicom Volume 2014
Hindawi Publishing Corporationhttpwwwhindawicom Volume 2014
Algebra
Discrete Dynamics in Nature and Society
Hindawi Publishing Corporationhttpwwwhindawicom Volume 2014
Hindawi Publishing Corporationhttpwwwhindawicom Volume 2014
Decision SciencesAdvances in
Discrete MathematicsJournal of
Hindawi Publishing Corporationhttpwwwhindawicom
Volume 2014 Hindawi Publishing Corporationhttpwwwhindawicom Volume 2014
Stochastic AnalysisInternational Journal of
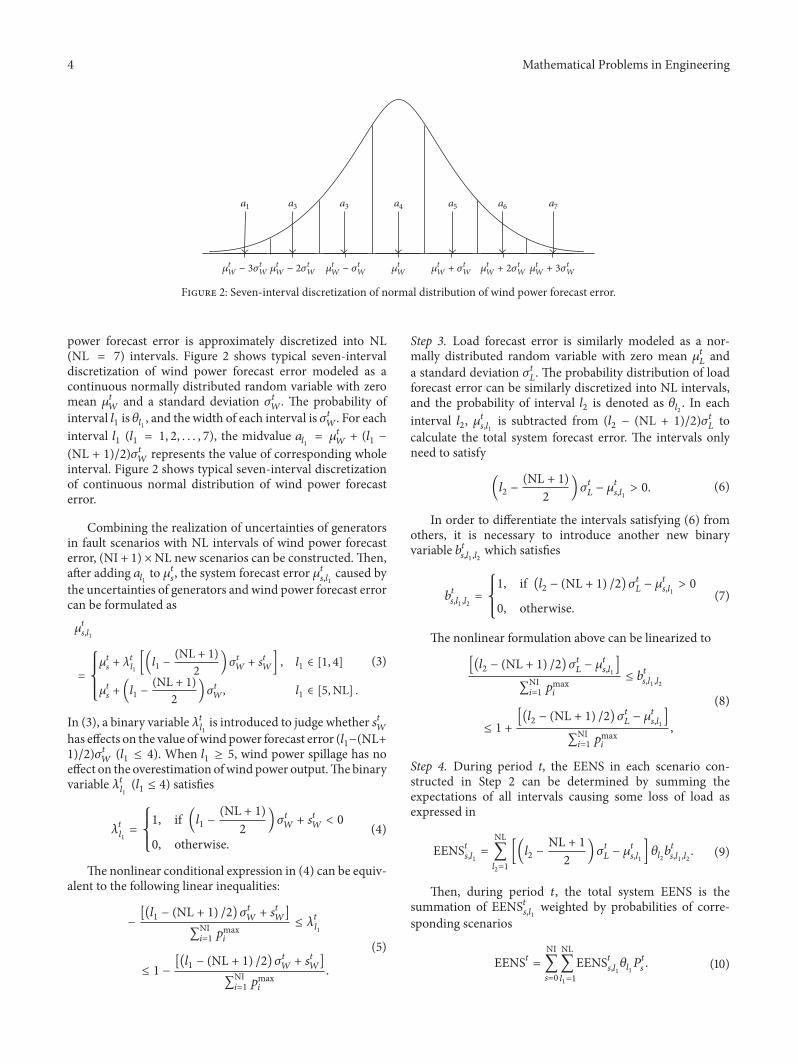
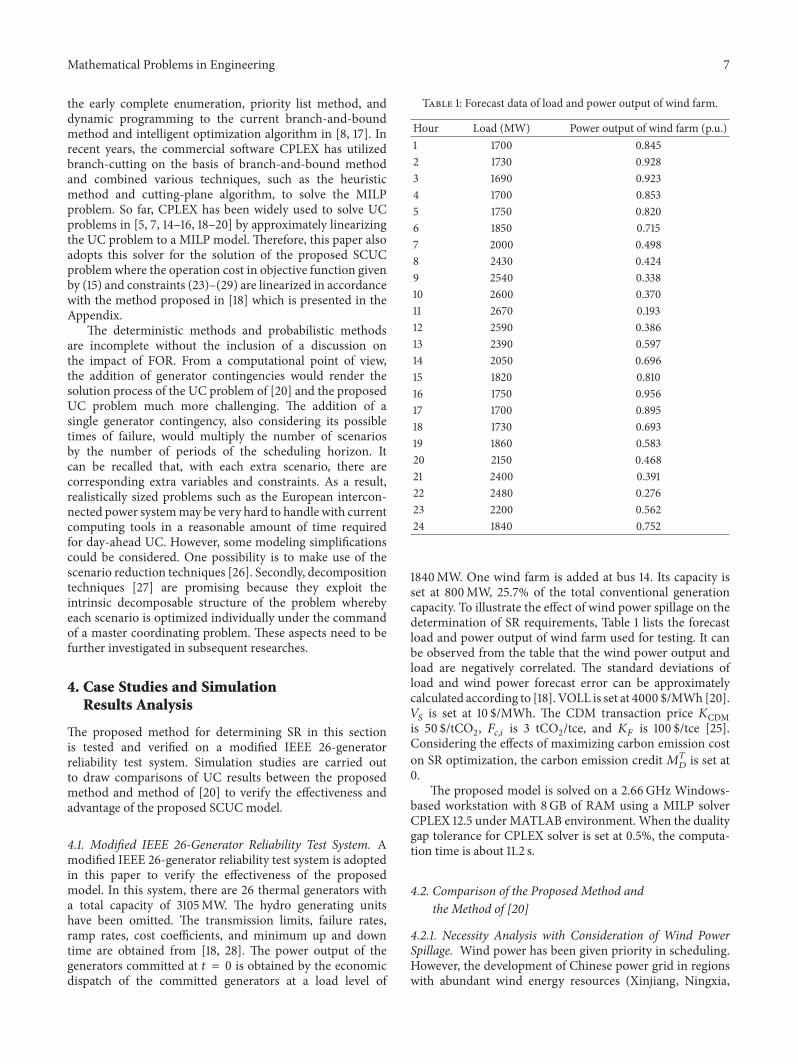
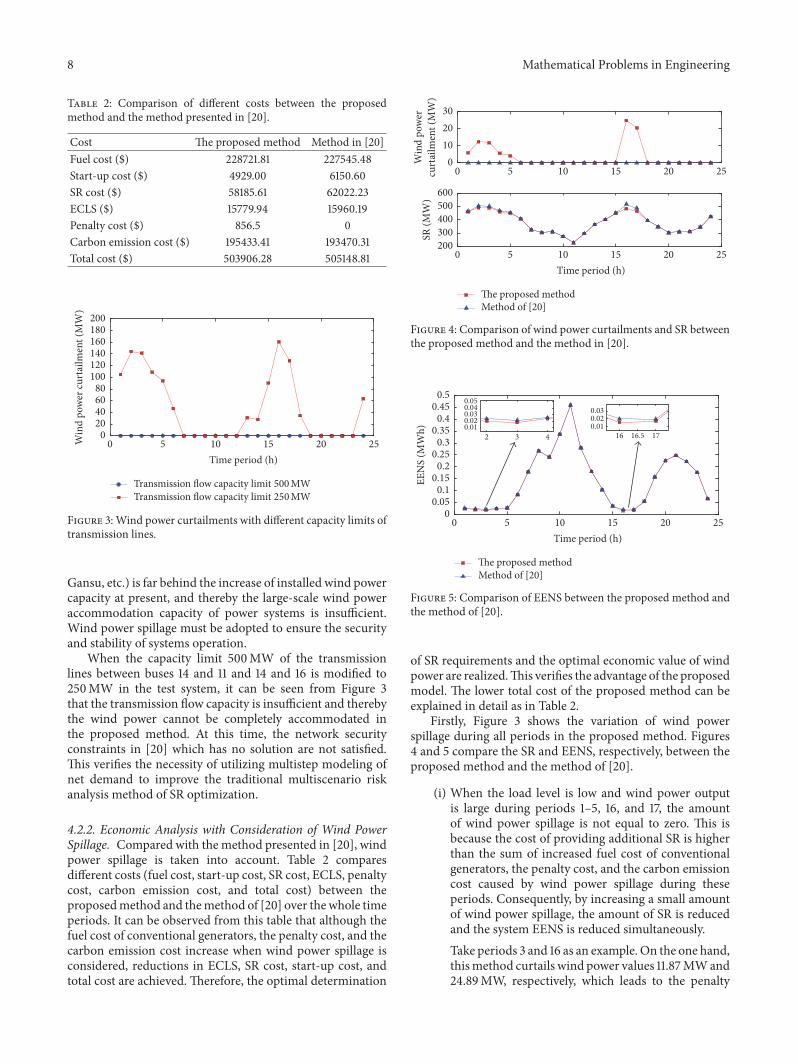
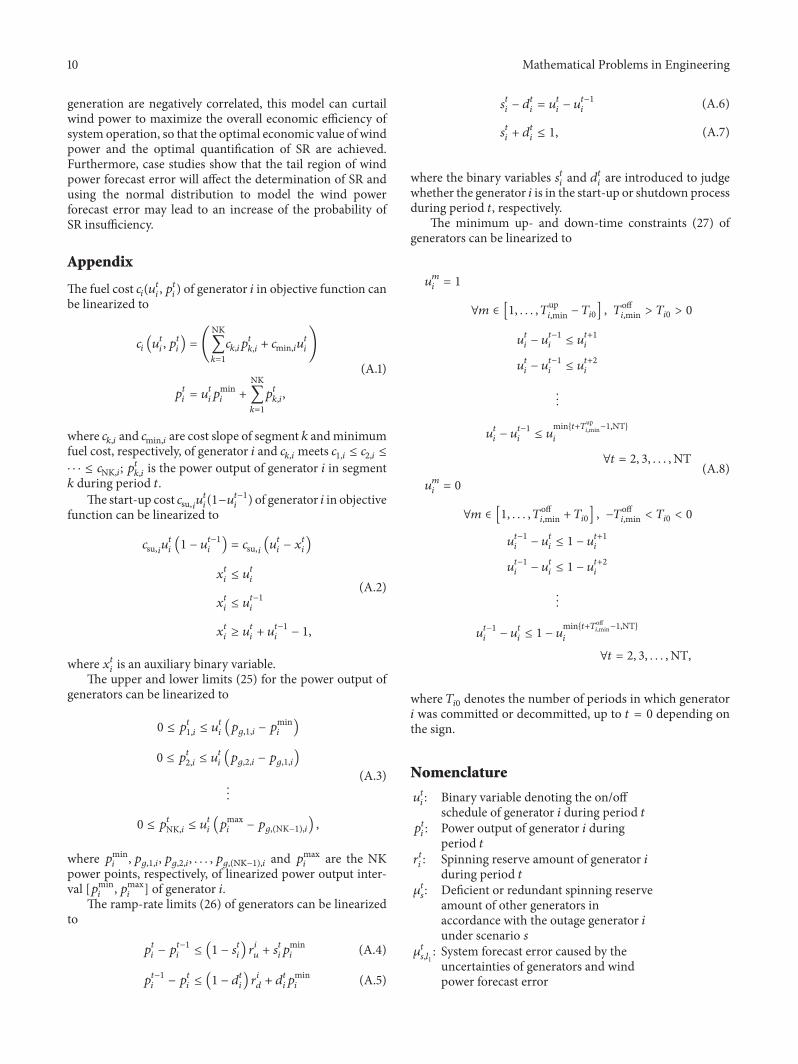
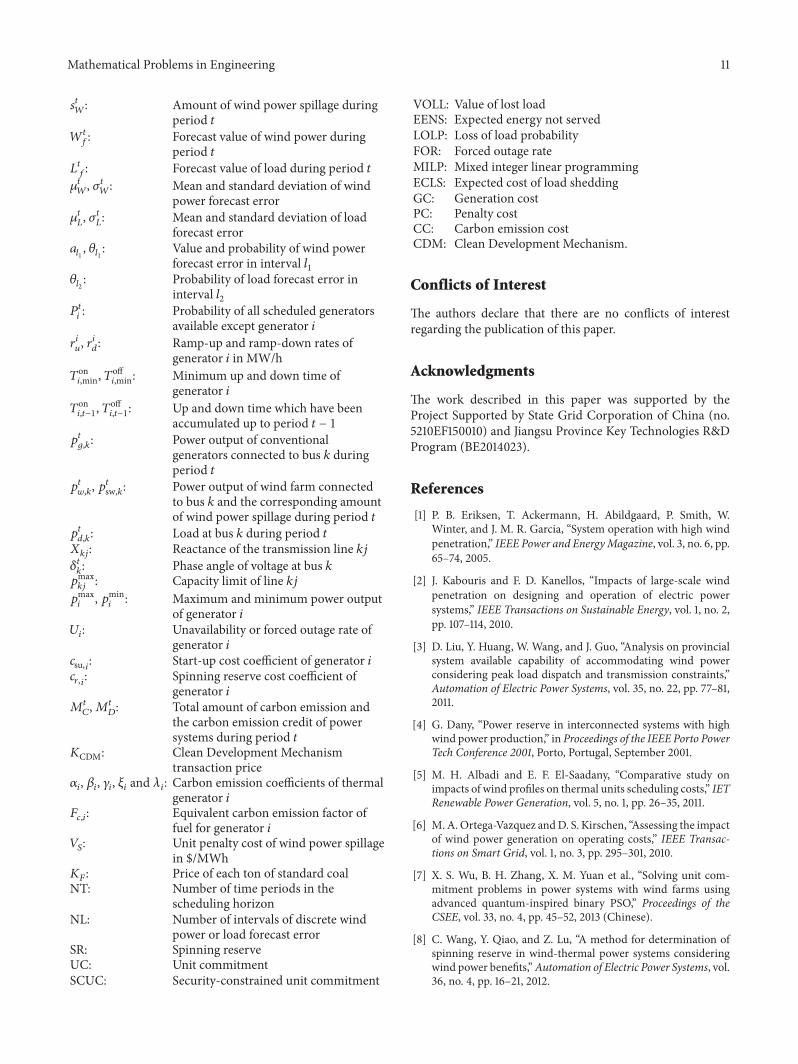