sponsoring - virginia department of transportation
TRANSCRIPT

MARSHALL MIX DESIGN CRITERIA
by
C. S. Hughes Senior Research Scientist
(The opinions, findings, and conclusions expressed report are those of the author and not necessarily
the sponsoring agencies.)
in this those of
(A Virginia Highway & Transportation Research Council
Cooperative Organization Sponsored Jointly by the Virginia Department of Highways & Transportation and
the University of Virginia)
Charlottesville, Virginia
July 198 0 VHTRC 81-R3

BITUMINOUS RESEARCH ADVISORY COMMITTEE
R. L. ALW00D, Chairman, District Materials Engineer, VDH&T
A. D. BARNHART, District Materials Engineer, VDHST
VDH&T P F CECCHINI, District Engineer,
J. L. CORLEY, Assistant District Engineer Construction, VDH&T
W. R. DAVIDSON, Assistant Maintenance Engineer, VDHgT
W. A. DENNISON, District Materials Engineer, VDHgT
C. E. ECHOLS, Asst. Prof. of Civil Engineering, U. Va.
R. V. FIELDING, Materials Engineer, VDH&T
C S. HUGHES !II, Highway Research Senior Scientist, VH$TRC
A. B. JOHNSON, Assistant Construction Engineer, VDHST
J. T. LOVE, Materials Engineer, Materials Division, VDHST
H. E. MARSHALL, Distmict Engineer, FHWA
C. G. MCALLISTER, Chief Chemist, Materials Division, VDH&T
R. S. THOMAS, Bituminous Engineer- Maintenance Div., VDHgT
R. D. WALKER, Chairman, Dept. of Civil Engineering, VPI g SU
±i

SUMMARY
This report discusses the basis of the original Marshall design criteria established by the Waterways Experiment Station and criteria used by the Asphalt Institute and Virginia Depart- ment of Highways and Transportation. Marshall test properties are discussed in detail, particularly the related physical con- cepts. Special attention is paid to obtaining the proper aggre- gate gradation through the use of the 0.45 power chart and the proper number of sieves for gradation control. Finally, 1979 field Marshall data from,..•.the eight construction districts are analyzed to provide an indication of the revision needed in the design criteria used by the Department. Use of these revised criteria is illustrated in a suggested design procedure.
iii


MARSHALL MIX DESIGN CRITERIA
by
C. S. Hughes Senior Research Scientist
INTRODUCTION
The Marshall apparatus for testing bituminous concrete was developed by Bruce G. Marshall in the 1940's, and the Corps of Engineers, Waterways Experiment Station (WES) developed design criteria for the Marshall equipment and reported the results in 1948.(1) Although Virginia has employed the Marshall procedure since the early 1950's, the basic concepts are of•en forgotten or changes are made over a period of time which may run counter to the criteria as developed. Because the sources of asphalt crude change rapidly, proper mix design requirements m.ay be more critical now than in past years.
The basic assumption in any asphalt mix design is that the gradation must be such that room is available for enough asphalt to provide durability but also that the asphalt will not overfill the voids and cause a fat surface.
This discussion is an attempt to thoroughly review the basic concepts of mix design in general and those of the Marshall design procedure in particular. It includes comments on gr.adations and presents the results of an analysis of design data obtained from the Department's construction districts in 1979.
MARSHALL TEST PROPERTIES
The mix properties determined by the Marshall testing procedure are defined below and some of these are illustrated by the curves in Figure i.
Stability
Stability is defined as the maximum load, in pounds, required to produce shear failure of a specimen when tested in the Marshall apparatus at 140°F. Stability is dependent upon both internal friction and cohesion.

154
152
150
148 ! !,!
.• 17
_z 15
5 6 7
1900
1800
1700
1600
1•1 'I '1'
5 6 7
5 6 7
ASPHALT CONTENT, PERCENT
12
< I0
o 8
6
"1 'I '1
.1
5 6 7
ASPHALT CONTENT, PERCENT
Figure I. Test properties utilized in Marshall method of mix design.
Unit, ,Weight The unit weight is the total weight of an asphaltic mixture,
including all aggregate and asphalt, in pounds per cubic foot.

Theoretical Maximum, ,Dgq,sit_y (TMD,) The TMD is the theoretical density of the total asphalt mix-
ture in which all voids are eliminated. It is usually determined by first obtaining the theoretical maximum specific gravity (TMSG) and then multiplying by 62.4 to convert to density. The TMSG can be determined by the Rice method, in which vacuuming is used to extract all the air from the mixture, or it can be calculated from the specific gravities and percentages of the ingredients. Because the latter method is based upon the average specific gravity of an aggregate and upon the percentage of aggregate indicated in the de- sign, it may produce more inaccuracies than the Rice method, which tests the actual mix. Although the result from the Rice method is an actual value, it is still considered to be a theoretical specific gravity. This value is considered to be the most useful one against which to compare field values in determining percent compaction.
Percent Voids Total Mix (VTM)
The VTM is that part of the compacted mixture not occupied by aggregate or asphalt expressed as a percentage of the total volume. It is synonymous with air voids and is the complement of the per- cent density when based upon the TMSG.
Pe_r_cent. V.oids I•Min.eral Aggregate (VPLa.)_.
The VMA is the total percentage of voids in the compacted mix- ture not occupied by aggregate. It therefore includes the volume occupied by both air and the asphalt cement, excluding that absorbed by the aggregate. It is the complement of percent solids aggregate only.
Percent Voids Filled With Asphalt (VFA)
The VFA is the percentage of voids in the compacted aggregate mass that are filled with asphalt cement. It is synonymous with the asphalt-void ratio.
Flow Value
Flow is the total deformation, measured in hundredths of an inch, that occurs in the compacted specimen at the point of maximum load under the Marshall stability test.

0pt_imum Asphalt Content
The optimum asphalt content is that amount of asphalt in a pavement mixture judged to be most desirable using given criteria.
VOLUMETRIC RELATIONSHIP
The interrelationships of the above mentioned properties on
a volumetric basis are very important. Often a graphical repre- sentation such as that shown in Figure 2 helps one comprehend these relationships.
Bitumen <
Aggregate VSAI
VTM
V TMSG V SA 2
VSG
Figure 2. Theoretical volumetric relationships in a compacted asphalt specimen.

The volumetric symbols in Figure 2 are as follows"
VSG = Volume bulk specific gravity
VTMSG = Volume of theoretical maximum specific gravity
VTM Volume of voids total mix
V B : Volume of bitumen
: Volume of mineral aggregate (effective specific SA2 gravity
SA Volume of mineral aggregate (bulk specific i gravity)
VMA Volume of voids in mineral aggregate
VAB -= Volume of absorbed asphalt
The computations necessary to produce the volumetric relation- ships are-
wt.in air wt. in air Unit weight, pcf : •-S•- x 62.4 wt,' in-air Wt -i• -•a•er x 62 •
wt. in air wt. in air TMSG : VTMS G : volum•- of"solids
TMD,pc f = TMSG x 62.4
unit wt. Percent compaction : TMD x i00
VTM = I00 percent compaction
VMA = i00 V
V VFA = VMA
SA I
ORIGINAL MARSHALL CRITERIA
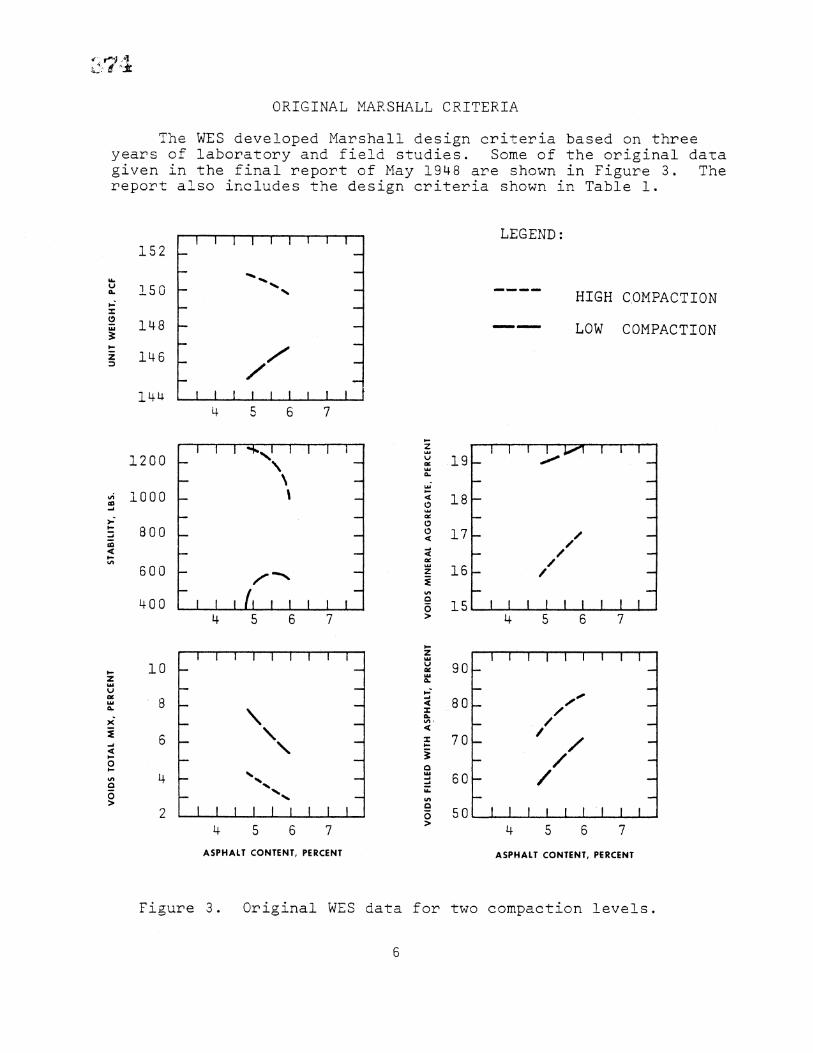
The WES developed Marshall design criteria based on three years of laboratory and field studies. Some of the original data given in the final report of May 1948 are shown in Figure 3. The report also includes the design criteria shown in Table i.
152
" "iS0
•- 148
• 146
1200
I000
800
600
400
i0
1" '! I'
f
I,,,I •,1 •1 4 5 6 7
-.I fl U 5 6
%
4 5 6 7
ASPHALT CONTENT, PERCENT
18
17
16
15
,• 80
70
• 5(?
LEGEND-
HIGH COMPACTION
LOW COMPACTION
/ /
! ..1 1• 4 5 6 7
-I 1' I'
I. 4 5 6 7
ASPHALT CONTENT, PERCENT
Figure 3. Original WES data for two compaction levels.

Table !
WES Design Criteria
Test Pr0per...ty Stability Flow
VTM
VFA
Criteria
500 lb. rain.
20 m•x.
3% 5%
75% 85%
The report presented the following conclusions"
i. The selection of the proper asphalt content is the most important factor in the design of an asphalt paving mixture.
2. For construction control, pavements should be rolled to produce 98% of the density obtained when specimens are compacted by the Marshall method.
3. Filler is a void-filling material that will increase both the stability and density of a pavement mixture.
4. Asphalt cement is also a void-filling material and may be replaced by filler. The use of the most asphalt and the least filler consistent with the limiting criteria is considered de- sirable.
Although most of the report's other conclusions are well recognized, it is pertinent to list several of the too.st impomtant here. Many of these can be seen in Figure i.
i. The peak of the curve of stability versus asphalt content is considered an excellent criteria in selecting the optimum percentage of asphalt. (This will be discussed in more detail later.)
2. The flow test, as an integral part of the stability test, measures the relative plasticity of an asphaltic mixture.
3. Incremental increases of asphalt cement to the asphalt mixture will increase the flow value.
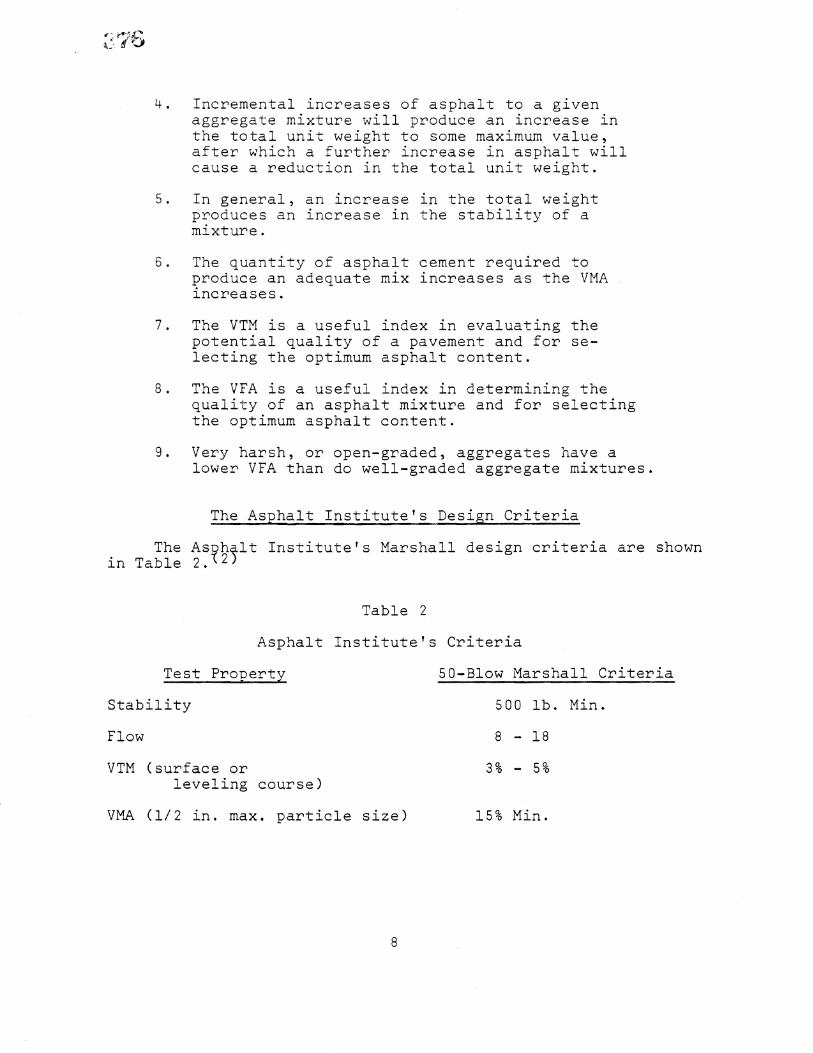
4. Incremental increases of asphalt to a given aggregate mixture will produce an increase in the total unit weight to some maximum value, after which a further increase in asphalt will cause a reduction in the total unit weight.
5. In general, an increase in the total weight produces an increase in the stability of a mixture.
6. The quantity of asphalt cement required to produce an adequate mix increases as the VMA Increases.
7. The VTM is a useful index in evaluating the potential quality of a pavement and for se- lecting the optimum asphalt content.
8. The VFA is a useful index in determining the quality of an asphalt mixture and for selecting the optimum asphalt content.
9. Very harsh, or open-graded, aggregates have a lower VFA than do well-graded aggregate mixtures.
The Asphalt Institute's Design Criteria
The As{2h•it Institute's Marshall design criteria are shown in Table 2.
Table 2
Asphalt Institute's Criteria
T e.§,,t Pronerty 50-Blow Marshall Criteria
Stability 500 lb. Min.
Flow 8 18
VTM (surface or leveling course)
3%- 5%
VM.A (i/2 in. max. particle size) 1 5% Min.

Virg in ia ,s ..De_s i gn,.. C r i. t,er i a Virginia has required certain design values for stability,
flow, and volumetric relationships of surface courses since the 1974 edition of the Ro..a.d..•.nd. Bring e Specifications. These are shown in Table 3.
Table 3
Virginia's Criteria
Property Design Requirements
VMA 14.8% Min.
VFA 65% 85%
VTM 3% 6%
Stability 1,450 lb. Min.
Flow 8 18
NOTE" These criteria can be applied only to specimens compacted under the 50-blow Marshall procedure; they cannot be applied to field compacted cores.
Virginia's requirements should be examined from the point of view of their compatibility with those of the WES and the Asphalt Institute, and it should be determined if the present requirements allow the design of mixes for which difficulty is encountered in meeting field density requirements.
IMPLICATIONS OF DESIGN RELATIONSHIPS
It is important to recognize the usefulness of the design parameters and the deficiencies in the, mix that may b.e created when the proper values are not obtained.
VTM
The VTM obtained in the Marshall design gives an excellent indi- cation of whether the mix can be compacted adequately in the field.

In view of the excellent stabilities achieved with most Virginia mixes, the VTM is probably the number one criterion for predicting field compaction and, ultimately, pavement life. A rule of thumb is that 95% of the Marshall density is the minimum that should be obtained in the field. Using the Virginia VTM criterion provides the following"
(a) VTM- 3%
Percent of TMD 97%
Minimum field density (.95)(97) 92.2%
(b) VTM 6%
Percent of TMD 94%
Minimum field density (.95)(94) 89.3%
These examples raise a question as to whether Virginia's re- quirement allowing a maximum 6% VTM at the design stage is placing a burden on the contractor in trying to meet the field density re- quirements.
VMA
The VMA is important in verifying that the gradation will give a satisfactory mix. If the value is too low, there will not be enough void space to accommodate the asphalt needed. If the value is too high, a gap grading may be the cause. Too low a value is addressed in both The Asphalt Institute and Virginia criteria. And as will be discussed later, the 14.8% limit that Virginia uses appears to be an adequate value. There does appear to be a need to establish a guideline for an upper limit on the VMA value, because when a high VMA occurs, the VFA at a given asphalt content will drop and this, in turn, can result in inadequate field densities.
Whenever the VMA is either higher or lower than desirable, the gradation should be examined closely for the cause. Further discussion of this problem will be presented under PROPER GRADATIONS.
VFA
The VFA property is important not only as a measure of relative durability, but also because there is an excellent correlation be- tween it and percent density. If the VFA is too low, there is not
i0

enough asphalt to provide durability and to close the voids. Con- versely, if the VFA is too high, the mix may tend to overdensify under traffic and bleed. Thus, the VFA is a very important design property.
St,,abilitY Although stability is important, it is not as important a de-
sign property in Virginia as some of the volumetric relationships because of the abundance of good aggregates. Most mixes in Virginia produce stabilities exceeding 2,000 lb. Thus from a stability stand- point, any reasonable asphalt content will produce an acceptable value. Furthermore, use of the asphalt content corresponding to the highest stability may produce a stiffer mix than is desirable.
Flow
Flow is not as important as the other properties in choosing the proper asphalt content, unless high values are encountered. Since these do not usually occur, flow does not play a great role in the selection of the optimum asphalt content.
PROPER GRADATI ONS
As was mentioned in the INTRODUCTION and again in discussing the VMA, the proper gradation is necessary to allow room for the right amount of asphalt. The master mange provides only a general guideline from which many gradations can be utilized. Several years ago, the master range was modified by the Bituminous Research Ad- visory Committee to include only those sieves that are tested for acceptance. While the intent was not to use only the acceptance sieves for control, unfortunately, this is the impression given to the materials engineers, inspectors, and bituminous concrete pro- ducers and is, in fact, the practice that has recently been followed.
Using only the acceptance sieves for control does not provide sufficient information for determining whether a proper gradation is being proposed.
The underlying concept in u-sing the gradation chart shown in Figure 4 is to approach a maximum density gradation. This will mini- mize the number of occurrences in which the VMA exceeds 19%. The reason for using the particular gradation chart shown in Figure 4 is that a straight line drawn from the origin (0,0) to the maximum ef- fective aggregate size at the top of the chart is the maximum density line. There are two advantages of using this charr. First, the
ii

o o 0 0
o o o o o o o o o o o
•)NISS•d IN30•3d
12

graphic representation is more readily understood than in the tabular form. And secondly, since the gradation is supposed to approach a straight line, it overcomes the disadvantage of the logarithmic scale which shows the gradation as a hard to define, deep sag curv•e. The power function (0.45) shown on the graph in Figure 4 is fundamentally based and is not an arbitrary value.
The following is quoted from an FHWA paper issued in 1962.
Those having experience with tender mixtures have tended to place most of the blame on the particular asphalt used. They recognize that such factors as high temperatures of the mix- ture, the air and the underlying structure; excessively heavy rolling equipment; or the presence of moisture in the mixture might contribute to the unsatisfactory condition. But they have very seldom considered the possi- bility that aggregate gradation could be an equally important factor and that their grada- tion requirements could be contributing to this problem. 3 )
These statements are particularly applicable to Virginia in 1980. The tender mixes that have been encountered here over the last few years may be at least partially due to gradation problems, but because of the few sieves used in the job mix analysis the cause has not been obvious.
The gradation analysis described below is recommended for all dense-graded bituminous mixes such as the S-5, I-2, and B-3, par- ticularly those on which tenderness or other field compaction prob- lems are noted. (A. D. Newman. has used this analysis successfully in the Richmond District.) It is mecommended that the sieves shown in Table 4 be used for the job mix design and analysis.
Table 4
Sieve Sizes Recommended for Use in Mix Design and Analyses
Mix Sieve Size
S-S
I-2
B-3
I/2" i" 3/4" 1/2" 3/8" #4 #8 #30 #50 #i00 #200
X X X X X X X X
X X X X X X X X X
X X X X X X X
13

(Even though the Department does not have a design procedure for B-3 mixes, the gradation analyses can still be obtained and plotted as for the surface or intermediate mixes.)
Using a chart such as shown in Figure 4, draw a straight line from the origin (0,0) through the maximum effective aggregate size. This can be defined as the highest percentage (other than 100%) passing the particular sieve size. Next plot the results of the gradation, using all the sieves shown in Table 4. Connect all points from the gradation results. It should not be expected that the re- sulting line will be exactly on the maximum density line. However, large deviations give rise to a gradation problem.
Figure 5 shows a typical S-5 gradation that is poor but that meets the design range. Obviously, more sieves are needed to define a proper gradation.
Figures 6 a•d 7 (both furnished by A. D. Newman) show two 1-2 gradations. Figure 6 indicates an unsatisfactory gradation because of the number of times the gradation crosses the maximum density line, and because of the excessive deviations from the maximum density line for the #i00 and #200 sieves. Figure 7 shows •hat by using 40% #!0 screenings in place of 40% sand, the gradation was substantially improved.
ANALYSES OF 1979 FIELD DATA
In 1979, 263 bituminous concrete samples were analyzed for Marshall properties. The samples were taken from the haul trucks, brought into the district materials lab, reheated, compacted, and tested. This method of determining Marshall properties is an ex- cellent procedure, not only as a continuing guide to the adequacy of the mix design but also as an indication of how the acceptance parameters of asphalt content and gradation are running.
The analyses made both involve Marshall densities. The first was a correlation between density and the VFA and the second a correlation between density and the VMA.
DensitY Versus •VFA
Figure 8 indicates the excellent relationship found between density and the VFA. The correlation coefficient, r, was 0.966 and the standard error 0.44%. Both values indicate a good relationship and indicate that if one value is known the other can be accurately predicted.
14

o o o
5)NISS•'d 1N30t:13d
o
6
0
0"•
15

o o 0 o
0 0 0 0 0 0 0 0 0 0 0
•)NlgC•Vd IN30•3d
o
u •
• •00
16

•00
> 0
17

98
97
96
95
94
93
92
91
9O 50 60 70 80 90 i00
VFA, %
Figure 8. Density vs. VFA.
18

Also to be seen from the figure are relatively numerous values below the design density value of 94% (above the 6% VTM). There are 52 sample values below the 94% density limit. Of these, 31 (5•%) were below a VFA of 65% and 51 (98%) below a VFA of 70%. These re- sults indicate that a VFA of 70% would be a better lower design value than the presently used lower value of 65%. A value of 70% would also more nearly agree with the original Marshall criterion.
This relationship does prove that when the VFA get• above 70%, a more durable mix, as evidenced by a good VTM value, will be ob- tained. The relationship also shows that there is • great deal of room for• improvement in increasing VFA values.
On the other end of the relationship, relatively few values exceeded the upper VFA criterion of 85%. This criterion is the same
as that recommended in the original Marshall design, and since this value relates well to the minimum VTM value used in Virginia designs (3%), it should continue in use.
Density_• Versus VMA
Figure 9 indicates the relationship between density and VMA. While this relationship is not as good as that between density and VFA, it does show that the VMA has an influence on density, as theory predicts. The lower design value of 14.8% evidently presents little or no problem, as the figure shows. However, the lack of an upper design value is a potential cause for low density values and, con- versely, high void values. It appears that when a VMA value of about 19% is exceeded, the gradation is sufficiently open to allow too many voids. Of the 52 sample values• below the 94• density, 31 (59%) were above the 19• VMA value. This, in certain cases, may have been prevented by increasing the asphalt content. However, this action would have been a costly remedy and may not have addressed the real problem, which was probably one of improper gradation.
Bas,ed on thes•e resuIts, it appears ,that a maximum VMA of 19% should be adopted.
RECOMMENDATIONS AND DISCUSSION
Based on the previous discussion of the WES original design cri teria, The Asphalt Institute critemia, and the field Mamshall data from Vimginia, it appea•s that the V imginia cmitemia should be modi- fied. The following values are mecommended"
VFA
VMA
70.0% 85.0%
14.8% 19.0%
19

98
97
96
95
94
93
92
91
9O
Density -.821 VMA + 109.8 r : -.754 SE- 1.10%
12 14 16 18 ,.I
22
VMA, %
Figure 9. Density vs. VMA.
2O

.S.uggested Procedure
The author suggests that in the implementation of these changes, the following procedure be considered for choosing an optimum as- phalt content, using plots of all data on Marshall design charts such as shown in Figure i so that a visual interpretation can be made.
i. Using the VTM curve, select the asphalt content corresponding to 4% VTM. (If the VTM curve does not reach 4%, either adjust the asphalt content in the design to produce a 4% VTM, or choose the asphalt content closest to a VTM of 4% and definite- ly between 3% and 6%).
2. Using the asphalt content from step i, make certain the VFA is between 70.0% and 85.0%, the VMA between 14.8% and 19.0%, the stability above 1,450 lb., and the flow between 8 and 18. Also look at the unit weight curve and make sure the asphalt content does not hit a point on a steep slope of the curve.
Examples of the above procedure are shown in Figures I0 and Ii. Figure i0 shows the procedure in a more or less classical design. Unfortunately, since many designs are not classical and all cases cannot be covered, Figure ii shows one possible design that would present problems using the above procedure.
The first observation in Figure ii is that the VTM curve does not reach the 4.0% value that would indicate an optimum asphalt con- tent. Two potential causes come to mind. The first is insufficient asphalt. In looking at the VFA curve, it appears that at 6% asphalt content the 70% voids filled criterion is met, but barely. There- fore, more asphalt could probably be accommodated. In other words, the optimum asphalt content has not been reached.
Next, it can be seen in looking at the VMA curve that the values tend to the high side of what is desirable. Therefore, some improvement in gradation may help the design.
The stability curve also looks unusual. One thought to keep in mind is that the stability test can give quite variable results. There- fore, the differences that appear in this curve may be due to testing variation. Of course, the stability may be extremely sensitive to asphalt, but if so the other curves do not reflect this fact.
The flow and unit weight curves do not provide very useful in- formation in this example.
21

152
150
148
1700
1600
1500
4 5 6 7
I' "I' I' I' I"
4 5 6 7
,J, 5 6 7
ASPHALT CONTENT, PERCENT
14
12
i0
2O
18
16
9O
8O
7O
6O
,,I i,,
4 5 6 7
"1 1' i"" '1"
1. ..I !..
4 5 6 7
4 5 6 7
ASPHALT CONTENT, PERCENT
ist step- 2nd step-
5.6% optimum from VTM curve
Stability = 1,670 lb. ok VFA between 70 %-85% ok VMA between 14.8 •-19.0% ok Flow between 8-!8 ok Unit weight near peak ok
Figure !0. Design procedure.
22

146
144
142 I.
15
14
13
2200
2100
2000
1900 ._I !_1 1. IL
5 5,5 6
20
19
18 .i J. l• ,,! .I, !,,
5 5.5 6
!...1. .1 _1.. 5 5.5 6
ASPHALT CONTENT, PERCENT
E 75
,• 70
i I--I I"i'
5 !_ 1_!_! > 5 5.5
.l...I.,._l 6
ASPHALT CONTENT, PERCENT
Figure ii. Example of a problem design.
23


AC KNOWLEDGEMENTS
The 1979 data were furnished by the district materials engi- neers through J. T. Love's office in the Materials Division. The additional effort given to mix designs in 1979 throughout most of the Department is apparent and appreciated.
25


l
REFERENCES
Investigations of the Design and Control of Mixtures, Waterways Experiment Station, May
Asphalt Pa. y.i.ng 1948, V•is. 1 and
Mix Design Methods for Asphalt MS-___•2, 4th ed., March 1974.
Goode, Joseph F.• and Lawrence Chart for Evaluating Aggregate Vol. 31, 1962.
Concrete•. The Asphalt Institute,
A Lufsey, "A New Graphical Gradations", Proceeding.9, AAPT,
27
