spring 2014 corporate presentation mark thompson chief executive officer
TRANSCRIPT

Spring 2014Corporate Presentation
Mark Thompson Chief Executive Officer

2
Disclaimer
Certain information in this presentation and oral statements made during this meeting are forward-looking and relate to Concordia’s anticipated financial position, business strategy, events and courses of action. Words or phrases such as “anticipate,” “objective,” “may,” “will,” “might,” “should,” “could,” “can,” “intend,” “expect,” “believe,” “estimate,” “predict,” “potential,” “plan,” “is designed to” or similar expressions suggest future outcomes. Forward-looking statements include, among other things, statements about: our expectations regarding our expenses, sales and operations; our future customer concentration; our anticipated cash needs and our estimates regarding our capital requirements and our need for additional financing; our ability to anticipate the future needs of our customers; our ability to achieve new design wins; our plans for future products and enhancements of existing products; our future growth strategy and growth rate; our future intellectual property; and our anticipated trends and challenges in the markets in which we operate. Such statements reflect our current views with respect to future events and are based on assumptions and subject to significant risks and uncertainties. Although we believe that the assumptions underlying these statements are reasonable, they may prove to be incorrect. Given these risks, uncertainties and assumptions, you should not place undue reliance on these forward-looking statements. Our actual results, performance or achievements could differ materially from those contemplated, expressed or implied in our statements as a result of various risk factors, including, but not limited to, business, economic and capital market conditions; market conditions and the demand and pricing for our products; our relationships with our customers, distributors and business partners; our ability to successfully define, design and release new products in a timely manner that meet our customers’ needs; our ability to attract, retain and motivate qualified personnel; competition in our industry; our ability to maintain technological leadership; our manufacturing supply chain, including pricing of goods and availability of adequate manufacturing capacity from our manufacturing suppliers; our ability to transition to new wafer fabrication process technologies and achieve higher levels of design integration; our ability to manage risks inherent in foreign operations; our ability to successfully maintain and enforce our intellectual property rights and defend third-party claims of infringement of their intellectual property rights; our ability to manage cash flow, foreign exchange risk and working capital; our ability to manage our growth; fluctuation in our quarterly operating results; and our dependence on key personnel. Except as required by law, we undertake no obligation to update or revise publicly any forward‑looking statements, whether as a result of new information, future events or otherwise, after the date on which the statements are made or to reflect the occurrence of unanticipated events. Neither we nor any of our representatives make any representation or warranty, express or implied, as to the accuracy, sufficiency or completeness of the information in this presentation. Neither we nor any of our representatives shall have any liability whatsoever, under contract, tort, trust or otherwise, to you or any person resulting from the use of the information in this presentation by you or any of your representatives or for omissions from the information in this presentation. T his presentation also contains statistical data, estimates and forecasts that are based on independent industry publications or other publicly available information, while other information is based on Concordia’s internal sources. Although Concordia believes that these third-party sources referred to in this presentation are reliable, Concordia has not independently verified the information provided by these third parties. While Concordia is not aware of any misstatements regarding any third-party information presented in this presentation, their estimates, in particular, as they relate to projections, involve numerous assumptions, are subject to risks and uncertainties, and are subject to change based on various factors, including the risk factors discussed above.
Non-IFRS Measures This presentation makes reference to certain non-IFRS measures. These non-IFRS measures are not recognized measures under IFRS and do not have a standardized meaning prescribed by IFRS, and are therefore unlikely to be comparable to similar measures presented by other companies. When used, these measures are defined in such terms as to allow the reconciliation to the closest IFRS measure. These measures are provided as additional information to complement those IFRS measures by providing further understanding of the Company’s results of operations from management’s perspective. Accordingly, they should not be considered in isolation nor as a substitute for analyses of the Company’s financial information reported under IFRS. Management uses non-IFRS measures such as EBITDA and Adjusted EBITDA to provide investors with a supplemental measure of the Company’s operating performance and thus highlight trends in the Company’s core business that may not otherwise be apparent when relying solely on IFRS financial measures. Management also believes that securities analysts, investors and other interested parties frequently use non-IFRS measures in the evaluation of issuers. Management also uses non-IFRS measures in order to facilitate operating performance comparisons from period to period, prepare annual operating budgets, and to assess its ability to meet future debt service, capital expenditure, and working capital requirements.
1EBITDAAs used herein, EBITDA is defined as net income adjusted for net interest expense, income tax expense, depreciation and amortization. Management uses EBITDA to assess the Company’s operating performance. A reconciliation of net income to EBITDA is provided below.
2ADJUSTED EBITDAAs used herein, adjusted EBITDA is defined as EBITDA adjusted for one-time charges associated with acquisitions, one-time charges associated with the Company’s listing on the TSX, non-cash items such as unrealized gains / losses on derivative instruments, and realized / unrealized gains/losses related to foreign exchange revaluation. Management uses adjusted EBITDA as a key metric in assessing business performance when comparing actual results to budgets and forecasts. Management believes adjusted EBITDA is an important measure of operating performance and cash flow, and provides useful information to investors because it highlights trends in the underlying business that may not otherwise be apparent when relying solely on IFRS measures.

3
Executive Experience
Mark Thompson Founder, CEO & Director
Biovail Corporation (currently Valeant): VP Business Development and Associate General Counsel Trimel Pharmaceuticals: Co-Founder Tribute Pharmaceuticals: Co-Founder Lawyer at Oslers and Davies Completed over $2.0 billion in transactions
Leith TessyCFO
25 years of international experience as a finance and operations executive LG-Nortel (JV between Nortel Networks & LG Electronics): CFO and COO Nortel Networks: CFO of Carrier Networks Division Nuance Communications: SVP, Finance
Wayne KreppnerCOO
15 years of global experience in pharmaceutical R&D, Manufacturing and Operations Trimel Pharmaceuticals: Vice President, Product Development Biovail Corporation: Vice President of Technology Transfer Executive experience in Product Registration and Quality
John McCleeryMD and CFO of Concordia Barbados
30 years of international experience as a senior financial and operational executive Trimel BioPharma: VP, General Manager, CFO Biovail Laboratories International (currently Valeant Laboratories International): VP and General
Manager Biovail Corporation (currently Valeant): developed and managed enterprise risk management and
compliance
Robert AltmanPresident, Pinnacle Biologics
25 years of pharmaceuticals operations experience Pinnacle Biologics: Chief Commercial Officer Marathon Pharmaceuticals: Founder and CEO Astellas Pharma: Senior Vice-President Abbott Laboratories: Vice-President, General Manager, Pharmaceutical Product Division
Management Team

4
Concordia’s Strategy
Orphan Drugs1) Specialized regulatory protection
2) Limited competition
3) Pricing power
4) Too small for big pharma
Funding
Distribution Control
Specialty Healthcare Distribution1) Niche distribution
2) Cash flow from diabetic product distribution
Legacy Drugs1) Strong cash flow
2) Limited sales and marketing expenses
3) Attractive acquisition metrics
4) Sold directly to wholesalers
Concordia is a specialty pharmaceutical company focused on legacy and orphan pharmaceutical products

5
ConcordiaHealthcare Corp.
Parent Co. – Canada
Concordia Pharmaceuticals
Legacy Drugs – Barbados
Pinnacle Biologics
Orphan Drugs – US
Complete Medical Homecare
Specialty Distribution – US
Owner of Legacy Drugs and IP
Sells Products into U.S. Directs development for new
indications Supply chain management
Development and Sales of Orphan Drugs
Distribution of diabetic products
Fully licensed pharmacy
Distribution capabilities across the U.S.
Concordia Overview

6
Attention Deficit Hyperactivity Disorder (ADHD)
Asthma and severe allergic conditions
Head lice infestation (prescription)
Irritable Bowel Syndrome (IBS)
Product Portfolio
Legacy Drugs
Medical Equipment &Other Healthcare Products
Distribution of diabetic products
Licensed pharmacy
Specialty distribution capabilities across the U.S.
Specialty Healthcare Distribution (Complete Medical Homecare)
Photodynamic Therapy with Photofrin®
Approved legacy drug treatment for three rare forms of cancer
Upside from potential new orphan drug indications – CCA and Meso
To be sold via Concordia’s specialty healthcare distribution arm
Pinnacle Biologics
Product Description

7
Donnatal ®
70-year history of safety, excellent brand equity All competitors removed from market during 2012-
13, market exclusivity expected for foreseeable future
Promotional activities instituted in 2012, ramping through 2014-15
2013 revenue of US$49.1 mm and EBITDA of US$40.2 mm
Promotio
n Initiated
Generic Withdraw
alBegan
Promotion
Escalated

8
Photodynamic Therapy: Overview
Non-thermallaser light
Tissueuptake
and clearance
Photosensitizing Agent(IV Administration)
Relatively SelectiveRetention in Tumor
Tumor Tissue Destruction
ResidentOxygen

9
Cholangiocarcinoma – U.S. Phase III Registration Study
Prospective, open label, randomized, multicenter study
Design is consistent with Ortner ME et al.*
SPA approved by FDA 200 patients; 2 arms (stent + chemo versus stent +
PDT with Photofrin + chemo) Only 1 registration trial needed Interim analysis at 45 events
First patient expected: Q2 2014
*Gastroenterology. 2003 November; 125(5): 1355-63.

10
Successful Swiss Clinical Trial
Randomized Prospectus Study
70 patients: 39 randomized; 31 excluded/nonrandomized (open PDT)
Stenting & PDT
Stenting Alone
Open PDT
Patients 20 19 31
Primary endpoint:Survival 493 days 98 days 426 days
P-value P < 0.0001 P < 0.0001
PDT significantly improves survival in patients with NCC
Study stopped early due to impressive results
Severely ill patients eligible for PDT

11
25% Palliative
U.S. Cholangiocarcinoma Market Estimate
Incid
ence
of
Cholan
gioca
rcino
ma
Less
Intra
hepa
tic C
holan
gioca
rcino
ma
Patien
ts w
ith
no J
aund
ice (5
%)
Patien
ts U
nder
going
Res
ectio
n
Resec
ted
patie
nt fa
cing
recu
rrent
, obs
truct
ive tu
mor
s
Photo
frin
Targe
ts
4,380
1,756 1,756 2,0692,640
627 314
1,740
132
125
Source: SEER data, Physician Interviews; Cerenti analysis.
Photofrin Market Potential – Cholangiocarcinoma Patients
Non-Resectable
Extrahepatic & Hilar
Cholangiocarcinoma
(60%)
(5% Curative)5%
12.5%
47%
40%
Dosage : 2 mg/Kg per treatment Approximately 2 vials/patient /treatment at $19K
per vial On average 2 to 5 treatments per patient
12
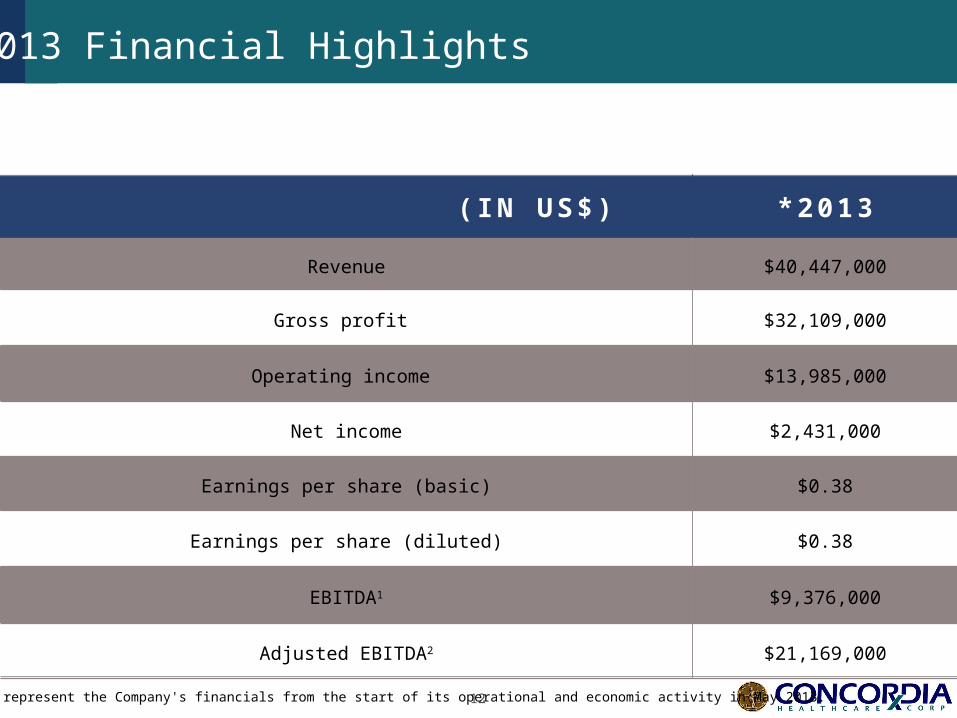
( IN US$) *2013
Revenue $40,447,000
Gross profit $32,109,000
Operating income $13,985,000
Net income $2,431,000
Earnings per share (basic) $0.38
Earnings per share (diluted) $0.38
EBITDA1 $9,376,000
Adjusted EBITDA2 $21,169,000
2013 Financial Highlights
* 2013 results represent the Company's financials from the start of its operational and economic activity in May 2013.

13
( IN US$) Q1 2014
Revenue $16,810,000
Gross profit $12,956,000
Operating income $4,939,000
Net loss ($1,836,000)
Earnings per share basic ($0.09)
Earnings per share diluted ($0.09)
EBITDA1 $3,546,000
Adjusted EBITDA2 $5,903,000
First Quarter, 2014 Financial Highlights

14
*Cap Structure
Ticker TSX: CXR, OTC QX: CHEHF
Common shares outstanding 28.5 mm
Recent share price $35.64
Market capitalization (Cdn) $1,013 mm
52 week High/Low $35.64/$7.60
**Average Daily Volume 217,981
Analyst Coverage Beacon Securities, Cormark Securities, GMP Securities,
TD Securities
Shareholders AEGON Capital Management, Fidelity, Fiera Capital, Janus Capital Management, Pyramis Global Advisors,
Visium
Mgmt and Board ownership Approximately 25%
*as of June 9, 2014**Jan.1, 2014- May, 20 2014

Spring 2014Corporate Presentation
Mark Thompson Chief Executive Officer