sql 2005sql 2008sql 2008 r2 chart multiple areas new! multiple areas multiple axes new! multiple...
TRANSCRIPT

Building Effective Data Visualizations and Maps with Microsoft SQL Server 2008 R2 Reporting ServicesSean BoonSr. Program ManagerMicrosoft Corporation
SESSION CODE: BI 202
Session Objectives and TakeawaysSession Objective(s):
Become familiar with the new visualizations available in SSRS 2008 R2.Best practices and design tips for working with visualizations in SSRS 2008 R2.
Key TakeawaysSSRS 2008 R2 provides several new report items for creating effective visualizations (maps, sparklines, indicators, and data bars)Get the most from maps with SQL Server spatialIncrease your efficiency in developing reports with the Report Part Gallery

SQL Server Reporting Services And Data VisualizationSQL 2005 SQL 2008 SQL 2008 R2Chart Chart Chart
Multiple areasNEW! Multiple areasMultiple axesNEW! Multiple axesCalculated seriesNEW! Calculated series
GaugeNEW! GaugeBullet graphNEW! Bullet graph
MapNEW!
SQL spatialNEW!
Bing™ supportNEW!
SparklineNEW!
Data BarNEW!
IndicatorNEW!

Maps
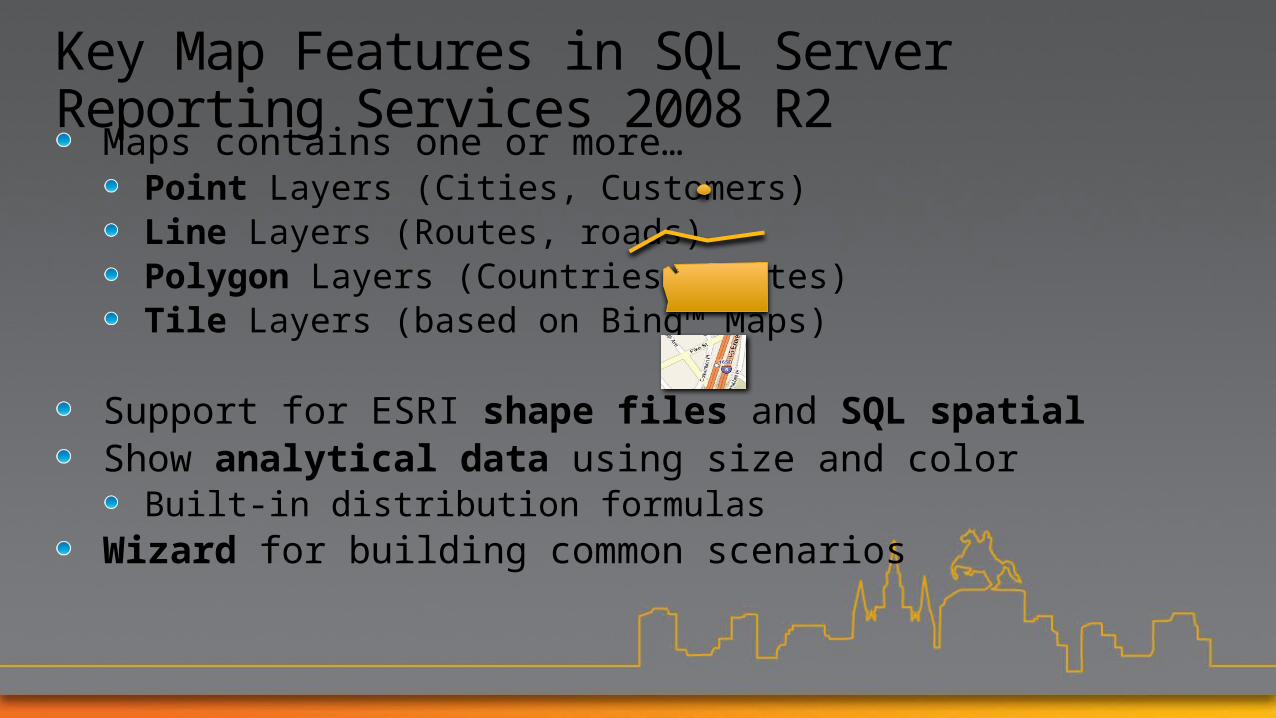
Key Map Features in SQL Server Reporting Services 2008 R2
Maps contains one or more… Point Layers (Cities, Customers)Line Layers (Routes, roads)Polygon Layers (Countries, States)Tile Layers (based on Bing™ Maps)
Support for ESRI shape files and SQL spatialShow analytical data using size and color
Built-in distribution formulasWizard for building common scenarios

Map Components (Example 1)
Polygon Layer
Color RuleBubble w/size Rule
Map LegendsAnalytical Data

Map Components (Example 2)
Tile Layer
Point Layer
SQL Spatial Query (points)
Polygon Layer
SQL Spatial Query (polygon)

Map Example

Reporting Services 2008 R2 Demo Data
Approximately 6.5 million US Domestic flights from 2009
csv
National
Airport

Map
DEMO

Map Tips and Best Practices
SQL Server spatial “goodness”Makes parameterized spatial reports easier
Pass ID or Name as parameter, not spatial data.Makes drill-down map scenarios much easier.
Prevents having to store large amounts of data in RDL.Enables you to use SQL Server spatial functions
Additional functions available on Codeplex.Aggregate spatial data as part of ETL processes.
Map can combine SSAS and PowerPivot data with SQL Server spatial data.Store maps in the Report Part Gallery
Centralized location for storing and searching map assets for reports.

Map LinksShape2SQL
Enables loading shp files into SQL Server spatialhttp://www.sharpgis.net/page/SQL-Server-2008-Spatial-Tools.aspx
Additional Spatial Functionshttp://sqlspatialtools.codeplex.com/wikipage?title=Current%20Contents&referringTitle=Home
Free shapefileshttp://Census.gov, http://data.gov, etc.http://dcrp.ced.berkeley.edu/research/footprint/index.php?option=com_content&task=view&id=15&Itemid=29
Safe Software (Transform to SQL Server Spatial)Spatial Ed Blog
http://blogs.msdn.com/edkatibah/

Sparklines and Data Bars
Sparklines“Data intense, word-sized graphics” – TufteAutomatic axis alignment. All charts can have the same data points, regardless of source data.Can be converted into full charts to support additional small multiple scenarios.
Data BarsUsually depict a single value in a cell.Min and Max are automatically determined, but are configurable.
Data Bars
Sparklines
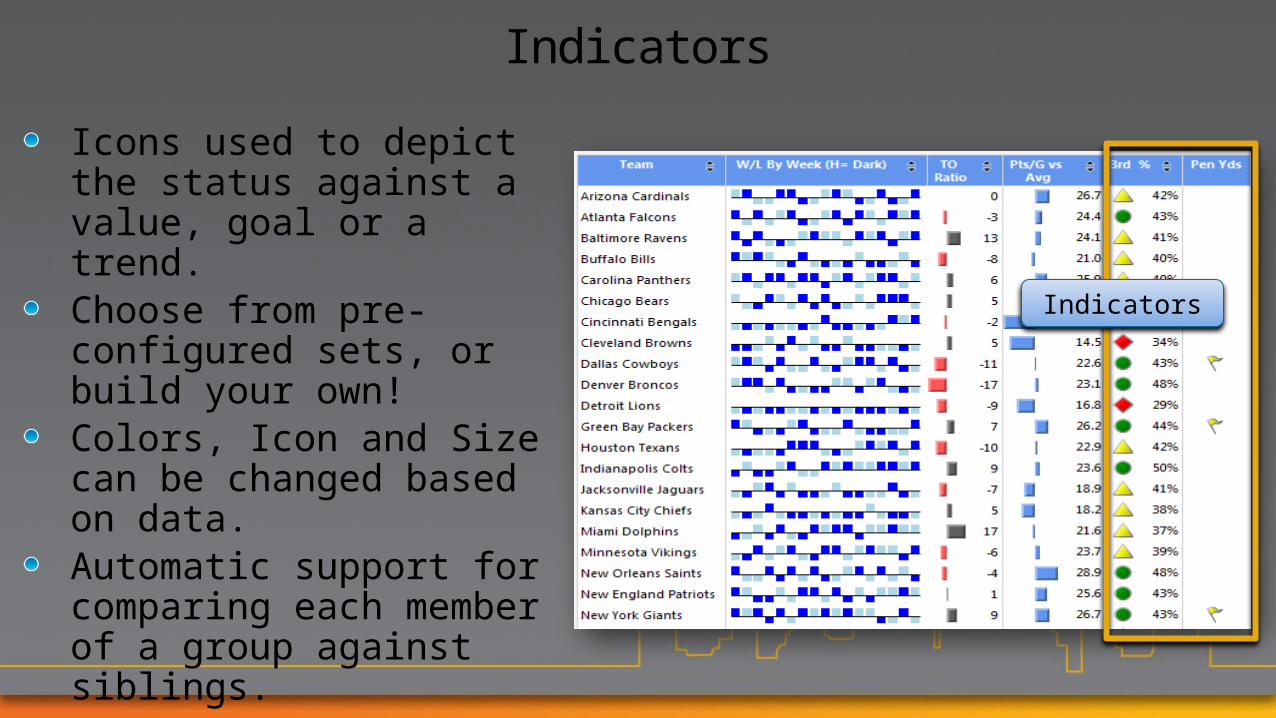
Icons used to depict the status against a value, goal or a trend.Choose from pre-configured sets, or build your own!Colors, Icon and Size can be changed based on data.Automatic support for comparing each member of a group against siblings.Can also be placed inside gauges.
Indicators
Indicators
Data Bars, Sparklines & Indicators
DEMO

Summary
MapsBenefits of SQL Server spatialReport Part Gallery for finding and sharing map report parts (and for all report parts)
Visualizations designed for tablixData BarsSparklines are “data-intense, word-sized graphics” IndicatorsMakes it easy to…
view trends in a small spaceFlag success or potential areas of concernCompare multiple rows at a glance to quickly spot differences
Related Content
Breakout Sessions (session codes and titles)BIO207 | BI Power Hour!
Interactive Sessions (session codes and titles)BIE14-INT | Optimizing Reports for Performance and ScaleBIE19-INT | Microsoft SQL Server Reporting Services Extensibility and Programmability
Hands-on Labs (session codes and titles)BIE02-HOL | Visualizing Data with Maps in Microsoft SQL Server 2008 R2 Reporting Services
Product Demo Stations (demo station title and location)TLC-67 | Microsoft SQL Server 2008 R2 Reporting Services

Resources
www.microsoft.com/teched
Sessions On-Demand & Community Microsoft Certification & Training Resources
Resources for IT Professionals Resources for Developers
www.microsoft.com/learning
http://microsoft.com/technet http://microsoft.com/msdn
Learning

Complete an evaluation on CommNet and enter to win!

Questions?

Sign up for Tech·Ed 2011 and save $500 starting June 8 – June 31st
http://northamerica.msteched.com/registration
You can also register at the
North America 2011 kiosk located at registrationJoin us in Atlanta next year

© 2010 Microsoft Corporation. All rights reserved. Microsoft, Windows, Windows Vista and other product names are or may be registered trademarks and/or trademarks in the U.S. and/or other countries.The information herein is for informational purposes only and represents the current view of Microsoft Corporation as of the date of this presentation. Because Microsoft must respond to changing market conditions, it should not be interpreted to
be a commitment on the part of Microsoft, and Microsoft cannot guarantee the accuracy of any information provided after the date of this presentation. MICROSOFT MAKES NO WARRANTIES, EXPRESS, IMPLIED OR STATUTORY, AS TO THE INFORMATION IN THIS PRESENTATION.
