sri lanka: electricity supply chain analysis and … · sri lanka: electricity supply chain...
TRANSCRIPT
Sri Lanka: Electricity Supply Chain Analysis and Proposals for Revamping
FINAL REPORT
November 2014
Public Utilities Commission of Sri Lanka 1
This report has been prepared by a team of consultant representing the Pathfinder Foundation-Sri Lanka, Economic Consulting Associates-UK, KPMG Sri Lanka, on behalf of the Public Utilities Commission of Sri Lanka. However the interpretations and opinions expressed in this report should not be construed to be the official viewpoint of the Public Utilities Commission of Sri Lanka
Electricity Supply Chain Analysis and Proposals for Revamping
FINAL REPORT
Contents
i
Contents
Abbreviations and Acronyms ii
1 Introduction 1
2 Context 3
2.1 Study objectives 3
2.2 Electricity generation in Sri Lanka 4
2.3 Components of generation costs 7
2.4 The impact of cross-subsidies 8
3 Operational planning and dispatch 13
3.1 Assessment 13
3.2 Recommendations 22
4 Fuel costs 27
4.1 Assessment 27
4.2 Recommendations 33
5 Power Purchase Agreements 35
5.1 Assessment 35
5.2 Recommendations 41
6 Expiring PPAs 42
6.1 Assessment 42
6.2 Recommendations 46
7 O&M costs and corporate overheads 47
7.1 Assessment 47
7.2 Recommendations 50
8 Financing costs 52
8.1 Assessment 52
8.2 Recommendations 54
9 Subsidy policy 55
10 Summary 57
Electricity Supply Chain Analysis and Proposals for Revamping
FINAL REPORT
Contents
ii
Abbreviations and Acronyms
AESK AES Kelanitissa
AM & CS Asset Management and Central Services
BST Bulk Supply Tariff
BSTA Bulk Supply Transactions Account
CCGT Combined Cycle Gas Turbine
CCRR Capital Cost Recovery Rate
CEB Ceylon Electricity Board
CPC Ceylon Petroleum Corporation
ECA Economic Consulting Associates
EMS Energy Management System
FOB Free-On-Board
GL CEB Generation Licensee
GT Gas Turbine (open-cycle)
HQ CEB Corporate Headquarters
HSFO High Sulphur Fuel Oil
IPP Independent Power Producer
LCC Lanka Coal Company
LECO Lanka Electricity Company
LSFO Low Suphur Fuel Oil
LTGEP Long-Term Generation Expansion Plan
MFP Ministry of Finance and Planning
MGEA Minimum Guaranteed Energy Amount
MOPS Mean Of Platts Singapore
NCRE Non-Conventional and Renewable Energy
O&M Operations and Maintenance
PF Pathfinder Foundation
PPA Power Purchase Agreement
PUCSL Public Utilities Commission of Sri Lanka
Rs Sri Lanka Rupee
SCADA System Capture And Data Acquisition
SCC CEB System Control Centre
SOE State-Owned Enterprise
WCP West Coast Power
Electricity Supply Chain Analysis and Proposals for Revamping
FINAL REPORT
Contents
iii
Currency
The abbreviations Rs and SLR are used interchangeably to refer to Sri Lanka Rupees.
The exchange rate used in this report is 1 US$ : 130 Rs.
Note on plant names
A number of power plants in Sri Lanka are given different names in different publications. For the purposes of this report, where alternative names exist, the following have been used.
Report name Alternative names
Puttalam Coal Power Plant Lakvijaya Power Plant
Norochcholai Power Plant
New Chunnakam Power Plant Jaffna Power Plant
Colombo Power Barge Power Plant
West Coast Power Kerawalapitiya Power Plant
Electricity Supply Chain Analysis and Proposals for Revamping
FINAL REPORT
Introduction
1
1 Introduction
This Final Report is submitted to the Public Utilities Commission of Sri Lanka (PUCSL) by the Pathfinder Foundation (PF) of Sri Lanka in association with Economic Consulting Associates Ltd (ECA) of the United Kingdom and KPMG Sri Lanka for the project:
The electricity supply chain analysis and proposals for revamping
This report is the fourth prepared under this project, following our Inception Report, Interim Report and Draft Final Report. The purposes of this report are to:
Review the key areas where regulation of electricity generation in Sri Lanka can be improved.
Set out draft recommendations on regulatory reforms in these areas.
The analysis undertaken is limited to the efficiency of generation operations. In accordance with the scope of work for this project, it does not consider the efficiency of generation investment planning or of transmission and distribution activities.
The key areas for improvement set out in this report were identified in our Interim Report, which was discussed with PUCSL, the Ceylon Electricity Board (CEB) and other stakeholders. The recommendations contained in this report were contained in our Draft Final Report and presented at a stakeholder workshop held in Colombo in September 2014.
In the following sections we provide:
A summary of the context for this study (Section 2).
Our recommendations with respect to the procedures and methodologies used for scheduling and dispatching electricity generation (Section 3).
Our recommendations with respect to the regulation of the costs of fuels used in electricity generation in Sri Lanka (Section 4).
Our recommendations with respect to Power Purchase Agreements (PPAs) with independent power producers (IPPs) (Section 5).
Our recommendations with respect to the treatment of expiring PPAs (Section 6).
Our recommendations with respect to the regulatory treatment of operating and maintenance (O&M) costs and corporate overheads (Section 7).
Our recommendations with respect to the recovery of the costs of financing generation investments (Section 8).

Electricity Supply Chain Analysis and Proposals for Revamping
FINAL REPORT
Introduction
2
Our comments with respect to the future policy on subsidies to the electricity industry, given our recommendations on regulatory reforms (Section 9).
A summary of our recommendations (Section 10).
We would like to take this opportunity to thank PUCSL and CEB for their support to this study and, in particular, to our requests for data and information to assist our analysis.
Electricity Supply Chain Analysis and Proposals for Revamping
FINAL REPORT
Context
3
2 Context
2.1 Study objectives
The impetus behind this study arises from concerns over the high level of electricity tariffs in Sri Lanka relative to those of other countries in the region. The costs of generation form the largest element in electricity tariffs and are notably higher in Sri Lanka than, for example, in South-East Asian countries such as Malaysia, Thailand and Vietnam.
The study looks at the component costs of electricity generation in Sri Lanka, identifies potential inefficiencies and makes recommendations on possible regulatory actions to address these.
In developing these recommendations, we have aimed to improve the economic
efficiency of the electricity generation. This is not necessarily the same as immediately reducing costs. It may be that removing inefficiencies leads to temporary increases in costs where distortions created by existing regulations and subsidies are ended. However, in the longer-term, removing such distortions should deliver a sustainable and lower-cost power sector.
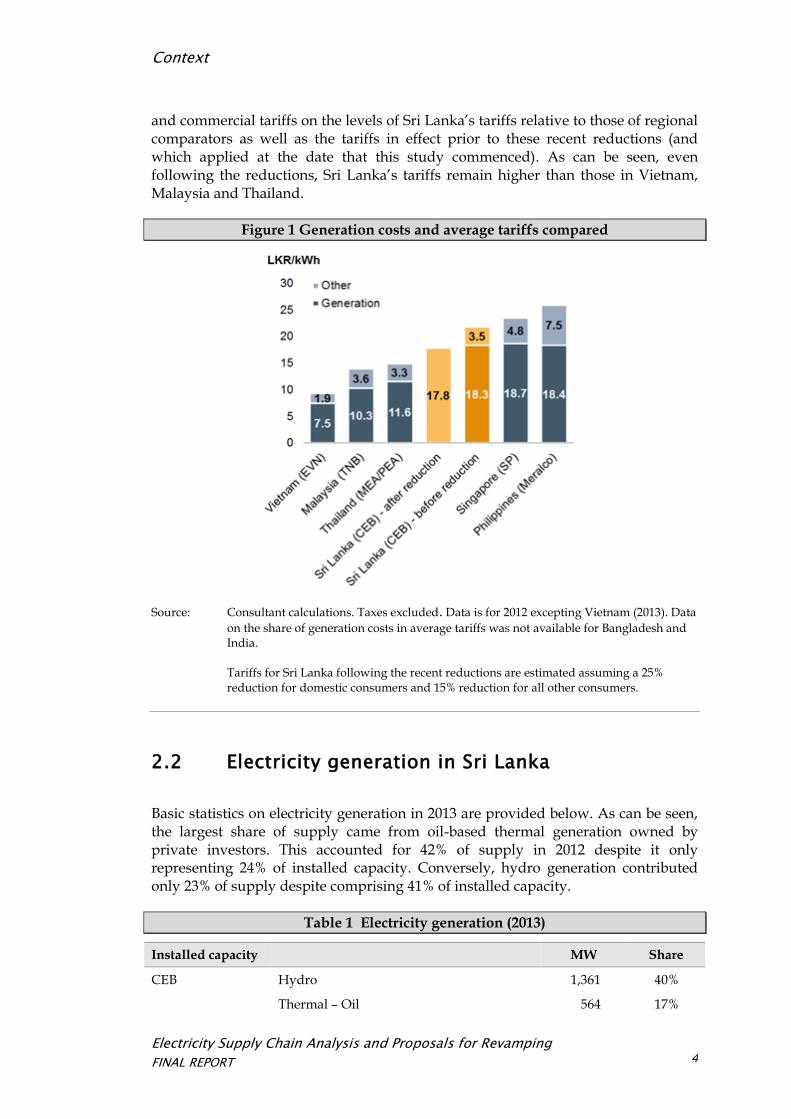
To provide context, we show in Figure 1, below, a comparison of average tariffs and generation costs in the region.
During the course of this study, two significant initiatives were announced with respect to electricity tariffs in Sri Lanka. These are:
A reduction in domestic tariffs with effect from 16th September 2014, in line with a government policy decision to pass through to electricity consumers part of the benefits of reduced power generation costs following the commissioning of the second and third units of the Puttalam Coal Power Plant. The reductions are estimated by PUCSL to result in a fall in electricity bills of from 24% to 26% for domestic consumers.
An announcement in the 2015 Budget Speech that a new tariff band will be introduced for industrial and commercial consumers using less than 300 kWh per month, who will see a reduction of 25% in their electricity charges, and of a 15% reduction for other industrial and commercial consumers2. These changes are planned to take effect from November 2014. PUCSL has not yet published the amended tariffs conforming to this policy decision.
In the comparisons included in this section, we have shown the impacts of the reductions already applied to domestic tariffs and those announced for industrial
2 2015 Budget Speech, 24th October 2014 (Paragraph 50.1).
Electricity Supply Chain Analysis and Proposals for Revamping
FINAL REPORT
Context
4
and commercial tariffs on the levels of Sri Lanka’s tariffs relative to those of regional comparators as well as the tariffs in effect prior to these recent reductions (and which applied at the date that this study commenced). As can be seen, even following the reductions, Sri Lanka’s tariffs remain higher than those in Vietnam, Malaysia and Thailand.
Figure 1 Generation costs and average tariffs compared
Source: Consultant calculations. Taxes excluded. Data is for 2012 excepting Vietnam (2013). Data
on the share of generation costs in average tariffs was not available for Bangladesh and India.
Tariffs for Sri Lanka following the recent reductions are estimated assuming a 25% reduction for domestic consumers and 15% reduction for all other consumers.
2.2 Electricity generation in Sri Lanka
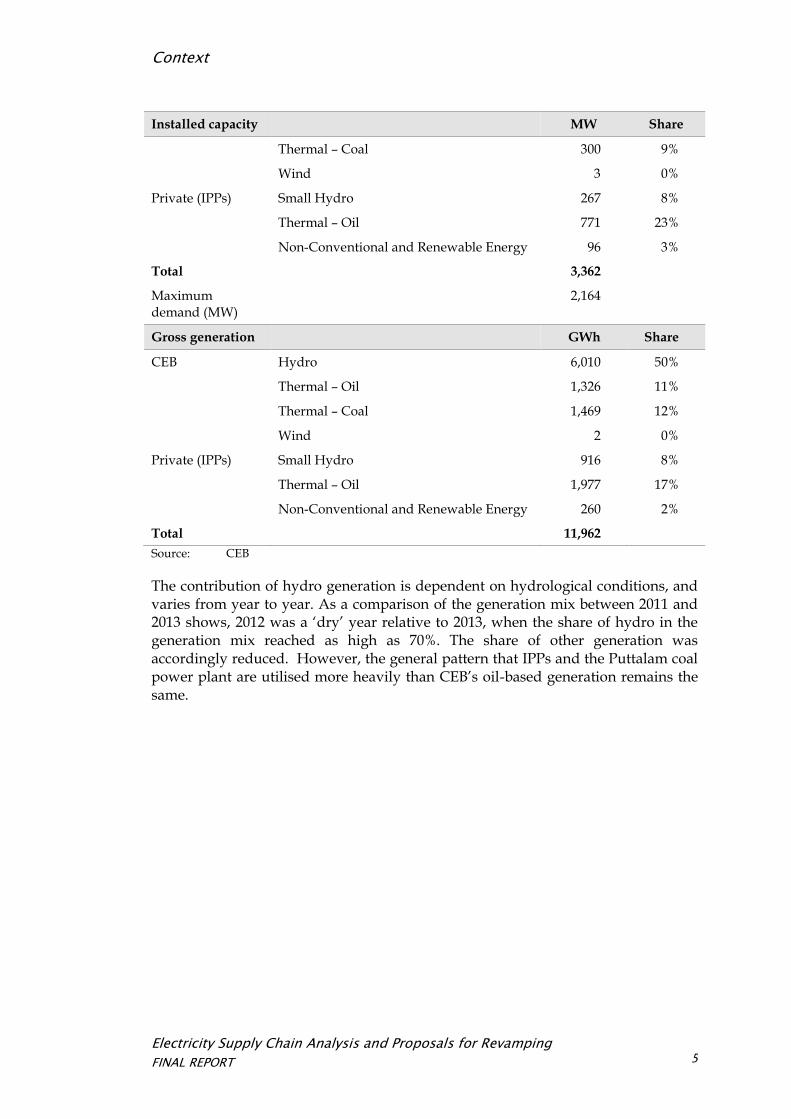
Basic statistics on electricity generation in 2013 are provided below. As can be seen, the largest share of supply came from oil-based thermal generation owned by private investors. This accounted for 42% of supply in 2012 despite it only representing 24% of installed capacity. Conversely, hydro generation contributed only 23% of supply despite comprising 41% of installed capacity.
Table 1 Electricity generation (2013)
Installed capacity MW Share
CEB Hydro 1,361 40%
Thermal – Oil 564 17%
Electricity Supply Chain Analysis and Proposals for Revamping
FINAL REPORT
Context
5
Installed capacity MW Share
Thermal – Coal 300 9%
Wind 3 0%
Private (IPPs) Small Hydro 267 8%
Thermal – Oil 771 23%
Non-Conventional and Renewable Energy 96 3%
Total 3,362
Maximum demand (MW)
2,164
Gross generation GWh Share
CEB Hydro 6,010 50%
Thermal – Oil 1,326 11%
Thermal – Coal 1,469 12%
Wind 2 0%
Private (IPPs) Small Hydro 916 8%
Thermal – Oil 1,977 17%
Non-Conventional and Renewable Energy 260 2%
Total 11,962
Source: CEB
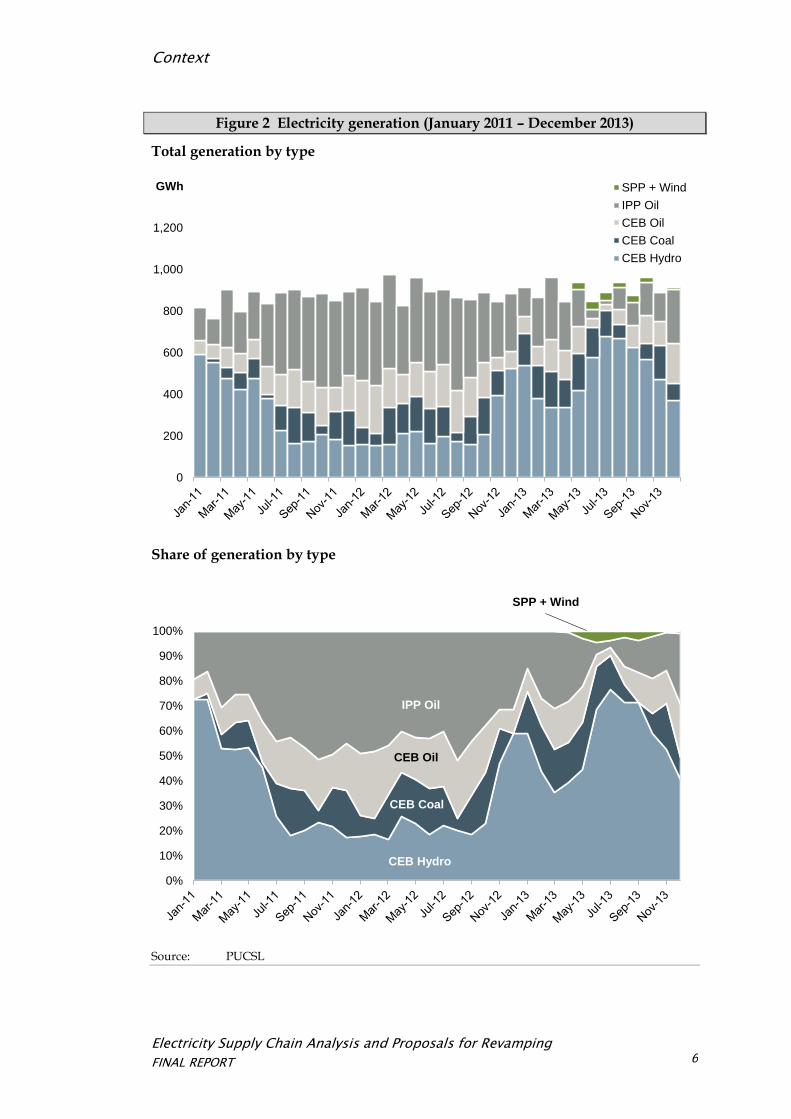
The contribution of hydro generation is dependent on hydrological conditions, and varies from year to year. As a comparison of the generation mix between 2011 and 2013 shows, 2012 was a ‘dry’ year relative to 2013, when the share of hydro in the generation mix reached as high as 70%. The share of other generation was accordingly reduced. However, the general pattern that IPPs and the Puttalam coal power plant are utilised more heavily than CEB’s oil-based generation remains the same.
Electricity Supply Chain Analysis and Proposals for Revamping
FINAL REPORT
Context
6
Figure 2 Electricity generation (January 2011 – December 2013)
Total generation by type
Share of generation by type
Source: PUCSL
0
200
400
600
800
1,000
1,200
GWh SPP + Wind
IPP Oil
CEB Oil
CEB Coal
CEB Hydro
0%
10%
20%
30%
40%
50%
60%
70%
80%
90%
100%
CEB Hydro
CEB Coal
CEB Oil
IPP Oil
SPP + Wind
Electricity Supply Chain Analysis and Proposals for Revamping
FINAL REPORT
Context
7
2.3 Components of generation costs
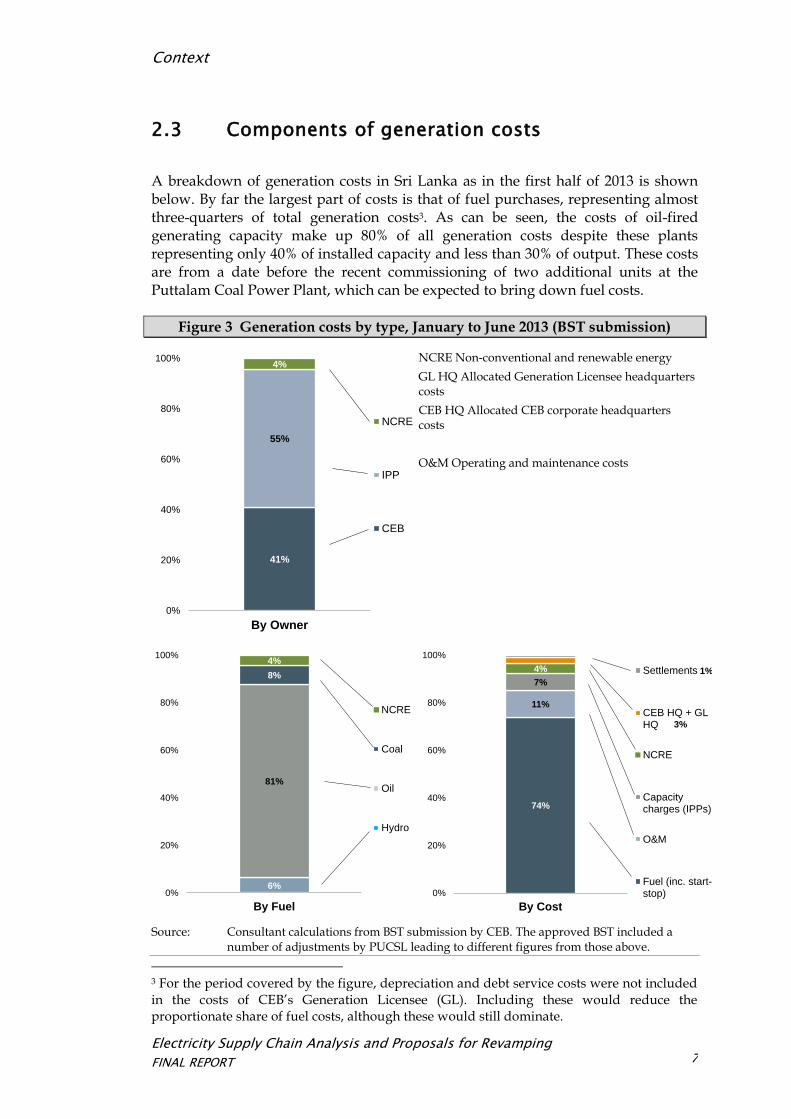
A breakdown of generation costs in Sri Lanka as in the first half of 2013 is shown below. By far the largest part of costs is that of fuel purchases, representing almost three-quarters of total generation costs3. As can be seen, the costs of oil-fired generating capacity make up 80% of all generation costs despite these plants representing only 40% of installed capacity and less than 30% of output. These costs are from a date before the recent commissioning of two additional units at the Puttalam Coal Power Plant, which can be expected to bring down fuel costs.
Figure 3 Generation costs by type, January to June 2013 (BST submission)
NCRE Non-conventional and renewable energy
GL HQ Allocated Generation Licensee headquarters costs
CEB HQ Allocated CEB corporate headquarters costs
O&M Operating and maintenance costs
Source: Consultant calculations from BST submission by CEB. The approved BST included a
number of adjustments by PUCSL leading to different figures from those above.
3 For the period covered by the figure, depreciation and debt service costs were not included in the costs of CEB’s Generation Licensee (GL). Including these would reduce the proportionate share of fuel costs, although these would still dominate.
41%
55%
4%
0%
20%
40%
60%
80%
100%
By Owner
NCRE
IPP
CEB
6%
81%
8%
4%
0%
20%
40%
60%
80%
100%
By Fuel
NCRE
Coal
Oil
Hydro
74%
11%
7%
4%
3%
1%
0%
20%
40%
60%
80%
100%
By Cost
Settlements
CEB HQ + GLHQ
NCRE
Capacitycharges (IPPs)
O&M
Fuel (inc. start-stop)
Electricity Supply Chain Analysis and Proposals for Revamping
FINAL REPORT
Context
8
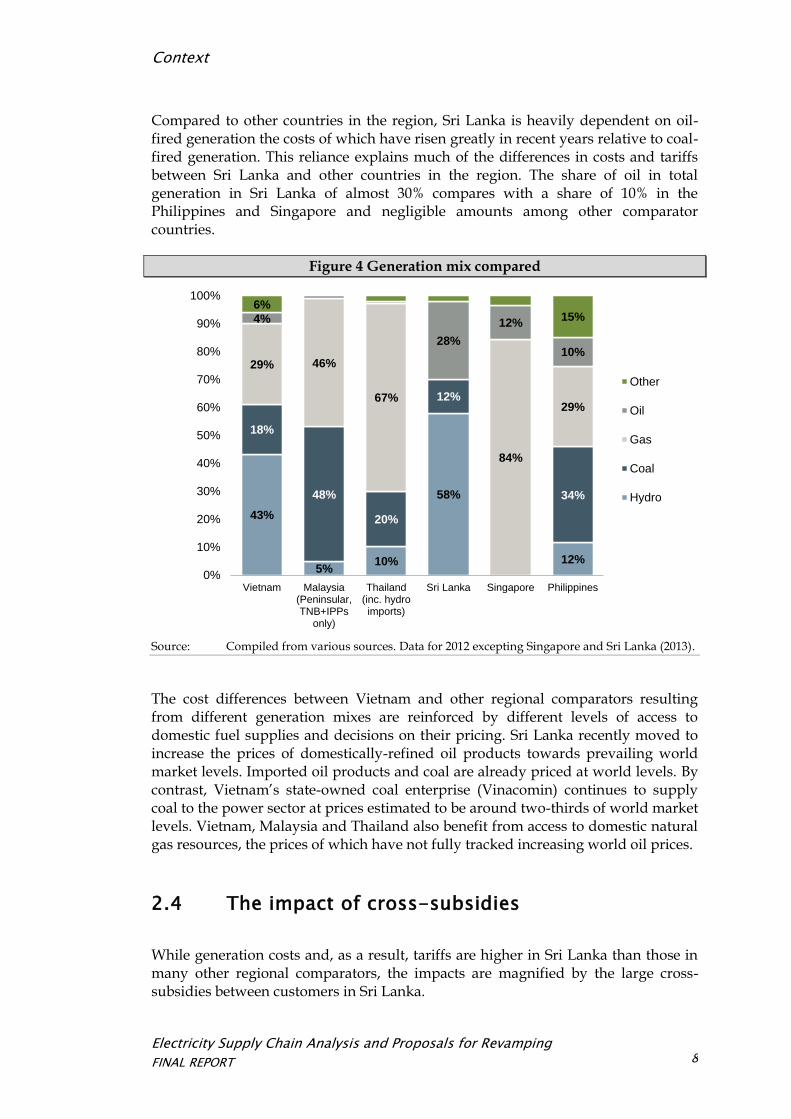
Compared to other countries in the region, Sri Lanka is heavily dependent on oil-fired generation the costs of which have risen greatly in recent years relative to coal-fired generation. This reliance explains much of the differences in costs and tariffs between Sri Lanka and other countries in the region. The share of oil in total generation in Sri Lanka of almost 30% compares with a share of 10% in the Philippines and Singapore and negligible amounts among other comparator countries.
Figure 4 Generation mix compared
Source: Compiled from various sources. Data for 2012 excepting Singapore and Sri Lanka (2013).
The cost differences between Vietnam and other regional comparators resulting from different generation mixes are reinforced by different levels of access to domestic fuel supplies and decisions on their pricing. Sri Lanka recently moved to increase the prices of domestically-refined oil products towards prevailing world market levels. Imported oil products and coal are already priced at world levels. By contrast, Vietnam’s state-owned coal enterprise (Vinacomin) continues to supply coal to the power sector at prices estimated to be around two-thirds of world market levels. Vietnam, Malaysia and Thailand also benefit from access to domestic natural gas resources, the prices of which have not fully tracked increasing world oil prices.
2.4 The impact of cross-subsidies
While generation costs and, as a result, tariffs are higher in Sri Lanka than those in many other regional comparators, the impacts are magnified by the large cross-subsidies between customers in Sri Lanka.
43%
5% 10%
58%
12%
18%
48%
20%
12%
34%
29% 46%
67%
84%
29%
4%
28%
12%
10%
6% 15%
0%
10%
20%
30%
40%
50%
60%
70%
80%
90%
100%
Vietnam Malaysia(Peninsular,TNB+IPPs
only)
Thailand(inc. hydroimports)
Sri Lanka Singapore Philippines
Other
Oil
Gas
Coal
Hydro
Electricity Supply Chain Analysis and Proposals for Revamping
FINAL REPORT
Context
9
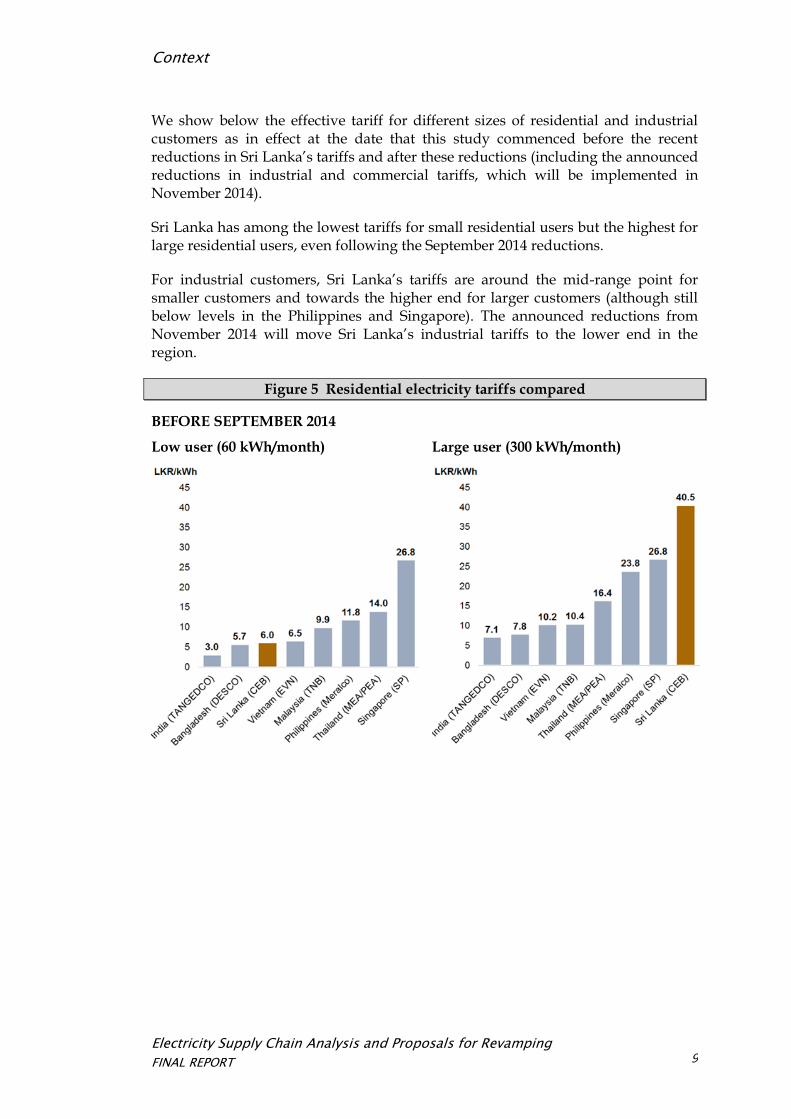
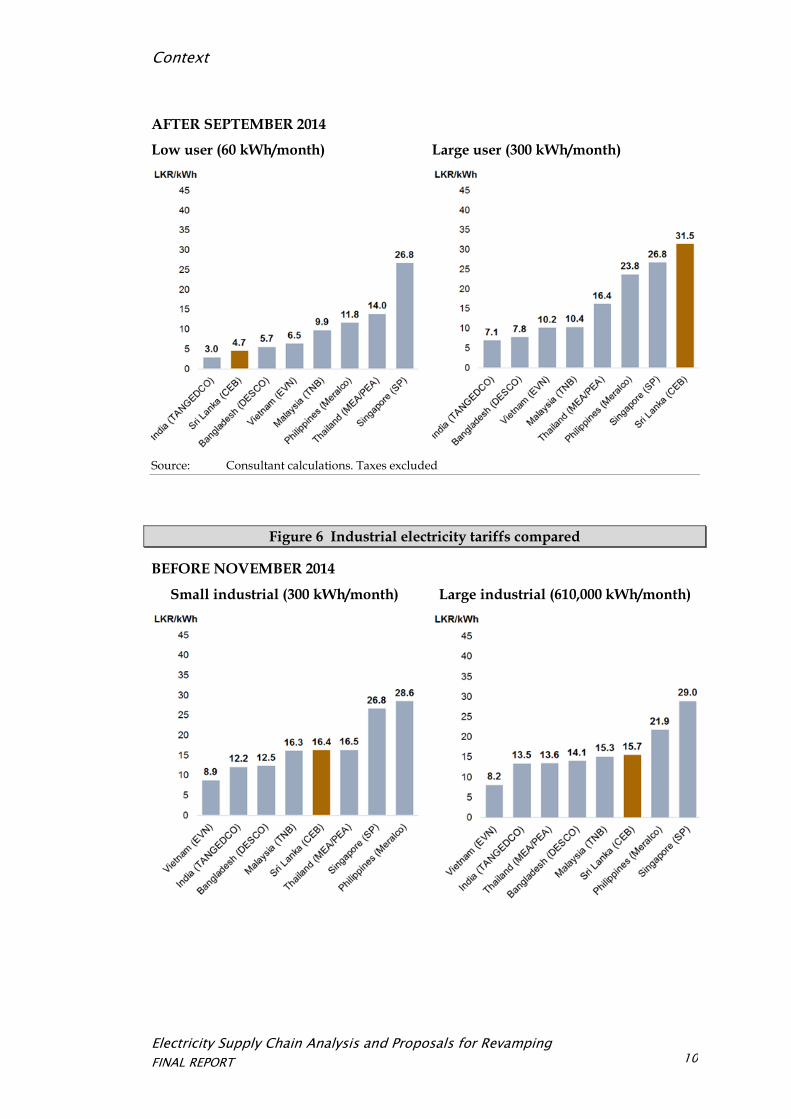
We show below the effective tariff for different sizes of residential and industrial customers as in effect at the date that this study commenced before the recent reductions in Sri Lanka’s tariffs and after these reductions (including the announced reductions in industrial and commercial tariffs, which will be implemented in November 2014).
Sri Lanka has among the lowest tariffs for small residential users but the highest for large residential users, even following the September 2014 reductions.
For industrial customers, Sri Lanka’s tariffs are around the mid-range point for smaller customers and towards the higher end for larger customers (although still below levels in the Philippines and Singapore). The announced reductions from November 2014 will move Sri Lanka’s industrial tariffs to the lower end in the region.
Figure 5 Residential electricity tariffs compared
BEFORE SEPTEMBER 2014
Low user (60 kWh/month) Large user (300 kWh/month)
Electricity Supply Chain Analysis and Proposals for Revamping
FINAL REPORT
Context
10
AFTER SEPTEMBER 2014
Low user (60 kWh/month) Large user (300 kWh/month)
Source: Consultant calculations. Taxes excluded
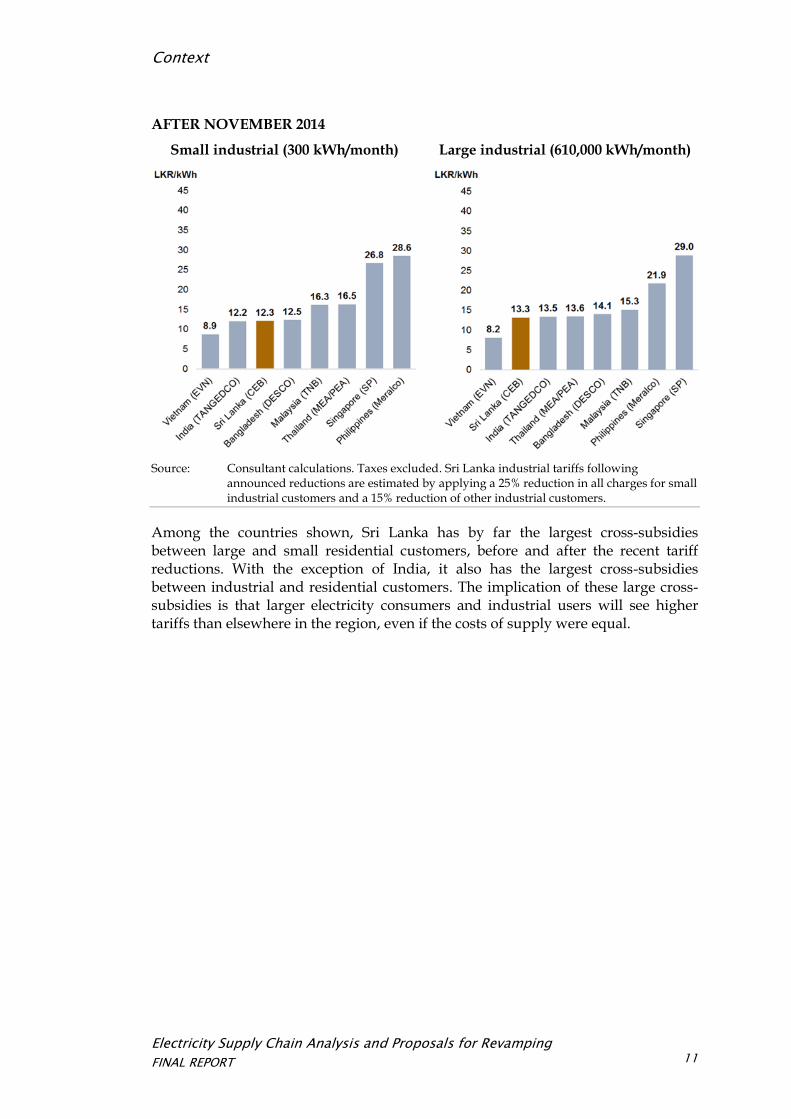
Figure 6 Industrial electricity tariffs compared
BEFORE NOVEMBER 2014
Small industrial (300 kWh/month) Large industrial (610,000 kWh/month)
Electricity Supply Chain Analysis and Proposals for Revamping
FINAL REPORT
Context
11
AFTER NOVEMBER 2014
Small industrial (300 kWh/month) Large industrial (610,000 kWh/month)
Source: Consultant calculations. Taxes excluded. Sri Lanka industrial tariffs following
announced reductions are estimated by applying a 25% reduction in all charges for small industrial customers and a 15% reduction of other industrial customers.
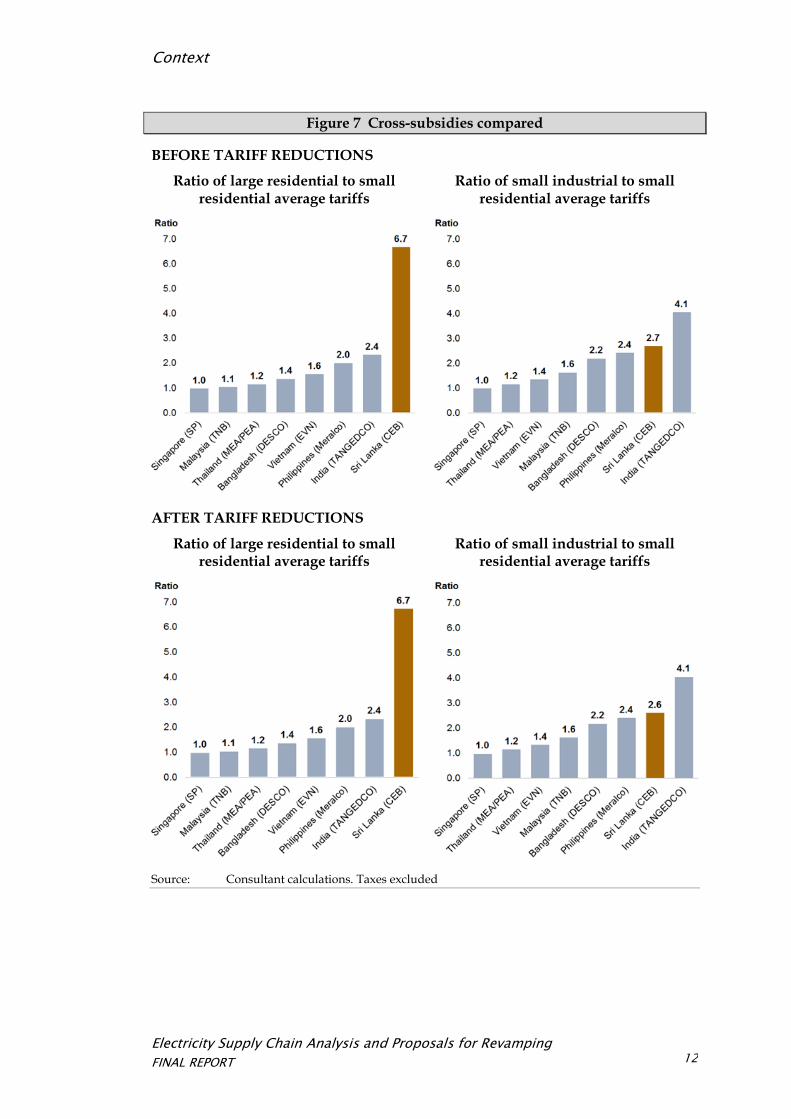
Among the countries shown, Sri Lanka has by far the largest cross-subsidies between large and small residential customers, before and after the recent tariff reductions. With the exception of India, it also has the largest cross-subsidies between industrial and residential customers. The implication of these large cross-subsidies is that larger electricity consumers and industrial users will see higher tariffs than elsewhere in the region, even if the costs of supply were equal.
Electricity Supply Chain Analysis and Proposals for Revamping
FINAL REPORT
Context
12
Figure 7 Cross-subsidies compared
BEFORE TARIFF REDUCTIONS
Ratio of large residential to small residential average tariffs
Ratio of small industrial to small residential average tariffs
AFTER TARIFF REDUCTIONS
Ratio of large residential to small residential average tariffs
Ratio of small industrial to small residential average tariffs
Source: Consultant calculations. Taxes excluded
Electricity Supply Chain Analysis and Proposals for Revamping
FINAL REPORT
Operational planning and dispatch
13
3 Operational planning and dispatch
The use of individual generators is driven by operational planning and dispatch decisions. The objective of these decisions should be to minimise the total costs of electricity supply while complying with the practical constraints imposed by different technologies and by the electricity transmission system.
In this section, we review the conclusions reached on the efficiency of current operational planning and dispatch and set out our recommendations for improvements.
3.1 Assessment
In our Interim Report, we assessed the efficiency of operational planning and dispatch decisions by CEB’s System Control Centre (SCC) in two ways:
A comparison of utilisation of different generators against the merit order implied by their respective energy costs. Absent external constraints, power plants should be dispatched from lowest to highest-energy cost in order to minimise generation costs. Deviations from this merit order that cannot be explained by external constraints may be indicative of inefficiencies in system operation.
A review of the data management infrastructure, software, procedures and methodologies used by SCC in its planning and dispatching decisions against best practice. This was conducted through in-depth interviews with SCC personnel and a review of available documentation.
3.1.1 Comparison with merit order dispatch
Utilisation of thermal generation
We show below the utilization (measured by the capacity factor4) for each thermal generator compared to its energy cost. The energy costs shown are the SCC dispatch costs for March 2013, representing dispatch costs before the April 2013 fuel price increases. We do not provide a similar comparison for hydro generators as these have no ‘energy’ cost as such. Their variable cost of generation is near-zero. Instead, efficient dispatch of hydro generation involves minimising total system costs by using stored water in reservoirs to displace the most expensive thermal generation on the system.
4 Calculated as: total output (MWh) / [installed capacity (MW) * 8.760 hours].
Electricity Supply Chain Analysis and Proposals for Revamping
FINAL REPORT
Operational planning and dispatch
14
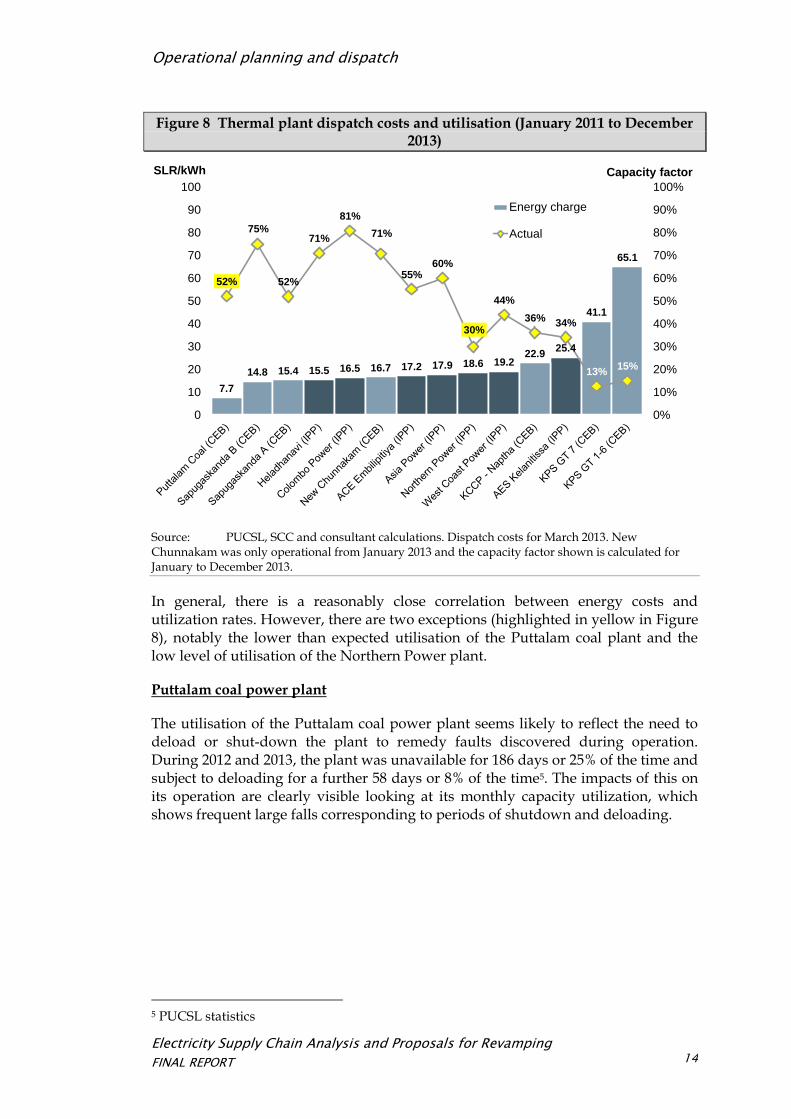
Figure 8 Thermal plant dispatch costs and utilisation (January 2011 to December 2013)
Source: PUCSL, SCC and consultant calculations. Dispatch costs for March 2013. New Chunnakam was only operational from January 2013 and the capacity factor shown is calculated for January to December 2013.
In general, there is a reasonably close correlation between energy costs and utilization rates. However, there are two exceptions (highlighted in yellow in Figure 8), notably the lower than expected utilisation of the Puttalam coal plant and the low level of utilisation of the Northern Power plant.
Puttalam coal power plant
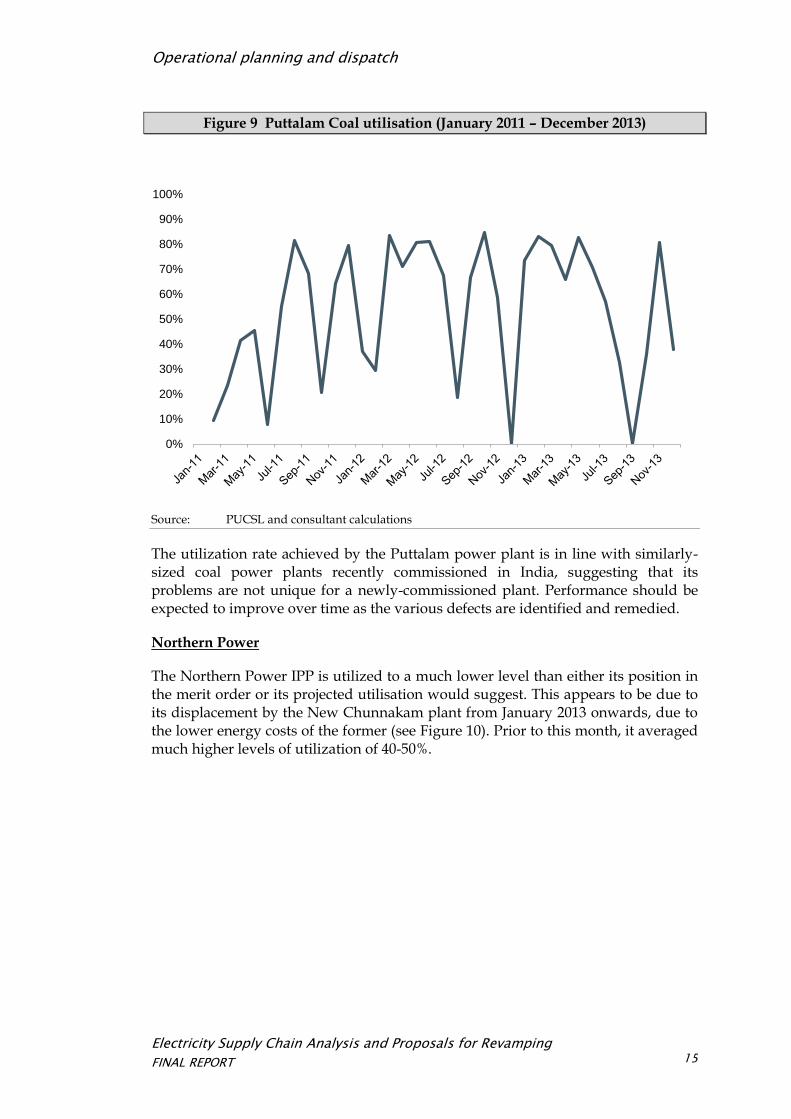
The utilisation of the Puttalam coal power plant seems likely to reflect the need to deload or shut-down the plant to remedy faults discovered during operation. During 2012 and 2013, the plant was unavailable for 186 days or 25% of the time and subject to deloading for a further 58 days or 8% of the time5. The impacts of this on its operation are clearly visible looking at its monthly capacity utilization, which shows frequent large falls corresponding to periods of shutdown and deloading.
5 PUCSL statistics
7.7
14.8 15.4 15.5 16.5 16.7 17.2 17.9 18.6 19.2 22.9
25.4
41.1
65.1
52%
75%
52%
71%
81%
71%
55% 60%
30%
44%
36% 34%
13% 15%
0%
10%
20%
30%
40%
50%
60%
70%
80%
90%
100%
0
10
20
30
40
50
60
70
80
90
100
Capacity factor SLR/kWh
Energy charge
Actual
Electricity Supply Chain Analysis and Proposals for Revamping
FINAL REPORT
Operational planning and dispatch
15
Figure 9 Puttalam Coal utilisation (January 2011 – December 2013)
Source: PUCSL and consultant calculations
The utilization rate achieved by the Puttalam power plant is in line with similarly-sized coal power plants recently commissioned in India, suggesting that its problems are not unique for a newly-commissioned plant. Performance should be expected to improve over time as the various defects are identified and remedied.
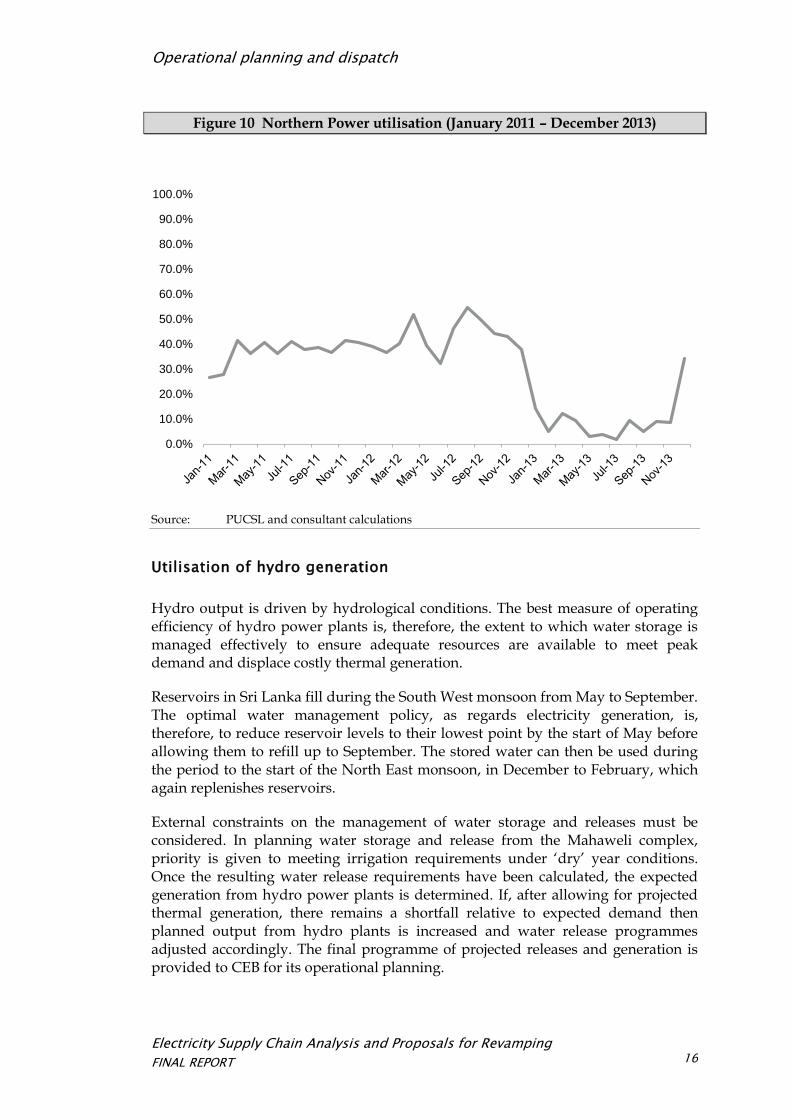
Northern Power
The Northern Power IPP is utilized to a much lower level than either its position in the merit order or its projected utilisation would suggest. This appears to be due to its displacement by the New Chunnakam plant from January 2013 onwards, due to the lower energy costs of the former (see Figure 10). Prior to this month, it averaged much higher levels of utilization of 40-50%.
0%
10%
20%
30%
40%
50%
60%
70%
80%
90%
100%
Electricity Supply Chain Analysis and Proposals for Revamping
FINAL REPORT
Operational planning and dispatch
16
Figure 10 Northern Power utilisation (January 2011 – December 2013)
Source: PUCSL and consultant calculations
Utilisation of hydro generation
Hydro output is driven by hydrological conditions. The best measure of operating efficiency of hydro power plants is, therefore, the extent to which water storage is managed effectively to ensure adequate resources are available to meet peak demand and displace costly thermal generation.
Reservoirs in Sri Lanka fill during the South West monsoon from May to September. The optimal water management policy, as regards electricity generation, is, therefore, to reduce reservoir levels to their lowest point by the start of May before allowing them to refill up to September. The stored water can then be used during the period to the start of the North East monsoon, in December to February, which again replenishes reservoirs.
External constraints on the management of water storage and releases must be considered. In planning water storage and release from the Mahaweli complex, priority is given to meeting irrigation requirements under ‘dry’ year conditions. Once the resulting water release requirements have been calculated, the expected generation from hydro power plants is determined. If, after allowing for projected thermal generation, there remains a shortfall relative to expected demand then planned output from hydro plants is increased and water release programmes adjusted accordingly. The final programme of projected releases and generation is provided to CEB for its operational planning.
0.0%
10.0%
20.0%
30.0%
40.0%
50.0%
60.0%
70.0%
80.0%
90.0%
100.0%
Electricity Supply Chain Analysis and Proposals for Revamping
FINAL REPORT
Operational planning and dispatch
17
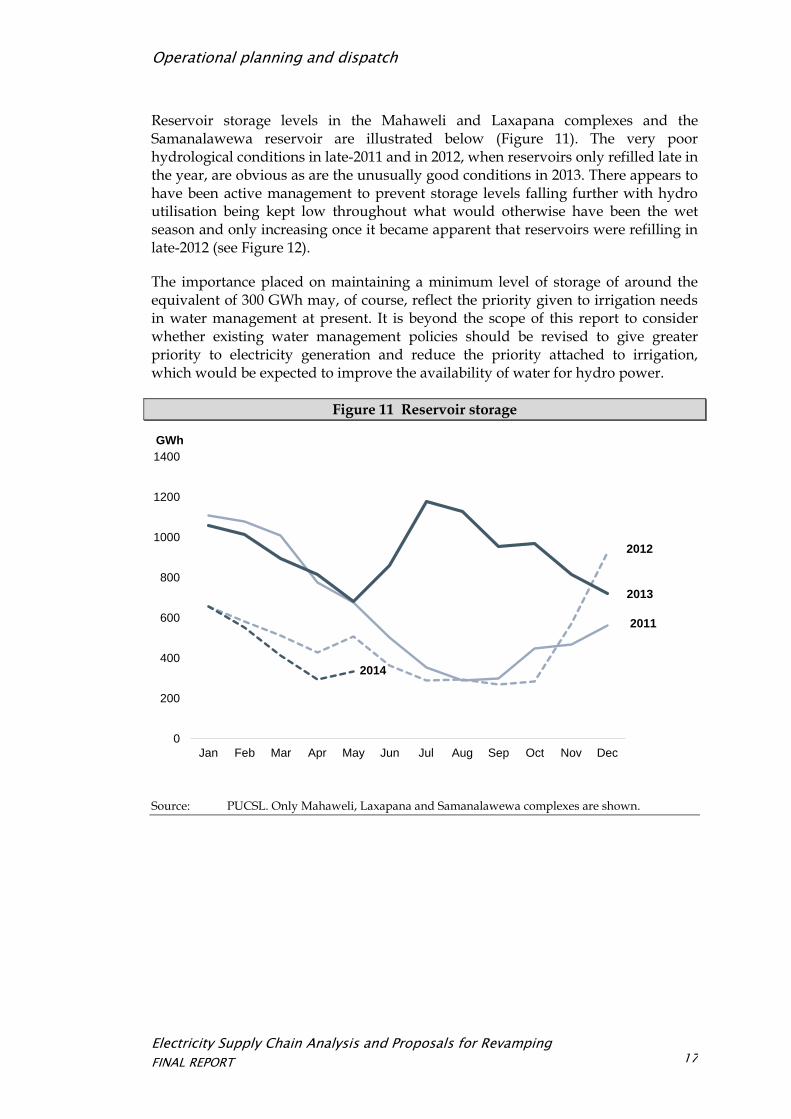
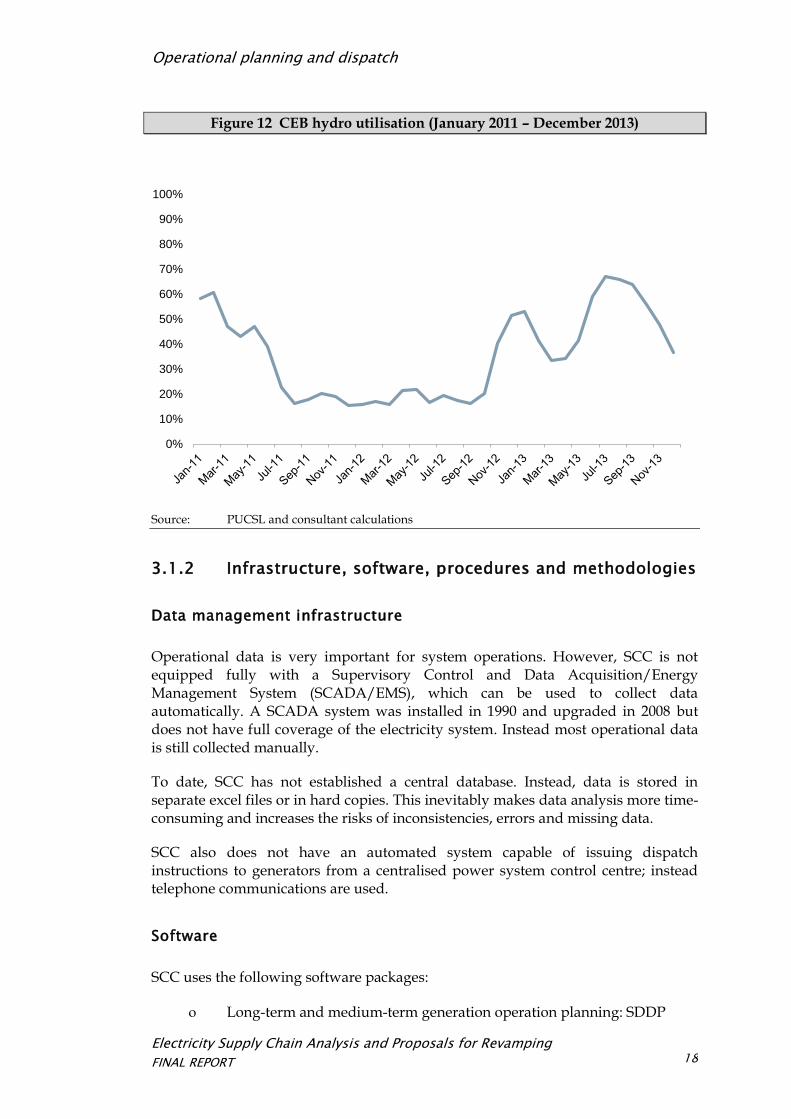
Reservoir storage levels in the Mahaweli and Laxapana complexes and the Samanalawewa reservoir are illustrated below (Figure 11). The very poor hydrological conditions in late-2011 and in 2012, when reservoirs only refilled late in the year, are obvious as are the unusually good conditions in 2013. There appears to have been active management to prevent storage levels falling further with hydro utilisation being kept low throughout what would otherwise have been the wet season and only increasing once it became apparent that reservoirs were refilling in late-2012 (see Figure 12).
The importance placed on maintaining a minimum level of storage of around the equivalent of 300 GWh may, of course, reflect the priority given to irrigation needs in water management at present. It is beyond the scope of this report to consider whether existing water management policies should be revised to give greater priority to electricity generation and reduce the priority attached to irrigation, which would be expected to improve the availability of water for hydro power.
Figure 11 Reservoir storage
Source: PUCSL. Only Mahaweli, Laxapana and Samanalawewa complexes are shown.
0
200
400
600
800
1000
1200
1400
Jan Feb Mar Apr May Jun Jul Aug Sep Oct Nov Dec
GWh
2012
2011
2013
2014
Electricity Supply Chain Analysis and Proposals for Revamping
FINAL REPORT
Operational planning and dispatch
18
Figure 12 CEB hydro utilisation (January 2011 – December 2013)
Source: PUCSL and consultant calculations
3.1.2 Infrastructure, software, procedures and methodologies
Data management infrastructure
Operational data is very important for system operations. However, SCC is not equipped fully with a Supervisory Control and Data Acquisition/Energy Management System (SCADA/EMS), which can be used to collect data automatically. A SCADA system was installed in 1990 and upgraded in 2008 but does not have full coverage of the electricity system. Instead most operational data is still collected manually.
To date, SCC has not established a central database. Instead, data is stored in separate excel files or in hard copies. This inevitably makes data analysis more time-consuming and increases the risks of inconsistencies, errors and missing data.
SCC also does not have an automated system capable of issuing dispatch instructions to generators from a centralised power system control centre; instead telephone communications are used.
Software
SCC uses the following software packages:
Long-term and medium-term generation operation planning: SDDP
0%
10%
20%
30%
40%
50%
60%
70%
80%
90%
100%
Electricity Supply Chain Analysis and Proposals for Revamping
FINAL REPORT
Operational planning and dispatch
19
Day-ahead and three day-ahead generation operation planning: NCP
Power system study: PSS/E
These are all standard software packages used extensively by other system operators internationally. However, there are some limitations. In particular:
SDDP and NCP are designed as longer-term operational planning tools. To reduce computational time, SDDP does not use hourly modelling meaning it cannot readily represent the constraints on hour-by-hour dispatch. The two models are also unable to represent individual power plants in detail. This reduces their accuracy and increases the level of forecasting errors.
SCC does not have the capability to simulate relay protection systems in order to ensure that they can set the system correctly and that faults can be quickly isolated which in turn improves power system reliability.
SCC also needs to be equipped with additional tools and software applications for power system analysis, load forecasting and water inflow forecasting.
SCC has explained that the SDDP and NCP software was recently procured to comply with the requirements of the Methodology for Merit Order Dispatch issued by PUCSL. The NCP package is an interim solution ahead of the commissioning of SCC’s new control centre in 2016, which will include a fully integrated short-term and real-time planning and dispatching system.
SCC recognises the limitations of the SDDP software but considers these are not material given the purposes for which this software is used—to prepare longer-term operational plans for the purposes of reservoir management, maintenance scheduling, fuel procurement and BST applications. SCC also considers that any benefits in terms of improved forecasting accuracy that could be obtained from replacing this software would be outweighed by the need to purchase new licences and to dedicate staff time to learning and completing the database for the new software.
Procedures
Documentation
SCC does not have a full set of documented operational planning and dispatch procedures. Principles and general requirements are set out in the Grid Code and the Methodology for Merit Order Dispatch issued by PUCSL. However, these are not supplemented by detailed written procedures. This makes it more difficult to verify the actual procedures followed, to assess these and to monitor SCC’s compliance with them. It also creates the risk of deviations emerging in procedures over time or between shifts as the system operations staff change.

Electricity Supply Chain Analysis and Proposals for Revamping
FINAL REPORT
Operational planning and dispatch
20
Planning horizon
At present, SCC’s planning horizons are as follows: year-ahead, six month-ahead, month-ahead and day-ahead. The year-ahead plan is repeated every month, and has a planning horizon of 12 months into the future, the first month result is month-ahead operation planning. The daily plan is taken rolling for the next three days.
Currently, there is no week-ahead plan. SCC is building the necessary SDDP input file for week-ahead planning and it will be completed in near future. In the absence of a week-ahead plan, day-ahead planning uses projected water inflows and hydro generation from the month-ahead plan which do not necessarily incorporate the most recent data.
Coordination of maintenance outages
Power plants individually submit their proposed maintenance schedules to SCC for approval. SCC uses the year-ahead and month-ahead operational plans to assess the impacts on available generation capacity relative to system load and then decides to approve or revise the maintenance plans. There is no integrated maintenance planning process and individual plants are reliant on SCC to coordinate schedules.
Real-time dispatch
Real-time dispatch uses the most recent day-ahead plan. Deviations from this only occur where a generator fails or actual load deviates very substantially from forecast levels. In these instances, SCC revises the plan by rerunning the calculation in NCP. In emergency situations, load is shed according to a pre-determined plan.
Auditing
SCC’s auditing department compares actual conditions on each day and the conditions expected at the time of preparing the day-ahead plan. Based on this, it assesses the extent to which differences in conditions can explain changes in generation scheduling and the quality of service. SCC also compares daily load forecasts and actual load to analyse accuracy. However, no similar comparisons are conducted for longer-term projections.
Methodologies
At each step of the planning process, SCC prepares forecasts of system load, water inflows to hydro power plants (and, therefore, hydro generation) and renewable energy output. It then imposes physical constraints on the operation of thermal power plants (eg, start and stop timings) and on the transmission system and inputs the variable or energy costs of generators and requirements to hold-back a part of capacity to provide spinning reserve. Planning software is then used to calculate the resulting optimal operational plan under a number of scenarios.
The issues identified in the methodologies applied relate to load forecasting, the forecasting of water inflows, the setting of spinning reserve levels and the selection of scenarios for modelling.

Electricity Supply Chain Analysis and Proposals for Revamping
FINAL REPORT
Operational planning and dispatch
21
Load forecasting
SCC does not make use of load forecasting software or prepare its own load forecasts. Instead, distribution licensees provide forecasts of total demand for the next 12-month period. SCC uses historic data and its own judgement to allocate this total demand across months and to profile it within months. The day-ahead load forecast uses the average of the actual load in each period over the three preceding days. The day-ahead forecast does not, therefore, take account of circumstances such as public holidays etc.
Water inflows forecasting
To date, SCC does not utilise separate software tools to forecast the inflows for hydro power plants. Instead, the year-ahead and month-ahead plans use inflows projected in SDDP based on historic water flow data to 1979. The day-ahead plan uses the actual inflows over the preceding three days to forecast inflows for the next day. SCC does not make any use of projections of rainfall or other drivers of water flows from weather forecasting services.
Spinning reserves
At present, for all calculation and analysis, the spinning reserve is set to 5% of whole system load, SCC allocates this for hydro power plants. In case of hydro power plants run out of water, spinning reserves shall be set to zero. SCC does not assess whether it would be possible at certain times to reduce the spinning reserve level in order to reduce costs (by releasing hydro capacity to meet load) while not endangering system security.
Scenarios
Currently, for the year-ahead plan, SCC uses the stochastic capabilities of SDDP to prepare 100 scenarios of water inflows and consequent hydro generation. These are then used to prepare three different generation cases depending on hydrological conditions:
10 scenarios with maximum of hydro energy
High hydrology – low thermal generation case
10 scenarios with average of hydro energy
Average hydrology – base thermal generation case
10 scenarios with minimum of hydro energy
Low hydrology – high thermal generation case
The month-ahead plan uses the water inflows case that best corresponds to the actual conditions seen. The day-ahead plan uses actual inflow data and, therefore, the selection of case is not relevant.
Electricity Supply Chain Analysis and Proposals for Revamping
FINAL REPORT
Operational planning and dispatch
22
3.2 Recommendations
Our assessment is that there are no significant deviations between expected utilization based on the merit order and actual utilization that cannot be explained by external factors. However, it still remains possible to improve the efficiency of the operational planning and dispatch process.
We have provided a detailed analysis of the issues identified and recommended solutions in a separate appendix to this report, which has been made available to PUCSL and SCC. In this main text, we summarise our recommendations with regards to improving the operational planning and dispatch process.
Data management infrastructure
SCC’s data management infrastructure should be expanded to include at least the following inter-linked elements:
SCADA/EMS system: The existing SCADA system should be expanded to cover the full system and EMS added to allow automation of system operations.
Central Database: A central electronic database should be established storing all data required by SCC for planning and auditing purposes.
Applications: SCC’s forecasting and modelling tools should be linked to the central database, allowing consistent use of data and for calculated outputs to be shared across applications.
Web Portal: SCC should establish a web portal as a means of sharing data with licensees and with stakeholders. Typically this will have multiple levels with increasing security—the first for public information, the second for generation licensees and the third for individual licensees.
Electricity Supply Chain Analysis and Proposals for Revamping
FINAL REPORT
Operational planning and dispatch
23
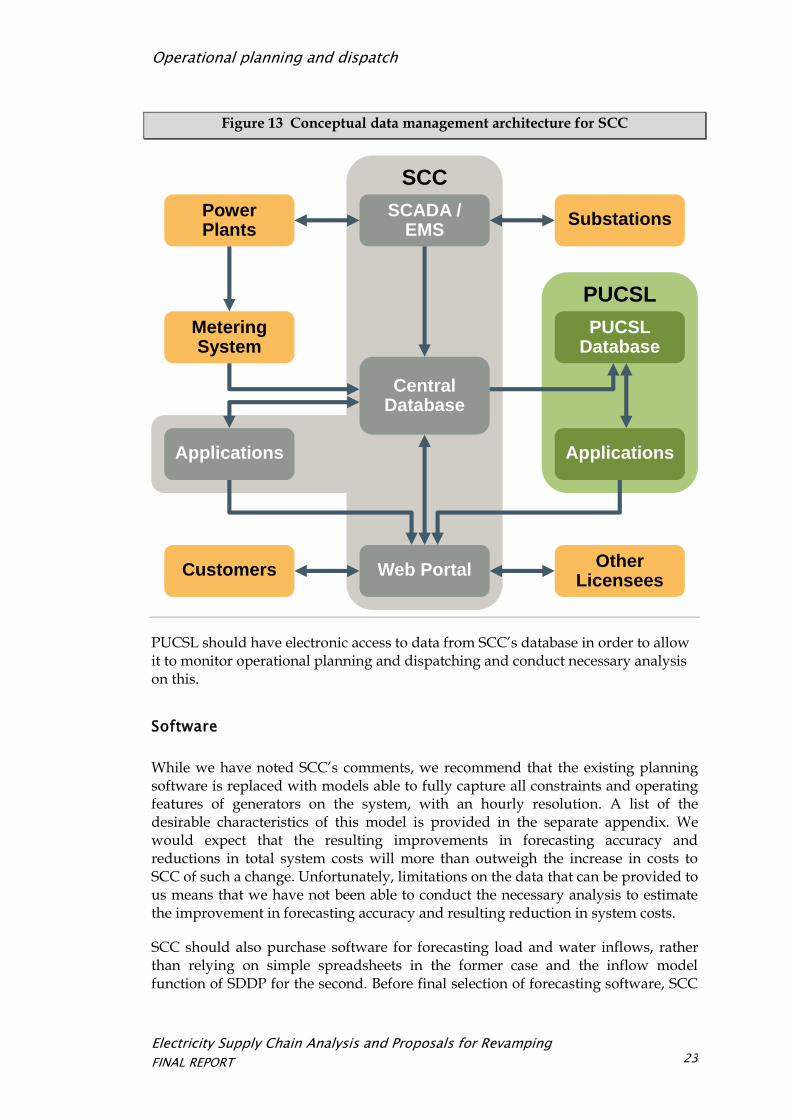
Figure 13 Conceptual data management architecture for SCC
PUCSL should have electronic access to data from SCC’s database in order to allow it to monitor operational planning and dispatching and conduct necessary analysis on this.
Software
While we have noted SCC’s comments, we recommend that the existing planning software is replaced with models able to fully capture all constraints and operating features of generators on the system, with an hourly resolution. A list of the desirable characteristics of this model is provided in the separate appendix. We would expect that the resulting improvements in forecasting accuracy and reductions in total system costs will more than outweigh the increase in costs to SCC of such a change. Unfortunately, limitations on the data that can be provided to us means that we have not been able to conduct the necessary analysis to estimate the improvement in forecasting accuracy and resulting reduction in system costs.
SCC should also purchase software for forecasting load and water inflows, rather than relying on simple spreadsheets in the former case and the inflow model function of SDDP for the second. Before final selection of forecasting software, SCC
PUCSL
SCC
Power Plants
Metering System
Applications
Customers
Substations
PUCSL Database
Applications
Other Licensees
SCADA / EMS
Web Portal
Central Database
Electricity Supply Chain Analysis and Proposals for Revamping
FINAL REPORT
Operational planning and dispatch
24
and Distribution Licensees should test the accuracy of forecasts developed using different software packages.
Procedures
Documentation
SCC should fully document its planning and dispatching procedures in writing. These should be provided to PUCSL and might also be published to increase the level of transparency of SCCs operations.
Planning horizon
The introduction of a week-ahead plan should be completed as soon as possible.
Coordination of maintenance outages
SCC should consider introducing a more formal process for planning and coordinating maintenance outages through the use of a Projected Assessment of System Adequacy (PASA). A PASA shows expected generation plant availability against forecast load over a period of up to 24 months ahead. Anticipated network limitations caused by planned transmission plant outages are included. The PASA then provides a basis for individual power plants to identify the most suitable periods for maintenance outages rather than proposing these in isolation.
Auditing
The current process of auditing actual against forecast outcomes should be extended to include medium and long-term planning (of particular importance with respect to load forecasting). The audit should also compare actual dispatch with optimal dispatch (simulated by inputting actual data into the dispatching tool) and calculate how costs change to give an indication of the magnitude of impacts of forecasting errors. This will help identify which errors are most significant in their impacts and, therefore, where attention needs to be focused.
Methodologies
Load forecasting
SCC is currently dependent on load forecasts provided by distribution licensees, historic data and expert judgement in order to derive forecasts for use in long-term and medium-term operational planning. Short-term or day-ahead planning uses actual load on recent days.
We recommend that SCC should take responsibility for preparing its own load forecasts. The forecasts prepared by distribution licensees can be an input to this but should not be the sole basis for the forecasts. This should lead to more accurate forecasting and also gives SCC greater ability to improve its forecasting over time by identifying and resolving differences between forecasts and actual load. For day-
Electricity Supply Chain Analysis and Proposals for Revamping
FINAL REPORT
Operational planning and dispatch
25
ahead planning, SCC should also prepare day-ahead load forecasts rather than relying on actual load in recent days. This will allow it to anticipate the impacts on load of known circumstances such as holidays, national events or unusual weather conditions.
The separate appendix provides more detail on the alternative load forecasting methodologies that might be used and their advantages and disadvantages.
We understand that SCC is taking initial steps to improve the level of detail in the forecasts provided from distribution licensees, which we welcome. We also understand that SCC is beginning to collect data on climatic conditions, temperature and rainfall for the purposes of improving its forecasting of load and water inflows. We recommend that SCC accelerates this process and makes use of the various existing datasets available publicly, such as those from weather forecasting organisations.
Water inflows
SCC should also make greater use of its own forecasts for short-term operational planning. To assist in this, it should subscribe to professional weather forecasting services. The existing water inflows database should be updated and potential changes in inflow patterns over time due to changes in climatic conditions or physical changes to catchment areas should be assessed.
Spinning reserve
SCC needs to consider the potential for relaxing spinning reserve requirements as a means of reducing costs. In doing so, it should model expected dispatch and loss of load under probabilistic conditions with different levels of spinning reserve to identify the extent of potential cost savings.
Scenarios
The existing three cases used for year-ahead and month-ahead planning should be modified to a set of probability-based scenarios plus additional scenarios. The definition of the scenarios should also be more conservative than at present as regards water inflow levels. Proposed scenarios are:
High inflow scenario – with 50% probability that water inflows are equal to or greater those used in the scenario
Average inflow scenario – with 70-75% probability that water inflows are equal to or greater those used in the scenario
Low inflow scenario – with 85% probability that water inflows are equal to or greater those used in the scenario
Average actual inflow scenario – with inflows calculated as the actual average observed over a number of preceding years

Electricity Supply Chain Analysis and Proposals for Revamping
FINAL REPORT
Operational planning and dispatch
26
Forecast inflow scenario – with inflows for each reservoir forecast using external weather forecast data
Electricity Supply Chain Analysis and Proposals for Revamping
FINAL REPORT
Fuel costs
27
4 Fuel costs
Generator fuel costs represent the largest part of total costs. We have looked at the questions of whether:
Fuel is being efficiently procured and priced?
Tariffs allow recovery of efficient fuel costs?
4.1 Assessment
4.1.1 Fuel procurement and pricing
Oil products
CEB and IPPs procure fuel oil, naphtha and diesel from the Ceylon Petroleum Corporation (CPC). High sulphur fuel oil (HSFO) and naphtha are largely supplied from CPC’s own refinery. Low sulphur fuel oil (LSFO), used to supply West Coast Power, and diesel for power generation6 are imported through periodic tenders.
Prices are notified by CPC and there is no negotiation. CPC itself has little or no control over prices which are established by the Ministry of Finance and Planning (MFP) at irregular intervals and which reflect a mix of commercial and social objectives. In general, since 2008, fuel prices for the power sector and other users have been held below full cost in an attempt to keep electricity tariff lows. CPC is supposed to be compensated from the government budget for the resulting losses but this has not always happened and, instead, various ad hoc subsidies such as temporary tax exemptions apply. CPC has also suffered from late payment of bills by CEB and IPPs which has led it to restrict supplies until arrears are cleared.
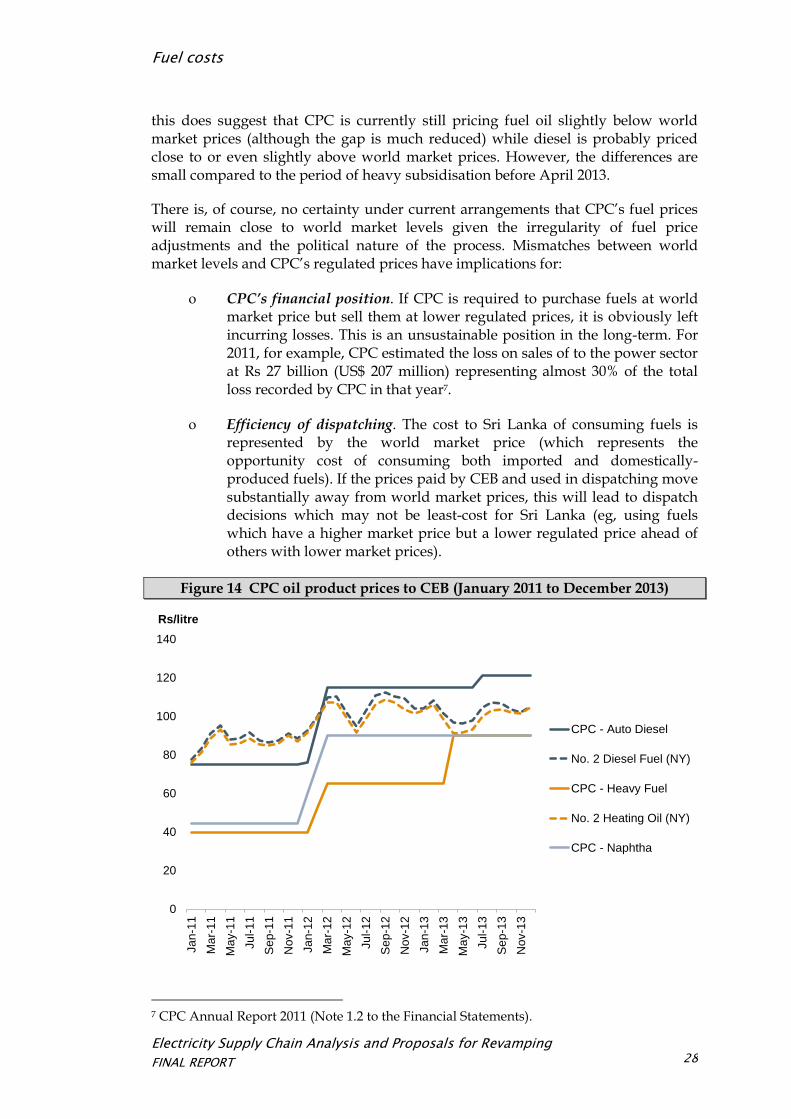
The most recent price increase was in April 2013. Following this increase, CPC is now estimated to be supplying HSFO and naphtha at prices that recover costs but to be supplying LSFO and diesel (the price for which is linked to the Sri Lankan retail price for vehicles) at below cost. It should be noted that references to costs here relate, we understand, to the costs of production at CPC’s Sapugaskanda refinery and not necessarily to world market prices for different fuels. These world market prices represent the opportunity cost of supplying fuel to CEB when it could otherwise be sold at market prices for export or to other users and, therefore, provide an alternative measure of whether current fuel prices match costs.
We show below a comparison of CPC’s prices for diesel, fuel oil and naphtha sold to CEB against benchmark prices for oil products in the USA. While comparisons are inevitably difficult due to differences in transport costs (not separated out below),
6 CPC can refine diesel but current refining capacity is only around 25% of demand.
Electricity Supply Chain Analysis and Proposals for Revamping
FINAL REPORT
Fuel costs
28
this does suggest that CPC is currently still pricing fuel oil slightly below world market prices (although the gap is much reduced) while diesel is probably priced close to or even slightly above world market prices. However, the differences are small compared to the period of heavy subsidisation before April 2013.
There is, of course, no certainty under current arrangements that CPC’s fuel prices will remain close to world market levels given the irregularity of fuel price adjustments and the political nature of the process. Mismatches between world market levels and CPC’s regulated prices have implications for:
CPC’s financial position. If CPC is required to purchase fuels at world market price but sell them at lower regulated prices, it is obviously left incurring losses. This is an unsustainable position in the long-term. For 2011, for example, CPC estimated the loss on sales of to the power sector at Rs 27 billion (US$ 207 million) representing almost 30% of the total loss recorded by CPC in that year7.
Efficiency of dispatching. The cost to Sri Lanka of consuming fuels is represented by the world market price (which represents the opportunity cost of consuming both imported and domestically-produced fuels). If the prices paid by CEB and used in dispatching move substantially away from world market prices, this will lead to dispatch decisions which may not be least-cost for Sri Lanka (eg, using fuels which have a higher market price but a lower regulated price ahead of others with lower market prices).
Figure 14 CPC oil product prices to CEB (January 2011 to December 2013)
7 CPC Annual Report 2011 (Note 1.2 to the Financial Statements).
0
20
40
60
80
100
120
140
Jan-1
1
Ma
r-11
May-1
1
Jul-
11
Sep
-11
Nov-1
1
Jan-1
2
Mar-
12
May-1
2
Jul-
12
Sep
-12
Nov-1
2
Jan-1
3
Mar-
13
May-1
3
Jul-
13
Se
p-1
3
Nov-1
3
Rs/litre
CPC - Auto Diesel
No. 2 Diesel Fuel (NY)
CPC - Heavy Fuel
No. 2 Heating Oil (NY)
CPC - Naphtha
Electricity Supply Chain Analysis and Proposals for Revamping
FINAL REPORT
Fuel costs
29
Source: PUCSL and EIA (US fuel product price)
Coal
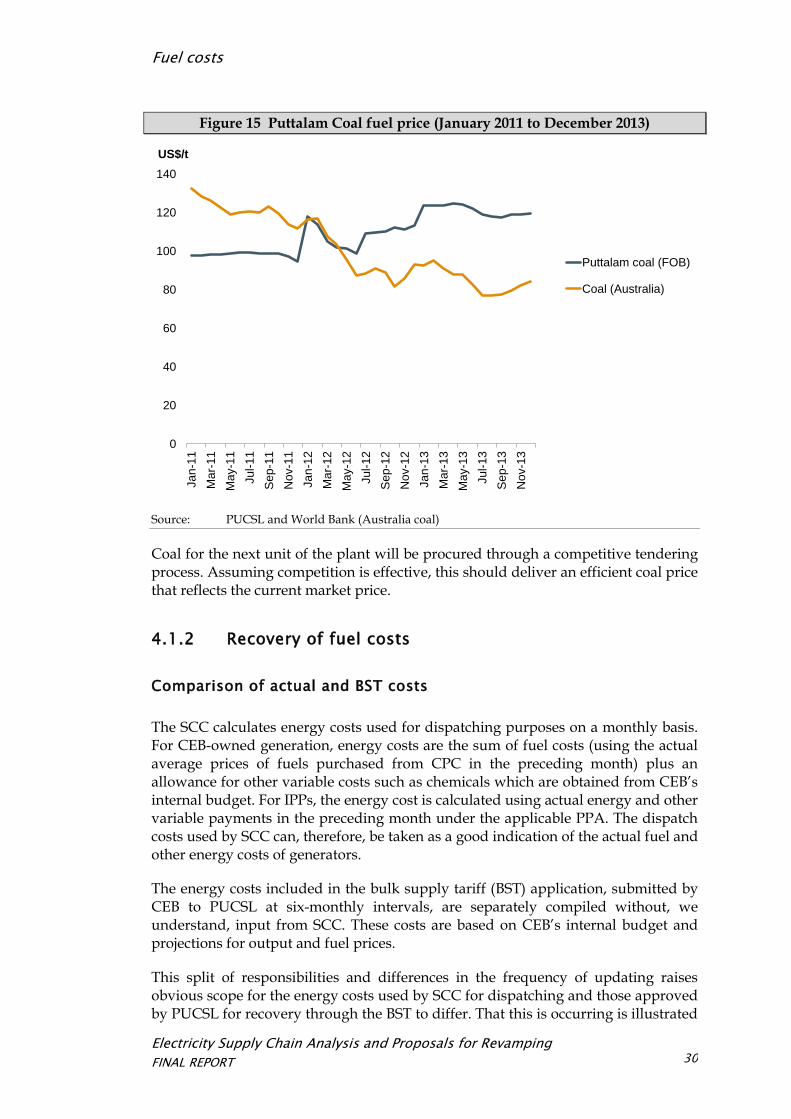
Coal for the Puttalam coal power plant is supplied by Lanka Coal Company (LCC), a joint venture between CEB (60%), government (20%), Ceylon Shipping Corporation (10%) and Sri Lanka Ports Authority (10%). LCC entered into a long-term coal supply agreement with Nobel Resources Pte Ltd in 2010, the terms of which appear to be passed-through to CEB under an agreement between LCC and CEB signed in September 2013. Under this agreement, the base free-on-board (FOB) price for coal is 70 US$/t to which are added base freight costs of 15.2 US$/t and base lightering costs of 4.75 US$/t for a total base delivered price of 89.95 US$/t8. The FOB coal price is supposedly indexed to the Newcastle coal index published by Global Coal and the freight and lightering costs to bunker oil and diesel prices respectively.
We compare the estimated FOB price included in CEB’s BST submissions with the Australian coal price average in Figure 15, below. The FOB prices for Puttalam Coal is calculated by deducting the base freight and lightering costs from the price (converted to US$) shown in the submission. As can be seen, the prices in the BST submissions have failed to track movements in the Australian coal price and, indeed, appear to be moving upwards as the benchmark coal price.
We are unclear why this should be so given the indexation of the contract coal price to the Newcastle benchmark. CEB has suggested that the divergence may be partly caused by the limitations on coal supply to the plant. This uses lighters to unload ships and transport coal to shore. Monsoon conditions mean that unloading cannot take place for a six-month period in each year. Therefore, coal is purchased ahead of the monsoon season and stored. This means that coal prices reported in the BST may actually reflect purchases made up to six months before. While we agree this might partly explain the difference, we note that the divergence identified in the figure extends over a two-year period, so that these restrictions on supply cannot be the sole reason.
8 Equivalent to 3.6 US$/mmbtu (using the seller’s standard calorific value under the agreement of 6,300 kcal/kg).
Electricity Supply Chain Analysis and Proposals for Revamping
FINAL REPORT
Fuel costs
30
Figure 15 Puttalam Coal fuel price (January 2011 to December 2013)
Source: PUCSL and World Bank (Australia coal)
Coal for the next unit of the plant will be procured through a competitive tendering process. Assuming competition is effective, this should deliver an efficient coal price that reflects the current market price.
4.1.2 Recovery of fuel costs
Comparison of actual and BST costs
The SCC calculates energy costs used for dispatching purposes on a monthly basis. For CEB-owned generation, energy costs are the sum of fuel costs (using the actual average prices of fuels purchased from CPC in the preceding month) plus an allowance for other variable costs such as chemicals which are obtained from CEB’s internal budget. For IPPs, the energy cost is calculated using actual energy and other variable payments in the preceding month under the applicable PPA. The dispatch costs used by SCC can, therefore, be taken as a good indication of the actual fuel and other energy costs of generators.
The energy costs included in the bulk supply tariff (BST) application, submitted by CEB to PUCSL at six-monthly intervals, are separately compiled without, we understand, input from SCC. These costs are based on CEB’s internal budget and projections for output and fuel prices.
This split of responsibilities and differences in the frequency of updating raises obvious scope for the energy costs used by SCC for dispatching and those approved by PUCSL for recovery through the BST to differ. That this is occurring is illustrated
0
20
40
60
80
100
120
140
Jan-1
1
Ma
r-11
May-1
1
Jul-
11
Sep
-11
Nov-1
1
Jan-1
2
Mar-
12
May-1
2
Jul-
12
Sep
-12
Nov-1
2
Jan-1
3
Mar-
13
May-1
3
Jul-
13
Se
p-1
3
Nov-1
3
US$/t
Puttalam coal (FOB)
Coal (Australia)
Electricity Supply Chain Analysis and Proposals for Revamping
FINAL REPORT
Fuel costs
31
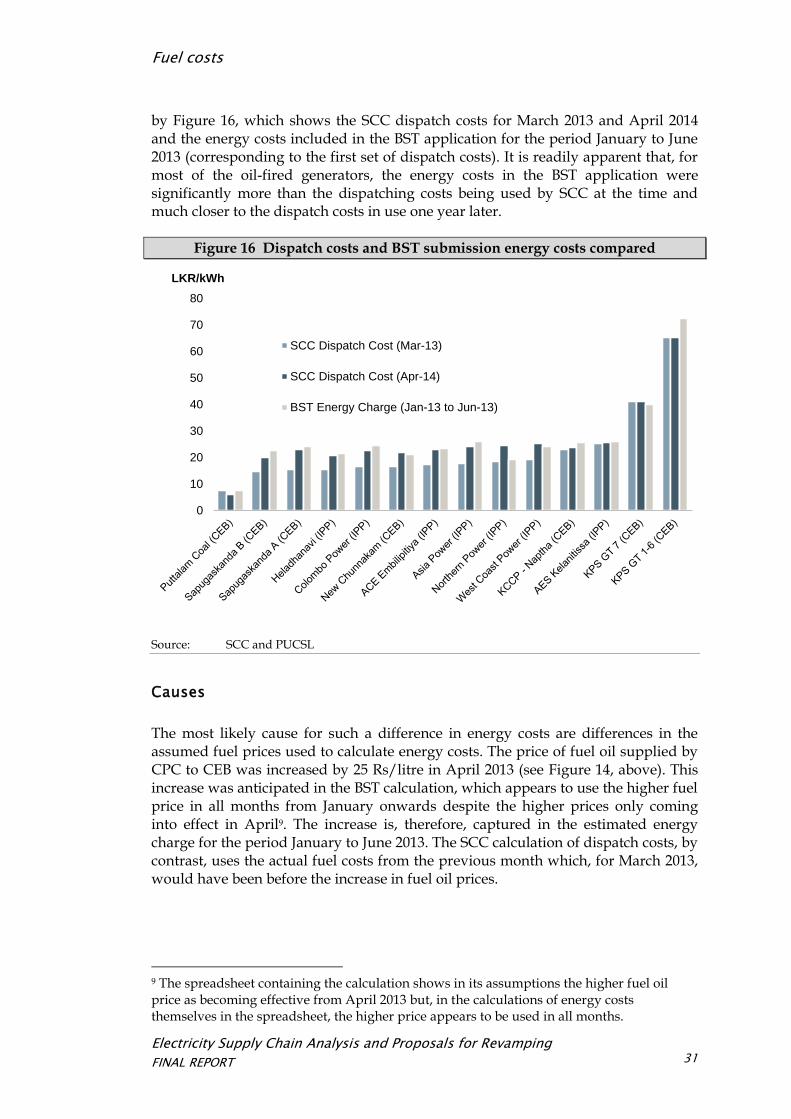
by Figure 16, which shows the SCC dispatch costs for March 2013 and April 2014 and the energy costs included in the BST application for the period January to June 2013 (corresponding to the first set of dispatch costs). It is readily apparent that, for most of the oil-fired generators, the energy costs in the BST application were significantly more than the dispatching costs being used by SCC at the time and much closer to the dispatch costs in use one year later.
Figure 16 Dispatch costs and BST submission energy costs compared
Source: SCC and PUCSL
Causes
The most likely cause for such a difference in energy costs are differences in the assumed fuel prices used to calculate energy costs. The price of fuel oil supplied by CPC to CEB was increased by 25 Rs/litre in April 2013 (see Figure 14, above). This increase was anticipated in the BST calculation, which appears to use the higher fuel price in all months from January onwards despite the higher prices only coming into effect in April9. The increase is, therefore, captured in the estimated energy charge for the period January to June 2013. The SCC calculation of dispatch costs, by contrast, uses the actual fuel costs from the previous month which, for March 2013, would have been before the increase in fuel oil prices.
9 The spreadsheet containing the calculation shows in its assumptions the higher fuel oil price as becoming effective from April 2013 but, in the calculations of energy costs themselves in the spreadsheet, the higher price appears to be used in all months.
0
10
20
30
40
50
60
70
80
LKR/kWh
SCC Dispatch Cost (Mar-13)
SCC Dispatch Cost (Apr-14)
BST Energy Charge (Jan-13 to Jun-13)
Electricity Supply Chain Analysis and Proposals for Revamping
FINAL REPORT
Fuel costs
32
That this is the likely cause is also shown by the similarity between BST energy charges and SCC dispatch costs in March 2014, by which date both were being calculated using the higher fuel prices.
As shown in Figure 15, there are also divergences between the coal price included in the BST calculation and the movement of international market prices. In the absence of a functioning “true-up” mechanism in the tariff calculation, such divergences would allow CEB to over-recover its costs of generation where the contr. This does appear to be happening. In November 2013, according to SCC data, the average price being paid for coal supplies to the Puttalam Coal plant was 15.11 Rs/kg (equivalent to 115 US$/t on on a delivered basis including freight and lightering costs). Meanwhile, the coal price used in the calculation of the energy charge included in the BST was 18.2 Rs/kg (139 US$/t). This difference would represent an over-recovery of coal purchase costs by CEB in November 2013 alone of as much as Rs 185 million10. This highlights the need for future submissions to provide a more detailed break-down of fuel price assumptions, showing how these relate to movements in world market prices.
Impacts
In principle, these differences should not matter for the purposes of revenue recovery and final customer tariffs. The PUCSL-issued tariff methodology provides for a Bulk Supply Transactions Account (BSTA) which can be used to manage differences between actual and allowed bulk supply costs.
In practice, however, this account has not been established. Differences between actual costs (as used for dispatching purposes) and approved costs in the BST, therefore, represent an unrecovered gain or loss for CEB and customers. During the first three months of 2013, it appears that these discrepancies were to the advantage of CEB, with the approved energy charge included in tariffs using the higher fuel prices even before these actually took effect and, therefore, leading to energy charges included in tariffs that exceeded the actual costs of generation.
The differences between the costs included in the approved BST and those used for dispatching purposes can also be misleading when monitoring the efficiency of CEB’s operations. A plant which looks lower-cost in one case may be higher-cost in another. Depending which cost is referred to, therefore, the resulting outcomes may appear efficient or inefficient as regards dispatching decisions.
10 Calculated assuming a calorific value of 6.277 Mcal/kg, a heat rate of 2,251 kcal/kWh and total generation in November 2013 of 165,300 MWh. All data from SCC.
Electricity Supply Chain Analysis and Proposals for Revamping
FINAL REPORT
Fuel costs
33
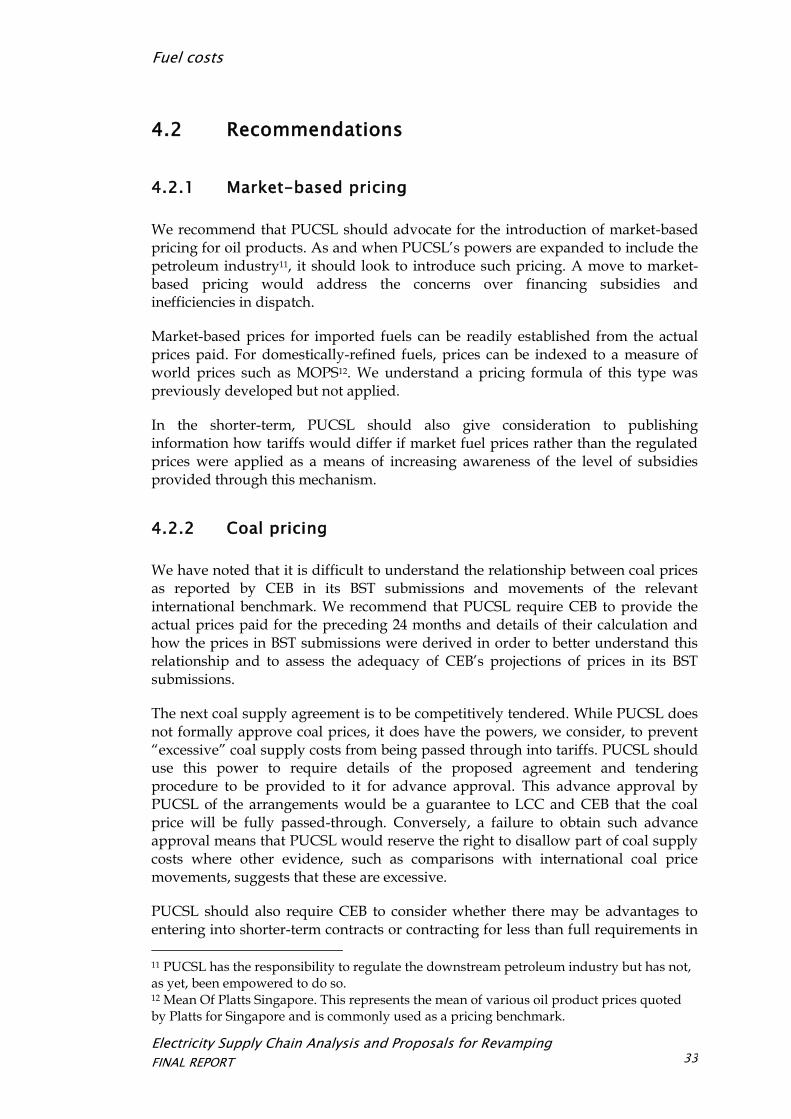
4.2 Recommendations
4.2.1 Market-based pricing
We recommend that PUCSL should advocate for the introduction of market-based pricing for oil products. As and when PUCSL’s powers are expanded to include the petroleum industry11, it should look to introduce such pricing. A move to market-based pricing would address the concerns over financing subsidies and inefficiencies in dispatch.
Market-based prices for imported fuels can be readily established from the actual prices paid. For domestically-refined fuels, prices can be indexed to a measure of world prices such as MOPS12. We understand a pricing formula of this type was previously developed but not applied.
In the shorter-term, PUCSL should also give consideration to publishing information how tariffs would differ if market fuel prices rather than the regulated prices were applied as a means of increasing awareness of the level of subsidies provided through this mechanism.
4.2.2 Coal pricing
We have noted that it is difficult to understand the relationship between coal prices as reported by CEB in its BST submissions and movements of the relevant international benchmark. We recommend that PUCSL require CEB to provide the actual prices paid for the preceding 24 months and details of their calculation and how the prices in BST submissions were derived in order to better understand this relationship and to assess the adequacy of CEB’s projections of prices in its BST submissions.
The next coal supply agreement is to be competitively tendered. While PUCSL does not formally approve coal prices, it does have the powers, we consider, to prevent “excessive” coal supply costs from being passed through into tariffs. PUCSL should use this power to require details of the proposed agreement and tendering procedure to be provided to it for advance approval. This advance approval by PUCSL of the arrangements would be a guarantee to LCC and CEB that the coal price will be fully passed-through. Conversely, a failure to obtain such advance approval means that PUCSL would reserve the right to disallow part of coal supply costs where other evidence, such as comparisons with international coal price movements, suggests that these are excessive.
PUCSL should also require CEB to consider whether there may be advantages to entering into shorter-term contracts or contracting for less than full requirements in
11 PUCSL has the responsibility to regulate the downstream petroleum industry but has not, as yet, been empowered to do so. 12 Mean Of Platts Singapore. This represents the mean of various oil product prices quoted by Platts for Singapore and is commonly used as a pricing benchmark.
Electricity Supply Chain Analysis and Proposals for Revamping
FINAL REPORT
Fuel costs
34
order to increase exposure to market conditions. Coal is a largely fungible commodity and, therefore, shorter-term contracts are perfectly feasible.
4.2.3 Recovery of fuel costs
The BSTA should be put into effect in order to manage divergences between actual fuel costs and those included in the approved BST. If this is not possible, then consideration should be given to explicitly indexing the fuel cost component of the BST to world market fuel prices to avoid significant mismatches emerging, to the detriment of customers and CEB.
Electricity Supply Chain Analysis and Proposals for Revamping
FINAL REPORT
Power Purchase Agreements
35
5 Power Purchase Agreements
In this section, we review features of the existing PPAs which may introduce inefficiencies. The intention is not to recommend any amendments to these PPAs except where these can be mutually agreed. Instead, we highlight areas which should be addressed in any new PPAs entered into by CEB.
5.1 Assessment
We have identified three issues with the existing PPAs which future PPAs should avoid:
The lack of a competitive procurement process. This is most noticeable in the case of West Coast Power (WCP), whose costs appear extremely high relative to other generators and which was directly negotiated. A competitive procurement process would have been expected to deliver the least-cost outcome and would have provided comfort to PUCSL and electricity customers that WCP’s costs are reasonable and efficient.
Payment structures under existing reciprocating engine PPAs. The payment structures in these PPAs do not appear to correspond well to actual cost structures and may introduce inefficiencies into dispatching decisions (which use the PPA costs).
Mismatches in actual and PPA heat rates. This appears to be a problem for the WCP and AES Kelanitissa (AESK) plants. The mismatches may create incentives for inefficient behaviour by these generators as well as creating dispatch inefficiencies.
5.1.1 Lack of competitive procurement of IPPs
Competitive procurement of IPPs is to be strongly preferred under almost all circumstances. Without this, it is extremely difficult to be confident that the prices in PPAs are both reasonable as regards the actual costs of the generator concerned and are efficient in terms of being least-cost. Uncertainties over whether PPA prices are reasonable and efficient are, in turn, likely to generate disputes over cost-recovery going forward.
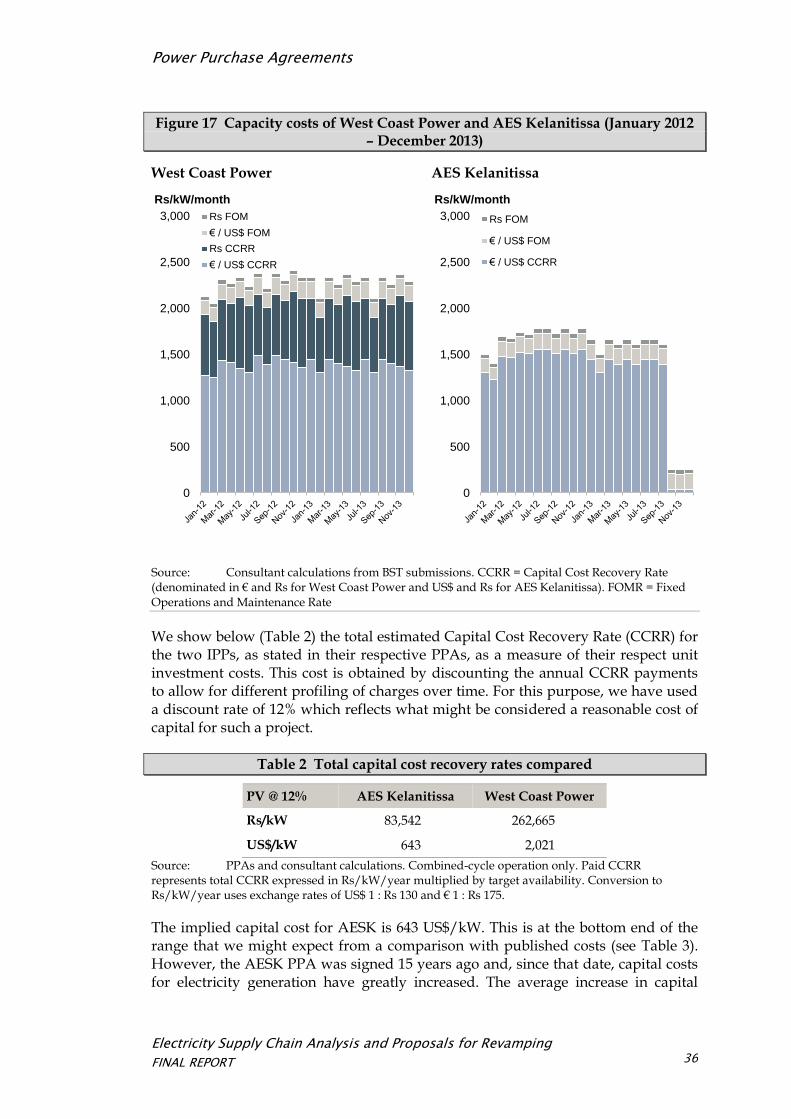
This is most evident in Sri Lanka in the case of WCP. We show below the capacity costs of AESK and WCP, as included in BST submissions from January 2012 to December 2013. It is noticeable that WCP capacity charges (in Rs/kW/month) are around 40% higher than those for AESK until October 2013 when they rise to more than eight times with the ending of debt service payments for AESK. This is despite both plants using CCGT technology and having similar PPA structures.
Electricity Supply Chain Analysis and Proposals for Revamping
FINAL REPORT
Power Purchase Agreements
36
Figure 17 Capacity costs of West Coast Power and AES Kelanitissa (January 2012 – December 2013)
West Coast Power AES Kelanitissa
Source: Consultant calculations from BST submissions. CCRR = Capital Cost Recovery Rate (denominated in € and Rs for West Coast Power and US$ and Rs for AES Kelanitissa). FOMR = Fixed Operations and Maintenance Rate
We show below (Table 2) the total estimated Capital Cost Recovery Rate (CCRR) for the two IPPs, as stated in their respective PPAs, as a measure of their respect unit investment costs. This cost is obtained by discounting the annual CCRR payments to allow for different profiling of charges over time. For this purpose, we have used a discount rate of 12% which reflects what might be considered a reasonable cost of capital for such a project.
Table 2 Total capital cost recovery rates compared
PV @ 12% AES Kelanitissa West Coast Power
Rs/kW 83,542 262,665
US$/kW 643 2,021
Source: PPAs and consultant calculations. Combined-cycle operation only. Paid CCRR represents total CCRR expressed in Rs/kW/year multiplied by target availability. Conversion to Rs/kW/year uses exchange rates of US$ 1 : Rs 130 and € 1 : Rs 175.
The implied capital cost for AESK is 643 US$/kW. This is at the bottom end of the range that we might expect from a comparison with published costs (see Table 3). However, the AESK PPA was signed 15 years ago and, since that date, capital costs for electricity generation have greatly increased. The average increase in capital
0
500
1,000
1,500
2,000
2,500
3,000
Rs/kW/month
Rs FOM
€ / US$ FOM
Rs CCRR
€ / US$ CCRR
0
500
1,000
1,500
2,000
2,500
3,000
Rs/kW/month
Rs FOM
€ / US$ FOM
€ / US$ CCRR
Electricity Supply Chain Analysis and Proposals for Revamping
FINAL REPORT
Power Purchase Agreements
37
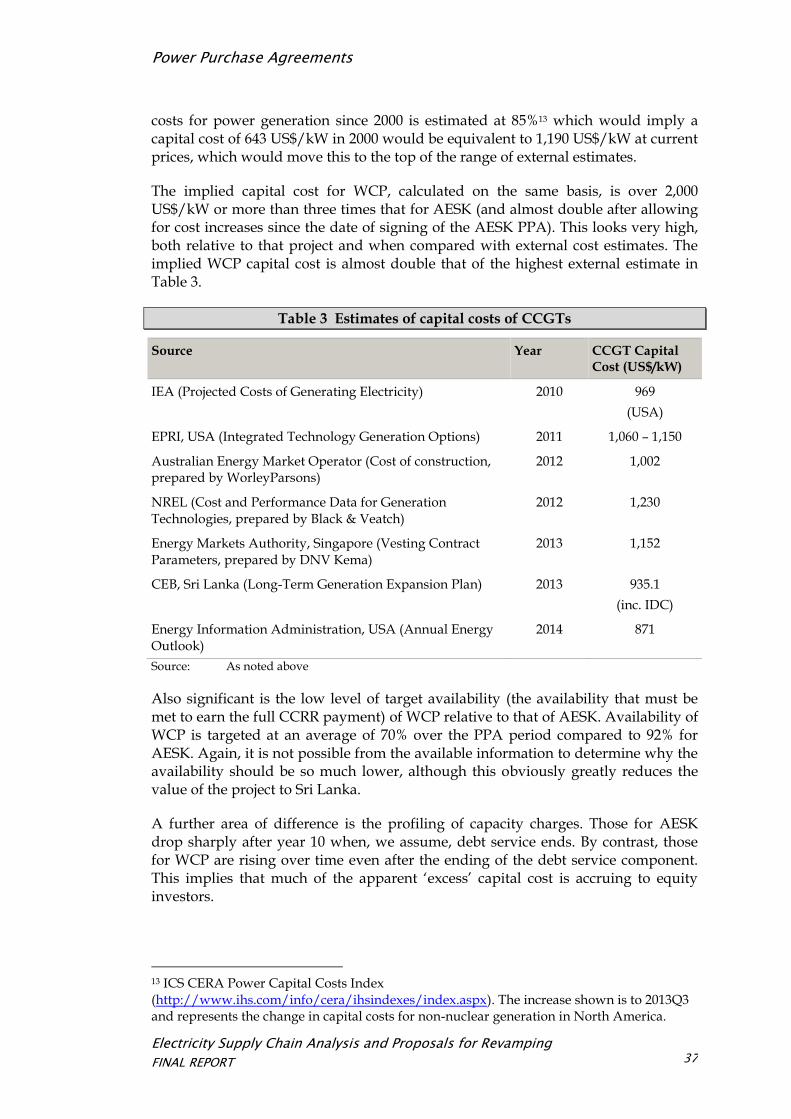
costs for power generation since 2000 is estimated at 85%13 which would imply a capital cost of 643 US$/kW in 2000 would be equivalent to 1,190 US$/kW at current prices, which would move this to the top of the range of external estimates.
The implied capital cost for WCP, calculated on the same basis, is over 2,000 US$/kW or more than three times that for AESK (and almost double after allowing for cost increases since the date of signing of the AESK PPA). This looks very high, both relative to that project and when compared with external cost estimates. The implied WCP capital cost is almost double that of the highest external estimate in Table 3.
Table 3 Estimates of capital costs of CCGTs
Source Year CCGT Capital Cost (US$/kW)
IEA (Projected Costs of Generating Electricity) 2010 969
(USA)
EPRI, USA (Integrated Technology Generation Options) 2011 1,060 – 1,150
Australian Energy Market Operator (Cost of construction, prepared by WorleyParsons)
2012 1,002
NREL (Cost and Performance Data for Generation Technologies, prepared by Black & Veatch)
2012 1,230
Energy Markets Authority, Singapore (Vesting Contract Parameters, prepared by DNV Kema)
2013 1,152
CEB, Sri Lanka (Long-Term Generation Expansion Plan) 2013 935.1
(inc. IDC)
Energy Information Administration, USA (Annual Energy Outlook)
2014 871
Source: As noted above
Also significant is the low level of target availability (the availability that must be met to earn the full CCRR payment) of WCP relative to that of AESK. Availability of WCP is targeted at an average of 70% over the PPA period compared to 92% for AESK. Again, it is not possible from the available information to determine why the availability should be so much lower, although this obviously greatly reduces the value of the project to Sri Lanka.
A further area of difference is the profiling of capacity charges. Those for AESK drop sharply after year 10 when, we assume, debt service ends. By contrast, those for WCP are rising over time even after the ending of the debt service component. This implies that much of the apparent ‘excess’ capital cost is accruing to equity investors.
13 ICS CERA Power Capital Costs Index (http://www.ihs.com/info/cera/ihsindexes/index.aspx). The increase shown is to 2013Q3 and represents the change in capital costs for non-nuclear generation in North America.
Electricity Supply Chain Analysis and Proposals for Revamping
FINAL REPORT
Power Purchase Agreements
38
It should be noted that the investment cost as implied in WCP’s audited financial statements is rather lower than that calculated from the CCRR schedule in the PPA. The audited accounts of the project company, West Coast Power (Pvt) Ltd, treat the project as being a financial lease, with the underlying assets being leased by CEB who assumes the physical risks related to these and West Coast Power (Pvt) Ltd recording the expected stream of capacity charge (or lease) payments from the project as a financial asset14. As at December 2013, these future payments amounted to Rs 36,795 million (~US$ 283 million), which is broadly equivalent to 1,050 US$/kW. We are not able to ascertain the reasons for the difference between this figure and the much higher value that the capacity charges in the PPA would suggest.
Overall, therefore, the WCP PPA appears to represent a very high-cost choice for Sri Lanka. This is particularly so given that this is one of the most expensive generators on an energy cost basis and, therefore, has relatively low utilisation despite its high capacity charges.
In our view, the most likely reason for the high cost of the WCP project is the procurement process followed. The project was selected on a sole-sourced basis. The power plant is considered to be leased by CEB from West Coast Power (Pvt) Ltd, the owner, which is majority-owned by the Ministry of Finance. Construction was undertaken by Ladkhavani Transformers Ltd, a company 70%-owned by CEB, which is also the O&M contractor for the project. Negotiations took place before the empowerment of PUCSL which would have been able to offer an independent perspective on the project.
Therefore, government was heavily dependent on advice from CEB as regards the need for and costs of a power plant that was to be constructed and operated by a subsidiary of CEB, that is to be owned by CEB and that meets a requirement of CEB for new capacity. If nothing else, this obviously creates a strong appearance of conflicts of interest in the process and, therefore, the extent to which the incentives in the process were to minimize costs. By contrast, AESK was negotiated with a foreign partner with no CEB participation, was partially financed by the Asian Development Bank and was overseen by the Energy Supply Commission, introducing independent perspectives to the procurement process.
5.1.2 Payment structures for reciprocating engine PPAs
The PPAs signed between CEB and IPPs follow a two-part tariff structure. A non-escalable capacity charge recovers the investment costs of the IPP. An escalable capacity charge recovers the fixed O&M costs. A fuel energy charge recovers the fuel costs and an escalable non-fuel energy charge recovers the variable O&M costs.
However, there is a significant difference between the way these charges are applied for the various reciprocating engine IPPs and the two CCGTs (AESK and WCP). For the first group, the capacity charge is expressed in Rs /kWh. The PPA then establishes a Minimum Guaranteed Energy Amount (MGEA) which CEB is required
14 West Coast Power (Pvt) Ltd Audited Financial Statements, 2013.
Electricity Supply Chain Analysis and Proposals for Revamping
FINAL REPORT
Power Purchase Agreements
39
to pay for annually in each year. This then allows the IPP to be sure it will earn the total capacity payment (the product of the capacity charge and MGEA) that they require. This is irrespective of the actual level of dispatch.
Conversely, for the two CCGTs, the capacity charge is expressed in Rs /kW and paid with reference to available capacity. No MGEA is applied. The IPP therefore, earns it required capacity payment if it is able to achieve the targeted level of availability, irrespective of actual generation.
The two sets of PPAs also differ in their treatment of energy costs and, in particular, start-stop costs. Those for reciprocating engine IPPs have an energy charge expressed in Rs / kWh. A large number of ‘free’ starts and stops are allowed under the PPA with a flat charge in Rs plus a fuel cost applying for starts in excess of this allowance.
The PPAs for the two CCGTs instead apply a ‘no-load’ charge in Rs / hour, which applies for every hour for which the plant is operating, whether or not it is delivering energy or being used to provide reserves. An incremental energy charge recovers the fuel costs associated with generating electricity. There are no free starts and the start-up charge distinguishes between ‘hot’, ‘warm’ and ‘cold’ starts15.
In discussions with SCC, we have been advised that the MGEA provision is not taken into account in dispatching decisions—it is treated as if it represents a fixed cost in the same way as the capacity charge under the PPAs with CCGTs. This would be the correct economic approach given that MGEA is paid for whether used or not.
Allowing for this, our observation here is that the PPAs applied to the CCGTs still appear more efficient than those for the reciprocating engine IPPs. They remove the MGEA and replace it with a capacity charge, which achieves a similar purpose but make the fixed nature of this cost clearer. And the structure of energy charges including stop and start charges better reflects the actual cost structure of the generators. This should result in more efficient dispatching where this is based on PPA prices.
It is not clear to us why the reciprocating engine PPAs apply what appears to be a less efficient structure than those for the CCGTs. We are also not able to determine from the PPAs why the decision was originally taken to include an MGEA clause. It may be that this reflects obligations under the Fuel Supply Agreements (FSA) for these generators to receive a given quantity in fuel each month or pay penalties. We have not seen copies of the FSAs for the reciprocating engine IPPs and so cannot confirm whether this is the case. However, we would think it unlikely given that these generators are burning liquid fuels which are relatively easy to procure, transport and store.
15 Defined by the elapsed time since shut-down. The fuel requirements and costs of starting-up increase the longer a generator has been shut-down.
Electricity Supply Chain Analysis and Proposals for Revamping
FINAL REPORT
Power Purchase Agreements
40
5.1.3 Mismatches in heat rates
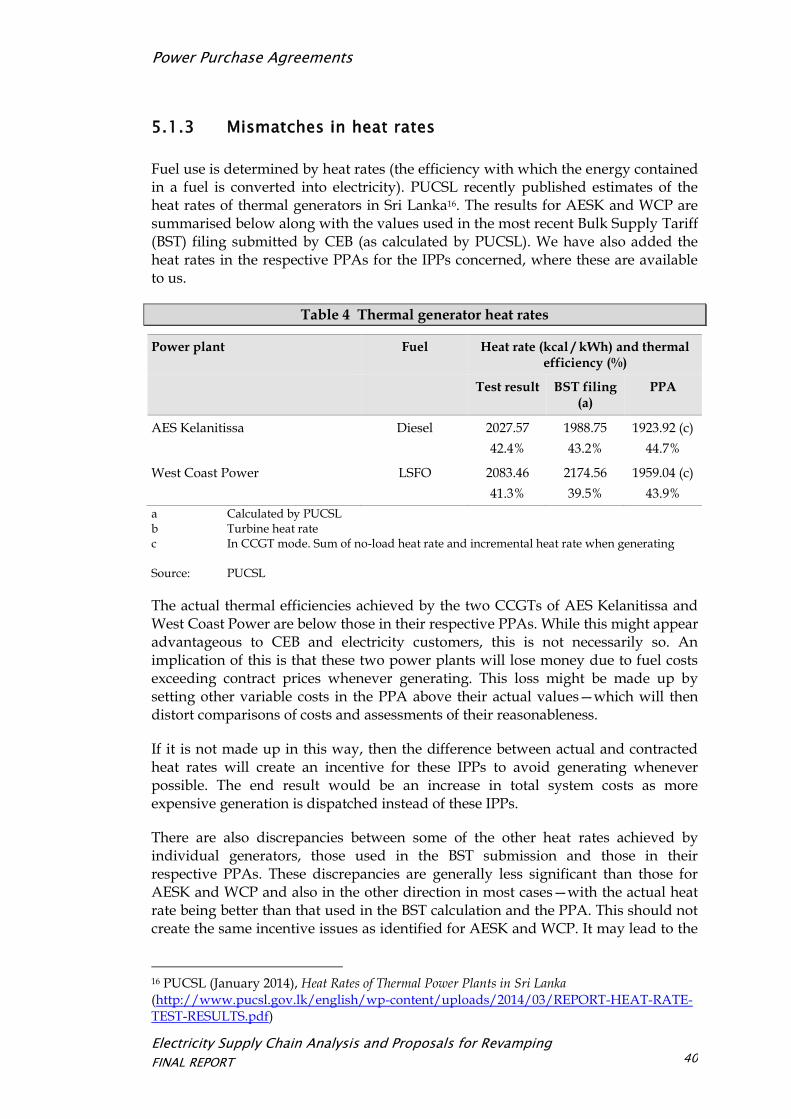
Fuel use is determined by heat rates (the efficiency with which the energy contained in a fuel is converted into electricity). PUCSL recently published estimates of the heat rates of thermal generators in Sri Lanka16. The results for AESK and WCP are summarised below along with the values used in the most recent Bulk Supply Tariff (BST) filing submitted by CEB (as calculated by PUCSL). We have also added the heat rates in the respective PPAs for the IPPs concerned, where these are available to us.
Table 4 Thermal generator heat rates
Power plant Fuel Heat rate (kcal / kWh) and thermal efficiency (%)
Test result BST filing (a)
PPA
AES Kelanitissa Diesel 2027.57
42.4%
1988.75
43.2%
1923.92 (c)
44.7%
West Coast Power LSFO 2083.46
41.3%
2174.56
39.5%
1959.04 (c)
43.9%
a Calculated by PUCSL b Turbine heat rate c In CCGT mode. Sum of no-load heat rate and incremental heat rate when generating Source: PUCSL
The actual thermal efficiencies achieved by the two CCGTs of AES Kelanitissa and West Coast Power are below those in their respective PPAs. While this might appear advantageous to CEB and electricity customers, this is not necessarily so. An implication of this is that these two power plants will lose money due to fuel costs exceeding contract prices whenever generating. This loss might be made up by setting other variable costs in the PPA above their actual values—which will then distort comparisons of costs and assessments of their reasonableness.
If it is not made up in this way, then the difference between actual and contracted heat rates will create an incentive for these IPPs to avoid generating whenever possible. The end result would be an increase in total system costs as more expensive generation is dispatched instead of these IPPs.
There are also discrepancies between some of the other heat rates achieved by individual generators, those used in the BST submission and those in their respective PPAs. These discrepancies are generally less significant than those for AESK and WCP and also in the other direction in most cases—with the actual heat rate being better than that used in the BST calculation and the PPA. This should not create the same incentive issues as identified for AESK and WCP. It may lead to the
16 PUCSL (January 2014), Heat Rates of Thermal Power Plants in Sri Lanka (http://www.pucsl.gov.lk/english/wp-content/uploads/2014/03/REPORT-HEAT-RATE-TEST-RESULTS.pdf)
Electricity Supply Chain Analysis and Proposals for Revamping
FINAL REPORT
Power Purchase Agreements
41
BST calculation overstating actual fuel costs but this should be corrected for through the BSTA, assuming this is being applied (see earlier discussion in Section 4).
5.2 Recommendations
Procurement of IPPs
The WCP experience strongly suggests that future IPPs should only be procured through a competitive tendering process. This is a means of providing confidence that the resulting prices are least-cost.
PUCSL should, therefore, require competitive tendering for all future PPAs if it is to allow their costs to be passed through into tariffs. This could be enforced by PUCSL adopting a reference price for new IPPs as a means of setting a cap on PPA prices to be passed through to tariffs. PPA prices in excess of this reference value would only be accepted if they result from a competitive tendering process.
A reference price of this nature could be calculated either with respect to PUCSL’s estimate of the costs of an efficient new generator of the same technology and fuel or with reference to the long-run marginal cost of generation in Sri Lanka (with the implication being that this represents an upper limit on the value of new IPPs to the country).
Structure of PPAs
While the impacts of the structure of existing reciprocating engine PPAs on dispatching decisions appears to be limited, we recommend that future PPAs should avoid the use of ‘free’ starts and stops and MGEA provisions. This should lead to pricing structures that better reflect the costs of the generators concerned.
Mismatches in heat rates
We do not recommend any unilateral amendment of existing PPAs—these are contracts which should be respected. However, this does not prevent mutually beneficial amendments where both parties agree.
Given this, we do recommend that PUCSL encourage CEB to negotiate with AESK and WCP on amendments to their existing PPAs to bring these the heat rates used to calculate fuel charges paid under the PPA into line with actual heat rates achieved. This should address the incentive problems identified. This change would increase fuel charges and some form of compensating offset would need to be sought—for example, through a reduction in capacity charges.
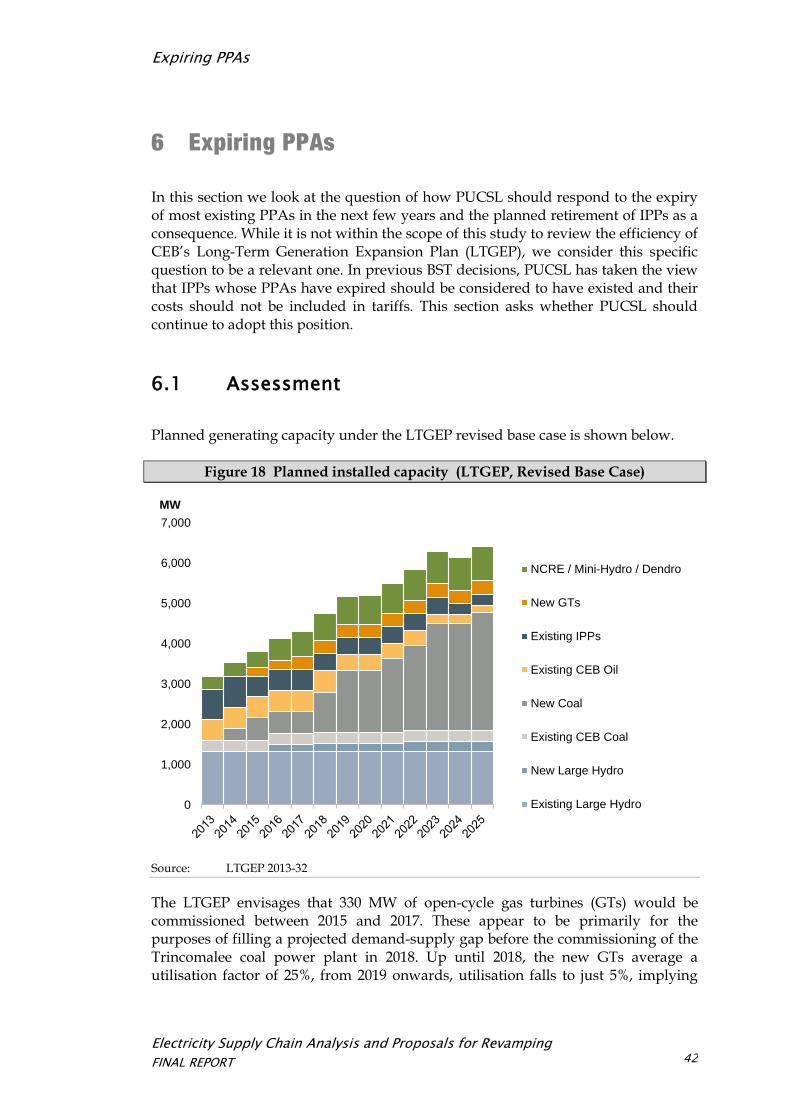
Electricity Supply Chain Analysis and Proposals for Revamping
FINAL REPORT
Expiring PPAs
42
6 Expiring PPAs
In this section we look at the question of how PUCSL should respond to the expiry of most existing PPAs in the next few years and the planned retirement of IPPs as a consequence. While it is not within the scope of this study to review the efficiency of CEB’s Long-Term Generation Expansion Plan (LTGEP), we consider this specific question to be a relevant one. In previous BST decisions, PUCSL has taken the view that IPPs whose PPAs have expired should be considered to have existed and their costs should not be included in tariffs. This section asks whether PUCSL should continue to adopt this position.
6.1 Assessment
Planned generating capacity under the LTGEP revised base case is shown below.
Figure 18 Planned installed capacity (LTGEP, Revised Base Case)
Source: LTGEP 2013-32
The LTGEP envisages that 330 MW of open-cycle gas turbines (GTs) would be commissioned between 2015 and 2017. These appear to be primarily for the purposes of filling a projected demand-supply gap before the commissioning of the Trincomalee coal power plant in 2018. Up until 2018, the new GTs average a utilisation factor of 25%, from 2019 onwards, utilisation falls to just 5%, implying
0
1,000
2,000
3,000
4,000
5,000
6,000
7,000
MW
NCRE / Mini-Hydro / Dendro
New GTs
Existing IPPs
Existing CEB Oil
New Coal
Existing CEB Coal
New Large Hydro
Existing Large Hydro
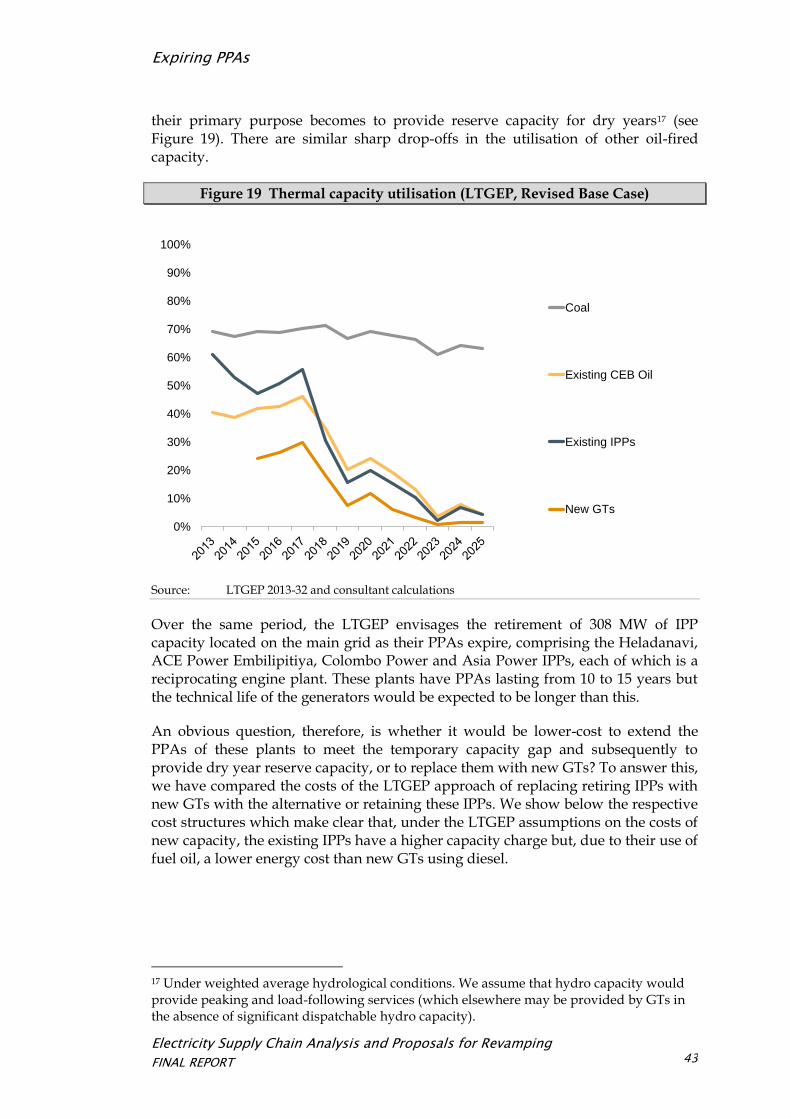
Electricity Supply Chain Analysis and Proposals for Revamping
FINAL REPORT
Expiring PPAs
43
their primary purpose becomes to provide reserve capacity for dry years17 (see Figure 19). There are similar sharp drop-offs in the utilisation of other oil-fired capacity.
Figure 19 Thermal capacity utilisation (LTGEP, Revised Base Case)
Source: LTGEP 2013-32 and consultant calculations
Over the same period, the LTGEP envisages the retirement of 308 MW of IPP capacity located on the main grid as their PPAs expire, comprising the Heladanavi, ACE Power Embilipitiya, Colombo Power and Asia Power IPPs, each of which is a reciprocating engine plant. These plants have PPAs lasting from 10 to 15 years but the technical life of the generators would be expected to be longer than this.
An obvious question, therefore, is whether it would be lower-cost to extend the PPAs of these plants to meet the temporary capacity gap and subsequently to provide dry year reserve capacity, or to replace them with new GTs? To answer this, we have compared the costs of the LTGEP approach of replacing retiring IPPs with new GTs with the alternative or retaining these IPPs. We show below the respective cost structures which make clear that, under the LTGEP assumptions on the costs of new capacity, the existing IPPs have a higher capacity charge but, due to their use of fuel oil, a lower energy cost than new GTs using diesel.
17 Under weighted average hydrological conditions. We assume that hydro capacity would provide peaking and load-following services (which elsewhere may be provided by GTs in the absence of significant dispatchable hydro capacity).
0%
10%
20%
30%
40%
50%
60%
70%
80%
90%
100%
Coal
Existing CEB Oil
Existing IPPs
New GTs
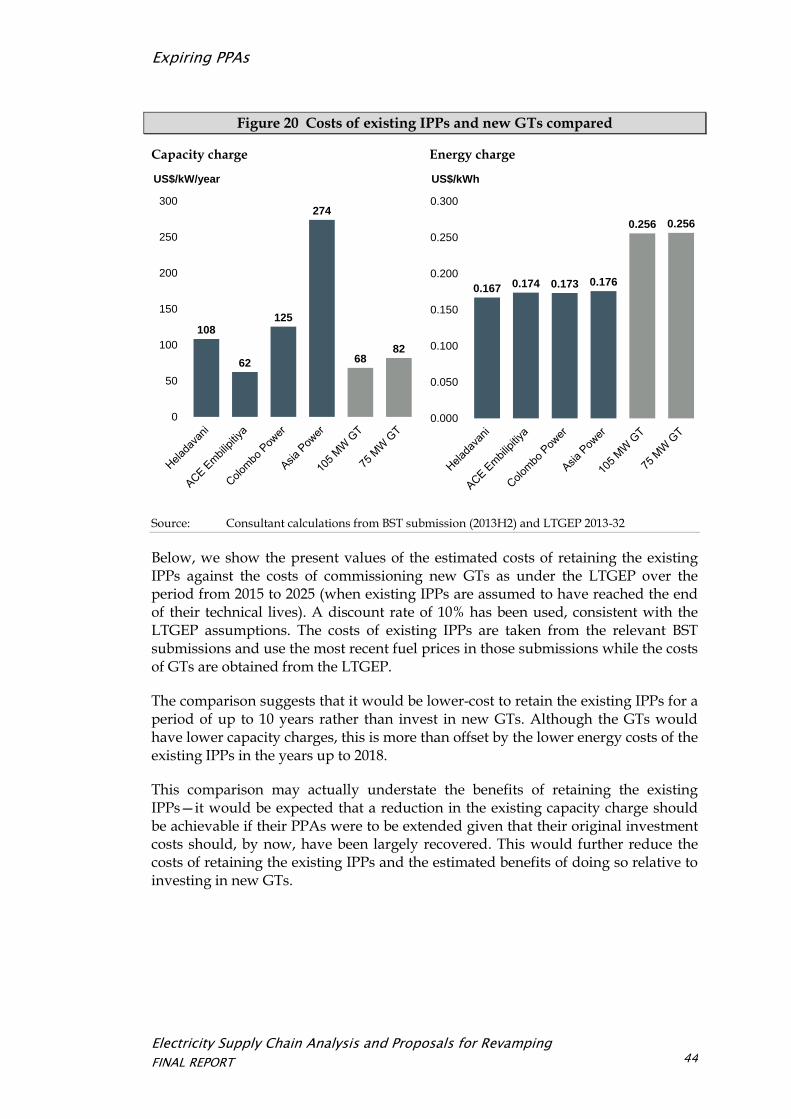
Electricity Supply Chain Analysis and Proposals for Revamping
FINAL REPORT
Expiring PPAs
44
Figure 20 Costs of existing IPPs and new GTs compared
Capacity charge Energy charge
Source: Consultant calculations from BST submission (2013H2) and LTGEP 2013-32
Below, we show the present values of the estimated costs of retaining the existing IPPs against the costs of commissioning new GTs as under the LTGEP over the period from 2015 to 2025 (when existing IPPs are assumed to have reached the end of their technical lives). A discount rate of 10% has been used, consistent with the LTGEP assumptions. The costs of existing IPPs are taken from the relevant BST submissions and use the most recent fuel prices in those submissions while the costs of GTs are obtained from the LTGEP.
The comparison suggests that it would be lower-cost to retain the existing IPPs for a period of up to 10 years rather than invest in new GTs. Although the GTs would have lower capacity charges, this is more than offset by the lower energy costs of the existing IPPs in the years up to 2018.
This comparison may actually understate the benefits of retaining the existing IPPs—it would be expected that a reduction in the existing capacity charge should be achievable if their PPAs were to be extended given that their original investment costs should, by now, have been largely recovered. This would further reduce the costs of retaining the existing IPPs and the estimated benefits of doing so relative to investing in new GTs.
108
62
125
274
68 82
0
50
100
150
200
250
300
US$/kW/year
0.167 0.174 0.173 0.176
0.256 0.256
0.000
0.050
0.100
0.150
0.200
0.250
0.300
US$/kWh

Electricity Supply Chain Analysis and Proposals for Revamping
FINAL REPORT
Expiring PPAs
45
Figure 21 Costs of retainig IPPs against investing in GTs
US$m
present value @ 10% (2015-25)
LTGEP Alternative
IPPs 179.8 789.6
GTs 760.5 0.0
Total 940.3 798.6
LTGEP costs (IPPs and GTs only)
Alternative costs (IPPs and GTs only)
Source: Consultant calculations
As well as appearing lower-cost, retaining existing IPPs also offers advantages in terms of flexibility. It should be possible to offer relatively short-term PPA extensions, for example, of five years at a time. This allows decisions to be taken at the end of this period whether to further extend these PPAs or to let them expire. This gives the option to reduce capacity if demand projections prove to be overly-
0
50
100
150
200
250
300
350
US$ million
GT Energy
GT Capacity
IPP Energy
IPP Capacity
0
50
100
150
200
250
300
350
US$ million
GT Capacity
GT Energy
IPP Energy
IPP Capacity
Electricity Supply Chain Analysis and Proposals for Revamping
FINAL REPORT
Expiring PPAs
46
high whereas constructing new GTs runs the risk of locking-in excess capacity for an extended period.
6.2 Recommendations
In general, PUCSL should adopt a policy that, prior to the expiry of any existing PPA, an assessment is to be conducted as to whether future system costs can be lowered by extending that PPA rather than constructing new generating capacity.
Specifically, PUCSL should require CEB to provide an assessment of the relative costs and benefits of retaining the existing reciprocating engine IPPs for a number of years instead of commissioning new GTs as under the LTGEP. As part of this, CEB should investigate with the IPPs what reductions in PPA prices they would be willing to accept in return for such an extension.
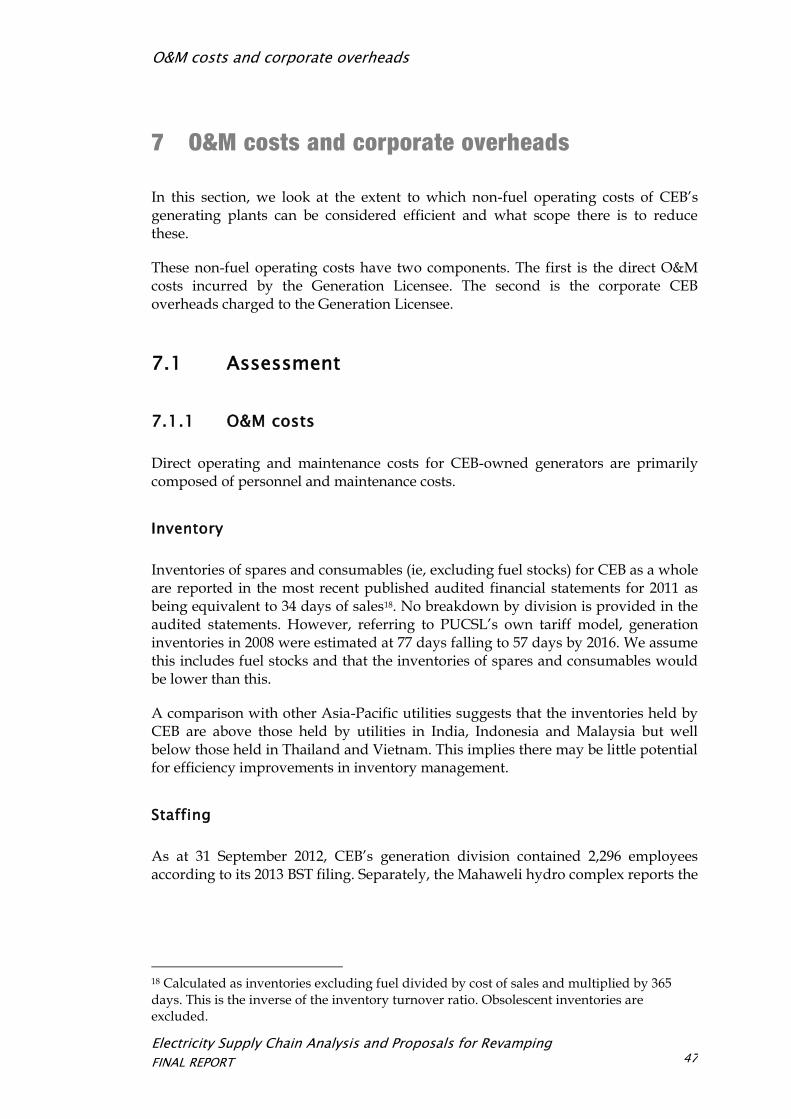
Electricity Supply Chain Analysis and Proposals for Revamping
FINAL REPORT
O&M costs and corporate overheads
47
7 O&M costs and corporate overheads
In this section, we look at the extent to which non-fuel operating costs of CEB’s generating plants can be considered efficient and what scope there is to reduce these.
These non-fuel operating costs have two components. The first is the direct O&M costs incurred by the Generation Licensee. The second is the corporate CEB overheads charged to the Generation Licensee.
7.1 Assessment
7.1.1 O&M costs
Direct operating and maintenance costs for CEB-owned generators are primarily composed of personnel and maintenance costs.
Inventory
Inventories of spares and consumables (ie, excluding fuel stocks) for CEB as a whole are reported in the most recent published audited financial statements for 2011 as being equivalent to 34 days of sales18. No breakdown by division is provided in the audited statements. However, referring to PUCSL’s own tariff model, generation inventories in 2008 were estimated at 77 days falling to 57 days by 2016. We assume this includes fuel stocks and that the inventories of spares and consumables would be lower than this.
A comparison with other Asia-Pacific utilities suggests that the inventories held by CEB are above those held by utilities in India, Indonesia and Malaysia but well below those held in Thailand and Vietnam. This implies there may be little potential for efficiency improvements in inventory management.
Staffing
As at 31 September 2012, CEB’s generation division contained 2,296 employees according to its 2013 BST filing. Separately, the Mahaweli hydro complex reports the
18 Calculated as inventories excluding fuel divided by cost of sales and multiplied by 365 days. This is the inverse of the inventory turnover ratio. Obsolescent inventories are excluded.
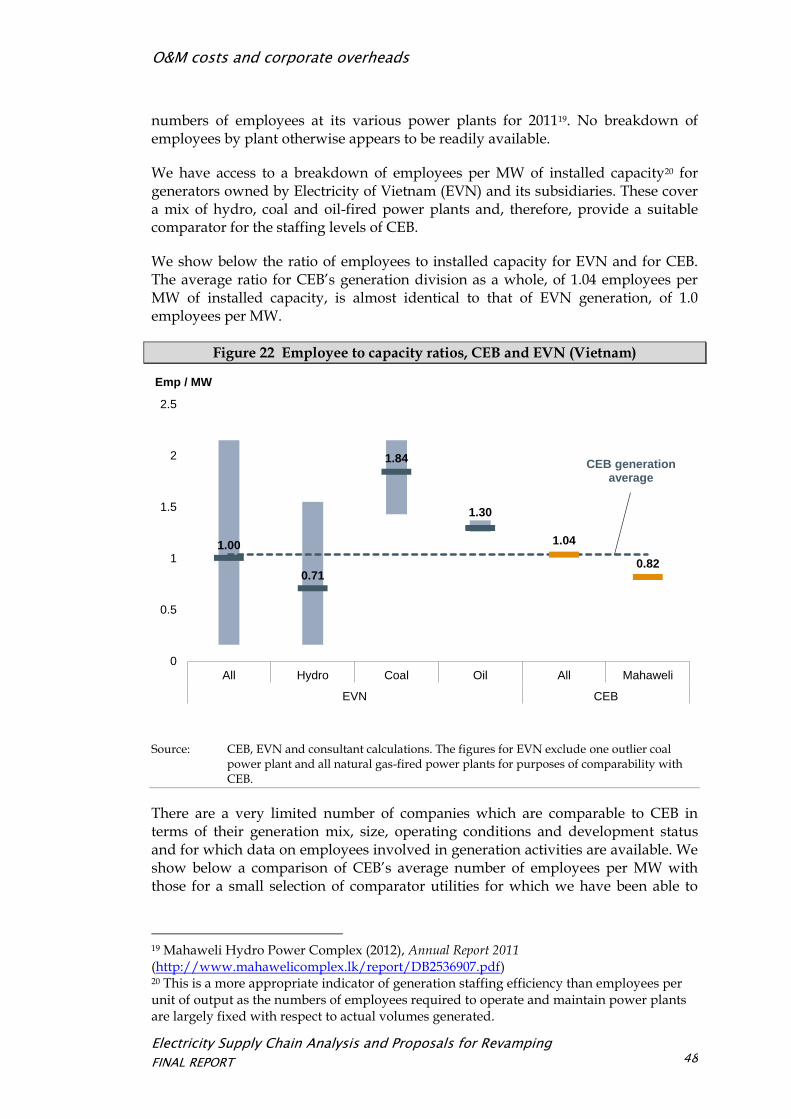
Electricity Supply Chain Analysis and Proposals for Revamping
FINAL REPORT
O&M costs and corporate overheads
48
numbers of employees at its various power plants for 201119. No breakdown of employees by plant otherwise appears to be readily available.
We have access to a breakdown of employees per MW of installed capacity20 for generators owned by Electricity of Vietnam (EVN) and its subsidiaries. These cover a mix of hydro, coal and oil-fired power plants and, therefore, provide a suitable comparator for the staffing levels of CEB.
We show below the ratio of employees to installed capacity for EVN and for CEB. The average ratio for CEB’s generation division as a whole, of 1.04 employees per MW of installed capacity, is almost identical to that of EVN generation, of 1.0 employees per MW.
Figure 22 Employee to capacity ratios, CEB and EVN (Vietnam)
Source: CEB, EVN and consultant calculations. The figures for EVN exclude one outlier coal power plant and all natural gas-fired power plants for purposes of comparability with CEB.
There are a very limited number of companies which are comparable to CEB in terms of their generation mix, size, operating conditions and development status and for which data on employees involved in generation activities are available. We show below a comparison of CEB’s average number of employees per MW with those for a small selection of comparator utilities for which we have been able to
19 Mahaweli Hydro Power Complex (2012), Annual Report 2011 (http://www.mahawelicomplex.lk/report/DB2536907.pdf) 20 This is a more appropriate indicator of generation staffing efficiency than employees per unit of output as the numbers of employees required to operate and maintain power plants are largely fixed with respect to actual volumes generated.
1.00
0.71
1.84
1.30
1.04
0.82
0
0.5
1
1.5
2
2.5
All Hydro Coal Oil All Mahaweli
EVN CEB
Emp / MW
CEB generation average
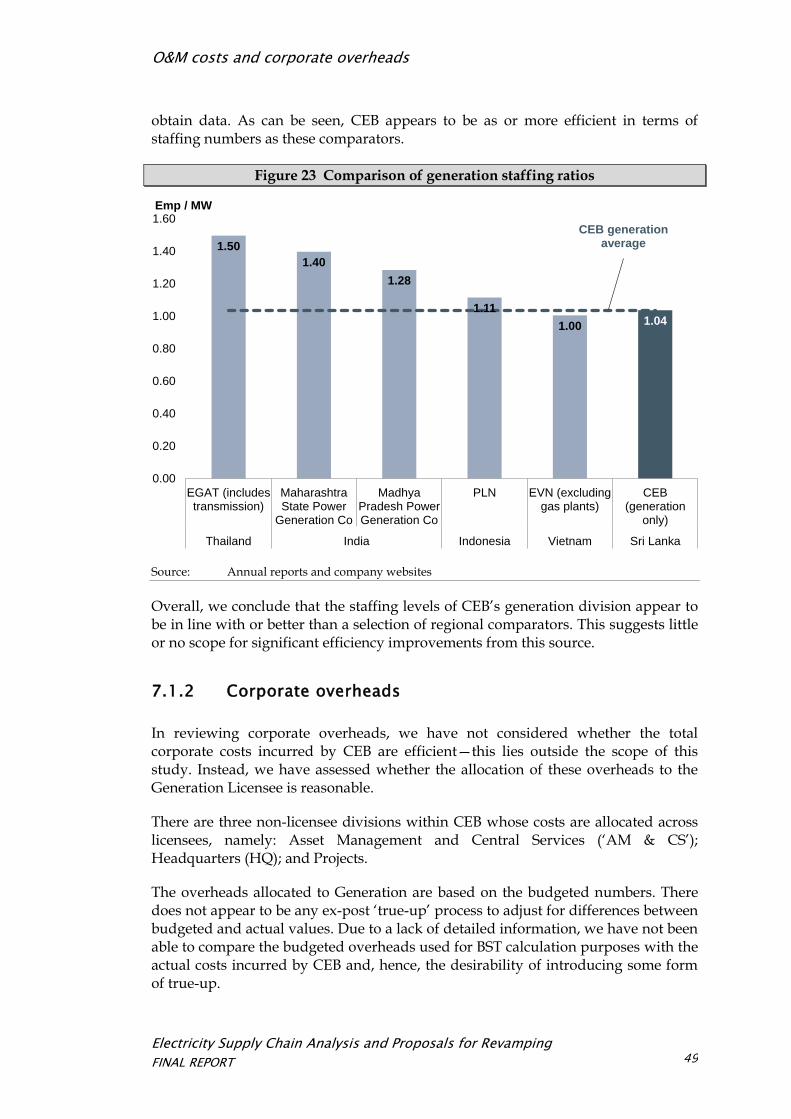
Electricity Supply Chain Analysis and Proposals for Revamping
FINAL REPORT
O&M costs and corporate overheads
49
obtain data. As can be seen, CEB appears to be as or more efficient in terms of staffing numbers as these comparators.
Figure 23 Comparison of generation staffing ratios
Source: Annual reports and company websites
Overall, we conclude that the staffing levels of CEB’s generation division appear to be in line with or better than a selection of regional comparators. This suggests little or no scope for significant efficiency improvements from this source.
7.1.2 Corporate overheads
In reviewing corporate overheads, we have not considered whether the total corporate costs incurred by CEB are efficient—this lies outside the scope of this study. Instead, we have assessed whether the allocation of these overheads to the Generation Licensee is reasonable.
There are three non-licensee divisions within CEB whose costs are allocated across licensees, namely: Asset Management and Central Services (‘AM & CS’); Headquarters (HQ); and Projects.
The overheads allocated to Generation are based on the budgeted numbers. There does not appear to be any ex-post ‘true-up’ process to adjust for differences between budgeted and actual values. Due to a lack of detailed information, we have not been able to compare the budgeted overheads used for BST calculation purposes with the actual costs incurred by CEB and, hence, the desirability of introducing some form of true-up.
1.50
1.40
1.28
1.11
1.00 1.04
0.00
0.20
0.40
0.60
0.80
1.00
1.20
1.40
1.60
EGAT (includestransmission)
MaharashtraState Power
Generation Co
MadhyaPradesh PowerGeneration Co
PLN EVN (excludinggas plants)
CEB(generation
only)
Thailand India Indonesia Vietnam Sri Lanka
Emp / MW
CEB generation average
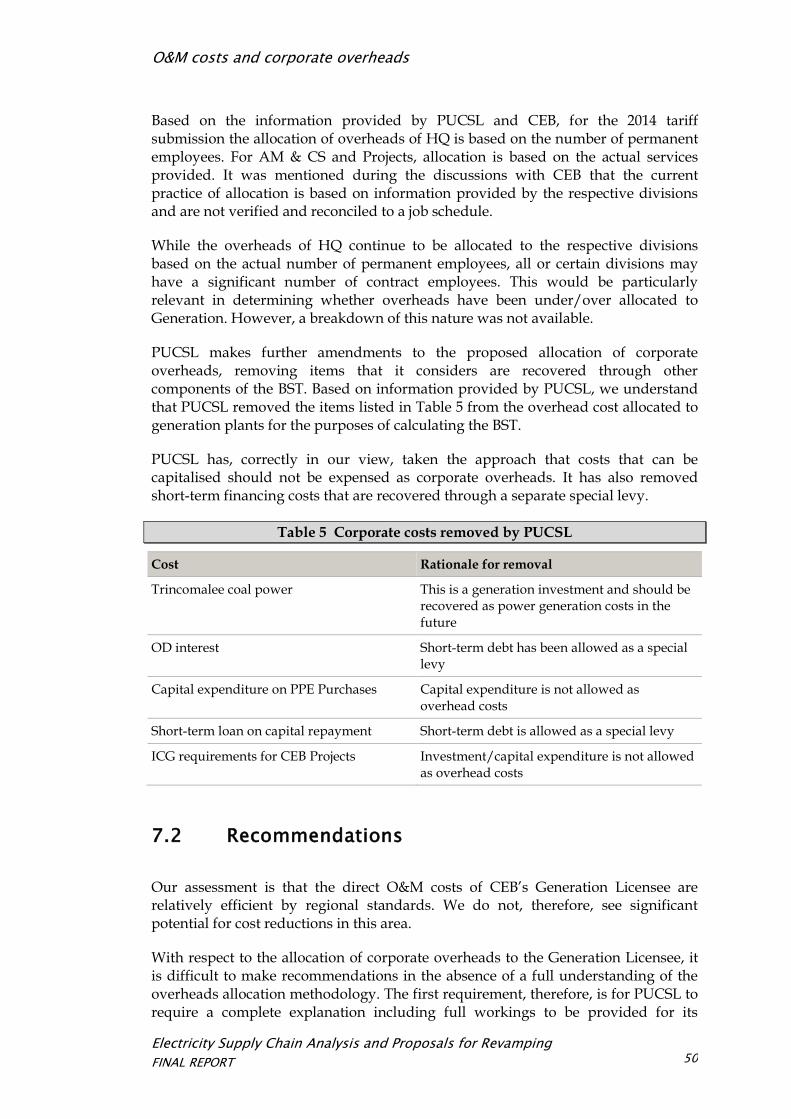
Electricity Supply Chain Analysis and Proposals for Revamping
FINAL REPORT
O&M costs and corporate overheads
50
Based on the information provided by PUCSL and CEB, for the 2014 tariff submission the allocation of overheads of HQ is based on the number of permanent employees. For AM & CS and Projects, allocation is based on the actual services provided. It was mentioned during the discussions with CEB that the current practice of allocation is based on information provided by the respective divisions and are not verified and reconciled to a job schedule.
While the overheads of HQ continue to be allocated to the respective divisions based on the actual number of permanent employees, all or certain divisions may have a significant number of contract employees. This would be particularly relevant in determining whether overheads have been under/over allocated to Generation. However, a breakdown of this nature was not available.
PUCSL makes further amendments to the proposed allocation of corporate overheads, removing items that it considers are recovered through other components of the BST. Based on information provided by PUCSL, we understand that PUCSL removed the items listed in Table 5 from the overhead cost allocated to generation plants for the purposes of calculating the BST.
PUCSL has, correctly in our view, taken the approach that costs that can be capitalised should not be expensed as corporate overheads. It has also removed short-term financing costs that are recovered through a separate special levy.
Table 5 Corporate costs removed by PUCSL
Cost Rationale for removal
Trincomalee coal power This is a generation investment and should be recovered as power generation costs in the future
OD interest Short-term debt has been allowed as a special levy
Capital expenditure on PPE Purchases Capital expenditure is not allowed as overhead costs
Short-term loan on capital repayment Short-term debt is allowed as a special levy
ICG requirements for CEB Projects Investment/capital expenditure is not allowed as overhead costs
7.2 Recommendations
Our assessment is that the direct O&M costs of CEB’s Generation Licensee are relatively efficient by regional standards. We do not, therefore, see significant potential for cost reductions in this area.
With respect to the allocation of corporate overheads to the Generation Licensee, it is difficult to make recommendations in the absence of a full understanding of the overheads allocation methodology. The first requirement, therefore, is for PUCSL to require a complete explanation including full workings to be provided for its

Electricity Supply Chain Analysis and Proposals for Revamping
FINAL REPORT
O&M costs and corporate overheads
51
review. CEB has noted that it is seeking guidance in this regard from PUCSL in the form of regulatory accounting guidelines. We understand that the issue of these guidelines has been delayed but that PUCSL is expected to commission a consultancy to prepare them in the very near-future.
Electricity Supply Chain Analysis and Proposals for Revamping
FINAL REPORT
Financing costs
52
8 Financing costs
Currently, CEB’s Generation Licensee does not incur costs related to the servicing of long-term loans used for investment. Debt service has been suspended by the Treasury in order to reduce the industry’s costs. The intention is to resume debt service once the share of coal-fired generation increases sufficiently to reduce generation costs from their current levels. In this section, we consider the appropriateness of the existing methodology for recovering these financing costs when they resume.
8.1 Assessment
The current tariff methodology allows recovery of cash debt service costs (principal repayment and interest). All debt associated with the Generation Licensee takes the form of sovereign loans onlent to CEB. Currently, as part of measures to reduce electricity tariffs, debt service on these loans from CEB to the Treasury has been suspended. The intention is to resume this when the introduction of additional coal-fired capacity has allowed a reduction in fuel costs.
A major concern with this approach is that it assumes all new investment is entirely debt-financed. This is unlikely to be realistic—particularly for smaller investment projects. It means that CEB’s Generation division is, in principle, only just covering its cash costs in each year. As a consequence, it is unable to build up cash reserves leaving it vulnerable to adverse shocks. This will also tend to force it to rely on short-term loans and delays in paying suppliers to provide working capital. In the longer-term, this will significantly reduce the ability of CEB to move away from sovereign debt to commercial debt to fund its operations—even though this is likely to be desirable to overcome limits on sovereign debt availability.
In its BST decisions, PUCSL has recognised these problems and sought to overcome them by introducing the concept of a ‘return on equity’ set at 20% and included in allowed costs. This is calculated as the estimated share of equity in investment financing for the Generation division multiplied by the projected depreciation of the division’s assets as shown in the tariff and transfer pricing model prepared for PUCSL in 2010.
A possible further development would be to move to allowing a return on the value of the Generation division’s actual equity rather than using projected depreciation as a proxy. Ultimately, there could be a move away from a cash-based regime to one where the Generation division receives a depreciation allowance and a return on assets and is then able to select the best financing mix commensurate with these revenues.
Such a change raises obvious concerns over the potential impacts on both tariffs, as a new element, a return on equity, is introduced into allowed costs and on the ability of the Generation division to finance new projects, as the cash flows
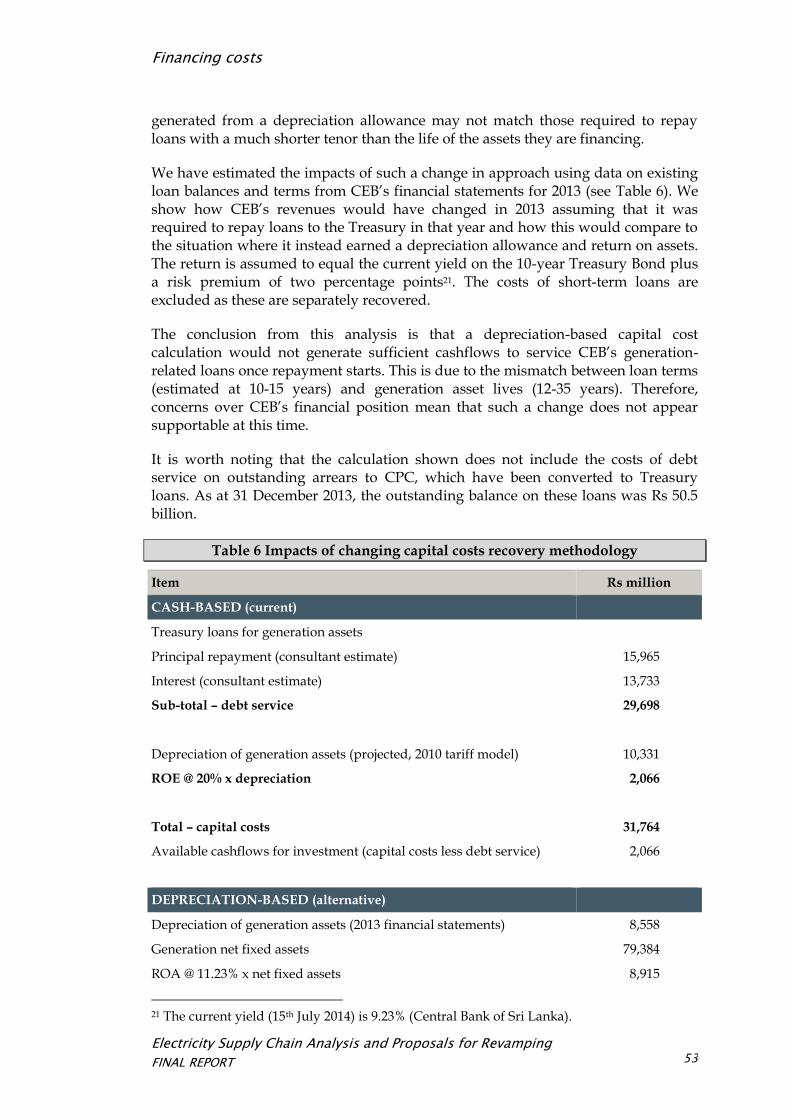
Electricity Supply Chain Analysis and Proposals for Revamping
FINAL REPORT
Financing costs
53
generated from a depreciation allowance may not match those required to repay loans with a much shorter tenor than the life of the assets they are financing.
We have estimated the impacts of such a change in approach using data on existing loan balances and terms from CEB’s financial statements for 2013 (see Table 6). We show how CEB’s revenues would have changed in 2013 assuming that it was required to repay loans to the Treasury in that year and how this would compare to the situation where it instead earned a depreciation allowance and return on assets. The return is assumed to equal the current yield on the 10-year Treasury Bond plus a risk premium of two percentage points21. The costs of short-term loans are excluded as these are separately recovered.
The conclusion from this analysis is that a depreciation-based capital cost calculation would not generate sufficient cashflows to service CEB’s generation-related loans once repayment starts. This is due to the mismatch between loan terms (estimated at 10-15 years) and generation asset lives (12-35 years). Therefore, concerns over CEB’s financial position mean that such a change does not appear supportable at this time.
It is worth noting that the calculation shown does not include the costs of debt service on outstanding arrears to CPC, which have been converted to Treasury loans. As at 31 December 2013, the outstanding balance on these loans was Rs 50.5 billion.
Table 6 Impacts of changing capital costs recovery methodology
Item Rs million
CASH-BASED (current)
Treasury loans for generation assets
Principal repayment (consultant estimate) 15,965
Interest (consultant estimate) 13,733
Sub-total – debt service 29,698
Depreciation of generation assets (projected, 2010 tariff model) 10,331
ROE @ 20% x depreciation 2,066
Total – capital costs 31,764
Available cashflows for investment (capital costs less debt service) 2,066
DEPRECIATION-BASED (alternative)
Depreciation of generation assets (2013 financial statements) 8,558
Generation net fixed assets 79,384
ROA @ 11.23% x net fixed assets 8,915
21 The current yield (15th July 2014) is 9.23% (Central Bank of Sri Lanka).
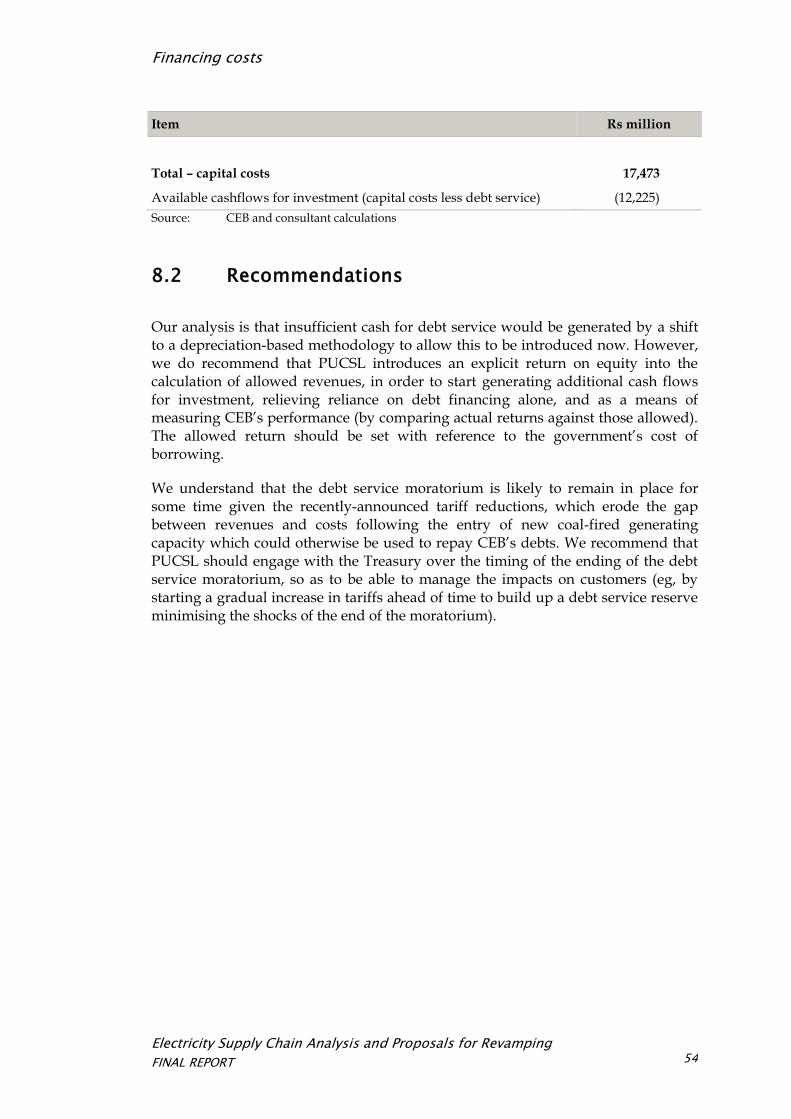
Electricity Supply Chain Analysis and Proposals for Revamping
FINAL REPORT
Financing costs
54
Item Rs million
Total – capital costs 17,473
Available cashflows for investment (capital costs less debt service) (12,225)
Source: CEB and consultant calculations
8.2 Recommendations
Our analysis is that insufficient cash for debt service would be generated by a shift to a depreciation-based methodology to allow this to be introduced now. However, we do recommend that PUCSL introduces an explicit return on equity into the calculation of allowed revenues, in order to start generating additional cash flows for investment, relieving reliance on debt financing alone, and as a means of measuring CEB’s performance (by comparing actual returns against those allowed). The allowed return should be set with reference to the government’s cost of borrowing.
We understand that the debt service moratorium is likely to remain in place for some time given the recently-announced tariff reductions, which erode the gap between revenues and costs following the entry of new coal-fired generating capacity which could otherwise be used to repay CEB’s debts. We recommend that PUCSL should engage with the Treasury over the timing of the ending of the debt service moratorium, so as to be able to manage the impacts on customers (eg, by starting a gradual increase in tariffs ahead of time to build up a debt service reserve minimising the shocks of the end of the moratorium).
Electricity Supply Chain Analysis and Proposals for Revamping
FINAL REPORT
Subsidy policy
55
9 Subsidy policy
Government policy on subsidising the electricity industry lies outside the scope of this study. However, those policies do have impacts on the efficiency and costs of electricity generation as we have noted at points in this report. In this section, therefore, we provide comments on the application of subsidies in Sri Lanka’s electricity industry.
At present, there are three main subsidy mechanisms which we have identified, as follows.
Moratorium on debt service
The moratorium on debt service represents a ‘hidden’ subsidy, in that it does not involve any explicit cash transfers. However, it still has similar effects in that it transfers responsibility for paying debt service from electricity customers to the Treasury (ie, taxpayers) for the period of time that the moratorium is in effect.
In general, such hidden subsidies are not economically desirable. They make it difficult to assess the scale of subsidies and to allow analysis of the costs of these relative to the benefits delivered.
With respect to the debt service moratorium, we also note that this may prove difficult to remove in future. While the expectation is that the large-scale entry of coal-fired generation will lower electricity costs sufficiently to provide the necessary ‘space’ to resume debt service, this assumes that new coal generation commission as expected and that current cost differentials between coal and oil products persist. There may also be difficulties in explaining to customers why the entry of coal-fired generation has not immediately led to large falls in electricity tariffs given that awareness of the current moratorium is unlikely to be widespread. We have recommended in this report that PUCSL begin a dialogue with the Treasury now over the timing and speed of the ending of the moratorium and prepare for this to avoid shocks and customer dissatisfaction.
Regulated fuel prices
The last round of oil product price increases raised these to what we estimate to be near-parity with world market prices. Prior to this, regulated prices charged by CPC to CEB were below world levels representing a substantial subsidy to the electricity industry.
This is another hidden subsidy in that the costs initially fall on CPC, which makes a loss on its sales and ultimately can face serious financial difficulties. It can also, as we have noted, introduce distortions into the dispatching of generation which increase costs to Sri Lanka.
Electricity Supply Chain Analysis and Proposals for Revamping
FINAL REPORT
Subsidy policy
56
We have recommended that PUCSL advocate for a move to market-based pricing of fuels for electricity generation.
Cross-subsidies
In Section 2.4, we have highlighted the significance of cross-subsidies in Sri Lanka. Such cross-subsidies do not directly change the costs or revenues of the industry22. However, they do contribute to the high levels of tariffs for larger consumers and non-residential consumers which are a matter of concern.
Policies on subsidising electricity use by low-income households lie outside out scope. However, it is generally recommended that such subsidies are better delivered by cash transfers from the national budget rather than through cross-subsidies in electricity tariffs. This reduces the resulting distortions by increasing the size of the base from which funding for subsidies is collected. It also avoids penalising larger consumers and, in particular, industrial and commercial consumers, at a time when high electricity tariffs are seen as a major barrier to economic growth.
22 Indirectly, cross-subsidies may increase costs. They lead to increased consumption by small consumers who generally cost more to supply due to the loss of economies of scale and their often remote locations while reducing consumption by larger consumers.
Electricity Supply Chain Analysis and Proposals for Revamping
FINAL REPORT
Summary
57
10 Summary
In this concluding section, we summarise the recommendations from the preceding sections. These are organized by section.
Operational planning and dispatch
Our assessment is that there are no significant deviations between expected utilization based on the merit order and actual utilization that cannot be explained by external factors. However, it still remains possible to improve the efficiency of the operational planning and dispatch process.
Data management infrastructure. The existing SCADA system should be expanded to cover the full system and EMS added. A central electronic database should be established and SCC’s forecasting and modelling tools linked to this. SCC should also establish a web portal as a means of sharing data with licensees and with stakeholders.
Software. The existing planning software needs to be supplemented or replaced with models able to fully capture all constraints and operating features of generators on the system. SCC should also purchase software for forecasting load and water inflows.
Procedures. SCC should fully document its planning and dispatching procedures in writing. The introduction of a week-ahead plan should be completed as soon as possible. SCC should also consider introducing a more formal process for planning and coordinating maintenance outages through the use of a Projected Assessment of System Adequacy (PASA). The current process of auditing actual against forecast outcomes should be extended to include medium and long-term planning (of particular importance with respect to load forecasting).
Methodologies. SCC should take responsibility for preparing its own load forecasts. SCC should also prepare day-ahead forecasts rather than relying on actual load in recent days. SCC should also make greater use of its own forecasts for short-term operational planning, To assist in this, it should subscribe to professional weather forecasting services. SCC needs to consider the potential for relaxing spinning reserve requirements as a means of reducing costs. The existing three cases used for year-ahead and month-ahead planning should be modified to a set of probability-based scenarios plus additional scenarios.
We have provided a detailed analysis of the issues identified and recommended solutions in a separate appendix to this report, which has been made available to PUCSL and SCC.
Electricity Supply Chain Analysis and Proposals for Revamping
FINAL REPORT
Summary
58
Fuel costs
PUCSL should advocate for the introduction of market-based pricing for oil products. As and when PUCSL’s powers are expanded to include the petroleum industry23, it should look to introduce such pricing. A move to market-based pricing would address the concerns over financing subsidies and inefficiencies in dispatch.
In the shorter-term, PUCSL should also give consideration to publishing information how tariffs would differ if market fuel prices rather than the regulated prices were applied as a means of increasing awareness of the level of subsidies provided through this mechanism.
We have noted that it is difficult to understand the relationship between coal prices as reported by CEB in its BST submissions and movements of the relevant international benchmark. We recommend that PUCSL require CEB to provide the actual prices paid for the preceding 24 months and details of their calculation and how the prices in BST submissions were derived in order to better understand this relationship and to assess the adequacy of CEB’s projections of prices in its BST submissions.
The next coal supply agreement is to be competitively tendered. PUCSL should require details of the proposed agreement and tendering procedure to be provided for advance approval.
The BSTA should be put into effect in order to manage divergences between actual fuel costs and those included in the approved BST. If this is not possible, then consideration should be given to explicitly indexing the fuel cost component of the BST to world market fuel prices to avoid significant mismatches emerging, to the detriment of customers and CEB.
Power Purchase Agreements
PUCSL should require competitive tendering for all future PPAs if it is to allow their costs to be passed through into tariffs. This could be enforced by PUCSL adopting a reference price for new IPPs as a means of setting a cap on PPA prices to be passed through to tariffs. PPA prices in excess of this reference value would only be accepted if they result from a competitive tendering process.
While the impacts of the structure of existing reciprocating engine PPAs on dispatching decisions appears to be limited, we recommend that future PPAs should avoid the use of ‘free’ starts and stops and MGEA
23 PUCSL has the responsibility to regulate the downstream petroleum industry but has not, as yet, been empowered to do so.
Electricity Supply Chain Analysis and Proposals for Revamping
FINAL REPORT
Summary
59
provisions. This should lead to pricing structures that better reflect the costs of the generators concerned.
PUCSL should encourage CEB to negotiate with AESK and WCP on amendments to their existing PPAs to bring these the heat rates used to calculate fuel charges paid under the PPA into line with actual heat rates achieved. This should address the incentive problems identified. This change would increase fuel charges and some form of compensating offset would need to be sought—for example, through a reduction in capacity charges.
Expiring PPAs
PUCSL should adopt a policy that, prior to the expiry of any existing PPA, an assessment is to be conducted as to whether future system costs can be lowered by extending that PPA rather than constructing new generating capacity.
PUCSL should require CEB to provide an assessment of the relative costs and benefits of retaining the existing reciprocating engine IPPs for a number of years instead of commissioning new GTs as under the LTGEP. As part of this, CEB should investigate with the IPPs what reductions in PPA prices they would be willing to accept in return for such an extension.
O&M costs and corporate overheads
Our assessment is that the direct O&M costs of CEB’s Generation Licensee are relatively efficient by regional standards. We do not, therefore, see significant potential for cost reductions in this area.
With respect to the allocation of corporate overheads to the Generation Licensee, it is difficult to make recommendations in the absence of a full understanding of the overheads allocation methodology. The first requirement, therefore, is for PUCSL to require a complete explanation including full workings to be provided for its review.
Financing costs
Our analysis is that insufficient cash for debt service would be generated by a shift to a depreciation-based methodology to allow this to be introduced now.
We recommend that PUCSL introduces an explicit return on equity into the calculation of allowed revenues, in order to start generating additional cash flows for investment, relieving reliance on debt

Electricity Supply Chain Analysis and Proposals for Revamping
FINAL REPORT
Summary
60
financing alone, and as a means of measuring CEB’s performance (by comparing actual returns against those allowed).
We also recommend that PUCSL should engage with the Treasury over the timing of the ending of the debt service moratorium, so as to be able to manage the impacts on customers.