sri trang agro-industry sta - cyberquoteresearch.cyberquote.com.hk/page/htm/kc/share_compa… ·...
TRANSCRIPT

MICA (P) 012/01/2012 Ref. No.: SG2012_0213 1 of 13
Sri Trang Agro-Industry – STA
Economic slowdown a threat to earnings Bloomberg │ Reuters STA TB │STA.BK
Phillip Securities Research Pte Ltd 13 July 2012
Report type: Company Update
Company Overview STA is a Thailand’s biggest rubber producer and exporter. Its products include block rubber, ribbed smoked sheets (RSS), and concentrated latex. Its customers are automobile tire manufacturers and rubber glove producers.
STA is a Thailand-based producer of block rubber, ribbed smoked sheets (RSS) and concentrated latex with a global market share of 8.7%.
Global economic weakness, especially a slowdown in China, the world’s biggest rubber consumer, would crimp sales and put pressure on selling prices for commodities.
Last year earnings were dragged down by sagging rubber prices as a result of economic concerns.
Economic slowdown would continue to weigh on overall earnings performance this year.
We rate STA shares a ‘NEUTRAL’ with a downwardly revised CY12 target price of Bt14.50/share.
What is the news? The slump in rubber prices has been a drag on overall earnings performance since last year and the situation would also continue into this year.
How do we view this? Even though sales volume is set to rise on the back of growth in Asia, we believe fears of a slowing global economy would lead to more pricing negotiations and order delays which could put pressure on overall operating performance.
Investment Actions? We rate STA shares a ‘NEUTRAL’ with a downwardly revised CY12 target price of Bt14.50/share based on a P/E multiple of 13x.
Sri Trang Agro-Industry
Rating 3.00 Neutral
- Previous Rating 3.00 Neutral
Target Price (Bt) 14.5
- Previous Target Price (Bt) 16
Closing Price (Bt) 14.30
Expected Capital Gains (%) 1.40
Expected Dividend Yield (%) 3.15
Expected Total Return (%) 4.55
Raw Beta (Past 2yrs w eekly data) 1.88
Market Cap. (USD mn) 576
Enterprise Value (USD mn) 1,103
Market Cap. (Bt mn) 18,304
Enterprise Value (Bt mn) 34,537
3M Average Daily T/O (mn) 4.6
52 w eek range 14 - 31.75
Closing Price in 52 w eek range
Major Shareholders (%)
19.3
13.2
7.4
CG Report - 2011
(Very Good)
Key Financial Summary
FYE 12/10 12/11 12/12F 12/13F
Revenue (Btmn) 83,845 133,704 108,378 132,188
Net Profit, adj. (Btmn) 2,905 823 865 1,305
EPS, adj. (Bt) 2.90 0.64 0.68 1.02
P/E (X),adj. 4.9 22.2 21.2 14.0
BVPS (Bt) 10.39 14.09 14.70 15.56
P/B (X) 1.4 1.0 1.0 0.9
DPS (Bt) 1.25 0.50 0.45 0.55
Div. Yield (%) 8.7 3.5 3.1 3.8
Source: Bloomberg, PSR est.
*All multiples & yields based on current market price
Valuation Method
P/E'12 (13x)
1. Sritrang Holdings Co., Ltd.
2. Mr. Waiw ut Sincharoenkul
3. The Central Depository (PTE) Limited-Listed Securities
0.00
10.00
20.00
30.00
40.00
Jul-1
1
Aug-1
1
Sep-1
1
Oct-1
1
Nov-1
1
Dec-1
1
Jan-1
2
Feb-1
2
Mar-1
2
Apr-1
2
May-1
2
Jun-1
2
Jul-1
2
0
10
20
30
40
50
60
70
80
Volume, mn STA TB EQUITY SETI rebased
0% 50% 100%
Analyst Phillip Research Team +65 65311240 +65 63367607 [email protected]
Sri Trang Agro-Industry – STA Thailand Equities Research 13 July 2012
2 of 13
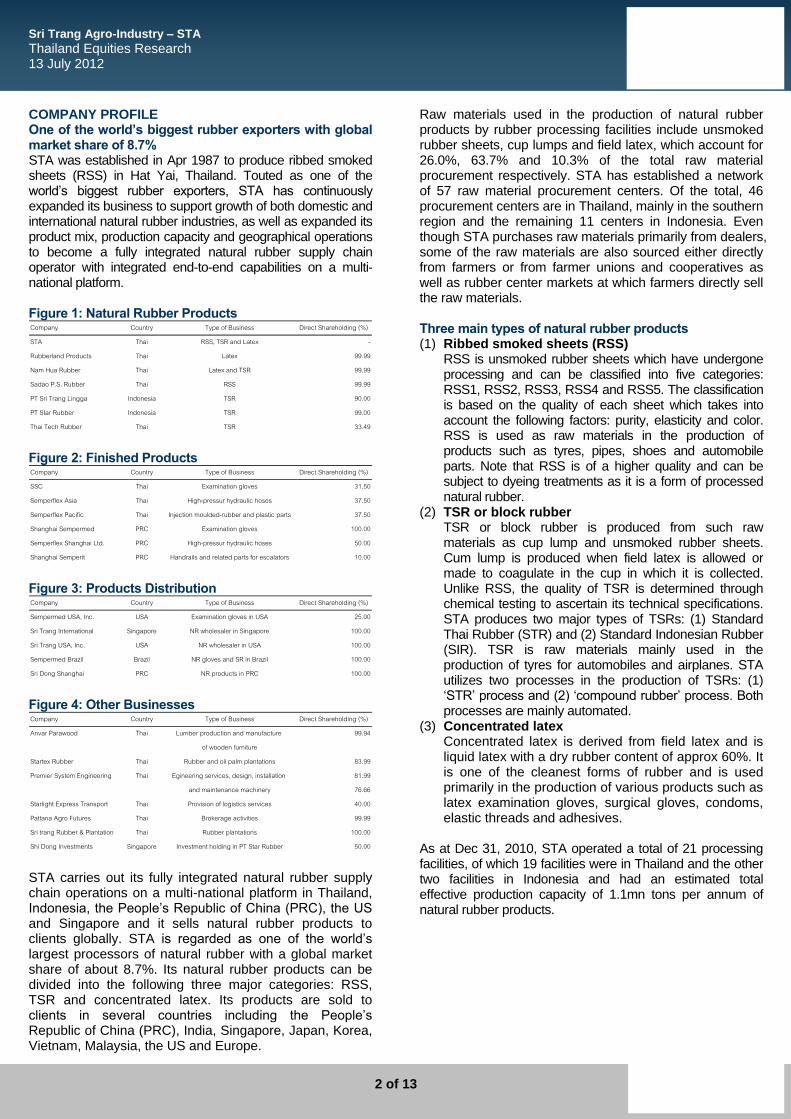
COMPANY PROFILE One of the world’s biggest rubber exporters with global market share of 8.7% STA was established in Apr 1987 to produce ribbed smoked sheets (RSS) in Hat Yai, Thailand. Touted as one of the world’s biggest rubber exporters, STA has continuously expanded its business to support growth of both domestic and international natural rubber industries, as well as expanded its product mix, production capacity and geographical operations to become a fully integrated natural rubber supply chain operator with integrated end-to-end capabilities on a multi-national platform. Figure 1: Natural Rubber Products Company Country Type of Business Direct Shareholding (%)
STA Thai RSS, TSR and Latex -
Rubberland Products Thai Latex 99.99
Nam Hua Rubber Thai Latex and TSR 99.99
Sadao P.S. Rubber Thai RSS 99.99
PT Sri Trang Lingga Indonesia TSR 90.00
PT Star Rubber Indonesia TSR 99.00
Thai Tech Rubber Thai TSR 33.49 Figure 2: Finished Products Company Country Type of Business Direct Shareholding (%)
SSC Thai Examination gloves 31.50
Semperflex Asia Thai High-pressur hydraulic hoses 37.50
Semperflex Pacific Thai Injection moulded-rubber and plastic parts 37.50
Shanghai Sempermed PRC Examination gloves 100.00
Semperflex Shanghai Ltd. PRC High-pressur hydraulic hoses 50.00
Shanghai Semperit PRC Handrails and related parts for escalators 10.00 Figure 3: Products Distribution Company Country Type of Business Direct Shareholding (%)
Sempermed USA, Inc. USA Examination gloves in USA 25.00
Sri Trang International Singapore NR wholesaler in Singapore 100.00
Sri Trang USA, Inc. USA NR wholesaler in USA 100.00
Sempermed Brazil Brazil NR gloves and SR in Brazil 100.00
Sri Dong Shanghai PRC NR products in PRC 100.00 Figure 4: Other Businesses Company Country Type of Business Direct Shareholding (%)
Anvar Parawood Thai Lumber production and manufacture 99.94
of wooden furniture
Startex Rubber Thai Rubber and oil palm plantations 83.99
Premier System Engineering Thai Egineering services, design, installation 81.99
and maintenance machinery 76.66
Starlight Express Transport Thai Provision of logistics services 40.00
Pattana Agro Futures Thai Brokerage activities 99.99
Sri trang Rubber & Plantation Thai Rubber plantations 100.00
Shi Dong Investments Singapore Investment holding in PT Star Rubber 50.00 STA carries out its fully integrated natural rubber supply chain operations on a multi-national platform in Thailand, Indonesia, the People’s Republic of China (PRC), the US and Singapore and it sells natural rubber products to clients globally. STA is regarded as one of the world’s largest processors of natural rubber with a global market share of about 8.7%. Its natural rubber products can be divided into the following three major categories: RSS, TSR and concentrated latex. Its products are sold to clients in several countries including the People’s Republic of China (PRC), India, Singapore, Japan, Korea, Vietnam, Malaysia, the US and Europe.
Raw materials used in the production of natural rubber products by rubber processing facilities include unsmoked rubber sheets, cup lumps and field latex, which account for 26.0%, 63.7% and 10.3% of the total raw material procurement respectively. STA has established a network of 57 raw material procurement centers. Of the total, 46 procurement centers are in Thailand, mainly in the southern region and the remaining 11 centers in Indonesia. Even though STA purchases raw materials primarily from dealers, some of the raw materials are also sourced either directly from farmers or from farmer unions and cooperatives as well as rubber center markets at which farmers directly sell the raw materials. Three main types of natural rubber products (1) Ribbed smoked sheets (RSS) RSS is unsmoked rubber sheets which have undergone
processing and can be classified into five categories: RSS1, RSS2, RSS3, RSS4 and RSS5. The classification is based on the quality of each sheet which takes into account the following factors: purity, elasticity and color. RSS is used as raw materials in the production of products such as tyres, pipes, shoes and automobile parts. Note that RSS is of a higher quality and can be subject to dyeing treatments as it is a form of processed natural rubber.
(2) TSR or block rubber TSR or block rubber is produced from such raw
materials as cup lump and unsmoked rubber sheets. Cum lump is produced when field latex is allowed or made to coagulate in the cup in which it is collected. Unlike RSS, the quality of TSR is determined through chemical testing to ascertain its technical specifications. STA produces two major types of TSRs: (1) Standard Thai Rubber (STR) and (2) Standard Indonesian Rubber (SIR). TSR is raw materials mainly used in the production of tyres for automobiles and airplanes. STA utilizes two processes in the production of TSRs: (1) ‘STR’ process and (2) ‘compound rubber’ process. Both processes are mainly automated.
(3) Concentrated latex Concentrated latex is derived from field latex and is
liquid latex with a dry rubber content of approx 60%. It is one of the cleanest forms of rubber and is used primarily in the production of various products such as latex examination gloves, surgical gloves, condoms, elastic threads and adhesives.
As at Dec 31, 2010, STA operated a total of 21 processing facilities, of which 19 facilities were in Thailand and the other two facilities in Indonesia and had an estimated total effective production capacity of 1.1mn tons per annum of natural rubber products.
Sri Trang Agro-Industry – STA Thailand Equities Research 13 July 2012
3 of 13
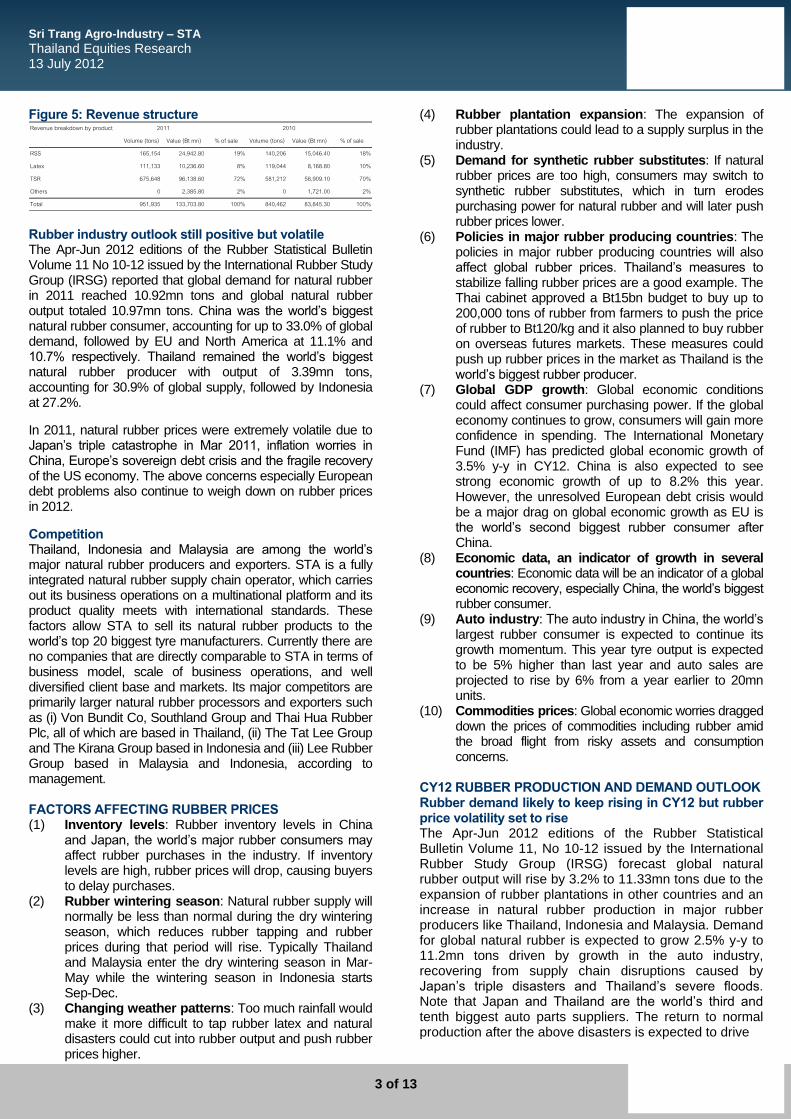
Figure 5: Revenue structure Revenue breakdown by product
Volume (tons) Value (Bt mn) % of sale Volume (tons) Value (Bt mn) % of sale
RSS 165,154 24,942.80 19% 140,206 15,046.40 18%
Latex 111,133 10,236.60 8% 119,044 8,168.80 10%
TSR 675,648 96,138.60 72% 581,212 58,909.10 70%
Others 0 2,385.80 2% 0 1,721.00 2%
Total 951,935 133,703.80 100% 840,462 83,845.30 100%
2011 2010
Rubber industry outlook still positive but volatile The Apr-Jun 2012 editions of the Rubber Statistical Bulletin Volume 11 No 10-12 issued by the International Rubber Study Group (IRSG) reported that global demand for natural rubber in 2011 reached 10.92mn tons and global natural rubber output totaled 10.97mn tons. China was the world’s biggest natural rubber consumer, accounting for up to 33.0% of global demand, followed by EU and North America at 11.1% and 10.7% respectively. Thailand remained the world’s biggest natural rubber producer with output of 3.39mn tons, accounting for 30.9% of global supply, followed by Indonesia at 27.2%.
In 2011, natural rubber prices were extremely volatile due to Japan’s triple catastrophe in Mar 2011, inflation worries in China, Europe’s sovereign debt crisis and the fragile recovery of the US economy. The above concerns especially European debt problems also continue to weigh down on rubber prices in 2012.
Competition Thailand, Indonesia and Malaysia are among the world’s major natural rubber producers and exporters. STA is a fully integrated natural rubber supply chain operator, which carries out its business operations on a multinational platform and its product quality meets with international standards. These factors allow STA to sell its natural rubber products to the world’s top 20 biggest tyre manufacturers. Currently there are no companies that are directly comparable to STA in terms of business model, scale of business operations, and well diversified client base and markets. Its major competitors are primarily larger natural rubber processors and exporters such as (i) Von Bundit Co, Southland Group and Thai Hua Rubber Plc, all of which are based in Thailand, (ii) The Tat Lee Group and The Kirana Group based in Indonesia and (iii) Lee Rubber Group based in Malaysia and Indonesia, according to management.
FACTORS AFFECTING RUBBER PRICES (1) Inventory levels: Rubber inventory levels in China
and Japan, the world’s major rubber consumers may affect rubber purchases in the industry. If inventory levels are high, rubber prices will drop, causing buyers to delay purchases.
(2) Rubber wintering season: Natural rubber supply will normally be less than normal during the dry wintering season, which reduces rubber tapping and rubber prices during that period will rise. Typically Thailand and Malaysia enter the dry wintering season in Mar-May while the wintering season in Indonesia starts Sep-Dec.
(3) Changing weather patterns: Too much rainfall would make it more difficult to tap rubber latex and natural disasters could cut into rubber output and push rubber prices higher.
(4) Rubber plantation expansion: The expansion of rubber plantations could lead to a supply surplus in the industry.
(5) Demand for synthetic rubber substitutes: If natural rubber prices are too high, consumers may switch to synthetic rubber substitutes, which in turn erodes purchasing power for natural rubber and will later push rubber prices lower.
(6) Policies in major rubber producing countries: The policies in major rubber producing countries will also affect global rubber prices. Thailand’s measures to stabilize falling rubber prices are a good example. The Thai cabinet approved a Bt15bn budget to buy up to 200,000 tons of rubber from farmers to push the price of rubber to Bt120/kg and it also planned to buy rubber on overseas futures markets. These measures could push up rubber prices in the market as Thailand is the world’s biggest rubber producer.
(7) Global GDP growth: Global economic conditions could affect consumer purchasing power. If the global economy continues to grow, consumers will gain more confidence in spending. The International Monetary Fund (IMF) has predicted global economic growth of 3.5% y-y in CY12. China is also expected to see strong economic growth of up to 8.2% this year. However, the unresolved European debt crisis would be a major drag on global economic growth as EU is the world’s second biggest rubber consumer after China.
(8) Economic data, an indicator of growth in several countries: Economic data will be an indicator of a global economic recovery, especially China, the world’s biggest rubber consumer.
(9) Auto industry: The auto industry in China, the world’s largest rubber consumer is expected to continue its growth momentum. This year tyre output is expected to be 5% higher than last year and auto sales are projected to rise by 6% from a year earlier to 20mn units.
(10) Commodities prices: Global economic worries dragged down the prices of commodities including rubber amid the broad flight from risky assets and consumption concerns.
CY12 RUBBER PRODUCTION AND DEMAND OUTLOOK Rubber demand likely to keep rising in CY12 but rubber price volatility set to rise The Apr-Jun 2012 editions of the Rubber Statistical Bulletin Volume 11, No 10-12 issued by the International Rubber Study Group (IRSG) forecast global natural rubber output will rise by 3.2% to 11.33mn tons due to the expansion of rubber plantations in other countries and an increase in natural rubber production in major rubber producers like Thailand, Indonesia and Malaysia. Demand for global natural rubber is expected to grow 2.5% y-y to 11.2mn tons driven by growth in the auto industry, recovering from supply chain disruptions caused by Japan’s triple disasters and Thailand’s severe floods. Note that Japan and Thailand are the world’s third and tenth biggest auto parts suppliers. The return to normal production after the above disasters is expected to drive

Sri Trang Agro-Industry – STA Thailand Equities Research 13 July 2012
4 of 13
global auto output up 4.4% y-y to 84mn units. Rubber demand in China, the world’s biggest user is forecast to rise by 2.8%. Tyre output in China is projected to increase by 5% and Chinese auto sales are estimated at 20mn units, up 6% y-y. Rubber consumption in emerging economies like Brazil and India is also set to rise on the back of domestic economic expansion. The International Monetary Fund (IMF) has predicted global economic growth of 3.5% y-y in CY12. GDP in China, the world’s biggest rubber consumer is forecast to grow by 8.2% this year, a slowdown from a 9.2% growth a year earlier but that growth rate however remains high. India, which has a steady rise in rubber consumption, is expected to see economic growth of 6.9% while the recovery in the US, EU and Japanese economies should continue to gain momentum. FUTURE PLAN Upstream integration through rubber plantation: STA plan to further develop its upstream capabilities, which enable it to better control costs and provide greater supply chain coordination. To achieve this end, STA aims to have 50,000 rai of rubber plantations by CY14. At end-1QCY12, STA had 17,400 rai of rubber plantations, of which more than 90% of the plantation areas were located in the north of Thailand. Only 2% of the above plantation areas were under tapping and 45% was in the process of planting rubber trees and it will take about seven years before rubber trees will be mature to start tapping. There is more land currently under survey for acquisition in a bid to meet the above target. Figure 6: Upstream strategy update
Upstream strategy update
Goal 50,000 Rai in 2014
Under Planting process, 45%
Under Gestation, 34%
Tapping, 2%
Vacant land, 19%
Midstream business: STA plans to build, acquire and expand TSR processing facilities both locally and internationally to boost its total production capacity to 1.567mn tons in CY14.
Downstream business: STA aims to strengthen its competitive edge in the rubber glove business in an attempt to retain its market leadership position. Figure 7: Production Capacity (tons per annum)
Production Capacity (tons per annum)
0 500,000 1,000,000 1,500,000 2,000,000
2000
2005
2007
2008
2009
2010
2011
2012F
2013F
2014F
2015F
RSS Latex TSR CY11 EARNINGS REVIEW
CY11 earnings hit by sagging rubber prices In CY11, factors affecting demand for natural rubber included global economic uncertainty stemming from Europe’s sovereign debt crisis, the slow recovery of the US economy and a credit tightening policy to curb inflation in China, the world’s biggest natural rubber consumer, accounting for one third of global demand and natural disasters in several countries around the globe. These factors brought an exceptionally high level of volatility to natural rubber prices throughout CY11 and created some difficulties for STA to strategically manage its business operations especially in the second half of CY11. Net profit margin for the year therefore dropped from a year earlier. The decline was due chiefly to: (1) the volatility of natural rubber prices during the year and the downswing in rubber prices during the last nine months of CY11, (2) inventory write-downs as a result of the sustained falls in natural rubber prices in 4QCY11 due to concerns about the euro zone’s deepening and prolonged sovereign debt crisis, which coincided with the period when STA normally built up its inventory of raw materials and natural rubber products in preparation for the wintering period in Thailand, which normally starts from Feb to May,(3) an increase in rubber export cess from Bt1.40/kg to Bt5.00/kg effective Oct 1, 2011 and (4) a rise in income tax expenses after the full utilization of loss carried forward and the expiry of tax benefits from some BOI certificates. STA reported a CY11 profit drop of 66% y-y to Bt1,306mn from Bt3,820mn in CY10. For the year, sales jumped 59% y-y to Bt133,704mn as average selling prices rose by 41.2% and sales volume grew by 13.3%. The US, Europe and others saw strong sales volume growth on the back of rising demand while sales volume in China rose by a mere 3% as a result of the Chinese government’s measures to curb inflation. Gross profit margin shrank to a mere 4.3% from 6.2% due chiefly to the rubber price slump during the last nine months of CY11 especially in the final quarter of CY11, which led to inventory write-downs of about Bt869.6mn.

Sri Trang Agro-Industry – STA Thailand Equities Research 13 July 2012
5 of 13
Global economic worries especially in the Europe, the US and China put downward pressure on natural rubber prices and overall market conditions. In particular, TSR, accounting for more than 70% of STA’s total sales was hard hit by rubber price declines. The hike in rubber export cess from Bt1.40/kg to Bt5.00/kg effective Oct 1, 2011 also pushed cess expenses up to Bt1,392.4mn. Personnel expenses also rose by Bt211.6mn due to increased staff levels to support capacity expansion. Finance costs edged up on increased loans to support growth in sales volume and average selling prices for natural rubber. Income tax expenses increased after the full utilization of the tax loss carried forward and the expiry of tax benefits from some BOI certificates. Profits from 10 affiliates and joint venture companies came in at Bt648.9mn, of which 56.8% came from Siam Sempermed (SSC), 24.9% from Thaitech Rubber and 15%from Semperflex Asia. Share of profit from affiliates and joint venture companies dropped 7.7% y-y due chiefly to a net profit drop at examination gloves business as a result of a switch from NR gloves to NBR gloves by some clients in the wake of rising fresh latex prices compared to Butadiene Nitrile. SCC mainly produces and distributes NR gloves. TSR business operated by Thaitech Rubber and high pressure hydraulic hose business operated by Semperflex Asia performed better in CY11 compared to CY10 with profit growth of 129.5% and 37.9% respectively. Figure 8: Revenue breakdown by geography Revenue breakdown by geography
Volume (tons) Value (Bt mn) % of sale Volume (tons) Value (Bt mn) % of sale
China 317,513 44,274.00 33% 307,706 31,846.00 38%
Asia 428,555 58,669.00 44% 389,213 37,312.00 45%
USA 107,519 16,107.00 12% 84,680 8,701.00 10%
Europe 77,632 11,612.00 9% 55,408 5,648.00 7%
Others 20,716 3,042 2% 3,456 340 0%
Total 951,935 133,704 100% 840,463 83,847 100%
2011 2010
Figure 9: Margin breakdown by products
Margin breakdown by products 2011 2010
RSS 5.9% 6.1%
Latex 4.7% 3.6%
TSR 3.6% 6.3%
Others 12.9% 13.6%
Total 4.3% 6.2%
Figure 10: RSS3 Price
Figure 11: TSR20 Price
Source: Bloomberg
1QCY12 EARNINGS RECAP
1QCY12 net profit down 77% y-y to Bt397mn STA posted a net profit of Bt397mn in 1QCY12. The quarterly profit was 77% lower than the profit of Bt1,763mn it achieved in 1QCY11 but 161% better than the loss of Bt648mn it recorded in 4QCY11. Quarterly sales slipped 20% y-y to Bt29,266mn as a 6% rise in sales volume was offset by a 25% drop in average selling prices. In q-q terms, sales rose 4% as a 19% growth in sales volume outweighed a 13% decline in average selling prices. Gross profit margin narrowed to a mere 4.8% from 7.7% in 1QCY11 as raw material prices rose more than selling prices. However, a Bt643mn reversal of inventory write-downs pushed margin higher from 1.8% in 4QCY11. SG&A expenses edged up 5% y-y due to rubber export cess hike and increased staff levels from new plant. Profits from affiliates dropped 61% y-y and 1% q-q to a mere Bt61mn as fierce price competition sagged profit of rubber gloves affiliate. Interest expenses shot up 28% y-y on increased debt load and higher interest rates. In this period, the results also included a FX gain of Bt329mn. CY12 EARNINGS OUTLOOK Figure 11: Revenue breakdown by geography
y-y+/- q-q+/-
Volume (tons) Value (Bt mn) Volume (tons) Value (Bt mn) Volume (tons) Value (Bt mn)
China 99,675 10,720.00 77,300 9,384.00 90,289 13,981 -23.3% 14.2%
Asia 112,601 12,309.00 92,056 11,296.00 104,459 14,158 -13.1% 9.0%
USA 31,703 3,882.00 23,548 3,336.00 32,586 4,856 -20.1% 16.4%
Europe 20,442 2,222.00 14,566 1,939.00 21,038 3,255 -31.7% 14.6%
Others 1,192 133 14,981 2,181 2,990 450 -70.4% -93.9%
Total 265,613 29,266 222,451 28,136 251,362 36,700 -20.3% 4.0%
Q1'12 Q4'11 Q1'11
Figure 13: Revenue breakdown by product
y-y+/- q-q+/-
Volume (tons) Value (Bt mn) Volume (tons) Value (Bt mn) Volume (tons) Value (Bt mn)
RSS 43,963 4,909.0 39,786 5,144.0 41,997 6,650 -26.2% -4.6%
Latex 27,980 1,932.0 25,839 2,059.0 32,837 3,177 -39.2% -6.2%
TSR 193,668 21,940.0 156,826 20,380.0 176,527 26,257 -16.4% 7.7%
Others 485.0 553.0 617 -21.4% -12.3%
Total 265,611 29,266.0 222,451 28,136.0 251,361 36,700 -20.3% 4.0%
Q1'11Q1'12 Q4'11
Figure 13: Margin breakdown by products
Q1'12 Q4'11 Q3'11 Q2'11 Q1'11
RSS 0.2% 5.6% 4.1% 6.1% 7.6%
Latex 2.3% 2.6% 0.1% 6.8% 8.0%
TSR 6.0% 0.4% 2.6% 3.2% 7.6%
Others 6.2% 14.8% 13.3% 13.4% 10.2%
Total 4.8% 1.8% 2.9% 4.2% 7.7%
RSS 3 Broiler
250
300
350
400
450
500
550
600
Jul-11
Aug-1
1
Sep-1
1
Oct-
11
Nov-1
1
Dec-1
1
Jan-1
2
Feb-1
2
Mar-
12
Apr-
12
May-1
2
Jun-1
2
Jul-12
24
28
32
36
40
44
48
Jul-11
Aug-1
1
Sep-1
1
Oct-
11
Nov-1
1
Dec-1
1
Jan-1
2
Feb-1
2
Mar-
12
Apr-
12
May-1
2
Jun-1
2
Jul-12
TSR 20 Shrimp
240260
280300
320340360
380400
420440
460480
Jul-11
Aug-1
1
Sep-1
1
Oct-
11
Nov-1
1
Dec-1
1
Jan-1
2
Feb-1
2
Mar-
12
Apr-
12
May-1
2
Jun-1
2
Jul-12 200
250
300
350
400
450
500
550
Jul-11
Aug-1
1
Sep-1
1
Oct-
11
Nov-1
1
Dec-1
1
Jan-1
2
Feb-1
2
Mar-
12
Apr-
12
May-1
2
Jun-1
2
Jul-12
24
28
32
36
40
44
48
Jul-11
Aug-1
1
Sep-1
1
Oct-
11
Nov-1
1
Dec-1
1
Jan-1
2
Feb-1
2
Mar-
12
Apr-
12
May-1
2
Jun-1
2
Jul-12
100105110115120125130135140145150155
Jul-11
Aug-1
1
Sep-1
1
Oct-
11
Nov-1
1
Dec-1
1
Jan-1
2
Feb-1
2
Mar-
12
Apr-
12
May-1
2
Jun-1
2
Jul-12

Sri Trang Agro-Industry – STA Thailand Equities Research 13 July 2012
6 of 13
CY12 earnings to remain under pressure from global economic slowdown Even though news that the Thai government approved a Bt15bn budget to push the price of rubber to Bt120/kg helped send rubber prices higher in the near term, a weaker-than-expected global economy especially the sovereign debt crisis in Europe may cause market sentiment to recover slower than previously expected. Economic data out of China, the world’s biggest rubber consumer also pointed to a slowing economic growth in line with a slowdown in China’s domestic auto output. Thai exports dropped in 5MCY12 as China remained Thailand’s biggest export market. High inventories also prompted main rubber consumer China to delay purchases, which dragged down global rubber prices. In 2QCY12, average rubber prices dropped by 10% from 1QCY12. Falling rubber prices would also strengthen the case for STA to book additional inventory write-downs in 2QCY12. In our view, inventory write-downs could be another catalyst that would cause earnings to surprise to the downside in addition to sales volume, which is expected to be lower than the previous quarter. The weaker-than-expected rubber price outlook also prompts us to slash our CY12 net profit outlook for STA by 9% to Bt1,428mn but the new profit target sill represents a growth of 9% y-y. The forecast assumes full-year sales of Bt108,378mn, down 19% y-y. Under the new estimate, (1) we cut our average selling price assumptions for the year to US$3,200/ton from US$3,600/ton, (2) full-year sales volume is projected to rise 15% y-y to 1.09mn tons as sales growth in Asia should keep overall sales volume up, (3) margins will be weak as a result of a challenging raw materials cost environment and more pricing negotiations. VALUATION & RECOMMENDATION ‘NEUTRAL’ rating with CY12 target price of Bt14.50/share Following the above earnings downgrade, we slash our target price for STA to Bt14.50/share based on a P/E multiple of 13x. We rate STA shares a ‘NEUTRAL.’

Sri Trang Agro-Industry – STA Thailand Equities Research 13 July 2012
7 of 13
FYE Dec CY09 CY10 CY11 CY12F CY13F
Valuation Ratios
P/E (X), adj. 7.4 4.9 22.2 21.2 14.0
P/B (X) 1.9 1.4 1.0 1.0 0.9
EV/EBITDA (X), adj. 17.6 10.9 17.2 20.0 14.3
Dividend Yield (%) 4.2 8.7 3.5 3.1 3.8
Per share data (Bt)
EPS, reported 2.14 3.82 1.02 1.12 1.31
EPS, adj. 1.93 2.90 0.64 0.68 1.02
DPS 0.60 1.25 0.50 0.45 0.55
BVPS 7.37 10.39 14.09 14.70 15.56
Growth & Margins (%)
Growth
Revenue -23.7 82.6 59.5 -18.9 22.0
EBITDA -3.1 62.2 -36.8 -13.7 39.4
EBIT 13.5 49.0 -34.7 -24.8 41.5
Net Income, adj. 34.2 50.6 -71.7 5.0 51.0
Margins
EBITDA margin 4.3 3.8 1.5 1.6 1.8
EBIT margin 5.2 4.3 1.8 1.6 1.9
Net Profit Margin 4.3 3.5 0.6 0.8 1.0
Key Ratios
ROE (%) 24.2 27.0 7.1 7.3 8.3
ROA (%) 7.1 9.8 3.2 3.3 3.7
Net Debt-Cash 12,820 21,520 15,737 15,219 19,566
Net Gearing(X) 1.7 2.1 0.9 0.8 1.0
Income Statement (Bt mn)
Revenue 45,910 83,845 133,704 108,378 132,188
EBITDA 1,957 3,176 2,006 1,731 2,413
Depreciation & Amortisation 350 366 476 571 628
EBIT 2,408 3,590 2,344 1,763 2,495
Net Finance (Expense)/Income (324) (392) (869) (714) (880)
Other items 106 77 165 182 191
Associates & JVs 745 703 649 422 519
Profit Before Tax 2,085 3,198 1,476 1,049 1,615
Taxation 115 273 629 210 291
Profit After Tax 1,969 2,925 846 839 1,324
Non-controlling Interest (40) (21) (23) 25 (19)
Net Income, reported 2,142 3,820 1,306 1,428 1,676
Net Income, adj. 1,929 2,905 823 865 1,305
Source: PSR est.

Sri Trang Agro-Industry – STA Thailand Equities Research 13 July 2012
8 of 13
FYE Dec CY09 CY10 CY11 CY12F CY13F
Balance Sheet (Bt mn)
Cash 981 1,774 2,273 2,503 1,696
ST Investments
Accounts Receivables 4,132 6,240 7,787 6,235 7,243
Inventories 10,173 20,282 17,337 15,523 18,923
Others 582 620 558 179 161
Total current assets 15,920 28,951 28,332 25,373 28,954
PPE 4,245 5,213 7,476 10,846 11,834
Intangibles 14 22 24 26 27
Associates & JVs 2,627 2,922 3,579 3,758 3,946
Others 156 309 649 322 675
Total non-current assets 7,185 8,705 12,081 15,165 16,713
Total Assets 23,105 37,656 40,412 40,538 45,667
Short term loans 12,207 21,067 15,546 13,644 17,724
Accounts Payables 1,545 2,539 2,544 2,258 2,752
Others 314 202 269 565 363
Total current liabilities 14,066 24,788 19,471 17,060 21,407
Long term loans 1,593 2,226 2,465 4,078 3,539
Others 77 251 446 490 539
Total liabilities 15,737 27,264 22,381 21,628 25,485
Non-controlling interest 36 42 94 44 99
Shareholder Equity 7,333 10,349 17,936 18,865 20,083
Cashflow Statements (Bt mn)
CFO
PBT 2,298 4,113 1,959 1,612 1,985
Adjustments 342 366 476 571 628
Cash from ops before WC changes 1,278 3,764 4,482 1,210 3,232
WC changes (5,218) (10,618) (389) 4,504 (4,555)
Cash generated from ops (3,940) (6,854) 4,093 5,714 (1,323)
Taxes paid, net (110) (285) (628) (200) (281)
Interest paid (328) (390) (878) (712) (878)
Cashflow from ops (4,378) (7,529) 2,587 4,803 (2,482)
CFI
CAPEX, net (779) (1,360) (2,691) (3,784) (1,396)
Dividends from associates & JVs 270 749 76 674 68
Cashflow from investments (534) (633) (2,733) (3,112) (1,377)
CFF
Loans, net of repayments 5,016 9,581 (7,488) (807) 3,640
Dividends to shareholders & capital reduction (200) (600) (1,600) (640) (571)
Cashflow from financing 4,806 8,956 646 (1,461) 3,051
Net change in cash (107) 794 499 230 (807)
CCE, end 980 1,774 2,273 2,503 1,696
Source: PSR est.

Sri Trang Agro-Industry – STA Thailand Equities Research 13 July 2012
9 of 13
Total Returns Recommendation Rating
> +20% Buy 1
+5% to +20% Accumulate/Trading Buy 2
-5% to +5% Neutral 3
-5% to -20% Reduce/Trading Sell 4
>-20% Sell 5
We do not base our recommendations entirely on the above quantitative return bands. We
consider qualitative factors like (but not limited to) a stock's risk rew ard profile, market
sentiment, recent rate of share price appreciation, presence or absence of stock price
catalysts, and speculative undertones surrounding the stock, before making our f inal
recommendation
Ratings History
Phillip Group Rating System
Remarks
12345
Source: Bloomberg, PSR
0
10
20
30
40
50
Jun-1
0
Sep-1
0
Dec-1
0
Mar-1
1
Jun-1
1
Sep-1
1
Dec-1
1
Mar-1
2
Jun-1
2
Sep-1
2
Dec-1
2
Target PriceMarket Price
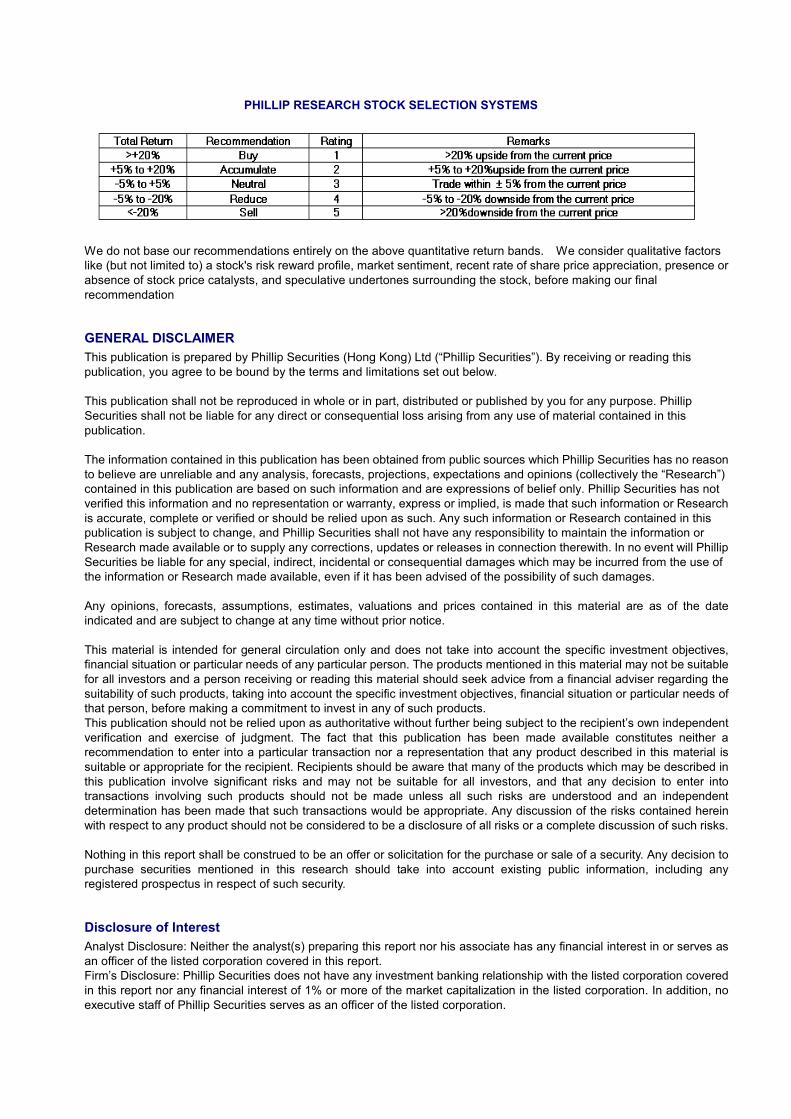
PHILLIP RESEARCH STOCK SELECTION SYSTEMS
BUY >15% upside from the current price
HOLD Trade within ± 15% from the current price
SELL >15% downside from the current price
We do not base our recommendations entirely on the above quantitative return bands. We consider qualitative factors
like (but not limited to) a stock's risk reward profile, market sentiment, recent rate of share price appreciation, presence or
absence of stock price catalysts, and speculative undertones surrounding the stock, before making our final
recommendation
GENERAL DISCLAIMER
This publication is prepared by Phillip Securities (Hong Kong) Ltd (“Phillip Securities”). By receiving or reading this
publication, you agree to be bound by the terms and limitations set out below.
This publication shall not be reproduced in whole or in part, distributed or published by you for any purpose. Phillip
Securities shall not be liable for any direct or consequential loss arising from any use of material contained in this
publication.
The information contained in this publication has been obtained from public sources which Phillip Securities has no reason
to believe are unreliable and any analysis, forecasts, projections, expectations and opinions (collectively the “Research”)
contained in this publication are based on such information and are expressions of belief only. Phillip Securities has not
verified this information and no representation or warranty, express or implied, is made that such information or Research
is accurate, complete or verified or should be relied upon as such. Any such information or Research contained in this
publication is subject to change, and Phillip Securities shall not have any responsibility to maintain the information or
Research made available or to supply any corrections, updates or releases in connection therewith. In no event will Phillip
Securities be liable for any special, indirect, incidental or consequential damages which may be incurred from the use of
the information or Research made available, even if it has been advised of the possibility of such damages.
Any opinions, forecasts, assumptions, estimates, valuations and prices contained in this material are as of the date
indicated and are subject to change at any time without prior notice.
This material is intended for general circulation only and does not take into account the specific investment objectives,
financial situation or particular needs of any particular person. The products mentioned in this material may not be suitable
for all investors and a person receiving or reading this material should seek advice from a financial adviser regarding the
suitability of such products, taking into account the specific investment objectives, financial situation or particular needs of
that person, before making a commitment to invest in any of such products.
This publication should not be relied upon as authoritative without further being subject to the recipient’s own independent
verification and exercise of judgment. The fact that this publication has been made available constitutes neither a
recommendation to enter into a particular transaction nor a representation that any product described in this material is
suitable or appropriate for the recipient. Recipients should be aware that many of the products which may be described in
this publication involve significant risks and may not be suitable for all investors, and that any decision to enter into
transactions involving such products should not be made unless all such risks are understood and an independent
determination has been made that such transactions would be appropriate. Any discussion of the risks contained herein
with respect to any product should not be considered to be a disclosure of all risks or a complete discussion of such risks.
Nothing in this report shall be construed to be an offer or solicitation for the purchase or sale of a security. Any decision to
purchase securities mentioned in this research should take into account existing public information, including any
registered prospectus in respect of such security.
Disclosure of Interest
Analyst Disclosure: Neither the analyst(s) preparing this report nor his associate has any financial interest in or serves as
an officer of the listed corporation covered in this report.
Firm’s Disclosure: Phillip Securities does not have any investment banking relationship with the listed corporation covered
in this report nor any financial interest of 1% or more of the market capitalization in the listed corporation. In addition, no
executive staff of Phillip Securities serves as an officer of the listed corporation.
Phillip Securities (HK)Phillip Securities (HK)Phillip Securities (HK)Phillip Securities (HK) Ltd Ltd Ltd Ltd
2
Availability
The information, tools and material presented herein are not directed, intended for distribution to or use by, any person or
entity in any jurisdiction or country where such distribution, publication, availability or use would be contrary to the
applicable law or regulation or which would subject Phillip Securities to any registration or licensing or other requirement,
or penalty for contravention of such requirements within such jurisdiction.
© 2011 Phillip Securities (Hong Kong) Limited
Phillip Capital – Regional Member Companies
SINGAPORE
Phillip Securities Pte Ltd
Raffles City Tower 250, North Bridge Road #06-00
Singapore 179101 Tel : (65) 6533 6001 Fax : (65) 6535 6631
Website : www.poems.com.sg
MALAYSIA
Phillip Capital Management Sdn Bhd
B-2-6 Megan Avenue II 12 Jln Yap Kwan Seng 50450 Kuala Lumpur Tel : (603) 2166 8099 Fax : (603) 2166 5099
Website : www.poems.com.my
HONG KONG
Phillip Securities (HK) Ltd
11-12/F United Centre 95 Queensway, Hong Kong
Tel : (852) 2277 6600 Fax : (852) 2868 5307
Website : www.poems.com.hk
THAILAND
Phillip Securities (Thailand) Public Co Ltd
15/F, Vorawat Building 849 Silom Road
Bangkok Thailand 10500 Tel : (622) 635 7100 Fax : (622) 635 1616
Website : www.poems.in.th
JAPAN
The Naruse Securities Co Ltd
4-2, Nihonbashi Kabutocho Chuo Ku, Tokyo Japan 103-0026
Tel : (81) 03-3666-2101 Fax : (81) 03-3664-0141
Website : www.naruse-sec.co.jp
UNITED KINGDOM King & Shaxson Ltd
6th Floor, Candlewick House
120 Cannon Street London EC4N 6AS
Tel : (44) 207 426 5950 Fax : (44) 207 626 1757
Website : www.kingandshaxson.com

