st. cloud state university college student health survey katherine lust, phd, mph, rd director of...
TRANSCRIPT

St. Cloud State University College Student Health Survey
Katherine Lust, PhD, MPH, RDDirector of Research: Boynton Health Service, University of MinnesotaAdjunct Assistant Professor,Division of Epidemiology & Community Health, University of Minnesota
March 25, 2013
College Student Health Survey Report


Methodology
Paper WorkFERPA
IRB
LogisticsList of students
IT Test, Test. Test
Over sampled Veterans

Methodology2,928 students were sent a survey (2008)
3,558 students (2009)3,517 students (2010)3,511 students (2011)5,928 students (2012)
31.6% Response rate (2008)33.4% (2009)34.5% (2010)35.7% (2011)15.9% (2012)
Over the 5 years19,442 students received a survey
and 5,520 completed a survey
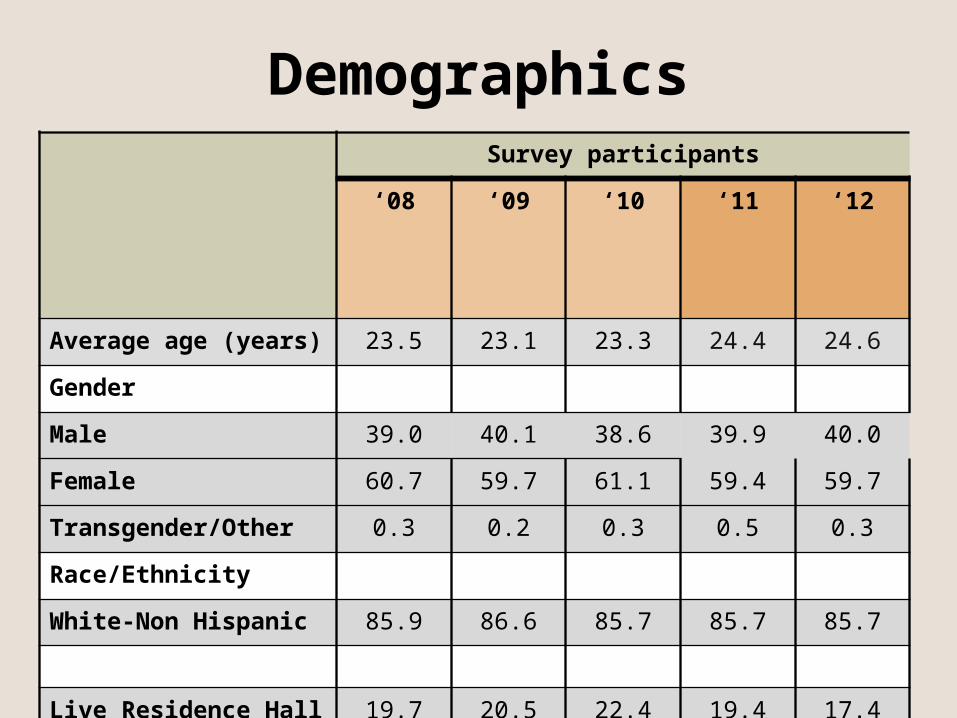
DemographicsSurvey participants
‘08 ‘09 ‘10 ‘11 ‘12
Average age (years) 23.5 23.1 23.3 24.4 24.6
Gender
Male 39.0 40.1 38.6 39.9 40.0
Female 60.7 59.7 61.1 59.4 59.7
Transgender/Other 0.3 0.2 0.3 0.5 0.3
Race/Ethnicity
White-Non Hispanic 85.9 86.6 85.7 85.7 85.7
Live Residence Hall or Fraternity/Sorority
19.7 20.5 22.4 19.4 17.4

Analysis: Academic performance
Grade Point Average:self report

Areas to be Examined
Tobacco Use
Alcohol/Other Drugs
Personal Safety
Financial

Current Tobacco Use
2008 2009 2010 2011 20120
10
20
30
40
29.231.2
25.824.4 22.5
All students
Per
cent
Current Tobacco Use: Any use of tobacco within the past 30 days
P <0.0001

Current Tobacco Use
Minnesota: 14.9%

Daily Tobacco Use
2008 2009 2010 2011 20120
5
10
15
8.78.8
8.4 7.5 7
All studentsP
erce
nt
P = 0.136

Current Smokeless Tobacco Use
Aggregate (2011) SCSU (2011)0
5
10
15
20
4.7
7.2
11.2
15.2
1.1 1.7
All student Males Females
Per
cent
Current Smokeless Tobacco Use: Any use of smokeless tobacco within the past 30 days

Consider Themselves SmokersAmong Those Who Smoked Tobacco Within Past 30 days
45.4
54.6
Yes, I am a smoker No, I am not a smoker
SCSU 20112 CSHS
51.2% attempted to quit
3.7= Average number of quit
attempts

Exposure to Secondhand SmokeLocation
Percent Who Indicate Exposure
Inside Outside
On Campus 3.5 53.4
Residence Halls * 9.3
Fraternity/Sorority 0.4 1.5
Bars/Restaurants * 24.2
In a Car 21.1 *
Where I Live 8.3 19.5
Private Parties 10.5 19.0
Worksite * 10.2
Parking Ramp/Garage 6.3 *
Other 6.4 14.8
*Location not included in question SCSU 2012 CSHS

Current Alcohol Use
2008 2009 2010 2011 20120
20
40
60
80
10076.1 76.1
68 70.5 67.7
All studentP
erce
nt
P <0.0001

Current Alcohol Use
Aggregate (2011) SCSU (2011)0
20
40
60
80
100
63.970.565.6 69.1
6371.3
All student Males Females
Per
cen
t

E. Weitzman, 2006
Used Alcohol within past 30
days:12th Grade
Male: 41.0%Female: 39.0%
2010 MN Student Survey

High Risk Drinking
2008 2009 2010 2011 20120
20
40
6046.4
45.4
37 36.1
32.3
All studentP
erce
nt
Ages 21 to 23 are the peak years for engaging in high-risk drinking
P<0.0001

High Risk Drinking
Aggregate (2011) SCSU (2011)0
20
40
60
29.2
36.137.3
47.4
24.728.5
All student Males FemalesP
erce
nt
Ages 21 to 24 are the peak years for engaging in high-risk drinking

High Risk Drinking
Minnesota: 17.2%

Negative Consequence Due to Alcohol/Drug Use
Had a HangoverPerformed Poorly on a Test or Important ProjectBeen in Trouble with Police, Residence Hall, orOther College AuthoritiesDamaged Property, Pulled Fire Alarm, etc.Got Into an Argument or FightGot Nauseated or VomitedDriven a Car While Under the InfluenceMissed a ClassBeen Criticized by Someone I KnowThought I Might Have a Drinking orOther Drug ProblemHad a Memory LossDone Something I Later RegrettedBeen Arrested for DWI/DUIHave Been Taken Advantage of SexuallyHave Taken Advantage of Another SexuallyTried Unsuccessfully to Stop UsingSeriously Thought About SuicideSeriously Tried to Commit SuicideBeen Hurt or Injured

AssociationHigh Risk Drinking and Negative Consequences
Males Females0
10
20
30
40
3.9 4.7
17.5 17.3
Did not engage in HRDEngage in HRD
Num
ber
of N
egat
ive
Con
sequ
ence
s
P < 0.0001 P < 0.0001
Aggregate 2010 CSHS

High Risk Drinking and Grade Point Average
Do not drink None Once Twice 3-5 times 6+ times3
3.1
3.2
3.3
3.4
3.5
3.35 3.38
3.27
3.19
3.12 3.11
Frequency within past two weeks
Gra
de P
oint
Ave
rage
Engage in HRD: Mean= 3.21
Do not engage: Mean= 3.37
P< 0.0001
Aggregate 2010 CSHS

High Risk Drinking and GPA
Did not engage in HRD Engage in HRD3.1
3.2
3.3
3.4
3.5
3.6
3.28
3.15
3.41
3.27
Males Females
Gra
de
Poi
nt
Ave
rage
P < 0.0001
Aggregate 2010 CSHS

Current Marijuana Use
2008 2009 2010 2011 20120
5
10
15
20
25
16.414.2
12.113.4
11.5
All studentP
erce
nt
U of M 2010 CSHS
P= 0.002

Current Marijuana Use
Aggregate (2011) SCSU (2011)0
10
20
30
11.1
13.415.3
16.2
8.7
11.4
All student Males FemalesP
erce
nt

Marijuana Use and GPA
Did not use marijuana Used marijuana3
3.1
3.2
3.3
3.4
3.34
3.18Per
cent
P < 0.0001
Marijuana Use refers to use within the past 30 days
Aggregate 2010 CSHS

Other Illicit Drug Use-Past 12 Months
Survey Year
Most commonly used illicit
drug
2nd 3rd 4th
2008 Cocaine4.3%
Sedatives3.8%
Ecstasy2.4%
Hallucinogens2.2%
2009 Cocaine3.7%
Sedatives3.0%
Ecstasy2.4%
Hallucinogens2.4%
2010 Sedatives2.7%
Hallucinogens2.1%
Ecstasy2.1%
Cocaine1.3%
2011 Sedatives2.8%
Hallucinogens2.1%
Cocaine1.5%
Ecstasy1.4%
2012 Sedatives1.6%
Hallucinogens1.4%
Cocaine1.2%
Ecstasy1.1%

Other Illicit Drug Use-Past 12 Months
Cocai
ne
Ampheta
min
es
Sedat
ives
Hal
lucin
ogen
s
Opia
tes
Inhal
ants
Ecsta
cy
Steroi
ds
GH
B/Roh
ypnol
0
2
4
6
1.7
1
3.2
1.9
0.700000000000001
0.3
1.7
0.1 0.2
1.50.70000000000000
1
2.8
2.1
0.600000000000001 0.3
1.4
0.1 0.2
Aggregate (2011)
SCSU (2011)
Per
cen
t
5.9% report having used at least one of the nine illicit drugs5.3% report having used another person’s prescription medication

Other Drug Use and GPA
Did not use other drugs Used other drugs3
3.1
3.2
3.3
3.4
3.32
3.18Per
cent
P < 0.0001
Other drug use refers to use within the past 12 months
Aggregate 2010 CSHS

Sexual Assault: Lifetime
2008 2009 2010 2011 20120
5
10
15
20
25
30
18.6
16.9 16.317.6
20
All student
Per
cen
t

Sexual Assault: Lifetime
Aggregate (2011) SCSU (2011)0
10
20
30
40
19.717.6
5.85.2
27.3
25.9
All student Males Females
Per
cen
t
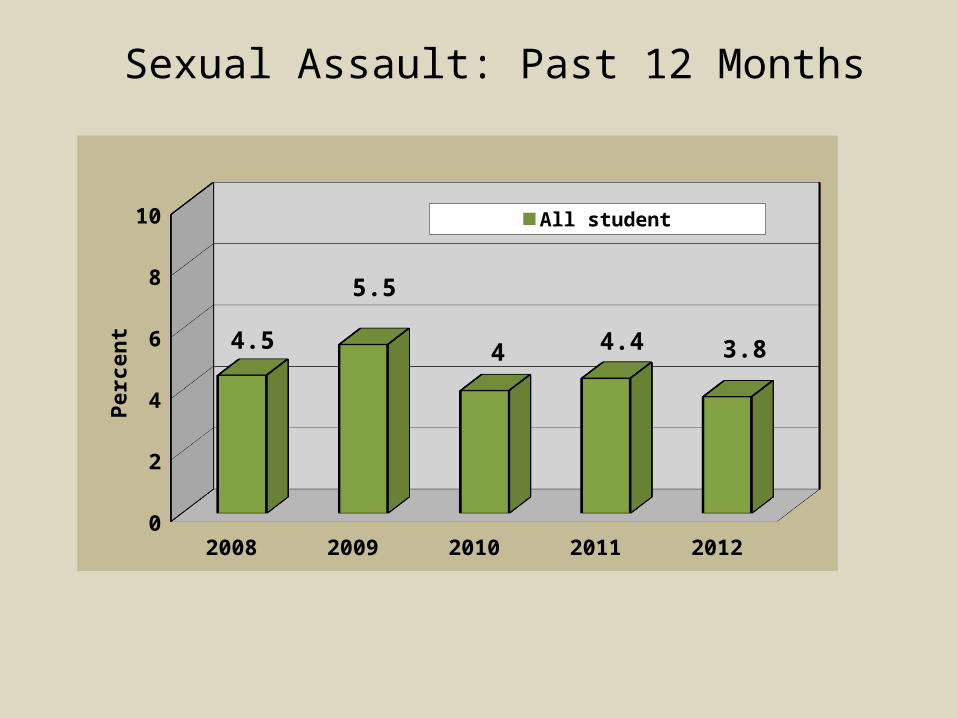
Sexual Assault: Past 12 Months
2008 2009 2010 2011 20120
2
4
6
8
10
4.5
5.5
4 4.4 3.8
All student
Per
cen
t

Sexual Assault: Past 12 Months
Aggregate (2011) SCSU (2011)0
2
4
6
8
10
3.34.4
1.4 1.4
4.4
6.5
All student Males Females
Per
cen
t

Domestic Violence: Lifetime
2008 2009 2010 2011 20120
10
20
30
40
25.821.7 21.9
24.7 21.4
All student
Per
cen
t

Domestic Violence: Lifetime
Aggregate (2011) SCSU (2011)0
10
20
30
40
50
27.824.7
16.6 15.2
3431.1
All student Males Females
Per
cen
t

Domestic Violence: Past 12 Months
2008 2009 2010 2011 20120
5
10
15
20
15.1
11.613 11.8
8.9
All student
Per
cen
t
P<0.0001

Domestic Violence: Past 12 Months
Aggregate (2011) SCSU (2011)0
5
10
15
20
12.811.8
9.1 9
14.813.8
All student Males Females
Per
cen
t

Sexual Assault and GPAFemales only
Within Lifetime Within Past 12 Months3.15
3.2
3.25
3.3
3.35
3.4
3.45
3.35
3.23
3.38 3.38
Experienced Did Not Experience
Gra
de
Poi
nt
Ave
rage
P < 0.0001
Not statistically significant
Aggregate 2010 CSHS

Domestic Violence and GPA Females only
Within Lifetime Within Past 12 Months3.15
3.2
3.25
3.3
3.35
3.4
3.45
3.37
3.3
3.38 3.38
Experienced Did Not Experience
Gra
de
Poi
nt
Ave
rage
P< 0.0001
Not statistically significant
Aggregate 2010 CSHS

Sexual Assault Reporting by Victims
Reported the Assault to Percent
Health Care Provider 30.0
Hall Director or Community Advisor
6.0
Campus Sexual Violence Office
8.0
Police 32.0
Other 50.0
Based on experiencing sexual assault within lifetime SCSU 2012 CSHS
26.6
73.4
Reported assault Did not report

Depression Diagnosis-LifetimeAll Students by sexual assault/domestic violence
Did not experience sexual assault/domestic violence
Experienced sexual assault Experienced domestic vio-lence
0
20
40
60
80
11
33.1 32.5
Percent Diagnosed with depression
Per
cen
t
SCSU 2012 CSHS

Questions?
