st morbidity amongwomenstudies.in/elib/status/st_morbidity_among.pdf1 madhiwala, neha; jesani amar:...
TRANSCRIPT

1
Madhiwala, Neha; Jesani Amar: Morbidity Among Women In Mumbai City: Impact of Work and Environment. Economic and Political Weekly. Oct 1997. 32(43).p.ws.38-ws.49.
------------------------------------------------------------------------------------------------------------
Morbidity among Women in Mumbai City: Impact of Work and Environment
Neba Madhiwalla & Amar Jesani
Abstract: This paper reports a study of the morbidity of a small population in Mumbai city. The results point to a strong relationship between women's work lives and their health. It also points to the need to understand and integrate the labour of women in producing children and raising them, in keeping the household running in any exploration of women's health status.
Introduction
The health of the general population as well as specific groups (infants, women, etc) has for long been an important concern for development studies. When economic development is put in the context of human development, the success of nations to secure good health for their citizens assumes great significance. Morbidity, or physical and mental illness, is increasingly being recognized as a 'measurable indicator of well being' [Shariff 1995]. The patterns of reporting of morbidity reveals important facets not merely to the health status of various groups, but also points to inequalities in status and autonomy among various groups of individuals. Morbidity and mortality data have long been used to estimate the level of gender injustice in society. Greater gender justice in the distribution of food, health care and other resources help in ensuring the survival and health of women and female children. Although less clearly understood, women's work autonomy in making reproductive choices and their relative status in the family and community, also have an influence on their health. Morbidity among women is thus an important guide to understand their position in the household and the community.
Health defined broadly as a feeling of physical, mental and spiritual 'well being' is often juxtaposed to its definition as absence of disease and infirmity. However, in reality, the relationship between 'well being' and absence of disease is very complex. People's perception of their health, illness and causative factors is based on many factors - social, economic, cultural and environmental. From a strictly

2
scientific point of view, one may assume that those who live in poverty, degraded living environment, are involved in occupations which are hazardous to health, etc, should necessarily have a lower feeling of well being and thus complain more of ill health and illness. However, studies have shown that this is not necessarily so- the rich and well placed strata complained of illness more often than the poorer strata [Duggal and Amin 1989] or that people in the underdeveloped states in India reported less morbidity than those in the developed states [NSS 1992].
There are no straightforward explanations for the process by which an individual's social position is reflected in his/her health status. Even our bodily experiences are colored by our perception of our social role and the definition of that state in our culture. Thus, a state which can clinically be defined as 'illness' may not be experienced so by the woman for whom it may be natural, part of being a woman. Conversely, a clinician may refuse to accept a complaint made by her because it cannot be medically established. However, unless we are prepared to accept and observe both these categories of problems, that part of women's morbidity will not emerge. It is a case of not seeing what we were not prepared to observe in the first place.
Therefore, any investigation into the health of people necessarily encounters the problem of understanding how health and illnesses are perceived and understood by people. A strictly medical approach to identify diseases among people and a strictly sociological approach of accepting non-prompted answers given by people on their health and illness would not provide necessary answers. For instance, a number of studies done in last one decade on women's reproductive health have found that while there is less reporting of reproductive illnesses by women in surveys, on clinical examination a very large number of them were found suffering from diseases [Baroda Citizens Council (BCD)]
Health Survey
As knowledge from more studies accumulates, our understanding of the interlinkages of socio-economic, political and environmental factors with health is deepened. The study of ill health in the community by conducting surveys of perceived morbidity has become an important part of health research in India. Notably, in the past decade, three attempts have been made to conduct countrywide studies by the NSS (1986-87) and NCAER (1990, 1993) to study morbidity, health care utilisation and expenditure through the use of household surveys. Apart from these, numerous small-scale studies have been conducted

3
using the same methodology. The most significance among those include studies conducted in Jalgaon [FRCH 1986-87], Madhya Pradesh [FRCH 1990] and Kerala [KSSP1987].
These health surveys all recorded 'perceived morbidity'. They depend on the person's perception of his/her health state. Perceived morbidity refers to the reporting of episodes of illness occurring in the span of a specified time period (recall period) by the respondent him/herself. There may be a criterion for identifying an illness episode such as restriction of physical activity confinement to bed, etc. A list of tracer conditions/probes (list of symptoms) may also be used to improve the reporting of minor ailments. Added to the heterogeneity of that we find in India, there was no standardization in the methodology of these studies. Thus, a brief review of their findings indicate certain consistent trends as well as striking differences. The most remarkable difference has been in the quantum of morbidity that these studies have been able to record.
In 1990, The NCAER (1992) recorded prevalence rate of 67.70 illness episodes (formally treated) per 1,000 persons in 15 days in urban areas. This was marginally lower than the rural rate of 79.06. In 1993, in a similar study [Sundar 1995] they recorded a prevalence rate of 103 episodes (including untreated illnesses) per month in the urban areas. In the study [Duggal and Amin 1989] conducted in Jalgaon by FRCH, which was one of the first studies of its kind, they recorded a total monthly prevalence rate of 149. The rates for males and females were 145 and 152 respectively. In the study of two districts in Madhya Pradesh conducted by the same organization [George et al 1994], the monthly morbidity rates for males 323 and for females 296. The total morbidity prevalence rate was 311. In the study conducted by KSSP in rural Kerela [Kannan 1991 ], unusually high morbid rates were recorded with male morbidity as 203 and female morbidity at 206 per thousand for as reference period of two weeks.
Although the rates of morbidity themselves vary significantly, the gender difference in the reporting of morbidity in each case is very marginal. The female morbidity rates are higher by 1 to5 per cent than the total morbidity rates in the Jalgaon, KSSP and NCAER (1993) study. We find female morbidity to be lower than the total by 5 per cent in the Madhya Pradesh study. We do find that female morbidity is lower by 20 per cent in the NCAER study of 1990.
However, as this study took into consideration only formally treated illnesses, this finding is not surprising. It is very likely that a large percentage of women's illnesses go untreated. Both the NCAER studies as well as the Madhya Pradesh

4
study which reported morbidity by age and sex showed that morbidity among adult women tended to be higher than morbidity for female children. This indicated that women faced a higher risk of illness after they reached the reproductive age. However, no study had attempted to systematically document the nature of the additional illnesses suffered by women after they reached puberty through a household level survey. Evidently, an important aspect of women's health is the strain put on women's bodies by actual reproduction and the resultant short term and life long health problems. However, studies on sexual or maternal health are not sufficient to understand how women's health condition changes after they enter into marriage and motherhood. These do not imply merely the responsibility of meeting the partner's sexual needs and the biological reproduction of children. Regardless of the other economic roles that they may perform, women in all societies undertake the responsibility of 'reproductive labour'. We must define it as a 'work relationship' [Harvey 1990: 5] into which women enter as wives and mothers. Women must undertake all the tasks that are necessary for the sustenance of their households. How burdensome this role becomes depends on many factors, including the resources available to the household, the expected number of children they must bear and raise, the number of dependents and the sex wise and age wise division of work within the household. In general, as reproductive labour is seldom transferred to male members of the household, adult women in the household are often the sole members of the family to undertake this 'reproductive labour',[Chant 1992]. We attempted to use the household survey to explore the totality of women's health problems in relation to their lives and all aspects of their work.
Methodological Issues
Much of the knowledge that we have about women's health problems and their health care needs has been derived from studies with specific groups of women [Gittelsohn 1994]. There have also been some efforts to document the prevalence of gender-specific health problems such as obstetric and gynaecological morbidity [BCC et al] through clinical examination based studies. The link between poor nutrition, anaemia and related morbidity too, has been explored in small studies with restricted participants. We have attempted to modify the household health survey to place a special emphasis on women's health problems.
Some significant modifications were made in the methodology: (1) The exclusive use of women respondents and women interviewers; (2) Use of a probe list (a list of 14 questions probing specific symptoms) to elicit more information on women's health; (3) Intensive training of investigators to make them sensitive to

5
women's health problems and the difficulties that women have in articulating these; and (4) Establishing good rapport with the women in the community by holding community meetings and repeated contact with them before commencing the survey.
Prior to the actual study in Nasik district, we decided to conduct a pilot study in Mumbai, using this modified methodology. In this pilot study, we interviewed 430 households in the study. The survey was supplemented by in-depth interviews with eight women. We selected Jari Mari area in L ward, Kurla, a centrally located industrial suburb, for the study. It is a very old, highly congested area with a high concentration of industrial units and residential units. Only households which had women above 12 years of age were included in the sample.
The Setting
According to the census, Mumbai had a population of 99.26 lakhs in the year 1991. Interestingly, the female population had grown by 27.15 per cent in the previous ten years, while the male population grew by only 17.34 per cent in the same period. The reasons for this change in the gender composition of the population is very significant. Mumbai was historically regarded as a city of migrants. In 1951, there were 1,659 males for every 1000 females (sex ratio: 603) in the city. Since then, two processes have been underway. The sex ratio has become much more balanced (1,222 males for 1 000 females in 1991 or a sex ratio of 818) and births contribute a large share to growth of population. This is because there has been a simultaneous increase in the proportion of females between 15-54 years in the total female population, i e, women in the reproductive age. All these statistics indicate that Mumbai's population is becoming more settled, with families replacing the all male households of earlier years.
Kurla's sex ratio was 767 in 1991. The sex ratio of the census block no 78 , Bazar gate -Church Hall, within whose limits all the selected households are located, had an even lower sex ratio at 742. The sex ratio for the population above six years of age in the block was lowest at 712. Kurla ward witnessed a sharp increase in the population and density in the 1981-91 decade. The density of population increased from 17,161 persons per sq km to 45,775 persons.
Given the large size of Mumbai's population and its heterogeneity, any sample that we may draw will be distinctive in some aspects. The 430 households were

6
selected from five different clusters, all located within an area of one square mile. These clusters were delineated using geographical boundaries such as walls, gutters and roads. The selection of the clusters, was on the basis of their 'class character', which we ascertained using certain indicators such as the occupation of its residents, the condition and size of their houses, the immediate environment outside the houses and the visible presence of goods such as televisions, refrigerators and vehicles. Each of these five clusters had a very distinctive character. Of these two clusters were slums located on land belonging to the airport authority. Two other clusters were 'chawls' - one or two room tenements built in rows alongside a narrow lane. These particular settlements were what is locally known as 'sitting' chawls, with only one storey. The fifth cluster was a group of apartment blocks housed in multistoried buildings.
Although all the participant households in the study suffer from the impact of the environmental problems so characteristic of an industrial area such as Kurla, the immediate environment of their houses varied considerably. Typically, in Mumbai, one finds that the physical condition of areas in close proximity to each other can vary dramatically. The 'cheek by jowl' presence of high, middle and low income settlements is well known. Nowhere are the attempts to prevent the deterioration of the few feet of common space between houses and the effort to isolate the settlement from the influence of highly polluted surroundings as evident as in this area. The measures, though simple, make a dramatic difference to both the appearance and the quality of life of the people. Settlements which in common terms are called 'slums' are areas which have precisely failed to implement these measures. We decided to use this category to analyse our data so that we could better understand the impact of the environment on the health of all individuals, and of women in particular.
The classification of households into slum and non-slum has been done on the basis of our observation of the physical conditions of the settlements that we selected for the survey. Defining what constitutes a slum can be a matter involving considerable confusion. 'Slum' is not as objective a category as we would have liked. However, for the purpose of this analysis, we defined an entire cluster as a slum on the basis of the degradation of the immediate environment that we observed. (Non-slum settlements being those which were characterised by covering of the drains adjoining the houses, paving of the common lanes between the rows of houses and the separation of the garbage dumping and defecation areas from the houses.)
Using this classification, we have 178 non-slum households comprising of 905 individuals. The 252 slum households had 1,244 individuals (Table 1) The

7
structure of only six of the non-slum households was not entirely constructed out of cement concrete. While 119 slum households were not housed in permanent structure. There was a similar disparity in the amenities available. Fifty-nine percent of the non-slum households had their own water connections, while only five households in the slum had the same facility. Eighty-two percent of the slum households used municipal toilets and only two had their own toilet. On the other hand, 30 percent of the non-slum households had their own toilets and only 29 percent used municipal toilets. Although 41 percent of these households used toilets reserved for residents of the chawl, these were decidedly better maintained than similar toilets used by 16 percent of the slum households.
Table 1
Households
Slum Non-Slum Total
Number 252 178 430
Structure
Pucca
Non-pucca
133(53)
119(47)
172(97)
06(03)
305(71)
125(29)
Water supply
Own water connection
Public water supply
5(02)
247(98)
105(59)
73(41)
110(26)
320(74)
Toilet facility
Own toilet
Public/common/open space
2(1)
250(99)
53(30)
125(70)
55(13)
375(87)
Note: Figures in brackets are column percentages.
The status of women in these two groups of households also showed some significant differences. The sex ratio in the slum and non-slum population in our study differed significantly being 896and 980 (588 and 448 women of all ages) respectively. While 12.8 per cent of the women above six years in non-slum households were illiterate, 33.1 percent of the women in the slum households could not read and write. Of the adult women in the non-slum households, 23

8
per cent were employed compared to 15 per cent of the women in the slum households. Thus, women in slums were both less educated and less likely to have employment.
However, if we consider the situation in the context of 'reproductive labour', we find the women in the slum households bear a heavier work burden. We find that only 48 households (19 percent), had more than one adult women in the house, while among the non-slum households 63 households (35 percent), had more than one adult woman thus, women living in the slum seldom had support of other adult women in the household in meeting the sustenance needs of the family. The work burden for slum women who, in addition to housework, undertook paid work was tremendous.
Morbidity
In the interview, the woman respondent was asked about all the episodes of illness experienced by all the family members in the month of June 1996. Following this specific symptoms were probed for all women above the age 11 years. The interviewer recorded the verbatim response of the women interviewed. The resultant data on morbidity was then analyzed and a maximum of three symptoms were coded for each episode from a list of 89 symptoms. The classification of the episodes into eight types of illness was then done taking into consideration all three symptoms. In case of doubt, the individual's gender and age well as the stated reason for illness were taken into account. Although the types of illness are based broadly on the physiological systems (respiratory, gastrointestinal tract (GIT), reproductive system), we felt compelled to include categories such as 'aches, pain and injuries' and 'weakness' in the list. The final classification itself gives evidence to the distinctive character of women's health problems. The reporting of symptoms confirmed that women consider these health problems as important and as categories in themselves. Adhering to a strictly clinical classification of morbidity would have meant losing sight of this perception.
In the above context, we have undertaken to analyze the data on morbidity gathered in this study. The data reveal interesting trends.

9
Gender
In this study, we recorded 780 episodes of illness among 2,149 individuals in the month of June. Thus, the monthly prevalence rate of illness is 363 per thousand Table 2. However, we find very dramatic gender differences in this study. We find that when asked to report illness without any probing, women have reported nearly twice as many episodes of illness for themselves as for the male population. (Males recorded a monthly prevalence rate of 169 per thousand as compared to 297 for females.) Forty-seven per cent of the episodes recorded for women (including girls below 12 years) were reported after probing (Table 6). When we add the episodes reported after probing, the female morbidity rate becomes three and a half times as high (571 per thousand for females). No previous household study (where, usually, gender of the respondent and the interviewer is not specified) has reported a large difference in morbidity.
Table 2
Characteristics Morbality Prevalence Rates
(Per Month Per 1000 Individuals)
Sex Living Environment All Individuals
Female Male Slum Non-Slum
Number (Total = 2,149)
571 169 429 272 363
Age (in Years)
0-4 384 361 429 238 373
5-11 222 171 230 147 197
12-17 315 143 289 156 226
18-25 686 130 510 232 408
26-35 866 101 550 348 469
36-45 874 188 509 479 494
>45 783 160 548 336 414
No Response 667 000 333* 000* 154
10
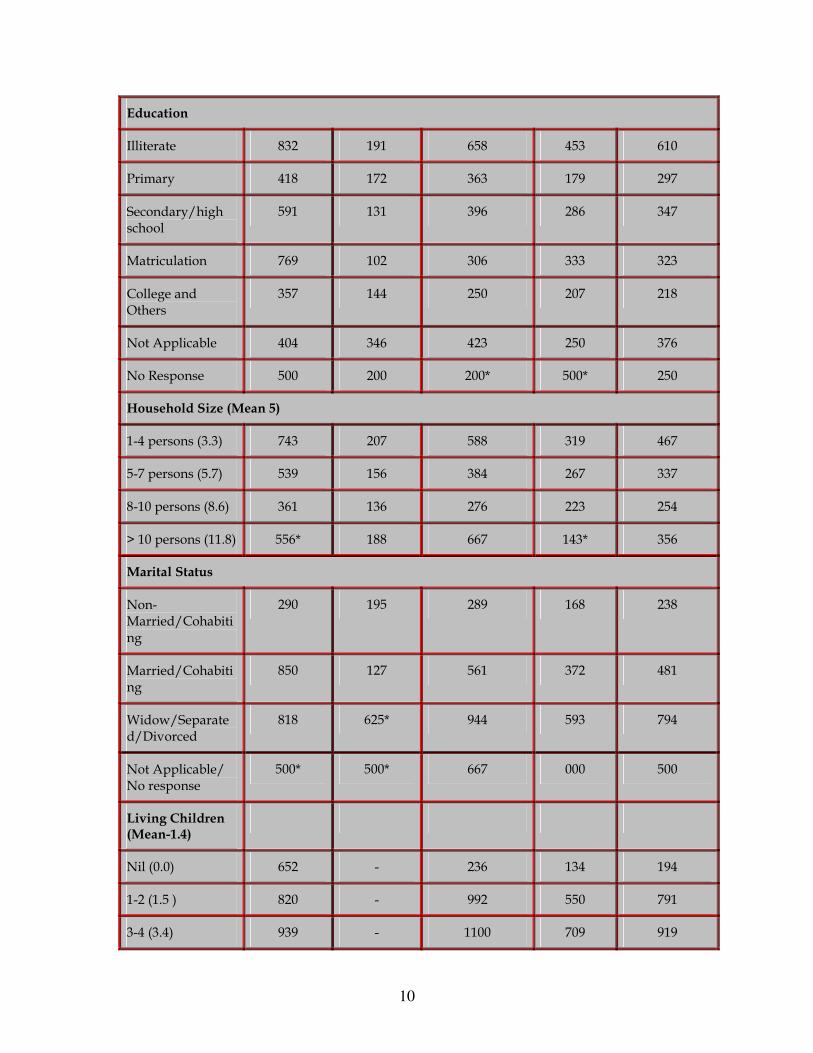
Education
Illiterate 832 191 658 453 610
Primary 418 172 363 179 297
Secondary/high school
591 131 396 286 347
Matriculation 769 102 306 333 323
College and Others
357 144 250 207 218
Not Applicable 404 346 423 250 376
No Response 500 200 200* 500* 250
Household Size (Mean 5)
1-4 persons (3.3) 743 207 588 319 467
5-7 persons (5.7) 539 156 384 267 337
8-10 persons (8.6) 361 136 276 223 254
> 10 persons (11.8) 556* 188 667 143* 356
Marital Status
Non-Married/Cohabiting
290 195 289 168 238
Married/Cohabiting
850 127 561 372 481
Widow/Separated/Divorced
818 625* 944 593 794
Not Applicable/ No response
500* 500* 667 000 500
Living Children (Mean-1.4)
Nil (0.0) 652 - 236 134 194
1-2 (1.5 ) 820 - 992 550 791
3-4 (3.4) 939 - 1100 709 919

11
> 4 (6.1) 882 - 741 846* 775
Not Applicable 285 - 286 166 236
No Response 714* - 2000* 143* 556
Earning Status
Housework 810 - 971 583 810
Non-earner 230 171 241 151 198
Earner 774 127 249 219 236
Not Applicable/ No Response
404 291 387 226 341
Type of Occupation
Student 223 171 228 162 196
Unemployed 417 169 326 108 236
Housework 811 - 974 579 811
Unskilled and Hawker
750 96 338 263 312
Skilled and Service
877 144 228 247 235
Professional and Business
500 67 235* 132 151
Not applicable 402 335 410 253 368
No Response 500 143 214 111 174
Location of Work
Own home 790* 238* 909 557 768
Place-to-Place 1087 85 365 368* 366
Small establishment
705 140 194 210 200
Large establishment/government
476* 115 146 183 172

12
Not Applicable 279 211 294 170 242
No Response 2000* 53* 250* 000* 150
Note: Morbidity Prevalence Rate = (Number of Episodes/Number of Individuals) ´ 1000
*For these figures sample size (N) is less than 30.
We find that in each and every age group, including children below five years, female morbidity is higher than male morbidity. In addition to this, we find that the gap between male and female morbidity increases with every age group. While female morbidity is 6 percent higher in children below five years, it is 264 percent higher among females above 45 years in age (excluding episodes recorded after probing).
Likewise, we also find a wide variation in the distribution of illness among the different age groups in males and females. Among the males, predictably, we find morbidity to be highest among the under five population (361 per thousand). It steadily declines among the older males before rising among men between 36 and 45 years (188 per thousand). Among the eldest age group, it declines marginally to 160 per thousand. As women are the main respondents in this study, it is very likely that child morbidity has been better recorded, while the illness of adult males has been under-reported. If we make allowance for these reporting errors, we are likely to see the characteristic 'U' shape curve in male morbidity. This means that morbidity at both ends of the life span is high.
For the female population, we see an entirely different pattern emerging. We see a steady rise in the morbidity rates with age. We find that the morbidity rates among female children are relatively much lower than those among adult women. It can also be observed that the rates continue to rise till the women reach the age of 45 years, after which they decline to a small extent. Excluding data gathered through the use of the probe list does not radically alter this pattern because we find that women in and beyond the reproductive age, who report the largest number of illnesses with probing had already reported very high morbidity initially. The high morbidity among women in the reproductive age, which was earlier only hinted at, is revealed very clearly in this study.

13
To complement the evidence from the age wise analysis of morbidity, we also see the contribution of reproductive labour in the rates of morbidity reported by ever married and never married women. Cohabiting women reported a morbidity rate of 850 and other ever married women a rate of 818. This is in sharp contrast to the rate of 290 for never married women. Although we did not record the obstetric history of the women respondents, we recorded the number of living children for all ever, married women. We also find a positive link between the number of living children and female morbidity. The morbidity rate for married women with no children is 625, while for those with 3-4 living children it is 939.
The effect of economic labour is also very apparent in the data on female morbidity. As the numbers of employed women were very small, it is not feasible to analyse morbidity in the context of the type of work done. However, even when we consider merely the work status of women, we find a strong correlation between labour and morbidity. In the total female population, non -earners (students, and non-employed girls below 12 years) have the lowest morbidity rates (230). Housewives recorded a morbidity of 810, while those women who also earned an income had a morbidity rate of 774. However, when we consider women from the same living environment (slum, non-slum), Table 3 we find that women who are employed have higher rates of morbidity than housewives in the same environment. Nuclear families with only one adult woman in every household is the most common family organisation to be observed in the city. As there is no distribution of housework between men and women, that one woman must bear the entire responsibility for running the house. When such a woman seeks employment either by working at home or outside, the strain of paid work is merely added on to her existing workload. We find that among women living in slum as well as non-slum households, employed women have higher morbidity rates than housewives in the same group. Thus, the additional burden of earning an income tends to increase the risk of morbidity for all women.
Table 3
Sample Characteristics
Morbidity Prevalence Rates
(Per Month Per 1000 Individuals)
All Individuals
Females Males
Slum Non-Slum Slum Non-Slum
Number (Total 363 684 424 201 123

14
= 3149)
Age (in Years)
0-4 373 400 349 458 108
5-11 197 248 182 211 114
12-17 226 468 161 137 150
18-25 408 912 342 149 101
26-35 469 1052 595 95 110
36-45 494 956 810 200 175
>45 414 1042 644 237 123
No Response 154 2000* 000* 000* 000*
Education
Illiterate 610 905 608 209 125*
Primary 297 526 239 204 111
Secondary/High-School
347 704 460 141 118
Matriculate 323 1313* 629 73 125
College and Others
218 1400* 277 128 153
Not applicable 376 408 395 438 88
No Response 250 000* 1000* 222* 000*
Household Size (Mean 5)
1-4 Persons (3.3) 467 921 519 267 134
5-7 Persons (5.7) 337 624 420 1780 122
8-10 Persons 254 402 309 149 113
>10 Persons(11.8)
356* 1222* 222* 333* 59*
Marital Status

15
Not-Married/Cohabiting
238 337 227 251 116
Married/Cohabiting
481 1026 621 129 1232
Widow/Separated/Divorced
794 1000* 593 600* 667*
Not Applicable/ no Response
500 1000* 000* 500* -
Living Children (1-4)
Nil(0.0) 194 881 250* - -
1-2(1.5) 791 1000 589 - -
3-4(3.4) 919 1134 714 - -
>4 (6.1) 775 886 875* - -
Not Applicable 236 333 223 - -
No Response 556 4000* 167* - -
Earning Status
Housework 810 971 583 - -
Non-earner 198 291 167 200 136
Earner 236 980 613 139 111
Not Applicable Response
341 418 368 362 127
Type of Occupation
Student 196 266 179 194 144
Unemployed 236 529* 143* 229 100
Housework 811 974 579 122 41
Unskilled and Hawker
312 818* 643* 122 41
Skilled and 235 1120* 688 142 148
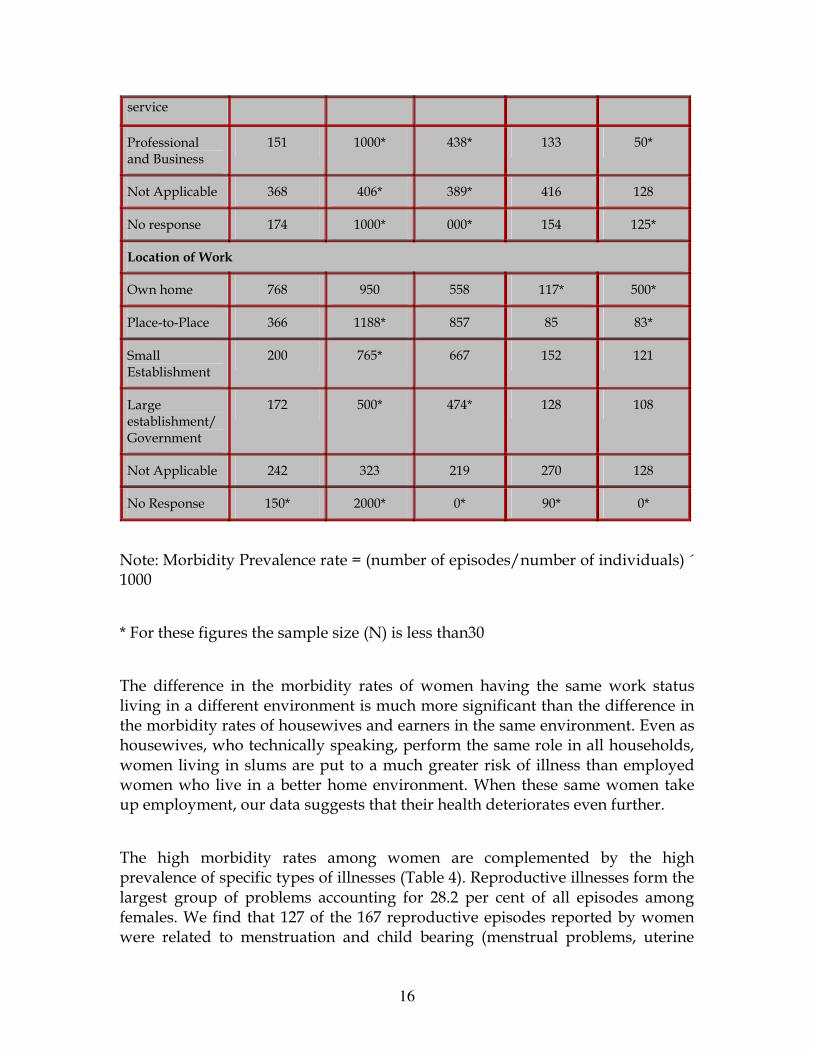
16
service
Professional and Business
151 1000* 438* 133 50*
Not Applicable 368 406* 389* 416 128
No response 174 1000* 000* 154 125*
Location of Work
Own home 768 950 558 117* 500*
Place-to-Place 366 1188* 857 85 83*
Small Establishment
200 765* 667 152 121
Large establishment/Government
172 500* 474* 128 108
Not Applicable 242 323 219 270 128
No Response 150* 2000* 0* 90* 0*
Note: Morbidity Prevalence rate = (number of episodes/number of individuals) ´ 1000
* For these figures the sample size (N) is less than30
The difference in the morbidity rates of women having the same work status living in a different environment is much more significant than the difference in the morbidity rates of housewives and earners in the same environment. Even as housewives, who technically speaking, perform the same role in all households, women living in slums are put to a much greater risk of illness than employed women who live in a better home environment. When these same women take up employment, our data suggests that their health deteriorates even further.
The high morbidity rates among women are complemented by the high prevalence of specific types of illnesses (Table 4). Reproductive illnesses form the largest group of problems accounting for 28.2 per cent of all episodes among females. We find that 127 of the 167 reproductive episodes reported by women were related to menstruation and child bearing (menstrual problems, uterine

17
prolapse, low back ache and lower abdomen pain). Reproductive health problems of above nature are often linked to nutritional deficiency problems which are also manifested as weakness. Pain of the extremities which is indicative of poor nutrition accounted for 36 of the 74 episodes related to aches, pain and injuries reported by women. Also taken together reproductive problems, pains and injuries and weakness all of, which are interrelated, form 51.69 percent of all illnesses reported among women. Thus, we see that these three types illnesses form a complex of gender related health problems.
TABLE 4
Type of Illness
Female Col Per Cent
Male Col Per Cent
Total Col Per Cent
Reproductive problems
167 28.21 167 21.41
Aches, pains
74 12.50 24 12.77 98 12.56
Weakness 65 10.98 4 2.13 69 8.85
Fever 67 11.32 40 21.28 107 13.72
Respiratory problems
115 19.43 23 12.23 200 25.64
GIT problems
44 7.43 85 12.23 67 8.59
Problems of sense organs
31 5.24 5 2.66 36 4.62
Others 29 4.90 7 3.72 36 4.62
Total 592 100.00 188 100.00 780 100.00
Note: Others include mental stress, anxiety, piles, bladder stone, kidney problems, involuntary urination, diabetes, hair loss, heart problems, blood pressure, paralysis, tumor and unspecified symptoms.

18
TABLE 5
Female (N = 1036) Male (N=1113)
Without probe Total
Type of Illness Reported
Persons III Persons III Chi Sq Sig Persons III Chi Sq Sig
Reproductive problems
0 34 .00000 144 .00000
Aches, pains and injuries
23 27 .406 72 .00000
Weakness 2 13 .00278 62 .00000
Fever 39 60 .01148 66 .00207
Respiratory problems
84 105 .03429 114 .00563
GIT problems 23 35 .06076 44 .00366
Skin, eye, ear problems
5 16 .00991 29 .00007
Others 7 15 .0594 29 .00009
Total persons reporting illness
174 263 397
Notes: Figures for women are with and without probing.
*Total number of persons = 2,149
TABLE 6
Number of Episodes Reported by Women Type of Illness
Without Probing
With Probing Not Applicable
Total Per Cent Reported with Probing

19
Reproductive problems
36 130 1 167 77.84
Aches, pains and injuries
21 47 6 74 63.51
Weakness 12 52 1 65 80.00
Fever 47 7 13 67 10.45
Respiratory problems
58 9 48 115 7.83
GIT problems 22 9 13 44 20.45
Skin, eye, ear problems
16 13 2 31 41.94
Others 14 14 1 29 48.28
Total persons reporting illness
226 281 85 592 47.47
Summaries of Age by levels of Variable
NLIVCHR1 Value
Age of person No-of-liv-child Label
Mean Std Dev Cases
For Entire Population
21.6757 15.9277 1036
NLIVCHR1 1 Nil 22.2879 8.9902 66
NLIVCHR1 2 1-2 30.3592 11.7248 206
NLIVCHR1 3 3-4 35.4917 9.2042 181
NLIVCHR1 4 > 4 43.9412 14.0860 68
NLIVCHR 8 NA 09.6417 7.8866 508
NLIVCHR1 9 NR 60.1429 14.8035 7
Total Cases = 1036
20
When we consider the gender differences in the type of illnesses reported without probing, we find significant differences in the level of morbidity in every category among men and women( Table 5). Women have reported remarkably higher levels of almost all types of illnesses. In only one category aches, pains and injuries, we find that the gender differences is not significant. When combined with the information received after probing the correlation between gender and morbidity increases even further.
As anticipated, the high reporting of reproductive and related morbidity was achieved largely through the use of the probe list (Table 6). For example, only 37 of the 167 episodes of reproductive health problems were reported without probing. For the three 'gender related' categories that we have identified, 75 percent of the episodes were reported with probing. In contrast, not surprisingly, for the categories of respiratory illness, GIT problems and fevers, probing did not result in a significant increase in reporting. But we find that women reported significantly more episodes in these categories as well. Thus, the finding that women reported these types of illnesses much more frequently than men is very significant. This suggests that being female increases not merely the risk of reproductive and related morbidity, but also the likelihood of suffering from general health problems.
Environment
When we study the impact of the environment on health, we see the most consistent pattern in morbidity (Table 3). Living in a slum adversely affects the health of all individuals regardless of gender, age and work status. The morbidity rates of slum dwellers of all age groups are more than double those of their counterparts in non-slum households. The only exception being males in the age group of 12-17 and 26-35 years. We also find the same difference in the morbidity rates of both males and females, non-workers and employed persons. The overall morbidity rates for slum dwellers were recorded as 429, as compared to 272 for non-slum dwellers. Remarkably the effect of this variable (living environment) is to increase the quantum of morbidity for each group. The correlation of morbidity with age, gender, marital status and work status is maintained within the same living environment. Thus, while the morbidity rates for housewives in the slum is as high as 971 (compared to 583 among non-slum housewives), it is even higher for earning women at 980. Likewise, non-slum earning women have a higher morbidity of 613, compared to housewives in the same living environment.

21
The analysis of morbidity in relation to the living environment shows the high degree of variation existing within groups defined according to work status, gender and marital status regardless of their living environment.
Although the non-slum population comprises 42 percent of the sample, their illness accounts for only 31.79 percent of the total morbidity (Table 7). Surprisingly, there is no significant variation in the morbidity pattern across the various categories of illness. In most cases the variation is marginal. It would seem logical to assume that diseases, which have an association with pollution and lack of hygiene would be more dominant in slum environment in comparison to other illnesses. On the contrary, we find that respiratory illnesses, GIT tract infections and fevers form almost exactly the same proportion of total morbidity in both the slum and non-slum populations.
TABLE 7
Slum Non-Slum Type of Illness
Episodes A B Episodes A B
Total Episodes
Reproductive problems
124 108 97 43 82 70 167
Aches, pains 61 91 57 37 120 41 98
Weakness 48 102 40 21 97 29 69
Fevers 73 100 62 34 101 45 107
Respiratory problems
137 100 116 63 100 84 200
GIT problems 46 100 39 21 99 28 67
Problems of sense organs
27 110 21 9 79 15 36
Others 18 73 21 18 159 15 36
Total 534 452 246 328 780
Notes: Columns A indicate the variation in the pattern of morbidity for each living environment (mean = 100), for example, 100 indicates that `fevers'

22
constitute the same proportion of morbidity in the slum population as in the total population.
Columns B indicate expected frequencies for each type of morbidity.
Other include mental stress, anxiety, piles, bladder stone, kidney problems, involuntary urination, diabetes, hair loss, heart problems, blood pressure, paralysis, tumour and unspecified symptoms.
We find that slum dwellers suffer more frequently from all types of illnesses. Overall, morbidity among the slum population is 10 per cent higher than among the total population. However: this increase is uniformly distributed across all the types of illnesses. In all categories of illness, apart from 'others', the share of the morbidity of slum dwellers is higher by 10 to 16 per cent than their share in the total population. In the categories of 'aches, pain and injuries' the disparity is less significant (4 per cent). The category of 'other' problems which includes a wide range of non-infectious, chronic health problems has been reported as often by slum and non-slum dwellers.
Overall, it is a relatively minor group of health problems. This finding suggests that living in a degraded environment contributes to a general increase in ill health, rather than merely a rise in the incidence of specific diseases.
An analysis of the morbidity of women living in the slum shows that the morbidity rates among married women is 1,026. This implies that more that an episode was reported on average by every woman in this category. Among the ever-married women, those with 1-4 children reported equally high rates. Housewives and earning women both reported similarly high morbidity. Similarly high rates can be observed, when we look at the age wise morbidity, among women in the age group of 18-45 years.
When taken together, we find that married cohabiting women with children in the reproductive age who live in a slum environment are the most vulnerable to ill health. One of the obvious explanations for this high morbidity in slums is the degradation of the physical environment. Although the overall condition of the air, water and land in this area is very poor, the effects of those are exacerbated by the congestion and hygiene in the slums. Slum dwellers are brought more often into contact with toxins in the air, water and soil due to the open sewers,

23
unpaved lanes, impermanent house structures and the use of common toilets and water taps.
Apart from the general hardships of living in an area with a degraded environment and the lack of space, light and fresh air, women in slum areas also suffer from many other disadvantages. As noted earlier, reproductive labour for women constitutes a crucial aspect of their work lives. The slum household as a workplace is understaffed, overutilised and deprived of the most basic facilities. We found that among non-slum households, water from even common taps could be drawn directly through plastic pipes. In the slums, due to the longer distance and greater number of users of taps, water had to be carried home in large vessels. The open drains in the slums were invariably clogged with solid waste thrown into them and had to be frequently cleaned by the women themselves. Due to the long queues at the municipal toilets, small children were made to defecate outside the house and the women were naturally responsible for cleaning the place after that. In the absence of specified area for garbage disposal, women had to be vigilant against the dumping of waste near their houses by others. As the lanes were not paved, the house was surrounded entirely by dirt and sludge. The women fought a constant battle to keep these out of their houses. The environment of the slum makes it necessary for women to undertake a heavy burden of work merely to make the house livable.
Employed women in slums were either home based workers or worked in the small industrial units close by. Thus, they were exposed to an additional degraded environment through their paid work. They also faced a heavier work burden because employment does not free women from the responsibility of housework. Thus we find that they suffer from the highest level of morbidity.
This finding has a very important implication for the understanding of urban health problems. The high morbidity among slum dwellers, especially women, impresses on us the need to study 'slum' not merely as a physical environment, but also to examine the social, economic and even psychological pressures that these communities and their women face. Our field experience made it evident that destitution was not a widespread problem, even among the slum households. We found that, by and large, the households did not face any threats to survival. The income of all the households seemed adequate to fulfill the basic needs of food, clothing and shelter. What the slum households did experience was relative poverty as they form the margin of a highly developed and relatively prosperous urban economy. In the Indian context, the effect that relative poverty has on both the perception of illness and actual morbidity has never been explored.

24
Conclusion
Although, being a metropolitan city, the situation in Mumbai is very atypical, this study highlighted certain very interesting aspects in the methodology in health surveys and in the larger study of women's health.
This study indicated the gender-blindness of household level health surveys. When no importance is attached to the gender of the respondent and interviewer, the levels of morbidity reported for both males and females are almost similar. Due to the modifications that we made in the methodology, we were able to record a significantly higher burden of morbidity among women all the modifications that were made must be viewed in totality. It is not possible for us to estimate the effect of any single factor on the reporting of women's morbidity. The objective of the study was to create an environment which encouraged women to feel unhindered to speak about their health problems even while a deliberate attempt was being made to elicit information about unreported illness through the probe list. This impressed on us the need to be sensitive to women's perceptions about their health problems. Purely medical or even sociological categories of illness would prove inadequate to record the complexity of illness perceived by women. Although this fact has been stressed in almost all qualitative micro-studies on women's health, an attempt was made to integrate these insights into a quantitative study.
Knowledge about the factors which influence the perception of morbidity is deepened as the experiences of more and more studies accumulate. The relationship between the conscious demand for health care and the reporting of morbidity has been well established. Health care acquires a greater significance for households after the most basic need for food and shelter have been met as we encountered here. With changes in the level of development, the concept of illness too undergoes transformation. Economic development generates demand for goods and services which hitherto had never been felt or articulated. It has also been noted that the demand for health services increases with increasing economic development. In India, particularly in Mumbai, this demand is met primarily through the market which itself creates an acute awareness of health problems. There are no great variations in 'health awareness' among the different classes and among men and women due to the widespread exposure to media, the pervasive presence of health services and higher levels of education.
Thus, this analysis on perceived morbidity must be put in a relevant context. This prompts us to re-examine the relationship between morbidity and the

25
pressures of urban living. As stated earlier, morbidity is not merely an objective health indicator. Although, it would be wrong to automatically assume that actual morbidity is higher in Mumbai than in other parts of the country, the consciousness of ill health is certainly very acute. We find a population which is reporting an increasingly lower sense of 'well being'. We also find that the pressures of living in a marginalised community such as a slum are reflected sharply in the reporting of morbidity. This also prompts us to explore further into the health consequences of poverty for those who live on the social margins of the city.
In the context of our analysis of reproductive labour, this study points to a strong relationship between women's work lives and their health. No study of work and health among women can afford not to explore the household as a work place. For 90 per cent of the women (in this case), the household is the site where they engage in the task of fulfilling the household's economic as well as other needs. That all married women (and those with children more so reported significantly higher morbidity than other women is an indicator of the additional burden of morbidity that reproductive labour imposes. That this task becomes more demanding on their health within a degraded environment is very evident. This study points towards a need for more systematic study into women's health problems in relation to their work. Just as we observe the 'changes affecting other areas of work, in terms of technological changes, changes in labour organisation, etc, it would be incorrect to understand 'housework' as an unchanging routine of tasks. We must understand how the nature of reproductive labour is transformed by changes in the larger world which surrounds the household where it is undertaken. This would give valuable insights into the study of the health problems of women, who labour both in and outside the home.
[This paper is based on a study conducted by Centre for Enquiry in Health and Allied Themes with financial support from the Mac Arthur Foundation. We would like to acknowledge & contributions of our colleagues in the research team, Sunil Nandraj and Rupashri Sinha. We would also like to thank Anant Phadke and Ravi Duggal for their guidance, and all members of our field research team - Ratna, Jaya, Aarti, Savita, Vijay, Chhaya, Smita, Sunita, Mangala and Manisha]

26
References
1. Baroda Citizen's Council et al: Prevalence of Clinically Detectable Gyneacological Morbidity in India; Results from Four Community Based Studies (unpubilished).
2. Chant S (1992): 'Women and Poverty in Urban Latin America; Mexican and Costa Rican Experiences', London School of Economics and Political Science; United Kingdom.
3. Duggal R and Amin S (1989): 'Cost of Health Care: A Household Survey in an Indian District, FRCH, Bombay.
4. George A et al (1994): 'A study of Household Health Expenditure in Madhya Pradesh; FRCH, Bombay.
5. Gitellsohn et al (ed) (1994): Listening to Women Talk about Their Health; Issues and Evidences from India, Ford foundation, New Delhi.
6. Harvey L (1990):Critical Social Research, Unwin Hyman, London.
7. Kannan K P et al (1991): Health and development in Rural Kerala, KSSP, Trivandrum.
8. NCEAR (1992): 'Household Survey of Medical Care' NCEAR, New Delhi.
9. NSS (1992): 'Morbidity and Utilisation of Medical Services', NSS 42nd Round (1986-87), in Sarvekshana issue no 52, Volume XV, no4. April June, Government of India.
10. Shariff A (1995): 'Health Transition in India', working paper no 57, NCEAR, New Delhi
11. Sundar R (1995): 'Household Survey of Health Care Utilisation and Expenditure', working paper no 53, NCEAR, New Delhi.