st quarter fy19 results - acmkentico-prd.s3.amazonaws.com · stbs/odus are owned by astro, and are...
TRANSCRIPT

1st Quarter FY19 Results
6th June 2018

This document contains certain forward-looking statements with respect to Astro Malaysia Holdings Berhad’s (“Astro”) financial condition,
results of operations and business, and management’s strategy, plans and objectives for Astro. These statements include, without
limitation, those that express forecasts, expectations and projections such as forecasts, expectations and projections in relation to new
products and services, revenue, profit, cash flow, operational metrics etc.
These statements (and all other forward-looking statements contained in this document) are not guarantees of future performance and are
subject to risks, uncertainties and other factors, some of which are beyond Astro’s control, are difficult to predict and could cause actual
results to differ materially from those expressed or implied or forecast in the forward-looking statements. These factors include, but are
not limited to, the fact that Astro operates in a competitive environment that is subject to rapid change, the effects of laws and
government regulation upon Astro’s activities, its reliance on technology which is subject to risk of failure, change and development, the
fact that Astro is reliant on encryption and other technologies to restrict unauthorised access to its services, failure of key suppliers, risks
inherent in the implementation of large-scale capital expenditure projects, and the fact that Astro relies on intellectual property and
proprietary rights which may not be adequately protected under current laws or which may be subject to unauthorised use.
All forward-looking statements in this presentation are based on information known to Astro on the date hereof. Astro undertakes no
obligation publicly to update or revise any forward-looking statements, whether as a result of new information, future events or otherwise.
This presentation has been prepared by Astro. The information in this presentation, including forward-looking statements, has not been
independently verified. Without limiting any of the foregoing in this disclaimer, no representation or warranty, express or implied, is made
as to, and no reliance should be placed on, the fairness, accuracy or completeness of such information. Astro and its subsidiaries,
affiliates, representatives and advisers shall have no liability whatsoever (whether in negligence or otherwise) for any loss, damage, costs
or expenses howsoever arising out of or in connection with this presentation.
Disclaimer
1 | 1QFY19 results

• ARPU of RM99.6
• 39% to 44% TV Adex share
• 76% to 69% Radex share
• 5.2mn to 5.5mn households
• 71% to 75% household penetration
• 1.7mn Astro GO registered users
• 1.4mn Go Shop registered customers
• 3.5mn Tribe total downloads
• 6.7mn average monthly unique visitors
to digital assets
• Reach and scale via households and
individuals
• Content IPs and verticals
• Digital and commerce ventures
• Operational efficiencies
• Talent – on-air and digital
GROW
MONETISE
LEAD
INVEST
• 76% TV viewership share driven by
vernacular content
• 869K connected STBs
• 16.5mn weekly radio audience
1Q FY19 key performance highlights
2 | 1QFY19 results
Revenue -1%RM1.33bn→ RM1.31bn
FCF of RM338mn
-15% (from 399mn)
193% of PATAMI
Adex +6%RM143mn→ RM151mn
Norm. PATAMI -5%RM188mn→ RM179mn
EBITDA +0.2%RM460mn→ RM461mn

NB
(1) TV household data sourced from the
Department of Statistics Malaysia and
Media Partners Asia
(2) Household penetration comprises
residential Pay-TV customers and NJOI
customers
(3) Viewership share is based on DTAM
deployed by Kantar Media
(4) Audience measurement is provided by
GfK. Share of radex is based on internal
estimates
(5) Average monthly unique visitors to
Astro’s digital assets as sourced from
comScore
(6) Connected set-top boxes (STBs) are
connected to the internet and have
access to Astro’s On Demand library of
content
(7) Normalised PATAMI excludes post-tax
impact of unrealised forex gain/(loss)
1Q FY19: (RM 4m), 1Q FY18: RM 8m
(8) Data presented are for 1Q FY19
(9) Numbers may not add up due to
rounding differences
1Q FY19 year-on-year overview
3 | 1QFY19 results
Highlights 1QFY18 1QFY19 Growth
TV households (000s)(1) 7,234 7,355 2%
TV household penetration(2) 71% 75% 4pp
TV customer base (000s) 5,153 5,484 6%
Pay TV ARPU (RM) 100.8 99.6 -1%
Astro TV viewership share(3) 76% 76% -
Radio listenership (mn) (4) 15.6 16.5 6%
Average monthly unique visitors (mn)(5) 6.2 6.7 8%
Connected STBs (000s) (6) 572 869 52%
Revenue (RM mn) 1,326 1,311 -1%
EBITDA (RM mn) 460 461 +0.2%
EBITDA margin 35% 35% -
Normalised PATAMI (RM mn) (7) 188 179 -5%
FCF (RM mn) 399 338 -15%
EPS (RM sen) 3.8 3.4 -11%

Digital Assets
190 channels
• Largest Pay-TVoperator in SEA
• Serving 5.5mn households
• 75% household penetration
• 44% TV adex share• 869K connected STBs
• 6.7mn avg monthly unique viewers across over 25 digital assets
• Tribe & Tamago –regional plays with 7.0mn downloads cumulatively
• 24/7 shopping
experience
Malaysia &
Singapore
• 1.4mn registered
customers
• 11 radio brands
• 16.5mn weekly
audience
• #1 highest rated
stations across 4
key languages
• 69% radex share
ASEAN content & consumer company
11 radio brandsOTT (Over-The-Top) Service
4 | 1QFY19 results
TV DIGITAL RADIO COMMERCE CONTENT
• Content producer &
aggregator
• Investing in content
verticals with
regional reach
• Produced 12K hours
of content in FY18

1.21.7
1Q FY18 1Q FY19
3.64.7
1Q FY18 1Q FY19
127 203
1Q FY18 1Q FY19
Avg. Monthly Viewing (mins)App Downloads (1) (mn)Registered Users (1) (mn)
+43%+31%
+60%
Note:
(1) Cumulative count since inception Cumulative
(2) Connected boxes are set-top box connected to the internet and have access to On Demand library of content
572869
1Q FY18 1Q FY19
Total Connected STBs (1)(2)
(000s)
+52%
2
11
1Q FY18 1Q FY19
Total OD Downloads (mn)
+450%
246374
1Q FY18 1Q FY19
Avg. Weekly Viewing (mins)
+52%
5 | 1QFY19 results
Growing Viewing on Multi-screens and On Demand…

24%
76%
TV Viewership Share
3:48 3:37
2:08 2:07
1Q FY18 1Q FY19
Avg. Time Spent/Day
13.512.8
7.6 7.0
1Q FY18 1Q FY19
Avg. Daily Viewers (mn)
Astro FTA
190channels
73Astro-branded
channels
31channels
NB
(1) Number of channels as at 1Q FY19
(2) Target Audience: Kantar Media, Dynamic TV Audience Measurement (DTAM). All Astro Pay-TV viewers.
-5%
-8%
-5%
-1%
Pay-TV NJOI
6 | 1QFY19 results
…while maintaining our TV viewership share

1,121 1,140 1,149 1,107 1,076
143 208 175
196 151
62
70 73 85
84
1Q FY18 2Q FY18 3Q FY18 4Q FY18 1Q FY19
Go Shop
Adex
Subscription/Others
Revenue resilient underpinned by growth drivers
35%
6%
(4%)
(RM mn)Total revenue YoY growth(2)
NB
(1) Disclosed as Subscription revenue and Other revenue in our financial statements, includes revenue streams such as TV
subscription, licensing income, programme sales, NJOI revenue and theatrical revenue
(2) YoY refers to 1Q FY18 vs. 1Q FY19
(3) Numbers may not add up due to rounding differences
(1%)
(1)
1,326
1,420 1,397
7 | 1QFY19 results
1,388
1,311

71
120
96 112
83
72
89
79
84
68
1Q FY18 2Q FY18 3Q FY18 4Q FY18 1Q FY19
TV Radio
1Q FY18 1Q FY19
Adex growth amid industry contraction
Advertising income (RM mn) YoY growth(2)
(6%)
17%
(1)
Total Malaysia
gross ADEX YoY
growth
OVERALL ADEX
(1%)
RADIO
2%
TV
3%
(2)(5)
69%
1Q FY18 1Q FY19
Share of Radex
Share of TV adex
Radio listeners (mn) (3)
76% 76%
1Q FY18 1Q FY19
Astro TV
viewership share (4)
NB
(1) Advertising income is net of commissions and discounts. Digital adex is included in TV and Radio adex.
(2) YoY refers to 1Q FY18 vs. 1Q FY19
(3) Audience measurement is provided by GfK. Share of radex is based on internal estimates
(4) Viewership share is based on DTAM deployed by Kantar Media. Share of TV adex is based on Astro and Group M’s estimates
(5) Malaysia gross adex figures are based on Nielsen and Group M’s data
(6) Numbers may not add up due to rounding differences
15.66% 16.5
143
39%44%
1Q FY18 1Q FY19
208
175
8 | 1QFY19 results
196
151
76%

405 353 447 408 352
624 690
706 778
665
1Q FY18 2Q FY18 3Q FY18 4Q FY18 1Q FY19
Content costs Other expenses
1,017
Cost optimisation remains a key focus
(RM mn)Total operating expenditure
NB
(1) Content costs are disclosed as part of cost of sales in our financial statements
(2) Other expenses include marketing and distribution costs, administrative expenses, STB installation and smartcard costs,
depreciation and amortisation, as well as maintenance costs
(3) Numbers may not add up due to rounding differences
34%
Content cost as % of TV
revenues
1,029 1,043
28%
1,153
36%
9 | 1QFY19 results
1,186
33% 30%

NB
(1) Data presented are for 1Q FY19
(2) Numbers may not add up due to rounding differences
Applying ROI discipline in capex spend
2% 2%as % of
revenue
(RM mn)
54 45
1Q FY18 1Q FY19
3%4%as % of
revenue
(RM mn)
Key capex investments in FY19 include:
▪ Technology infrastructure
▪ Customer experience
▪ Product and service upgrading
Capex STBs
▪ STBs/ODUs are owned by Astro, and are capitalised
▪ STBs/ODUs are conservatively amortised over 3 years;
note that actual useful life is typically greater than 5
years
▪ Discretionary 36 month bullet payment vendor
financing is available for Astro for STB/ODU purchases
▪ RM703mn of vendor financing recorded in payables, of
which RM283mn is current and RM420mn is non-
current
10 | 1QFY19 results
24 27
1Q FY18 1Q FY19

Strong and stable cash generation capabilities
508 452
109
115
399 338
Cash fromoperations
Cash frominvesting
Free cash flow Cash fromoperations
Cash frominvesting
Free cash flow(2) (3) (3)(2)
204% 193%as % of PATAMI
(RM mn)
1Q FY18 1Q FY19
Free cash flow
…enabling significant flexibility on capital management and dividend policy
NB
(1) Data presented are for 1Q FY19
(2) Excludes investments, disposals and maturities of unit trust and money market funds
(3) Excludes repayments of vendor financing and payments of finance leases, which are categorised as cash from financing
for consistency with Bursa disclosure
(4) Numbers may not add up due to rounding differences
11 | 1QFY19 results

▪ Leveraging on invested capital, AMH continues to be highly cash generative
▪ The Board of Directors of AMH has declared a quarterly dividend of 2.50 sen per share for 1Q FY19
▪ Quarterly dividend entitlement and payment dates: 25 June 2018 and 6 July 2018 respectively
Quarterly dividend announcement
12 | 1QFY19 results
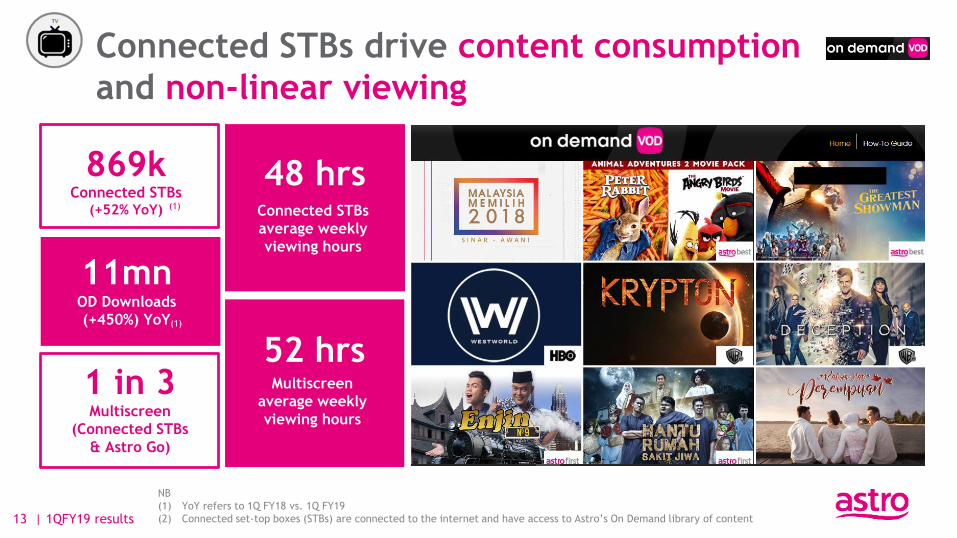
Connected STBs(+52% YoY)
869k
11mnOD Downloads
(+450%) YoY
Multiscreen
(Connected STBs
& Astro Go)
1 in 3
Connected STBs
average weekly
viewing hours
48 hrs
Multiscreen
average weekly
viewing hours
52 hrs
Connected STBs drive content consumption
and non-linear viewing
NB
(1) YoY refers to 1Q FY18 vs. 1Q FY19
(2) Connected set-top boxes (STBs) are connected to the internet and have access to Astro’s On Demand library of content
(1)
13 | 1QFY19 results
(1)
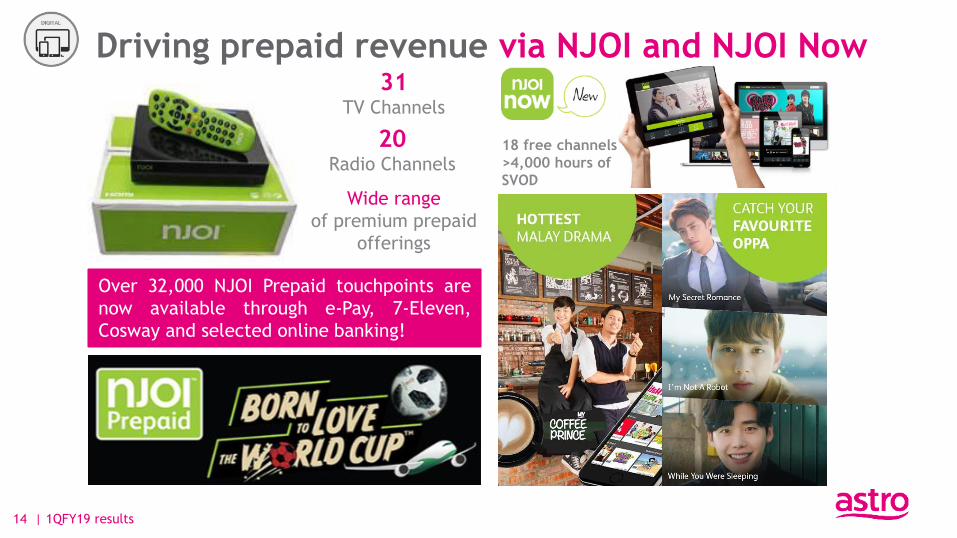
Driving prepaid revenue via NJOI and NJOI Now
14 | 1QFY19 results
Over 32,000 NJOI Prepaid touchpoints are
now available through e-Pay, 7-Eleven,
Cosway and selected online banking!
31TV Channels
20Radio Channels
Wide range
of premium prepaid
offerings
18 free channels
>4,000 hours of
SVOD

15 | 1QFY19 results
Content differentiation driving sales
NB
(1) Cumulative as of 1Q FY19
62 84
1Q FY18 1Q FY19
Revenue(1)(RM mn)
35%
1,036 1,418
1Q FY18 1Q FY19
37%
Registered Customers(1)
(‘000)
• Introduction of Channel 120 has
increased traction
• Simulcast events and increasing live
hours from 4 to 6.5 hours have driven
brand awareness leading to improved
sales
• Launch of Malay New Arrival
programme and Go News segment for
latest promotion announcement
• Content differentiation initiatives such
as branded content and tactical events
have driven content viewership and
sales
Malay (Ch. 118 & Ch. 120) & Chinese language
(Ch. 303) home shopping channelsNo.1

16 | 1QFY19 results
Expanding regionally via Tamago and Tribe
0
3.5
1Q FY18 1Q FY19
Total downloads(1) (mn)
NB
(1) Cumulative as of 1Q FY19
• Launch of Telkomsel
partnership which
provides us access to
over 20mn Videomax
customers
• Release of two Original
Series Dosa and
Mandatori during
Telkomsel launch
• Original collaboration
shows between
Indonesia and ASEAN
countries
In Feb 2018, Tamago
launched Ka-Chinggg, its
biggest contest to-date to
give its users a chance to
win a share of RM1mn
A live streaming app
with interactive
features focusing on localised ASEAN
user generated content,
virtual gifting and real
interactions
1.3
3.5
1Q FY18 1Q FY19
Total downloads(1) (mn)
+175%

44.4 46.1
129
4.9 5.3 8.8
Mar-18 Apr-18 May-18
UsersScreenviews
3.6 3.98.1
Mar-18 Apr-18 May-18
Page Views
Users
Awani app
17 | 1QFY19 results
www.astroawani.com
(In ‘000)
(In million)
17.0 18.2
42.5(In million)
+134% +180%
+108%
+66%
9.2 mn on 10 May834K viewson 1-15 May
Traffic surged on Astro GO
and digital platforms
Round the clock extensive coverage as Malaysians cast their votes in the recently held General Elections
1.4 mn on 9 May
Record breaking TV viewership for GE14
Unique TV Viewers

7.3 mnviews
Across all Gempak
platforms
18 | 1QFY19 results
Viewership
3.3 mnTV ratings
DTAM Kantar Media
Digital
362Kviews
On Demand
213KTitle views
On Ground
1K
On Ground
2KFans at meet &
greet session
Across all Gempak
platformsFans at book
signing session
Overtaking last year’s highest rated drama
On Demand
332KTitle views
DigitalViewership
3.1 mnTV ratings
DTAM Kantar Media

Produced in 2006 and
finally released on 5th
April 2018 across
130screens
Dain Said’s directorial debut and
starring Umie Aida and
Faizal Hussein
Viral video #perempuankebayamerah
reached
20 mn views
in 24 hours
Total box office
revenue of
RM11mnand growing
Planned theatrical
release in
Indonesia in August
19 | 1QFY19 results
Dukun - the most anticipated movie since 2006

NUSANTARA KIDS ESPORTSPremium Nusantara
original series & movies
Transmedia kids and animation
content with Asian values
The next wave of sports
for the millennials
HORRORAsian horror original series
and movies
• Partner with top Indonesian
talents
• Polis Evo 2 slated for this
year
• Collaborate with Malaysian
animation studios
• Adapt/dub for regional &
global distribution
• Licensed content to Indonesia
& Singapore (Didi & Friends),
Amazon USA (Cam & Leon) and
Indonesia (Oma & Hana)
• Collaborate with top
production houses in SEA
• Series was licensed to 7
countries
• BOO channel was distributed to
Singapore, the Philippines,
Vietnam & Myanmar
• Landed in 8 countries
• Recruit regional influencers
as key talents
• Collaborate with the world
top game developers
• Partner regional event
organisers for regional
tournaments
To win over IndonesiaTo own monetisable regional
kids IPS
To develop and distribution
Asian-centric horror IPSLand grab with the Millennials
Deepening Content Ownership and Going Regional
20 | 1QFY19 results

First Time Ever Coverage
Showcased 2 major sporting events
1.4 mnunique viewers
47KAstro GO views
TV4 dedicated channels
for around the clock
coverage
OTTSimulcast Olympics
exclusive channels
Source: TV viewers is based on Kantar Media DTAM. AG is based on Conviva.
21 | 1QFY19 results
862KAstro GO views
TV6 dedicated channels
for around the clock
coverage
OTTSimulcast Olympics
exclusive channels
9.3 mnunique viewers
( +15%)
Most Watched Commonwealth Games Ever

World Cup 2018 – all 64 matches live on HD
14 Jun – 15 Jul41matches on
Astro Arena open
to all subscribers
Available on Astro
GO and NJOI now to
non-Astrosubscribers
On Demand All matches,
highlights
and magazine
shows
22 | 1QFY19 results
64matches live on
Astro
37 Exclusive
1st VR 180° live stream
and 360°VOD
Exclusive content
via
digital platform

Appendix

(RM mn) 1Q FY18 1Q FY19
EBITDA 460 461
Margin % 35% 35%
Depreciation and amortisation (160) (165)
EBIT 301 296
Margin % 23% 23%
Finance income 20 12
Finance cost (51) (74)
Share of post tax results from investments 0 0
PBT 270 235
Tax expense (77) (61)
Tax rate % 29% 26%
PAT 192 174
PATAMI 196 175
Margin % 15% 13%
Normalised PATAMI 188 179
Margin % 14% 14%
NB
(1) Depreciation and amortisation
excludes the amortisation of film
library and programme rights which is
expensed as part of content costs (cost
of sales)
(2) Normalised PATAMI excludes post-tax
impact of unrealised forex gain/(loss)
1Q FY19: (RM 4m), 1Q FY18: RM 8m
(3) Numbers may not add up due to
rounding differences(2)
(1)
PAT reconciliation
24 | 1QFY19 results

(RM mn) FY18 1Q FY19
Non-current assets 4,807 4,715
Property, plant and equipment 2,401 2,319
Other non-current assets 2,406 2,396
Current assets 2,041 2,284
Receivables and prepayments 1,012 903
Cash and bank balances(1) 962 1,312
Other current assets 67 69
6,848 6,999
(RM mn) FY18 1Q FY19
Non-current liabilities 3,791 4,107
Payables 390 420
Borrowings 3,319 3,601
Other non-current liabilities 82 86
Current liabilities 2,404 2,208
Payables 1,653 1,486
Borrowings 646 651
Other current liabilities 105 71
Shareholders’ equity 653 684
6,848 6,999
Net debt / LTM EBITDA: 1.6x
NB
(1) Includes money market unit trusts
(2) Numbers may not add up due to rounding differences
Balance sheet overview
25 | 1QFY19 results

1,593
615
303
1,054
687
1QFY19
Finance lease SFCL
Unrated MTN RM term loan
USD term loan
(RM mn)Total borrowings
Total borrowings of RM4,252mn is
net of debt issuance costs (RM6mn)
Debt profile
USD term
loan
RM term
loan
Finance lease
(primarily
satellite
transponders)
▪ As at 30 April 2018, outstanding principal US dollar term loan stood at USD173.3mn
▪ First drawdown date on 8 June 2011, amortised repayment schedule with final maturity
date on 8 June 2021. Average life: 7 years
▪ Fully hedged via cross currency interest rate swap at an exchange rate of USD/RM3.0189
and an all-in interest rate of 4.19% p.a.
▪ The tenth principal repayment of USD24.75mn (RM74.72mn) is scheduled to be paid on 8
June 2018
▪ As at 30 April 2018, total outstanding principal RM term loan stood at RM1,050mn.
▪ First drawdown date on 19 May 2011, amortised repayment schedule with final maturity date
on 19 May 2021. Average life: 7 years
▪ All-in interest rate (post-hedging) for the hedged portion of RM787.5mn is 5.47% p.a. while
balance unhedged of RM262.5mn stood at 4.89% p.a. (variable floating rate based on cost of
funds)
▪ The eleventh principal repayment of RM150mn is scheduled to be paid on 19 November 2018
▪ Finance lease related to lease of Ku-band transponders on MEASAT-3, MEASAT-3A and
MEASAT-3B. Payment arrangement for the remaining contractual years for M3 and M3A
have been redenominated into Ringgit at USD/RM3.0445 w.e.f. 21 May 2013. The unhedged
portion of the finance lease related to M3B is USD287mn
▪ Effective interest rate: 6.2%, 4.6%, 12.5% and 5.6% p.a. for
M3, M3-T11, M3A and M3B respectively, average life: 15 years
Unrated MTN
▪ The first series of notes under the unrated medium-term notes (MTN) programme of up to
RM3.0bn in nominal value for up to 15-year tenor was issued on 10 August 2017. The
issuance was for RM300mn with a 5-year tenor at fixed rate of 5.30% p.a. with semi-annual
coupon payment
▪ Bullet repayment on 10 August 2022
26 | 1QFY19 results
Synthetic
Foreign
Currency
Loan (SFCL)
▪ The USD150mn SFCL facility of 4 years 11 months tenor amounted to RM612.7mn upon
conversion at the agreed exchange rate of USD/RM4.0850
▪ Drawn down in 2 tranches of RM306.4mn each on 29 December 2017 and 28 February 2018
respectively, at a fixed rate of 4.80% p.a. with quarterly interest payment
▪ Bullet repayment on 29 November 2022

Thank you