stada company presentation november 2016 · stada corporate presentation • november 2016 page...
TRANSCRIPT
CORPORATE PRESENTATION November 2016

Page STADA Corporate Presentation • November 2016 2
STADA STRATEGY TAPPING OUR FULL POTENTIAL
Delivering growth
Ready for change

Page STADA Corporate Presentation • November 2016 3
NEW CORPORATE CULTURE AND STRUCTURE NEW LOGO AS SYMBOL OF CHANGE AND RENEWAL
New Group-wide incentivization model
Greater degree of transparency
Improved networking of individual business units
New Group structure
Enhance culture to further
boost company performance

Page STADA Corporate Presentation • November 2016
READY FOR CHANGE – DELIVERING GROWTH BUILDING ON EXISTING BUSINESS AND NEW INITIATIVES
Generic base business
Biosimilars, niche areas, special therapy areas
Branded base business
New corporate culture and structure
Internationalization of brands
Focused M&A strategy
Streamline portfolio/ reduce costs
Reorganization and reallocation of resources
Efficiency gains
Change
Grow
4

Page STADA Corporate Presentation • November 2016
2,115 2,600
2015 2019e
5
Sales1
€m
EBITDA2 Net income2
389 510
2015 2019e
166 250
2015 2019e
CAGR ’15-’19 +5% CAGR ’15-’19 +7% CAGR ’15-’19 +11%
€m €m
1) Adjusted for currency and portfolio effects. 2) Adjusted for special items.
GROUP MID-TERM GUIDANCE 2019

Page STADA Corporate Presentation • November 2016
Organic growth existing business
6
ASSUMPTIONS GROUP MID-TERM GUIDANCE 2019
Stable tax environment and current interest levels
Constant exchange rates
Stable regulatory environment for generics business
Guidance range: +/- 5%

Page STADA Corporate Presentation • November 2016
REFINED STRATEGY BUILD ON GENERICS, EXPAND BRANDED PRODUCT BUSINESS AND STRIVE FOR ADDITIONAL GROWTH OPPORTUNITIES
2015 2019
BRANDED PRODUCTS
Above average growth, above average margins
Solid growth, cash generating
GENERICS
INTERNATIONALIZATION OF BRANDS / BIOSIMILARS/ NICHE AREAS / SPECIAL THERAPY AREAS
Higher growth and higher margins
Expand branded base business o Prioritize attractive brands o Internationalize selected products o Make use of innovative marketing concepts o Further expansion in non-regulated markets
Expand generics base business o Core business o Offers solid reliable growth basis o Cost leadership and strong market position
in selected regions, benefiting from still low penetration rates
Additional growth opportunities o Niche markets, non-regulated markets,
driven by innovative products
7

Page STADA Corporate Presentation • November 2016 8
FOCUSED M&A-STRATEGY IN-LICENSING AND SELECTIVE “BOLT-ON”-ACQUISITIONS
FIREPOWER €m
p.a.
Acquisitions only on the back of clear investment
criteria!
~300
STADA niche areas/
special therapy areas
Brands existing base business
Expansion and internationalization
of brands
Generics existing base business
Limited capital allocation
o Support base business
o Stabilize margins
o Expand geographic footprint
Grow and expand o Growth markets o Out of pocket o Brands o Rx to OTC/RxOTC

Page STADA Corporate Presentation • November 2016 9
GENERICS CLEAR STRATEGY FOR CONTINUOUS GROWTH
Continue to grow base business and defend market positions
Expansion in attractive / less regulated markets
Rollout of the biosimilar portfolio
Ongoing efficiency initiatives to sustain attractive margin level
Selective M&A activity in growing markets

Page STADA Corporate Presentation • November 2016 10
GENERICS THE MARKET IS DRIVEN BY HIGH VOLUME GROWTH Generics continue to take an increasing share of the scripts in all markets
Europe: 44% 56% Japan: 14% 26%
Asia / Australia: 42% 48%
Africa / Middle East: 44% 47% Latin America: 55% 71%
US: 59% 82%
Canada: 58% 73%
Generic volume market share 2006 vs. 2015. Source: IMS Health: “Why we need Generic medicines“; 2016.

Page STADA Corporate Presentation • November 2016 11
GENERICS FUTURE PATENT EXPIRATIONS Patent expiration in Germany, France, Italy, Spain and UK
Source: IMS Health Midas.
> € 12 bn of sales coming off patent in our key markets by 2019 not including biosimilars
€bn
2,461
4,254
2,356
3,137
- 500
1,000 1,500 2,000 2,500 3,000 3,500 4,000 4,500
2016 2017 2018 2019
Page STADA Corporate Presentation • November 2016 12
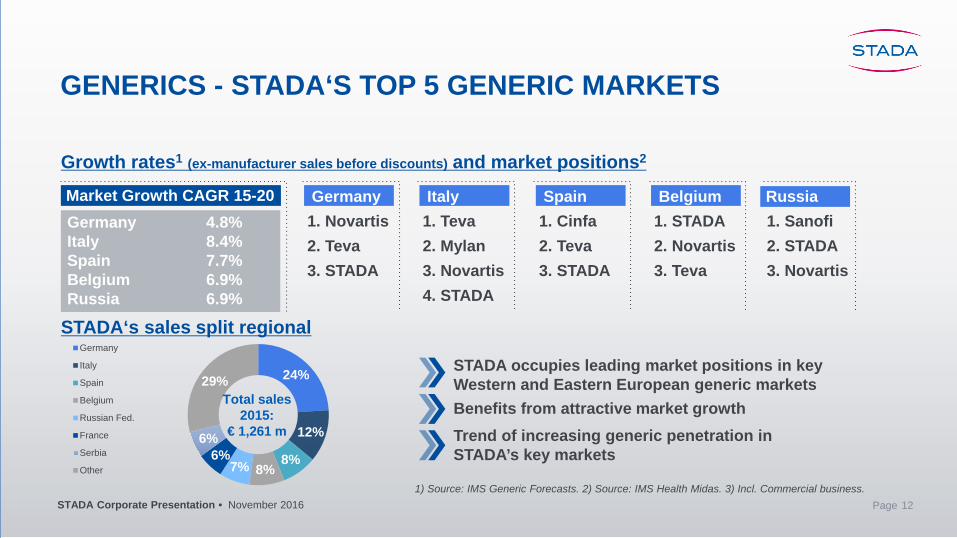
GENERICS - STADA‘S TOP 5 GENERIC MARKETS
Growth rates1 (ex-manufacturer sales before discounts) and market positions2 Market Growth CAGR 15-20 Germany Italy Spain Belgium Russia
4.8% 8.4% 7.7% 6.9% 6.9%
Germany 1. Novartis 2. Teva 3. STADA
Italy 1. Teva 2. Mylan 3. Novartis 4. STADA
Spain 1. Cinfa 2. Teva 3. STADA
Belgium 1. STADA 2. Novartis 3. Teva
1. Sanofi 2. STADA 3. Novartis
STADA‘s sales split regional
STADA occupies leading market positions in key Western and Eastern European generic markets
Benefits from attractive market growth
Trend of increasing generic penetration in STADA’s key markets
Russia
24%
12%
8% 8% 7%
6% 6%
29%
Germany
Italy
Spain
Belgium
Russian Fed.
France
Serbia
Other
Total sales 2015:
€ 1,261 m
1) Source: IMS Generic Forecasts. 2) Source: IMS Health Midas. 3) Incl. Commercial business.

Page STADA Corporate Presentation • November 2016
Volume growth and product launches in Generic base business More than 2,000 product launches (SKU‘s) by 2019
13
BUILD ON FULL GENERIC PIPELINE AND EXPAND BIOSIMILARS PORTFOLIO
Generic base business
Portfolio expansion from currently 2 to 7 products
Biosimilars
1) Adjusted for portfolio and currency effects.
SALES GROWTH1
until 2019e
> € 240 m

Page STADA Corporate Presentation • November 2016 14
BRANDED PRODUCTS STRATEGY
Capitalize on strong platforms (e.g. T&R in UK) and internationalize successful brands
Stretch existing brands (e.g. Fultium, Lactoflora) in existing markets
Switch Rx generics to OTC / Upgrade generic OTCs to full brands (e.g. Care)
In-license innovative formulations or delivery systems (e.g. Combogesic)
Expand into new categories/attractive niches/new geographies
Take advantage of innovative marketing opportunities (e.g. e-commerce/build on centers of excellence)

Page STADA Corporate Presentation • November 2016 15
BRANDED PRODUCTS INTERNATIONAL SCOPE
o Demographics, Urbanization and increasing income level o Greater health awareness and desire for self-care o New communication and distribution channels o Rx-to-OTC/Otx-to-OTC switches and vice versa o World growth trend: 2015: $ 80.6 billion/2019: $ 98.5 billion, CAGR: 5.1%
1) Ex-manufcturer Sales. Source: IMS OTC Review 2016.

Page STADA Corporate Presentation • November 2016 16
2015 OTC growth in selected markets1
CAGR ’15-’19 +5.3%
CAGR ’15-’19 +3.7%
CAGR ’15-’19 +9.6%
CAGR ’15-’19 +2.5%
STADA sales Sales 2015 in €m Growth vs. 2014
BRANDED PRODUCTS STADA‘S KEY MARKETS
In LCD billion
1.6
3.4
3.9
4.8
1.8
4.9
4.5
5.9
UK
RUSSIA
ITALY
GERMANY
2019 2015
212.2 -12.6%
168. 0 +42.1%
128.3 -0.4%
40.4 +31.3%
304.7 +8.8%
Russian Fed.
UK
Germany
Italy
Rest ofWorld
Total sales: € 854 m
1) Source: IMS OTC Review 2016.

Page STADA Corporate Presentation • November 2016 17
STADA IS REPRESENTED IN KEY CATEGORIES OPPORTUNITY TO WIDEN SCOPE IN KEY AFFILIATES
Germany
o Topical Pain o Cough & Cold o Sleeping Aid o Suncare o Vitamins & Minerals o Mouth ulcer
UK
o Topical Pain o Cough o Headlice o Dermatology o Vitamins & Minerals o NRT/Vaping o OTC- Generics
Russia
o Topical pain o Rhinitis o Urology o Lifestyle & mens health
Spain
o Sun protection o Rheumatology o Venous disease o Probiotics o Dermatology
Austria
o Topical pain o Venous disease o Cough & Cold o Suncare o Vitamins & Minerals o Food Intolerances
Belgium
o Topical pain o Venous disease o Probiotics o Cardio Management o Diabetes Management o Womens health

Page STADA Corporate Presentation • November 2016 18
INTERNATIONALIZATION OF BRANDS SELECTED CASE STUDIES

Page STADA Corporate Presentation • November 2016
Everyone in the UK should have an intake of 10mcg (400IU) for prevention of insufficiency
19
SELECTED CASE STUDIES: FULTIUM – HUGE POTENTIAL IN STADA KEY MARKETS Massive potential in EU
€0m
€10m
€20m
€30m
€40m
€50m
€60m
€70m
€80m
2017 2018 2019 2020
Slovakia
Poland
Portugal
Ireland
CzechRepublicBelgium
Netherlands
Mena
Nordics
Germany
UK
0
20
40
60
80
Jan - Mar Apr - July July - Sep Oct - Dec
Optimal
Adequate
4 to 10 11 to 18 19 to 64 over 65
We all need extra D3

Page STADA Corporate Presentation • November 2016 20
SELECTED CASE STUDIES: HEDRIN – GROWTH THROUGH INNOVATION Launched in 2006
o First licensed non-pesticide head lice treatment in UK
o Top OTC launch in UK 2006 – Brand leadership by June
o Revolutionized the market
More potential for growth in new markets
No.1 in Europe
Today

Page STADA Corporate Presentation • November 2016
o Lactoflora is launched in Spain, Ireland, Poland, Portugal
o Food Supplement status gives opportunity of quick launches in other markets
21
BRANDED PRODUCTS SELECTED CASE STUDIES: LACTOFLORA
“OUR BODY IS A PLANET” oThe intestinal microbiota is composed by 100,000 billion of microorganisms coming from 500 to 1000 species.
oThe gut microbiota is supporting the body’s immune and digestive functions and thus is an essential element to have a body in optimal health
oProbiotics can restore intestinal microflora which often become unbalanced due to illness, stress, age, traveling or use of antibiotics.
Probiotic range from STADA, with a complete formula and the best strains, that offers one solution for every situation with the objective to solve health problems (cure) and prevent diseases (care).
Probiotics – the friendly micro-warriors

Page STADA Corporate Presentation • November 2016
Volume growth and product launches in Branded base business
22
NEW PRODUCT LAUNCHES AND INTERNATIONALIZATION OF PRODUCTS
Branded base business
Focus on most attractive brands
Internationalization of brands
1) Adjusted for portfolio and currency effects.
SALES GROWTH1
until 2019e
> € 350 m
Page STADA Corporate Presentation • November 2016 23
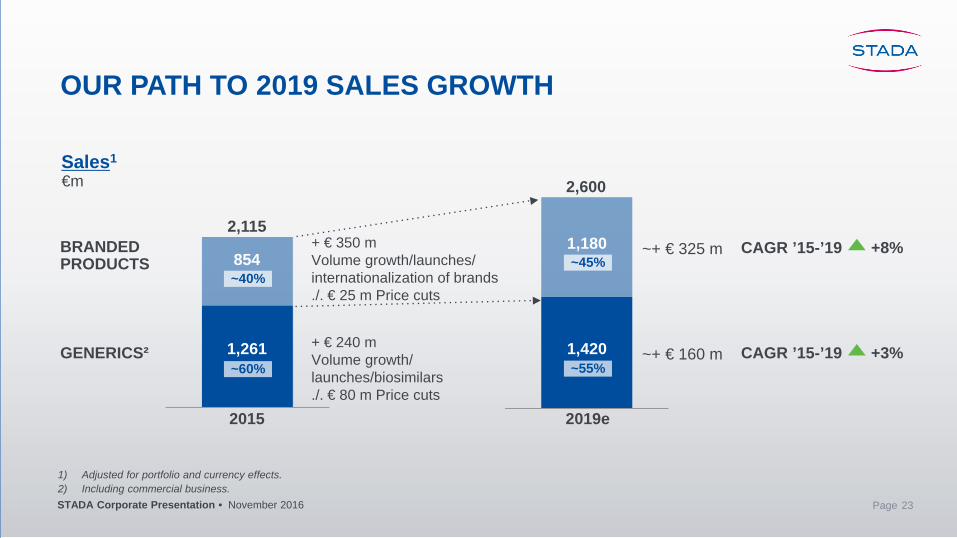
OUR PATH TO 2019 SALES GROWTH
Sales1
1) Adjusted for portfolio and currency effects. 2) Including commercial business.
2,115
854 ~40%
~60%
2015
2,600
+ € 350 m Volume growth/launches/ internationalization of brands ./. € 25 m Price cuts
+ € 240 m Volume growth/ launches/biosimilars ./. € 80 m Price cuts
1,180 ~45%
~55% 1,420
CAGR ’15-’19 +8%
CAGR ’15-’19 +3%
2019e
BRANDED PRODUCTS
GENERICS² 1,261
€m
~+ € 325 m
~+ € 160 m

Page STADA Corporate Presentation • November 2016
Organization
24
PORTFOLIO OPTIMIZATION STREAMLINE ORGANIZATIONAL SET UP AND INTERNAL PROCESSES
o Consolidate: Consolidation of German entities to gain synergies and improve market positioning
o Simplify: Optimize number of legal entities within the Group to reduce complexity
o Eliminate: Discontinue selected SKUs in the Branded Products and Generics segment to strengthen the product portfolio
o Harmonize: Harmonize Group end-to-end
processes such as record to report, purchase to
pay to allow standardized operations
o Automation: Further automation of corporate
processes to reduce process times
o Centralize: Bundle expertise for selected
processes to streamline operations
Processes
+ EXPECTED SAVINGS
until 2019e
~ € 40 m

Page STADA Corporate Presentation • November 2016
P – Prices
25
REDUCTION OF COGS
o Continuous renegotiation of APIs o Continuous renegotiation of finished goods
o Reduce set-up times o Optimize batch sizes o Reduce small volume products
U – Utilization
o Reduce number of suppliers o Transfers from own manufacturing sites o Transfers to own manufacturing sites
S – Suppliers
o Dossiers o Packaging materials o Equipment park
H – Harmonization
COGS REDUCTION
until 2019e
~ € 65 m

Page STADA Corporate Presentation • November 2016 26
OUR PATH TO 2019 ADJUSTED EBITDA GROWTH
EBITDA adj.1
~510
Margin Branded Products ~26%
Margin Generics ~19%
2019e Total: + ~ € 120 m
+
+ ./.
Group EBITDA Margin ~20%
€m € 120 m o Volume growth and product launches in
Generic base business & brands o Internationalization of brands o Biosimilars
€ 105 m o Savings from reorganization/
efficiency gains & COGS € 105 m o Price cuts in Generics and Branded Products
1) Adjusted for special items.

Page STADA Corporate Presentation • November 2016
Q3/2016 UPDATE
27

Page STADA Corporate Presentation • November 2016
o Ongoing strong sales momentum: Russia with continued double-digit sales growth / Belgium recovering
o Segment margin significantly improved
Branded Products
Cashflow o Sequential improvement in Operating Cashflow o Significant increase in Free Cashflow
Net Income
Generics
o Sales and margin impacted by challenging environment in Russia and weak GBP
o Germany again standing out with double digit sales growth
o Financial result clearly improved o Continued net income (adj.) growth
Strong Pipeline o 144 product introductions in Q3
28
Q3: A HIGH PERFORMANCE DESPITE CHALLENGING ENVIRONMENT AND A STRONG PRIOR-YEAR QUARTER

Page STADA Corporate Presentation • November 2016
FINANCIAL OVERVIEW
€m Q3/2016 Q3/2015 Δ 9M/2016 9M/2015 Δ
Sales 507 508 0% 1,542 1,534 1%
Sales (adj.)1 507 504 1% 1,568 1,522 3%
EBITDA 88 100 -11% 289 281 3%
EBITDA (adj.)2 98 105 -6% 301 294 2%
Financial result -13 -16 17% -38 -50 25%
Income taxes -3 -14 80% -28 -34 20%
Net Income 18 36 -50% 100 90 11%
Net Income (adj.)2 44 42 4% 140 127 10%
Group Results
29 1) Adjusted for currency and portfolio effects. 2) Adjusted for special items.

Page STADA Corporate Presentation • November 2016
GENERICS
€m Q3/2016 Q3/2015 Δ 9M/2016 9M/2015 Δ
Sales 305 292 4% 932 928 0%
Sales (adj.)1 304 290 5% 944 922 2%
EBITDA (adj.)2 64 49 30% 194 161 20%
Margin (adj.)2 21.0% 16.8% 20.8% 17.3%
Q3 Segment Results
1) Adjusted for currency and portfolio effects. 2) Adjusted for special items 30

Page STADA Corporate Presentation • November 2016
73 (-12%)
37 (8%)
26 (1%) 26
(62%) 20
(2%)
17 (9%)
17 (47%)
12 (-22%)
77 (9%)
GermanyItalySpainRussiaFranceVietnamBelgiumSerbiaOthers
Generics 305 €m
GENERICS
Sales by country Q3/2016 in €m
• Germany: Following expired tenders more selected approach in renewals with stronger focus on profitability
• Russia: Ongoing sales momentum despite challenging environment
• Belgium: Strong sales growth in Q3, further recovery in Q4 expected
Q3 Segment Results
31

Page STADA Corporate Presentation • November 2016
BRANDED PRODUCTS
€m Q3/2016 Q3/2015 Δ 9M/2016 9M/2015 Δ
Sales 203 216 -6% 610 605 1%
Sales (adj.)1 204 214 -5% 624 600 4%
EBITDA (adj.)2 53 72 -27% 161 181 -11%
Margin (adj.)2 25.9% 33.2% 26.4% 30.0%
Segment Results
1) Adjusted for currency and portfolio effects. 2) Adjusted for special items 32

Page STADA Corporate Presentation • November 2016
43 (+48%)
42 (-31%)
35 (-9%)
9 (17%)
9 (-13%)
65 (-7%)
Germany
Russia
UK
Vietnam
Italy
Others
BRANDED PRODUCTS
Sales by country Q3/2016 in €m Q3 Segment Results
Branded Products 203 €m
33
• Germany: Portfolio optimization / strong performance supported by early supply ahead of flu season / Ladival line extensions / Hoggar benefiting from successful marketing activities
• Russia: Challenging economic environment limits purchasing power of consumers
• UK: Business continues to grow in local currency

Page STADA Corporate Presentation • November 2016
CASHFLOW DEVELOPMENT
34
Q3/2016 Q3/2015 Δ 9M/2016 9M/2015 Δ
Operating Cashflow 85 97 -13% 198 138 44%
Free Cashflow (before dividends)
64 55 16% 79 11 644%
Free Cashflow (adj.)1 (before dividends)
90 74 22% 133 69 94%
1) Adjusted for significant investments, acquisitions and disposals

Page STADA Corporate Presentation • November 2016
3.1
2.7 2.7
3.2 3.2 3.1 3.1 3.01)
2.0
2.5
3.0
3.5
4.0
2009 2010 2011 2012 2013 2014 2015 Sep 16
LEVERAGE NET DEBT/EBITDA (ADJ.)
1) Linear extrapolation of the adjusted EBITDA of the reporting period on a full year basis
2016 TARGET
~3.0
35

Page STADA Corporate Presentation • November 2016
WELL ON TRACK TO REACH FY2016 OUTLOOK
36
1,522 1,568
1-9/2015 1-9/2016
Sales (adj.1) €m
EBITDA (adj.2) Net income (adj.2)
294 301
1-9/2015 1-9/2016
127 140
1-9/2015 1-9/2016
3%
2% 10%
1) Adjusted for currency and portfolio effects. 2) Adjusted for special items

Page STADA Corporate Presentation • November 2016
OUTLOOK 2016
Before
37
Sales adj.1 Slight growth
EBITDA adj.2 Slight growth
Net income adj.2 Slight growth Minimum of € 180m
1) Adjusted for currency and portfolio effects. 2) Adjusted for special items.
New
Page STADA Corporate Presentation • November 2016
APPENDIX
38

Page STADA Corporate Presentation • November 2016 39
FINANCING STRUCTURE
Remaining terms of financial liabilities due to banks as of June 30, 2016 in €m
1) Adjusted for special items. 2) Net debt to adjusted EBITDA ratio of the reporting period on the basis of linear extrapolation.
121.5 44.0
295.0
20.0
288.5
61.5
37.6 57.3
21.5
350.0 300.0
2016 2017 2018 2019 2020 2021 > 2021
• Net debt to adjusted1 EBITDA ratio: 3.02 (1-6/2015: 3.72) • Cash and cash equivalents: € 385.5 m (December 31, 2015: € 143.2 m) • Access to firmly pledged credit lines from banking partners for many years • In April 2016, STADA took up promissory note loans with a total nominal value of € 350 m with an average interest
coupon of approx. 1% (term of five and seven years, fixed and variable)
CORPORATE BOND PROMISSORY NOTE LOANS CREDIT

Page STADA Corporate Presentation • November 2016 40
SENSITIVITY ANALYSIS FOR MAJOR EXCHANGE RATES
Exchange rate effects1 Share of sales according to currencies1
+1/-1 Ruble / €
EBITDA €m ~+/- 0.9
+1/-1 Pence / €
EBITDA €m ~+/- 1.8
% / €m
1) Functional currencies, translation.
15%
12%
21%
52%
RUBGBPOTHERSEUR
Total sales 2015: € 2.1 bn

Page STADA Corporate Presentation • November 2016
FINANCIAL CALENDAR / CONTACT
Financial Calender 2017
March 23, 2017 Publication of FY 2016 results with analyst meeting May 11, 2017 Publication of the Q1 2017 results June 08, 2017 Annual General Meeting 2017 August 03, 2017 Publication of the Q2 2017 results November 09, 2017 Publication of the Q3 2017 results Please note that these dates could be subject to change. Contact Investor Relations Leslie Isabelle Iltgen 61118 Bad Vilbel, Germany Telephone: +49 (0) 6101 603-173 Fax: +49 (0) 6101 603-215 E-mail: [email protected]
41

Page STADA Corporate Presentation • November 2016
DISCLAIMER AND NOTES
42
This STADA Arzneimittel AG (hereinafter "STADA") presentation is intended for information only. It is not intended as or provided in connection with an offer or solicitation for the purchase or sale of any security in any jurisdiction. STADA shall not have any liability arising from the use of this document or its content or otherwise arising in connection with this document. STADA accepts no responsibility for and makes no representation, warranty or guarantee whatsoever in respect of correctness, currentness, accuracy and completeness of the information or opinions contained therein. This document may not be reproduced, distributed or published in whole or in part without the express written consent of STADA. STADA’s performance indicators are partly influenced by special items. Disclosure of key figures adjusted for these effects (so called “pro forma” key figures) by STADA is only to provide a supplement to the recorded IFRS key figures for a transparent comparison to a relevant period from the previous year. This presentation contains certain forward looking statements regarding future events that are based on the current expectations, estimates and forecasts on the part of the company management of STADA as well as other currently available information. They imply various known and unknown risks and uncertainties, which may result in actual earnings, the business, financial and earnings situation, growth or performance to be materially different from the estimates expressed or implied in the forward-looking statements. Statements with respect to the future are characterized by the use of words such as “expect”, “intend”, “plan”, “anticipate”, “believe”, “estimate” and similar terms. STADA may, where appropriate, also make forward-looking statements in other reports, in presentations, in material delivered to shareholders and in press releases. Furthermore, our representatives may from time to time make forward-looking statements verbally. STADA is of the opinion that the expectations reflected in forward-looking statements are appropriate; however, it cannot guarantee that these expectations will actually materialize. Risk factors include in particular: The influence of regulation of the pharmaceutical industry; the difficulty in making predictions concerning approvals by the regulatory authorities and other supervisory agencies; the regulatory environment and changes in the health-care policy and in the health care system of various countries; acceptance of and demand for new drugs and new therapies; the results of clinical studies; the influence of competitive products and prices; the availability and costs of the active ingredients used in the production of pharmaceutical products; uncertainty concerning market acceptance when innovative products are introduced, presently being sold or under development; the effect of changes in the customer structure; dependence on strategic alliances; exchange rate and interest rate fluctuations, operating results, as well as other factors detailed in the annual reports and in other Company statements. STADA does not assume any obligation to update these forward-looking statements. The Executive Board of STADA Arzneimittel AG Dr. M. Wiedenfels (Chairman), H. Kraft