staid14_final for distribution
TRANSCRIPT

FINAL - June 28, 2013
Page 1
Summary of Major State Aid Programs
Fiscal Year 2014
Col. 1 Col. 2 Col. 3 Col. 4 Col. 5 Col. 6 Col. 7 Col. 8 Col. 9 Col. 10
Total Special Guaranteed Total Direct
Foundation Transportation Compensatory Limited English Education Tax Supplemental NTI BRFA 5-202(i) Mandated
Local Unit Program Grants Education Proficient Formula Base Grants Adjustment* Grants* * † Grants
Allegany 39,728,620 4,488,227 20,307,012 131,091 4,709,951 3,491,422 10,348 311,022 - 73,177,693
Anne Arundel 207,692,740 21,683,015 58,733,683 8,782,160 16,029,266 - - 574,459 - 313,495,323
Baltimore City 408,455,689 19,486,216 323,375,146 17,814,422 56,139,426 38,064,494 18,310,933 - - 881,646,326
Baltimore 354,410,287 28,455,117 128,745,337 13,656,777 30,619,091 - - - - 555,886,609
Calvert 59,165,262 5,526,831 10,202,343 555,481 3,561,740 - - 241,825 - 79,253,482
Caroline 24,519,248 2,524,869 13,157,712 1,299,119 2,097,114 584,692 966,820 171,035 - 45,320,609
Carroll 100,367,544 9,381,519 13,891,697 757,258 7,807,627 - - † 384,283 750,732 133,340,660
Cecil 61,591,268 4,958,348 20,915,225 624,175 5,951,139 71,283 49,060 414,167 - 94,574,665
Charles 109,140,555 10,130,310 27,535,278 928,904 7,106,749 306,032 - 863,706 - 156,011,534
Dorchester 18,502,485 2,347,452 9,699,191 426,363 1,269,552 144,572 1,321,515 140,776 - 33,851,906
Frederick 162,393,389 11,725,151 30,979,818 6,530,079 11,498,026 - - 469,554 - 223,596,017
Garrett 9,773,512 2,866,540 4,899,110 5,408 885,461 - 1,201,160 87,005 297,993 20,016,189
Harford 137,095,202 12,030,689 31,139,458 1,467,548 12,740,464 - - † 589,164 935,788 195,998,313
Howard 160,198,196 15,642,046 24,029,222 6,550,797 9,311,424 - - - - 215,731,685
Kent 2,768,629 1,509,479 2,654,899 202,800 503,378 - 1,003,414 42,171 97,046 8,781,815
Montgomery 339,419,543 36,985,683 121,839,206 57,776,368 35,214,250 - - - - 591,235,050
Prince George's 515,195,759 36,965,932 235,525,743 68,564,225 39,830,756 - 20,505,652 2,532,291 - 919,120,358
Queen Anne's 21,299,659 3,204,654 4,944,154 412,690 2,031,708 - - 71,040 - 31,963,905
St. Mary's 62,655,616 6,555,272 15,563,093 606,608 4,333,476 - 3,251,181 311,307 - 93,276,553
Somerset 12,912,979 1,792,281 8,683,253 500,286 1,620,626 1,045,719 - 101,023 - 26,656,167
Talbot 4,381,145 1,526,001 4,332,096 659,776 770,230 - - - - 11,669,248
Washington 96,286,796 6,816,644 40,281,259 1,674,217 6,951,860 4,939,133 - 648,228 - 157,598,137
Wicomico 66,919,484 5,040,451 37,322,878 3,092,879 6,639,911 3,670,117 - 372,344 - 123,058,064
Worcester 6,395,017 2,885,765 7,228,109 408,304 1,686,014 - - - - 18,603,209
Total State 2,981,268,624 254,528,492 1,195,984,922 193,427,735 269,309,239 52,317,464 46,620,083 8,325,402 2,081,559 5,003,863,520
* Represents 20% of Net Taxable Income, 5-year Phase-in Adjustment.
** Grant equals 25% of the decrease between 2013 Direct Student Aid and 2014 Direct Student Aid where the decrease is greater than 1%.
Page 5 Page 6 Page 7 Page 8 Page 9 Page 10 Page 11 Page 13 Page 14
† The Budget Bill allows the Governor to use $2.2 million in excess funding that was appropriated in the Transportation program to ensure that no Supplemental grant is less than zero and to restore 25% of the reduction in Direct
Aid from the prior year where the reduction exceeds 1%. Please note that these excess funds are discretionary and a decision on their distribution has not been made.
Bridge to Excellence in Public Schools Act Prepared by MSDE Division of Business Services

FINAL - June 28, 2013
Page 2
Enrollment for Calculating the Foundation Program
Fiscal Year 2014 - September 30, 2012
Col. 11 Col. 12 Col. 13 Col. 14 Col. 15 Col. 16 Col. 17 Col. 18 Col. 19
Total
Total SEED Evening Part Out-of Other Eligible
Local Unit Enrollment Prekinder. (1) Kinder. School High Time State Ineligible FTE (2)
Allegany 8,929.00 520 - - - - - 1.00 8,408.00
Anne Arundel 77,770.00 2,182 - 14.00 - 151.75 - 4.00 75,446.25
Baltimore City 84,747.00 4,884 - 158.00 - - - 753.00 79,268.00
Baltimore 106,927.00 3,641 - 50.00 33.75 93.75 125.00 68.00 103,015.50
Calvert 16,323.00 400 - 4.00 - 35.25 3.00 3.00 15,885.75
Caroline 5,585.00 365 - - - - - - 5,220.00
Carroll 26,687.00 363 - 1.00 - 3.00 - 4.00 26,318.00
Cecil 15,634.00 627 - - - - - - 15,007.00
Charles 26,644.00 911 - 3.00 - 19.00 - - 25,717.00
Dorchester 4,718.00 270 - - - - - 1.00 4,447.00
Frederick 40,455.00 1,063 - 1.00 - 3.00 17.00 16.00 39,357.00
Garrett 4,004.00 86 - - - - - - 3,918.00
Harford 37,868.00 760 - 1.00 - 22.00 - 2.00 37,085.00
Howard 52,053.00 1,084 - 43.00 - 37.75 20.00 1.00 50,953.25
Kent 2,130.00 119 - 2.00 2.75 - - 1.00 2,009.25
Montgomery 148,780.00 3,777 - 6.00 - 81.00 22.00 37.00 144,869.00
Prince George's 123,737.00 5,571 - 94.00 - 63.75 279.00 128.00 117,789.25
Queen Anne's 7,752.00 249 - 2.00 - 0.50 1.00 - 7,503.50
St. Mary's 17,453.00 741 - 2.00 - 10.00 - 17.00 16,687.00
Somerset 2,943.00 214 - - - - - 4.00 2,725.00
Talbot 4,570.00 293 - - - - - - 4,277.00
Washington 22,403.00 489 - 2.00 0.75 15.75 8.00 4.00 21,887.50
Wicomico 15,017.00 577 - 3.00 13.25 3.50 454.00 10.00 13,962.25
Worcester 6,650.00 390 - - - - 15.00 2.00 6,243.00
Total State 859,779.00 29,576 - 386.00 50.50 540.00 944.00 1,056.00 827,998.50
Note: Enrollment includes SEED School students in home school systems.
(1) Prekindergarten students are not included in the Full-time equivalent enrollment for the Foundation Program funding. Full-time equivalent enrollment is defined in the Annotated Code of Maryland - Education Article §5-202.
(2) Col. 19 = Col. 11 - Col. 12 + Col. 14 - Col. 15 - Col. 16 - Col. 17 - Col.18
Education Article - Section 5-202 Prepared by MSDE Division of Business Services
FINAL - June 28, 2013
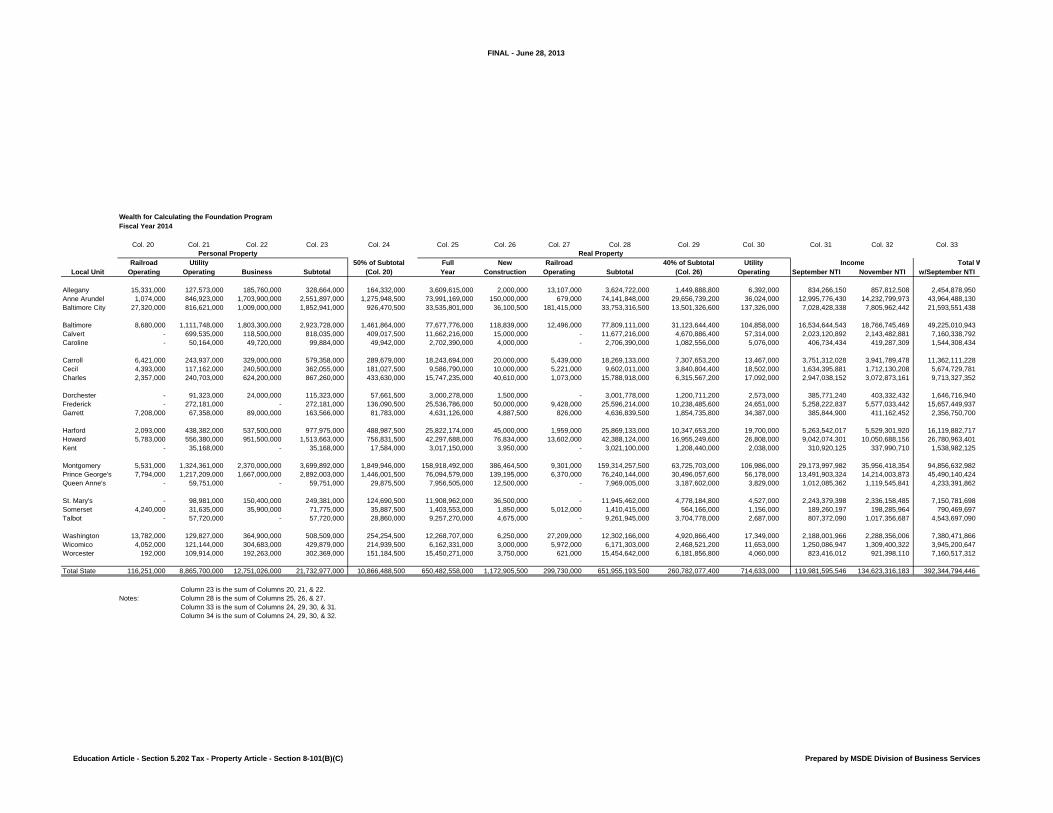
Wealth for Calculating the Foundation Program
Fiscal Year 2014
Col. 20 Col. 21 Col. 22 Col. 23 Col. 24 Col. 25 Col. 26 Col. 27 Col. 28 Col. 29 Col. 30 Col. 31 Col. 32 Col. 33
Railroad Utility 50% of Subtotal Full New Railroad 40% of Subtotal Utility
Local Unit Operating Operating Business Subtotal (Col. 20) Year Construction Operating Subtotal (Col. 26) Operating September NTI November NTI w/September NTI
Allegany 15,331,000 127,573,000 185,760,000 328,664,000 164,332,000 3,609,615,000 2,000,000 13,107,000 3,624,722,000 1,449,888,800 6,392,000 834,266,150 857,812,508 2,454,878,950
Anne Arundel 1,074,000 846,923,000 1,703,900,000 2,551,897,000 1,275,948,500 73,991,169,000 150,000,000 679,000 74,141,848,000 29,656,739,200 36,024,000 12,995,776,430 14,232,799,973 43,964,488,130
Baltimore City 27,320,000 816,621,000 1,009,000,000 1,852,941,000 926,470,500 33,535,801,000 36,100,500 181,415,000 33,753,316,500 13,501,326,600 137,326,000 7,028,428,338 7,805,962,442 21,593,551,438
Baltimore 8,680,000 1,111,748,000 1,803,300,000 2,923,728,000 1,461,864,000 77,677,776,000 118,839,000 12,496,000 77,809,111,000 31,123,644,400 104,858,000 16,534,644,543 18,766,745,469 49,225,010,943
Calvert - 699,535,000 118,500,000 818,035,000 409,017,500 11,662,216,000 15,000,000 - 11,677,216,000 4,670,886,400 57,314,000 2,023,120,892 2,143,482,881 7,160,338,792
Caroline - 50,164,000 49,720,000 99,884,000 49,942,000 2,702,390,000 4,000,000 - 2,706,390,000 1,082,556,000 5,076,000 406,734,434 419,287,309 1,544,308,434
Carroll 6,421,000 243,937,000 329,000,000 579,358,000 289,679,000 18,243,694,000 20,000,000 5,439,000 18,269,133,000 7,307,653,200 13,467,000 3,751,312,028 3,941,789,478 11,362,111,228
Cecil 4,393,000 117,162,000 240,500,000 362,055,000 181,027,500 9,586,790,000 10,000,000 5,221,000 9,602,011,000 3,840,804,400 18,502,000 1,634,395,881 1,712,130,208 5,674,729,781
Charles 2,357,000 240,703,000 624,200,000 867,260,000 433,630,000 15,747,235,000 40,610,000 1,073,000 15,788,918,000 6,315,567,200 17,092,000 2,947,038,152 3,072,873,161 9,713,327,352
Dorchester - 91,323,000 24,000,000 115,323,000 57,661,500 3,000,278,000 1,500,000 - 3,001,778,000 1,200,711,200 2,573,000 385,771,240 403,332,432 1,646,716,940
Frederick - 272,181,000 - 272,181,000 136,090,500 25,536,786,000 50,000,000 9,428,000 25,596,214,000 10,238,485,600 24,651,000 5,258,222,837 5,577,033,442 15,657,449,937
Garrett 7,208,000 67,358,000 89,000,000 163,566,000 81,783,000 4,631,126,000 4,887,500 826,000 4,636,839,500 1,854,735,800 34,387,000 385,844,900 411,162,452 2,356,750,700
Harford 2,093,000 438,382,000 537,500,000 977,975,000 488,987,500 25,822,174,000 45,000,000 1,959,000 25,869,133,000 10,347,653,200 19,700,000 5,263,542,017 5,529,301,920 16,119,882,717
Howard 5,783,000 556,380,000 951,500,000 1,513,663,000 756,831,500 42,297,688,000 76,834,000 13,602,000 42,388,124,000 16,955,249,600 26,808,000 9,042,074,301 10,050,688,156 26,780,963,401
Kent - 35,168,000 - 35,168,000 17,584,000 3,017,150,000 3,950,000 - 3,021,100,000 1,208,440,000 2,038,000 310,920,125 337,990,710 1,538,982,125
Montgomery 5,531,000 1,324,361,000 2,370,000,000 3,699,892,000 1,849,946,000 158,918,492,000 386,464,500 9,301,000 159,314,257,500 63,725,703,000 106,986,000 29,173,997,982 35,956,418,354 94,856,632,982
Prince George's 7,794,000 1,217,209,000 1,667,000,000 2,892,003,000 1,446,001,500 76,094,579,000 139,195,000 6,370,000 76,240,144,000 30,496,057,600 56,178,000 13,491,903,324 14,214,003,873 45,490,140,424
Queen Anne's - 59,751,000 - 59,751,000 29,875,500 7,956,505,000 12,500,000 - 7,969,005,000 3,187,602,000 3,829,000 1,012,085,362 1,119,545,841 4,233,391,862
St. Mary's - 98,981,000 150,400,000 249,381,000 124,690,500 11,908,962,000 36,500,000 - 11,945,462,000 4,778,184,800 4,527,000 2,243,379,398 2,336,158,485 7,150,781,698
Somerset 4,240,000 31,635,000 35,900,000 71,775,000 35,887,500 1,403,553,000 1,850,000 5,012,000 1,410,415,000 564,166,000 1,156,000 189,260,197 198,285,964 790,469,697
Talbot - 57,720,000 - 57,720,000 28,860,000 9,257,270,000 4,675,000 - 9,261,945,000 3,704,778,000 2,687,000 807,372,090 1,017,356,687 4,543,697,090
Washington 13,782,000 129,827,000 364,900,000 508,509,000 254,254,500 12,268,707,000 6,250,000 27,209,000 12,302,166,000 4,920,866,400 17,349,000 2,188,001,966 2,288,356,006 7,380,471,866
Wicomico 4,052,000 121,144,000 304,683,000 429,879,000 214,939,500 6,162,331,000 3,000,000 5,972,000 6,171,303,000 2,468,521,200 11,653,000 1,250,086,947 1,309,400,322 3,945,200,647
Worcester 192,000 109,914,000 192,263,000 302,369,000 151,184,500 15,450,271,000 3,750,000 621,000 15,454,642,000 6,181,856,800 4,060,000 823,416,012 921,398,110 7,160,517,312
Total State 116,251,000 8,865,700,000 12,751,026,000 21,732,977,000 10,866,488,500 650,482,558,000 1,172,905,500 299,730,000 651,955,193,500 260,782,077,400 714,633,000 119,981,595,546 134,623,316,183 392,344,794,446
Column 23 is the sum of Columns 20, 21, & 22.
Notes: Column 28 is the sum of Columns 25, 26, & 27.
Column 33 is the sum of Columns 24, 29, 30, & 31.
Column 34 is the sum of Columns 24, 29, 30, & 32.
Personal Property Real Property
Income Total Wealth
Education Article - Section 5.202 Tax - Property Article - Section 8-101(B)(C) Prepared by MSDE Division of Business Services

FINAL - June 28, 2013
Page 3
Col. 34
w/November NTI
2,478,425,308
45,201,511,673
22,371,085,542
51,457,111,869
7,280,700,781
1,556,861,309
11,552,588,678
5,752,464,108
9,839,162,361
1,664,278,132
15,976,260,542
2,382,068,252
16,385,642,620
27,789,577,256
1,566,052,710
-
101,639,053,354
46,212,240,973
4,340,852,341
7,243,560,785
799,495,464
4,753,681,687
7,480,825,906
4,004,514,022
7,258,499,410
406,986,515,083
Total Wealth
Education Article - Section 5.202 Tax - Property Article - Section 8-101(B)(C) Prepared by MSDE Division of Business Services

FINAL - June 28, 2013
Page 4
Per Pupil Amounts
Fiscal Year 2014
Target Per Pupil Foundation Amount Annual Per Pupil Foundation Amount
Prior Fiscal Year Amount 6,761$ (1) FY 2002 Per Pupil Foundation Amount 4,124$
Increase in Implicit Price Deflator 1.0100 (2) Target Per Pupil Foundation Amount 6,828.55
Less: FY 2002 Per Pupil Foundation Amount 4,124
Target Per Pupil Foundation Amount 6,829 Difference 2,705
Times Applicable Fiscal Year Phase In Rate 1.00
Product 2,704.55
The Sum of (1) and (2) Rounded = Foundation Amount 6,829$
Compensatory Education Per Pupil Amount
Annual Per Pupil Foundation Amount 6,829$
Times Compensatory Education Factor 0.97
Adjusted Per Pupil Amount 6,624.13
Times State Share of Compensatory Education Funding 0.50
Compensatory Education Per Pupil Amount 3,312$
Limited English Proficient (LEP) Per Pupil Amount Tier II LEP Per Pupil Amount
Annual Per Pupil Foundation Amount 6,829$ Tier II LEP Funding 187,153,980$
Times LEP Factor 0.99 Statewide LEP Enrollment Count 55,371
Adjusted Per Pupil Amount 6,760.71 Tier II LEP Per Pupil Amount 3,380$
Times State Share of LEP Funding 0.50
LEP Per Pupil Amount 3,380$
Special Education Per Pupil Amount Tier II Special Education Per Pupil Amount
Annual Per Pupil Foundation Amount 6,829$ Tier II Special Education Funding 259,232,295$
Times Special Education Factor 0.74 Statewide Special Education Enrollment Count 102,585
Adjusted Per Pupil Amount 5,053.46 Tier II Special Education Per Pupil Amount 2,527$
Times State Share of Special Education Funding 0.50
Special Education Per Pupil Amount 2,527$
Education Article - Sections 5-202; 5-207-9 Prepared by MSDE Division of Business Services

FINAL - June 28, 2013
Page 5
Foundation Program
Fiscal Year 2014 - Based on September 1, 2012 Net Taxable Income (NTI)
Col. 35 Col. 36 Col. 37 Col. 38 Col. 39 Col. 40 Col. 41
Total Program *
Enrollment x Local Total Program Minimum Greater of
Local Unit 6,829 Share (less) Local Share State Share Col. 37 or 38 GCEI Total
Allegany 57,418,232 17,689,612 39,728,620 8,612,735 39,728,620 - 39,728,620
Anne Arundel 515,222,441 316,803,705 198,418,736 77,283,366 198,418,736 9,274,004 207,692,740
Baltimore City 541,321,172 155,600,972 385,720,200 81,198,176 385,720,200 22,735,489 408,455,689
Baltimore 703,492,850 354,710,506 348,782,344 105,523,927 348,782,344 5,627,943 354,410,287
Calvert 108,483,787 51,596,685 56,887,102 16,272,568 56,887,102 2,278,160 59,165,262
Caroline 35,647,380 11,128,132 24,519,248 5,347,107 24,519,248 - 24,519,248
Carroll 179,725,622 81,874,237 97,851,385 26,958,843 97,851,385 2,516,159 100,367,544
Cecil 102,482,803 40,891,535 61,591,268 15,372,420 61,591,268 - 61,591,268
Charles 175,621,393 69,993,266 105,628,127 26,343,209 105,628,127 3,512,428 109,140,555
Dorchester 30,368,563 11,866,078 18,502,485 4,555,284 18,502,485 - 18,502,485
Frederick 268,768,953 112,826,019 155,942,934 40,315,343 155,942,934 6,450,455 162,393,389
Garrett 26,756,022 16,982,510 9,773,512 4,013,403 9,773,512 - 9,773,512
Harford 253,253,465 116,158,263 137,095,202 37,988,020 137,095,202 - 137,095,202
Howard 347,959,744 192,980,944 154,978,800 52,193,962 154,978,800 5,219,396 160,198,196
Kent 13,721,168 11,089,751 2,631,417 2,058,175 2,631,417 137,212 2,768,629
Montgomery 989,310,401 683,527,412 305,782,989 148,396,560 305,782,989 33,636,554 339,419,543
Prince George's 804,382,788 327,797,403 476,585,385 120,657,418 476,585,385 38,610,374 515,195,759
Queen Anne's 51,241,402 30,505,398 20,736,004 7,686,210 20,736,004 563,655 21,299,659
St. Mary's 113,955,523 51,527,818 62,427,705 17,093,328 62,427,705 227,911 62,655,616
Somerset 18,609,025 5,696,046 12,912,979 2,791,354 12,912,979 - 12,912,979
Talbot 29,207,633 32,741,427 (3,533,794) 4,381,145 4,381,145 - 4,381,145
Washington 149,469,738 53,182,942 96,286,796 22,420,461 96,286,796 - 96,286,796
Wicomico 95,348,205 28,428,721 66,919,484 14,302,231 66,919,484 - 66,919,484
Worcester 42,633,447 51,597,972 (8,964,525) 6,395,017 6,395,017 - 6,395,017
Total State 5,654,401,757 2,827,197,354 2,827,204,403 848,160,262 2,850,478,884 130,789,740 2,981,268,624
827,998.50 624 258,335,532 Tier 1
827,998.50 6,205 2,568,865,346 Tier 2
0.72059% Local Contribution Rate
* Includes SEED School enrollment in home school systems.
State Share
Education Article - Section 5-202 Prepared by MSDE Division of Business Services
FINAL - June 28, 2013
Page 5a
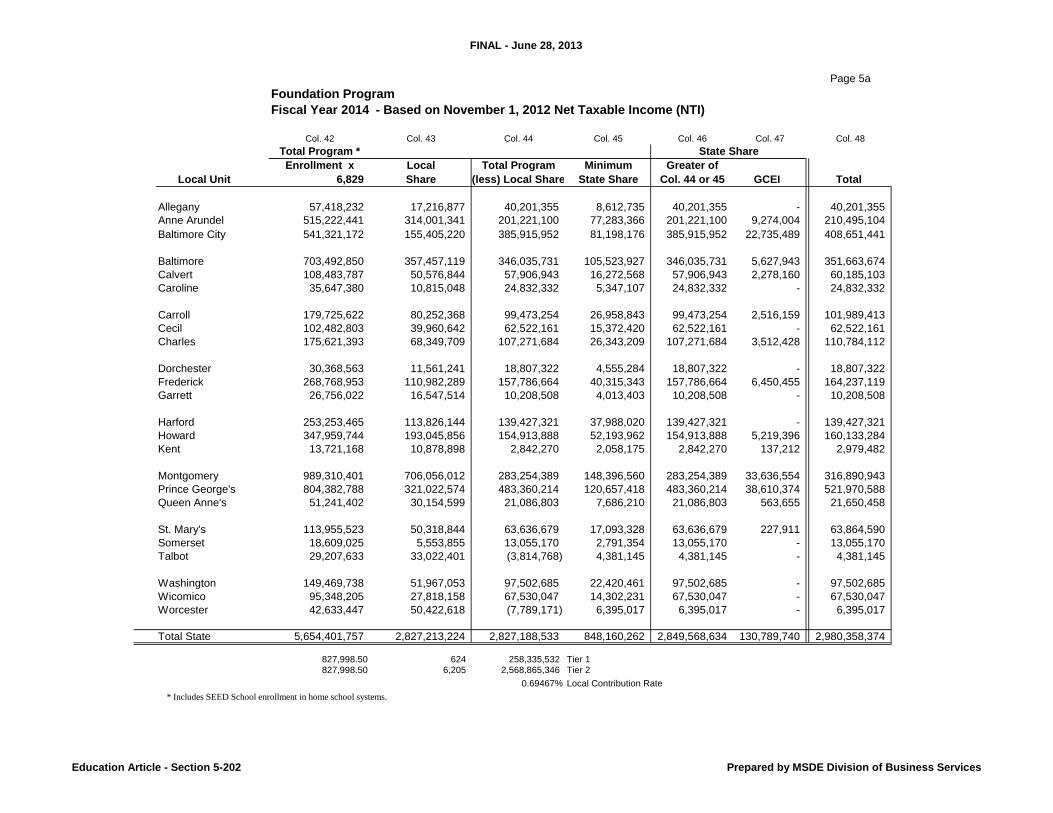
Foundation Program
Fiscal Year 2014 - Based on November 1, 2012 Net Taxable Income (NTI)
Col. 42 Col. 43 Col. 44 Col. 45 Col. 46 Col. 47 Col. 48
Total Program *
Enrollment x Local Total Program Minimum Greater of
Local Unit 6,829 Share (less) Local Share State Share Col. 44 or 45 GCEI Total
Allegany 57,418,232 17,216,877 40,201,355 8,612,735 40,201,355 - 40,201,355
Anne Arundel 515,222,441 314,001,341 201,221,100 77,283,366 201,221,100 9,274,004 210,495,104
Baltimore City 541,321,172 155,405,220 385,915,952 81,198,176 385,915,952 22,735,489 408,651,441
Baltimore 703,492,850 357,457,119 346,035,731 105,523,927 346,035,731 5,627,943 351,663,674
Calvert 108,483,787 50,576,844 57,906,943 16,272,568 57,906,943 2,278,160 60,185,103
Caroline 35,647,380 10,815,048 24,832,332 5,347,107 24,832,332 - 24,832,332
Carroll 179,725,622 80,252,368 99,473,254 26,958,843 99,473,254 2,516,159 101,989,413
Cecil 102,482,803 39,960,642 62,522,161 15,372,420 62,522,161 - 62,522,161
Charles 175,621,393 68,349,709 107,271,684 26,343,209 107,271,684 3,512,428 110,784,112
Dorchester 30,368,563 11,561,241 18,807,322 4,555,284 18,807,322 - 18,807,322
Frederick 268,768,953 110,982,289 157,786,664 40,315,343 157,786,664 6,450,455 164,237,119
Garrett 26,756,022 16,547,514 10,208,508 4,013,403 10,208,508 - 10,208,508
Harford 253,253,465 113,826,144 139,427,321 37,988,020 139,427,321 - 139,427,321
Howard 347,959,744 193,045,856 154,913,888 52,193,962 154,913,888 5,219,396 160,133,284
Kent 13,721,168 10,878,898 2,842,270 2,058,175 2,842,270 137,212 2,979,482
Montgomery 989,310,401 706,056,012 283,254,389 148,396,560 283,254,389 33,636,554 316,890,943
Prince George's 804,382,788 321,022,574 483,360,214 120,657,418 483,360,214 38,610,374 521,970,588
Queen Anne's 51,241,402 30,154,599 21,086,803 7,686,210 21,086,803 563,655 21,650,458
St. Mary's 113,955,523 50,318,844 63,636,679 17,093,328 63,636,679 227,911 63,864,590
Somerset 18,609,025 5,553,855 13,055,170 2,791,354 13,055,170 - 13,055,170
Talbot 29,207,633 33,022,401 (3,814,768) 4,381,145 4,381,145 - 4,381,145
Washington 149,469,738 51,967,053 97,502,685 22,420,461 97,502,685 - 97,502,685
Wicomico 95,348,205 27,818,158 67,530,047 14,302,231 67,530,047 - 67,530,047
Worcester 42,633,447 50,422,618 (7,789,171) 6,395,017 6,395,017 - 6,395,017
Total State 5,654,401,757 2,827,213,224 2,827,188,533 848,160,262 2,849,568,634 130,789,740 2,980,358,374
827,998.50 624 258,335,532 Tier 1
827,998.50 6,205 2,568,865,346 Tier 2
0.69467% Local Contribution Rate
* Includes SEED School enrollment in home school systems.
State Share
Education Article - Section 5-202 Prepared by MSDE Division of Business Services
FINAL - June 28, 2013
Page 6
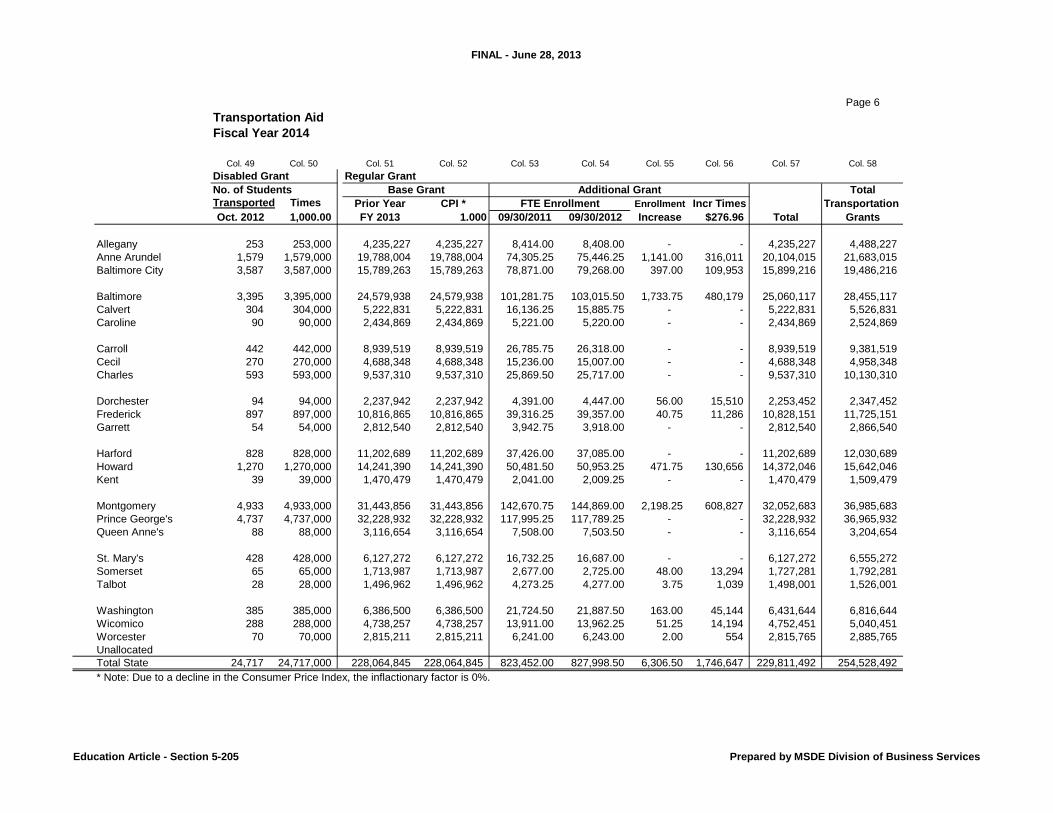
Transportation Aid
Fiscal Year 2014
Col. 49 Col. 50 Col. 51 Col. 52 Col. 53 Col. 54 Col. 55 Col. 56 Col. 57 Col. 58
Disabled Grant Regular Grant
No. of Students Total
Transported Times Prior Year CPI * FTE Enrollment Enrollment Incr Times Transportation
Oct. 2012 1,000.00 FY 2013 1.000 09/30/2011 09/30/2012 Increase $276.96 Total Grants
Allegany 253 253,000 4,235,227 4,235,227 8,414.00 8,408.00 - - 4,235,227 4,488,227
Anne Arundel 1,579 1,579,000 19,788,004 19,788,004 74,305.25 75,446.25 1,141.00 316,011 20,104,015 21,683,015
Baltimore City 3,587 3,587,000 15,789,263 15,789,263 78,871.00 79,268.00 397.00 109,953 15,899,216 19,486,216
Baltimore 3,395 3,395,000 24,579,938 24,579,938 101,281.75 103,015.50 1,733.75 480,179 25,060,117 28,455,117
Calvert 304 304,000 5,222,831 5,222,831 16,136.25 15,885.75 - - 5,222,831 5,526,831
Caroline 90 90,000 2,434,869 2,434,869 5,221.00 5,220.00 - - 2,434,869 2,524,869
Carroll 442 442,000 8,939,519 8,939,519 26,785.75 26,318.00 - - 8,939,519 9,381,519
Cecil 270 270,000 4,688,348 4,688,348 15,236.00 15,007.00 - - 4,688,348 4,958,348
Charles 593 593,000 9,537,310 9,537,310 25,869.50 25,717.00 - - 9,537,310 10,130,310
Dorchester 94 94,000 2,237,942 2,237,942 4,391.00 4,447.00 56.00 15,510 2,253,452 2,347,452
Frederick 897 897,000 10,816,865 10,816,865 39,316.25 39,357.00 40.75 11,286 10,828,151 11,725,151
Garrett 54 54,000 2,812,540 2,812,540 3,942.75 3,918.00 - - 2,812,540 2,866,540
Harford 828 828,000 11,202,689 11,202,689 37,426.00 37,085.00 - - 11,202,689 12,030,689
Howard 1,270 1,270,000 14,241,390 14,241,390 50,481.50 50,953.25 471.75 130,656 14,372,046 15,642,046
Kent 39 39,000 1,470,479 1,470,479 2,041.00 2,009.25 - - 1,470,479 1,509,479
Montgomery 4,933 4,933,000 31,443,856 31,443,856 142,670.75 144,869.00 2,198.25 608,827 32,052,683 36,985,683
Prince George's 4,737 4,737,000 32,228,932 32,228,932 117,995.25 117,789.25 - - 32,228,932 36,965,932
Queen Anne's 88 88,000 3,116,654 3,116,654 7,508.00 7,503.50 - - 3,116,654 3,204,654
St. Mary's 428 428,000 6,127,272 6,127,272 16,732.25 16,687.00 - - 6,127,272 6,555,272
Somerset 65 65,000 1,713,987 1,713,987 2,677.00 2,725.00 48.00 13,294 1,727,281 1,792,281
Talbot 28 28,000 1,496,962 1,496,962 4,273.25 4,277.00 3.75 1,039 1,498,001 1,526,001
Washington 385 385,000 6,386,500 6,386,500 21,724.50 21,887.50 163.00 45,144 6,431,644 6,816,644
Wicomico 288 288,000 4,738,257 4,738,257 13,911.00 13,962.25 51.25 14,194 4,752,451 5,040,451
Worcester 70 70,000 2,815,211 2,815,211 6,241.00 6,243.00 2.00 554 2,815,765 2,885,765
Unallocated
Total State 24,717 24,717,000 228,064,845 228,064,845 823,452.00 827,998.50 6,306.50 1,746,647 229,811,492 254,528,492
* Note: Due to a decline in the Consumer Price Index, the inflactionary factor is 0%.
Base Grant Additional Grant
Education Article - Section 5-205 Prepared by MSDE Division of Business Services

FINAL - June 28, 2013
State Compensatory Education
Fiscal Year 2014 - Based on September 1, 2012 Net Taxable Income (NTI)
Col. 59 Col. 60 Col. 61 Col. 62 Col. 63 Col. 64 Col. 65 Col. 66
Oct. 31, 2012 Oct. 31, 2012 Per Grant Additional
Eligible FARMS Eligible FARMS Times Pupil Unadjusted Adjusted Minimum Grant
Students Students + SEED 3,312 Wealth 0.8376792 Grant (Col. 65 - Col. 64)
Allegany 4,510 4,510 14,937,120 291,969 24,241,991 20,307,012 11,949,696 -
Anne Arundel 22,158 22,167 73,417,104 582,726 59,699,541 50,009,064 58,733,683 8,724,619
Baltimore City 66,886 67,008 221,930,496 272,412 386,036,977 323,375,146 177,544,397 -
Baltimore 46,763 46,796 154,988,352 477,841 153,692,890 128,745,337 123,990,682 -
Calvert 3,495 3,498 11,585,376 450,740 12,179,296 10,202,343 9,268,301 -
Caroline 2,961 2,961 9,806,832 295,845 15,707,340 13,157,712 7,845,466 -
Carroll 4,561 4,562 15,109,344 431,724 16,583,552 13,891,697 12,087,475 -
Cecil 6,016 6,016 19,924,992 378,139 24,968,061 20,915,225 15,939,994 -
Charles 7,908 7,911 26,201,232 377,701 32,870,911 27,535,278 20,960,986 -
Dorchester 2,732 2,732 9,048,384 370,298 11,578,646 9,699,191 7,238,707 -
Frederick 9,374 9,375 31,050,000 397,831 36,982,914 30,979,818 24,840,000 -
Garrett 1,849 1,849 6,123,888 601,519 4,824,097 4,041,046 4,899,110 858,064
Harford 10,295 10,296 34,100,352 434,674 37,173,488 31,139,458 27,280,282 -
Howard 9,035 9,069 30,036,528 525,599 27,079,044 22,683,552 24,029,222 1,345,670
Kent 1,000 1,002 3,318,624 765,949 2,053,035 1,719,785 2,654,899 935,114
Montgomery 45,980 45,984 152,299,008 654,775 110,215,612 92,325,326 121,839,206 29,513,880
Prince George's 69,125 69,190 229,157,280 386,199 281,164,607 235,525,743 183,325,824 -
Queen Anne's 1,864 1,866 6,180,192 564,189 5,190,575 4,348,037 4,944,154 596,117
St. Mary's 5,072 5,073 16,801,776 428,524 18,578,822 15,563,093 13,441,421 -
Somerset 1,916 1,916 6,345,792 290,081 10,365,845 8,683,253 5,076,634 -
Talbot 1,635 1,635 5,415,120 1,062,356 2,415,328 2,023,270 4,332,096 2,308,826
Washington 10,330 10,332 34,219,584 337,200 48,086,736 40,281,259 27,375,667 -
Wicomico 8,019 8,022 26,568,864 282,562 44,555,097 37,322,878 21,255,091 -
Worcester 2,728 2,728 9,035,136 1,146,967 3,732,690 3,126,797 7,228,109 4,101,312
Total State 346,212 346,498 1,147,601,376 473,847 1,369,977,095 1,147,601,320 918,081,102 48,383,602
Education Article - Section 5-207 Prepared by MSDE Division of Business Services
FINAL - June 28, 2013
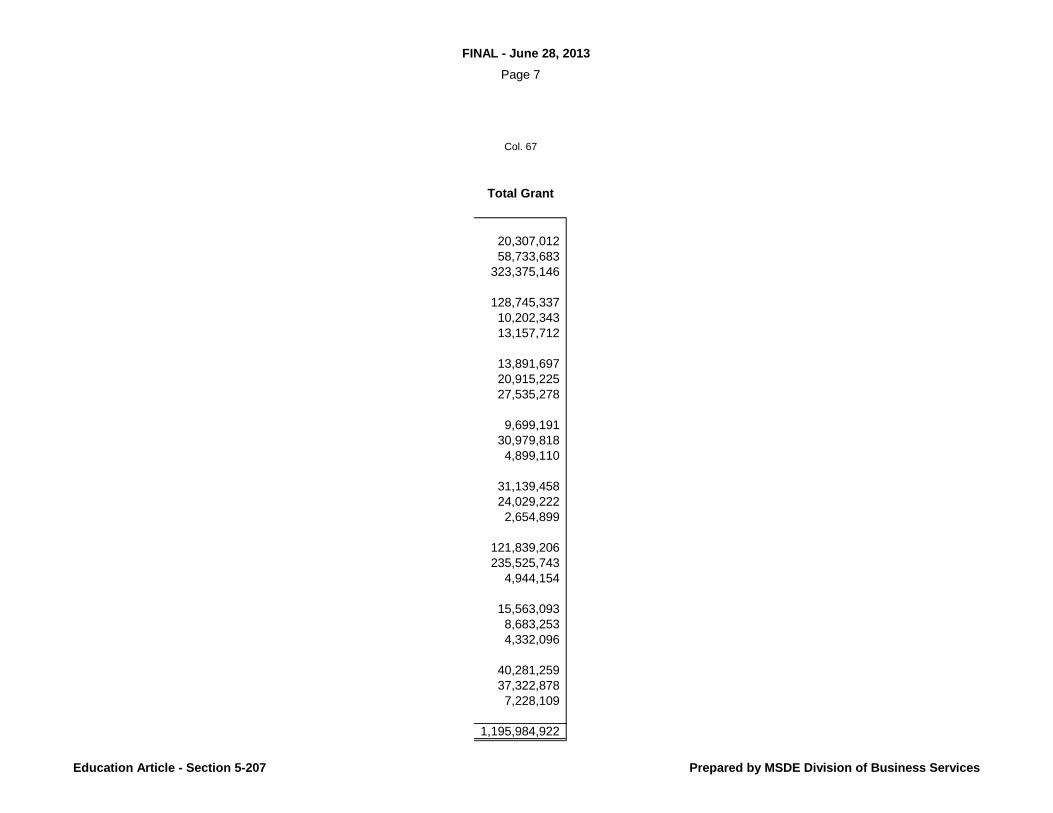
Page 7
Col. 67
Total Grant
20,307,012
58,733,683
323,375,146
128,745,337
10,202,343
13,157,712
13,891,697
20,915,225
27,535,278
9,699,191
30,979,818
4,899,110
31,139,458
24,029,222
2,654,899
121,839,206
235,525,743
4,944,154
15,563,093
8,683,253
4,332,096
40,281,259
37,322,878
7,228,109
1,195,984,922
Education Article - Section 5-207 Prepared by MSDE Division of Business Services

FINAL - June 28, 2013
Page 7a
State Compensatory Education
Fiscal Year 2014 - Based on November 1, 2012 Net Taxable Income (NTI)
Col. 68 Col. 69 Col. 70 Col. 71 Col. 72 Col. 73 Col. 74 Col. 75 Col. 76
Oct. 31, 2012 Oct. 31, 2012 Per Grant Additional
Eligible FARMS Eligible FARMS Times Pupil Unadjusted Adjusted Minimum Grant Total Grant
Students Students + SEED 3,312 Wealth 0.8315395 Grant (Col. 74 - Col. 73)
Allegany 4,510 4,510 14,937,120 294,770 24,907,700 20,711,736 11,949,696 - 20,711,736
Anne Arundel 22,158 22,167 73,417,104 599,122 60,232,657 50,085,833 58,733,683 8,647,850 58,733,683
Baltimore City 66,886 67,008 221,930,496 282,221 386,525,096 321,410,885 177,544,397 - 321,410,885
Baltimore 46,763 46,796 154,988,352 499,508 152,512,915 126,820,513 123,990,682 - 126,820,513
Calvert 3,495 3,498 11,585,376 458,316 12,424,964 10,331,848 9,268,301 - 10,331,848
Caroline 2,961 2,961 9,806,832 298,249 16,162,174 13,439,486 7,845,466 - 13,439,486
Carroll 4,561 4,562 15,109,344 438,961 16,918,805 14,068,655 12,087,475 - 14,068,655
Cecil 6,016 6,016 19,924,992 383,319 25,549,821 21,245,685 15,939,994 - 21,245,685
Charles 7,908 7,911 26,201,232 382,594 33,661,512 27,990,877 20,960,986 - 27,990,877
Dorchester 2,732 2,732 9,048,384 374,247 11,884,002 9,882,017 7,238,707 - 9,882,017
Frederick 9,374 9,375 31,050,000 405,932 37,597,445 31,263,761 24,840,000 - 31,263,761
Garrett 1,849 1,849 6,123,888 607,981 4,950,936 4,116,899 4,899,110 782,211 4,899,110
Harford 10,295 10,296 34,100,352 441,840 37,935,329 31,544,725 27,280,282 - 31,544,725
Howard 9,035 9,069 30,036,528 545,394 27,070,071 22,509,833 24,029,222 1,519,389 24,029,222
Kent 1,000 1,002 3,318,624 779,422 2,092,837 1,740,277 2,654,899 914,622 2,654,899
Montgomery 45,980 45,984 152,299,008 701,593 106,699,368 88,724,739 121,839,206 33,114,467 121,839,206
Prince George's 69,125 69,190 229,157,280 392,330 287,099,320 238,734,425 183,325,824 - 238,734,425
Queen Anne's 1,864 1,866 6,180,192 578,510 5,250,989 4,366,405 4,944,154 577,749 4,944,154
St. Mary's 5,072 5,073 16,801,776 434,084 19,025,297 15,820,286 13,441,421 - 15,820,286
Somerset 1,916 1,916 6,345,792 293,393 10,631,294 8,840,341 5,076,634 - 8,840,341
Talbot 1,635 1,635 5,415,120 1,111,452 2,394,790 1,991,362 4,332,096 2,340,734 4,332,096
Washington 10,330 10,332 34,219,584 341,785 49,212,085 40,921,793 27,375,667 - 40,921,793
Wicomico 8,019 8,022 26,568,864 286,810 45,533,255 37,862,700 21,255,091 - 37,862,700
Worcester 2,728 2,728 9,035,136 1,162,662 3,819,717 3,176,246 7,228,109 4,051,863 7,228,109
Total State 346,212 346,498 1,147,601,376 491,530 1,380,092,379 1,147,601,327 918,081,102 51,948,885 1,199,550,212
Education Article - Section 5-207 Prepared by MSDE Division of Business Services

FINAL - June 28, 2013
Page 8
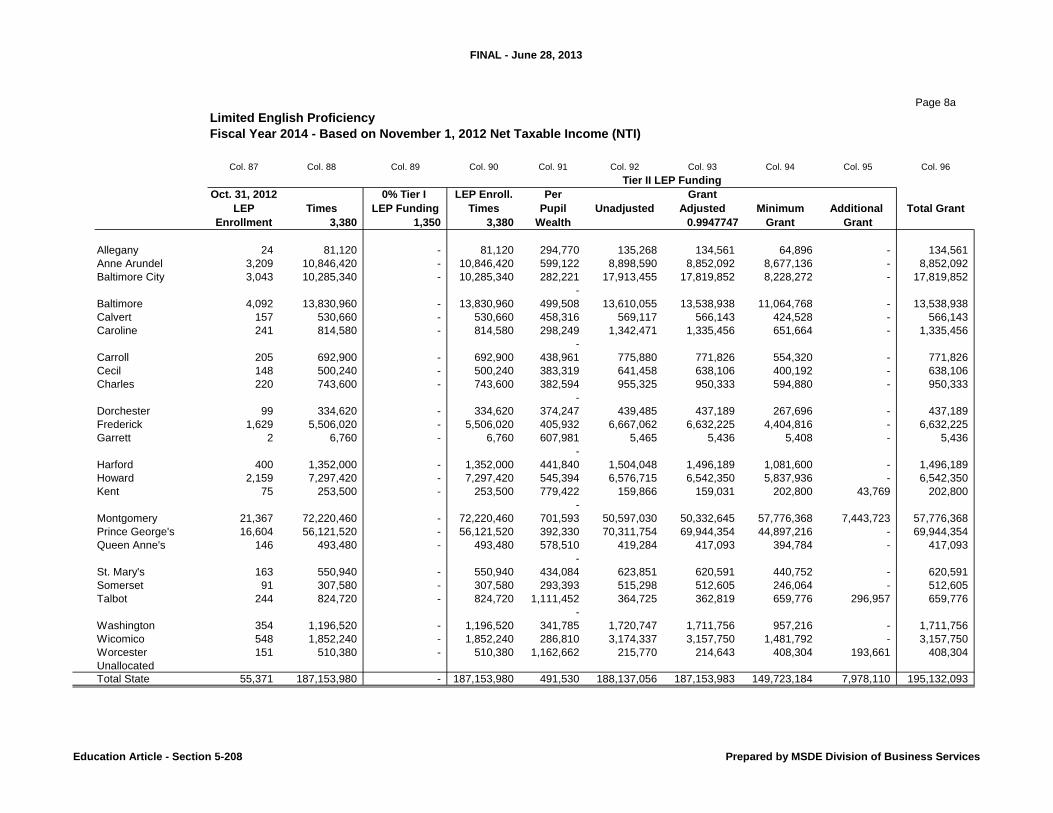
Limited English Proficiency
Fiscal Year 2014 - Based on September 1, 2012 Net Taxable Income (NTI)
Col. 77 Col. 78 Col. 79 Col. 80 Col. 81 Col. 82 Col. 83 Col. 84 Col. 85 Col. 86
Oct. 31, 2012 0% Tier I LEP Enroll. Per Grant
LEP Times LEP Funding Times Pupil Unadjusted Adjusted Minimum Additional Total Grant
Enrollment 3,380 1,350 3,380 Wealth 0.9957290 Grant Grant
Allegany 24 81,120 - 81,120 291,969 131,653 131,091 64,896 - 131,091
Anne Arundel 3,209 10,846,420 - 10,846,420 582,726 8,819,829 8,782,160 8,677,136 - 8,782,160
Baltimore City 3,043 10,285,340 - 10,285,340 272,412 17,890,834 17,814,422 8,228,272 - 17,814,422
Baltimore 4,092 13,830,960 - 13,830,960 477,841 13,715,355 13,656,777 11,064,768 - 13,656,777
Calvert 157 530,660 - 530,660 450,740 557,864 555,481 424,528 - 555,481
Caroline 241 814,580 - 814,580 295,845 1,304,691 1,299,119 651,664 - 1,299,119
Carroll 205 692,900 - 692,900 431,724 760,506 757,258 554,320 - 757,258
Cecil 148 500,240 - 500,240 378,139 626,852 624,175 400,192 - 624,175
Charles 220 743,600 - 743,600 377,701 932,888 928,904 594,880 - 928,904
Dorchester 99 334,620 - 334,620 370,298 428,192 426,363 267,696 - 426,363
Frederick 1,629 5,506,020 - 5,506,020 397,831 6,558,089 6,530,079 4,404,816 - 6,530,079
Garrett 2 6,760 - 6,760 601,519 5,325 5,302 5,408 106 5,408
Harford 400 1,352,000 - 1,352,000 434,674 1,473,843 1,467,548 1,081,600 - 1,467,548
Howard 2,159 7,297,420 - 7,297,420 525,599 6,578,895 6,550,797 5,837,936 - 6,550,797
Kent 75 253,500 - 253,500 765,949 156,825 156,155 202,800 46,645 202,800
Montgomery 21,367 72,220,460 - 72,220,460 654,775 52,264,439 52,041,218 57,776,368 5,735,150 57,776,368
Prince George's 16,604 56,121,520 - 56,121,520 386,199 68,858,319 68,564,225 44,897,216 - 68,564,225
Queen Anne's 146 493,480 - 493,480 564,189 414,460 412,690 394,784 - 412,690
St. Mary's 163 550,940 - 550,940 428,524 609,210 606,608 440,752 - 606,608
Somerset 91 307,580 - 307,580 290,081 502,432 500,286 246,064 - 500,286
Talbot 244 824,720 - 824,720 1,062,356 367,853 366,282 659,776 293,494 659,776
Washington 354 1,196,520 - 1,196,520 337,200 1,681,398 1,674,217 957,216 - 1,674,217
Wicomico 548 1,852,240 - 1,852,240 282,562 3,106,145 3,092,879 1,481,792 - 3,092,879
Worcester 151 510,380 - 510,380 1,146,967 210,854 209,953 408,304 198,351 408,304
Unallocated
Total State 55,371 187,153,980 - 187,153,980 473,847 187,956,751 187,153,989 149,723,184 6,273,746 193,427,735
Tier II LEP Funding
Education Article - Section 5-208 Prepared by MSDE Division of Business Services
FINAL - June 28, 2013
Page 8a
Limited English Proficiency
Fiscal Year 2014 - Based on November 1, 2012 Net Taxable Income (NTI)
Col. 87 Col. 88 Col. 89 Col. 90 Col. 91 Col. 92 Col. 93 Col. 94 Col. 95 Col. 96
Oct. 31, 2012 0% Tier I LEP Enroll. Per Grant
LEP Times LEP Funding Times Pupil Unadjusted Adjusted Minimum Additional Total Grant
Enrollment 3,380 1,350 3,380 Wealth 0.9947747 Grant Grant
Allegany 24 81,120 - 81,120 294,770 135,268 134,561 64,896 - 134,561
Anne Arundel 3,209 10,846,420 - 10,846,420 599,122 8,898,590 8,852,092 8,677,136 - 8,852,092
Baltimore City 3,043 10,285,340 - 10,285,340 282,221 17,913,455 17,819,852 8,228,272 - 17,819,852
-
Baltimore 4,092 13,830,960 - 13,830,960 499,508 13,610,055 13,538,938 11,064,768 - 13,538,938
Calvert 157 530,660 - 530,660 458,316 569,117 566,143 424,528 - 566,143
Caroline 241 814,580 - 814,580 298,249 1,342,471 1,335,456 651,664 - 1,335,456
-
Carroll 205 692,900 - 692,900 438,961 775,880 771,826 554,320 - 771,826
Cecil 148 500,240 - 500,240 383,319 641,458 638,106 400,192 - 638,106
Charles 220 743,600 - 743,600 382,594 955,325 950,333 594,880 - 950,333
-
Dorchester 99 334,620 - 334,620 374,247 439,485 437,189 267,696 - 437,189
Frederick 1,629 5,506,020 - 5,506,020 405,932 6,667,062 6,632,225 4,404,816 - 6,632,225
Garrett 2 6,760 - 6,760 607,981 5,465 5,436 5,408 - 5,436
-
Harford 400 1,352,000 - 1,352,000 441,840 1,504,048 1,496,189 1,081,600 - 1,496,189
Howard 2,159 7,297,420 - 7,297,420 545,394 6,576,715 6,542,350 5,837,936 - 6,542,350
Kent 75 253,500 - 253,500 779,422 159,866 159,031 202,800 43,769 202,800
-
Montgomery 21,367 72,220,460 - 72,220,460 701,593 50,597,030 50,332,645 57,776,368 7,443,723 57,776,368
Prince George's 16,604 56,121,520 - 56,121,520 392,330 70,311,754 69,944,354 44,897,216 - 69,944,354
Queen Anne's 146 493,480 - 493,480 578,510 419,284 417,093 394,784 - 417,093
-
St. Mary's 163 550,940 - 550,940 434,084 623,851 620,591 440,752 - 620,591
Somerset 91 307,580 - 307,580 293,393 515,298 512,605 246,064 - 512,605
Talbot 244 824,720 - 824,720 1,111,452 364,725 362,819 659,776 296,957 659,776
-
Washington 354 1,196,520 - 1,196,520 341,785 1,720,747 1,711,756 957,216 - 1,711,756
Wicomico 548 1,852,240 - 1,852,240 286,810 3,174,337 3,157,750 1,481,792 - 3,157,750
Worcester 151 510,380 - 510,380 1,162,662 215,770 214,643 408,304 193,661 408,304
Unallocated
Total State 55,371 187,153,980 - 187,153,980 491,530 188,137,056 187,153,983 149,723,184 7,978,110 195,132,093
Tier II LEP Funding
Education Article - Section 5-208 Prepared by MSDE Division of Business Services
FINAL - June 28, 2013
Page 9
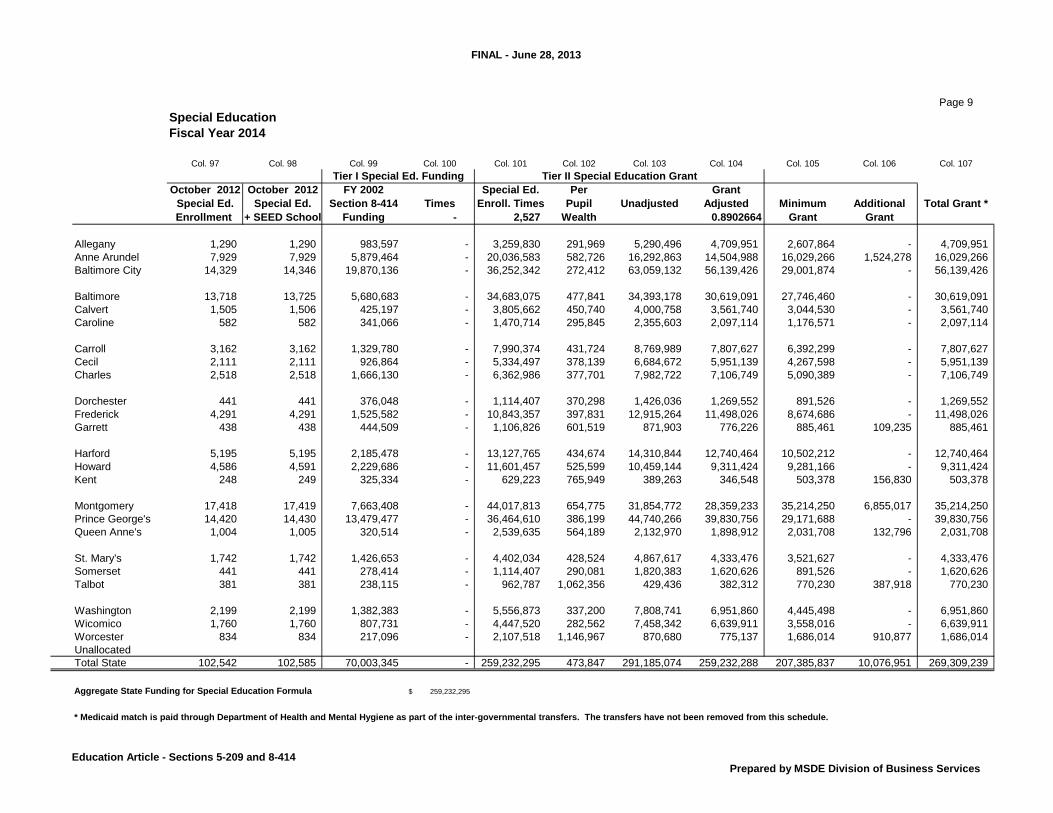
Special Education
Fiscal Year 2014
Col. 97 Col. 98 Col. 99 Col. 100 Col. 101 Col. 102 Col. 103 Col. 104 Col. 105 Col. 106 Col. 107
October 2012 October 2012 FY 2002 Special Ed. Per Grant
Special Ed. Special Ed. Section 8-414 Times Enroll. Times Pupil Unadjusted Adjusted Minimum Additional Total Grant *
Enrollment + SEED School Funding - 2,527 Wealth 0.8902664 Grant Grant
Allegany 1,290 1,290 983,597 - 3,259,830 291,969 5,290,496 4,709,951 2,607,864 - 4,709,951
Anne Arundel 7,929 7,929 5,879,464 - 20,036,583 582,726 16,292,863 14,504,988 16,029,266 1,524,278 16,029,266
Baltimore City 14,329 14,346 19,870,136 - 36,252,342 272,412 63,059,132 56,139,426 29,001,874 - 56,139,426
Baltimore 13,718 13,725 5,680,683 - 34,683,075 477,841 34,393,178 30,619,091 27,746,460 - 30,619,091
Calvert 1,505 1,506 425,197 - 3,805,662 450,740 4,000,758 3,561,740 3,044,530 - 3,561,740
Caroline 582 582 341,066 - 1,470,714 295,845 2,355,603 2,097,114 1,176,571 - 2,097,114
Carroll 3,162 3,162 1,329,780 - 7,990,374 431,724 8,769,989 7,807,627 6,392,299 - 7,807,627
Cecil 2,111 2,111 926,864 - 5,334,497 378,139 6,684,672 5,951,139 4,267,598 - 5,951,139
Charles 2,518 2,518 1,666,130 - 6,362,986 377,701 7,982,722 7,106,749 5,090,389 - 7,106,749
Dorchester 441 441 376,048 - 1,114,407 370,298 1,426,036 1,269,552 891,526 - 1,269,552
Frederick 4,291 4,291 1,525,582 - 10,843,357 397,831 12,915,264 11,498,026 8,674,686 - 11,498,026
Garrett 438 438 444,509 - 1,106,826 601,519 871,903 776,226 885,461 109,235 885,461
Harford 5,195 5,195 2,185,478 - 13,127,765 434,674 14,310,844 12,740,464 10,502,212 - 12,740,464
Howard 4,586 4,591 2,229,686 - 11,601,457 525,599 10,459,144 9,311,424 9,281,166 - 9,311,424
Kent 248 249 325,334 - 629,223 765,949 389,263 346,548 503,378 156,830 503,378
Montgomery 17,418 17,419 7,663,408 - 44,017,813 654,775 31,854,772 28,359,233 35,214,250 6,855,017 35,214,250
Prince George's 14,420 14,430 13,479,477 - 36,464,610 386,199 44,740,266 39,830,756 29,171,688 - 39,830,756
Queen Anne's 1,004 1,005 320,514 - 2,539,635 564,189 2,132,970 1,898,912 2,031,708 132,796 2,031,708
St. Mary's 1,742 1,742 1,426,653 - 4,402,034 428,524 4,867,617 4,333,476 3,521,627 - 4,333,476
Somerset 441 441 278,414 - 1,114,407 290,081 1,820,383 1,620,626 891,526 - 1,620,626
Talbot 381 381 238,115 - 962,787 1,062,356 429,436 382,312 770,230 387,918 770,230
Washington 2,199 2,199 1,382,383 - 5,556,873 337,200 7,808,741 6,951,860 4,445,498 - 6,951,860
Wicomico 1,760 1,760 807,731 - 4,447,520 282,562 7,458,342 6,639,911 3,558,016 - 6,639,911
Worcester 834 834 217,096 - 2,107,518 1,146,967 870,680 775,137 1,686,014 910,877 1,686,014
Unallocated
Total State 102,542 102,585 70,003,345 - 259,232,295 473,847 291,185,074 259,232,288 207,385,837 10,076,951 269,309,239
259,232,295$
* Medicaid match is paid through Department of Health and Mental Hygiene as part of the inter-governmental transfers. The transfers have not been removed from this schedule.
Tier I Special Ed. Funding Tier II Special Education Grant
Aggregate State Funding for Special Education Formula
Education Article - Sections 5-209 and 8-414Prepared by MSDE Division of Business Services
FINAL - June 28, 2013
Page 9a
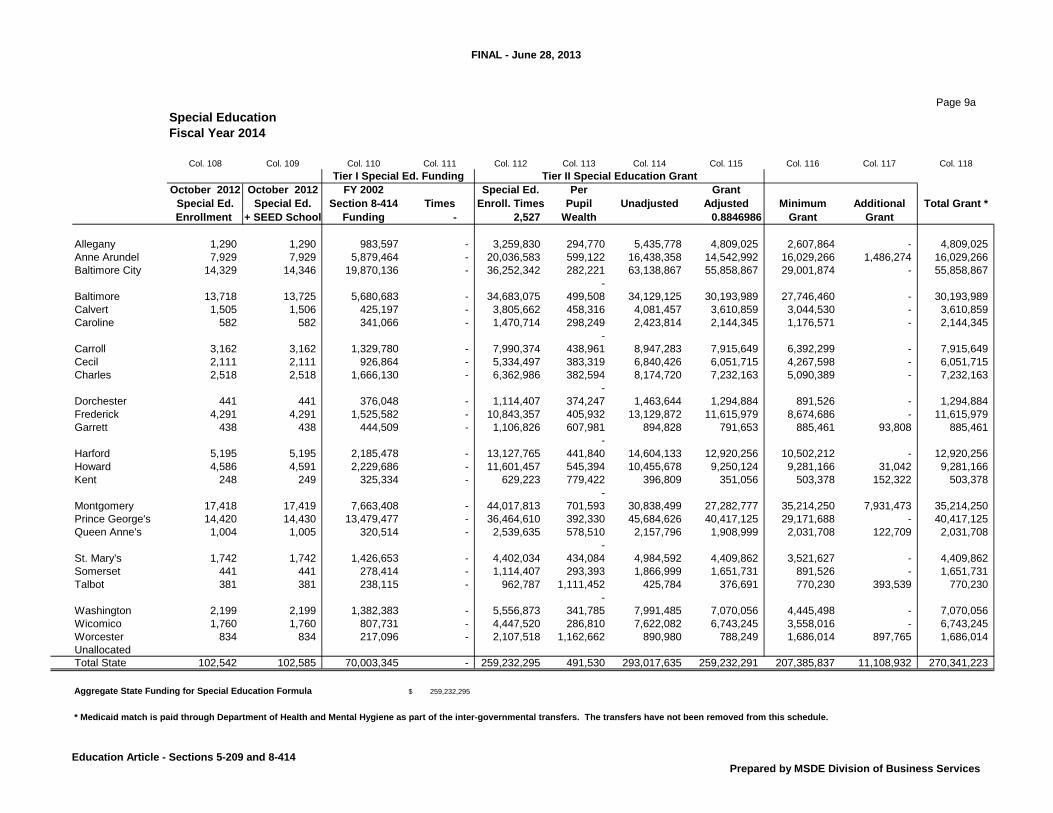
Special Education
Fiscal Year 2014
Col. 108 Col. 109 Col. 110 Col. 111 Col. 112 Col. 113 Col. 114 Col. 115 Col. 116 Col. 117 Col. 118
October 2012 October 2012 FY 2002 Special Ed. Per Grant
Special Ed. Special Ed. Section 8-414 Times Enroll. Times Pupil Unadjusted Adjusted Minimum Additional Total Grant *
Enrollment + SEED School Funding - 2,527 Wealth 0.8846986 Grant Grant
Allegany 1,290 1,290 983,597 - 3,259,830 294,770 5,435,778 4,809,025 2,607,864 - 4,809,025
Anne Arundel 7,929 7,929 5,879,464 - 20,036,583 599,122 16,438,358 14,542,992 16,029,266 1,486,274 16,029,266
Baltimore City 14,329 14,346 19,870,136 - 36,252,342 282,221 63,138,867 55,858,867 29,001,874 - 55,858,867
-
Baltimore 13,718 13,725 5,680,683 - 34,683,075 499,508 34,129,125 30,193,989 27,746,460 - 30,193,989
Calvert 1,505 1,506 425,197 - 3,805,662 458,316 4,081,457 3,610,859 3,044,530 - 3,610,859
Caroline 582 582 341,066 - 1,470,714 298,249 2,423,814 2,144,345 1,176,571 - 2,144,345
-
Carroll 3,162 3,162 1,329,780 - 7,990,374 438,961 8,947,283 7,915,649 6,392,299 - 7,915,649
Cecil 2,111 2,111 926,864 - 5,334,497 383,319 6,840,426 6,051,715 4,267,598 - 6,051,715
Charles 2,518 2,518 1,666,130 - 6,362,986 382,594 8,174,720 7,232,163 5,090,389 - 7,232,163
-
Dorchester 441 441 376,048 - 1,114,407 374,247 1,463,644 1,294,884 891,526 - 1,294,884
Frederick 4,291 4,291 1,525,582 - 10,843,357 405,932 13,129,872 11,615,979 8,674,686 - 11,615,979
Garrett 438 438 444,509 - 1,106,826 607,981 894,828 791,653 885,461 93,808 885,461
-
Harford 5,195 5,195 2,185,478 - 13,127,765 441,840 14,604,133 12,920,256 10,502,212 - 12,920,256
Howard 4,586 4,591 2,229,686 - 11,601,457 545,394 10,455,678 9,250,124 9,281,166 31,042 9,281,166
Kent 248 249 325,334 - 629,223 779,422 396,809 351,056 503,378 152,322 503,378
-
Montgomery 17,418 17,419 7,663,408 - 44,017,813 701,593 30,838,499 27,282,777 35,214,250 7,931,473 35,214,250
Prince George's 14,420 14,430 13,479,477 - 36,464,610 392,330 45,684,626 40,417,125 29,171,688 - 40,417,125
Queen Anne's 1,004 1,005 320,514 - 2,539,635 578,510 2,157,796 1,908,999 2,031,708 122,709 2,031,708
-
St. Mary's 1,742 1,742 1,426,653 - 4,402,034 434,084 4,984,592 4,409,862 3,521,627 - 4,409,862
Somerset 441 441 278,414 - 1,114,407 293,393 1,866,999 1,651,731 891,526 - 1,651,731
Talbot 381 381 238,115 - 962,787 1,111,452 425,784 376,691 770,230 393,539 770,230
-
Washington 2,199 2,199 1,382,383 - 5,556,873 341,785 7,991,485 7,070,056 4,445,498 - 7,070,056
Wicomico 1,760 1,760 807,731 - 4,447,520 286,810 7,622,082 6,743,245 3,558,016 - 6,743,245
Worcester 834 834 217,096 - 2,107,518 1,162,662 890,980 788,249 1,686,014 897,765 1,686,014
Unallocated
Total State 102,542 102,585 70,003,345 - 259,232,295 491,530 293,017,635 259,232,291 207,385,837 11,108,932 270,341,223
259,232,295$
* Medicaid match is paid through Department of Health and Mental Hygiene as part of the inter-governmental transfers. The transfers have not been removed from this schedule.
Tier I Special Ed. Funding Tier II Special Education Grant
Aggregate State Funding for Special Education Formula
Education Article - Sections 5-209 and 8-414Prepared by MSDE Division of Business Services

FINAL - June 28, 2013
Page 10
Guaranteed Tax Base Funding
Fiscal Year 2014 - Based on September 1, 2012 Net Taxable Income (NTI)
Col. 119 Col. 120 Col. 121 Col. 122 Col. 123 Col. 124 Col. 125 Col. 126 Col. 127 Col. 128 Col. 129
Current Yr.
Prior Year Local Share Additional Additional Difference GTB Subject to 100%
Local of Foundation Education Local Education FTE Wealth From Per Max. of 20% Phased-in
Local Unit Appropriation Program Appropriation Wealth Effort Enrollment Per Pupil Guarantee Pupil 1,365.80 Amount
Allegany 29,391,956 17,689,612 11,702,344 2,454,878,950 0.0047670 8,408.00 291,969 87,109 415.25 415.25 3,491,422
Anne Arundel 584,579,700 316,803,705 267,775,995 43,964,488,130 0.0060907 75,446.25 582,726 - - - -
Baltimore City 252,813,655 155,600,972 97,212,683 21,593,551,438 0.0045019 79,268.00 272,412 106,666 480.20 480.20 38,064,494
Baltimore 689,791,448 354,710,506 335,080,942 49,225,010,943 0.0068071 103,015.50 477,841 - - - -
Calvert 110,284,424 51,596,685 58,687,739 7,160,338,792 0.0081962 15,885.75 450,740 - - - -
Caroline 13,206,304 11,128,132 2,078,172 1,544,308,434 0.0013457 5,220.00 295,845 83,233 112.01 112.01 584,692
Carroll 168,900,000 81,874,237 87,025,763 11,362,111,228 0.0076593 26,318.00 431,724 - - - -
Cecil 69,615,833 40,891,535 28,724,298 5,674,729,781 0.0050618 15,007.00 378,139 939 4.75 4.75 71,283
Charles 153,957,200 69,993,266 83,963,934 9,713,327,352 0.0086442 25,717.00 377,701 1,377 11.90 11.90 306,032
Dorchester 17,963,318 11,866,078 6,097,240 1,646,716,940 0.0037027 4,447.00 370,298 8,780 32.51 32.51 144,572
Frederick 227,547,824 112,826,019 114,721,805 15,657,449,937 0.0073270 39,357.00 397,831 - - - -
Garrett 26,023,714 16,982,510 9,041,204 2,356,750,700 0.0038363 3,918.00 601,519 - - - -
Harford 219,821,368 116,158,263 103,663,105 16,119,882,717 0.0064308 37,085.00 434,674 - - - -
Howard 482,384,818 192,980,944 289,403,874 26,780,963,401 0.0108063 50,953.25 525,599 - - - -
Kent 17,362,758 11,089,751 6,273,007 1,538,982,125 0.0040761 2,009.25 765,949 - - - -
Montgomery 1,419,513,701 683,527,412 735,986,289 94,856,632,982 0.0077589 144,869.00 654,775 - - - -
Prince George's 633,069,100 327,797,403 305,271,697 45,490,140,424 0.0067107 117,789.25 386,199 - - - -
Queen Anne's 44,860,051 30,505,398 14,354,653 4,233,391,862 0.0033908 7,503.50 564,189 - - - -
St. Mary's 85,697,709 51,527,818 34,169,891 7,150,781,698 0.0047785 16,687.00 428,524 - - - -
Somerset 9,104,448 5,696,046 3,408,402 790,469,697 0.0043119 2,725.00 290,081 88,997 383.75 383.75 1,045,719
Talbot 34,960,007 32,741,427 2,218,580 4,543,697,090 0.0004883 4,277.00 1,062,356 - - - -
Washington 92,951,603 53,182,942 39,768,661 7,380,471,866 0.0053884 21,887.50 337,200 41,878 225.66 225.66 4,939,133
Wicomico 39,173,593 28,428,721 10,744,872 3,945,200,647 0.0027235 13,962.25 282,562 96,516 262.86 262.86 3,670,117
Worcester 73,923,044 51,597,972 22,325,072 7,160,517,312 0.0031178 6,243.00 1,146,967 - - - -
Total State 5,496,897,576 2,827,197,354 2,669,700,222 392,344,794,446 0.0068045 827,998.50 473,847 52,317,464
Guaranteed Wealth Per Pupil (80% of Statewide Wealth Per Pupil) 379,078
GTB Program Per Pupil Amt.
Education Article - Section 5- 210Prepared by
MSDE Division of Business Services
FINAL - June 28, 2013
Page 10a
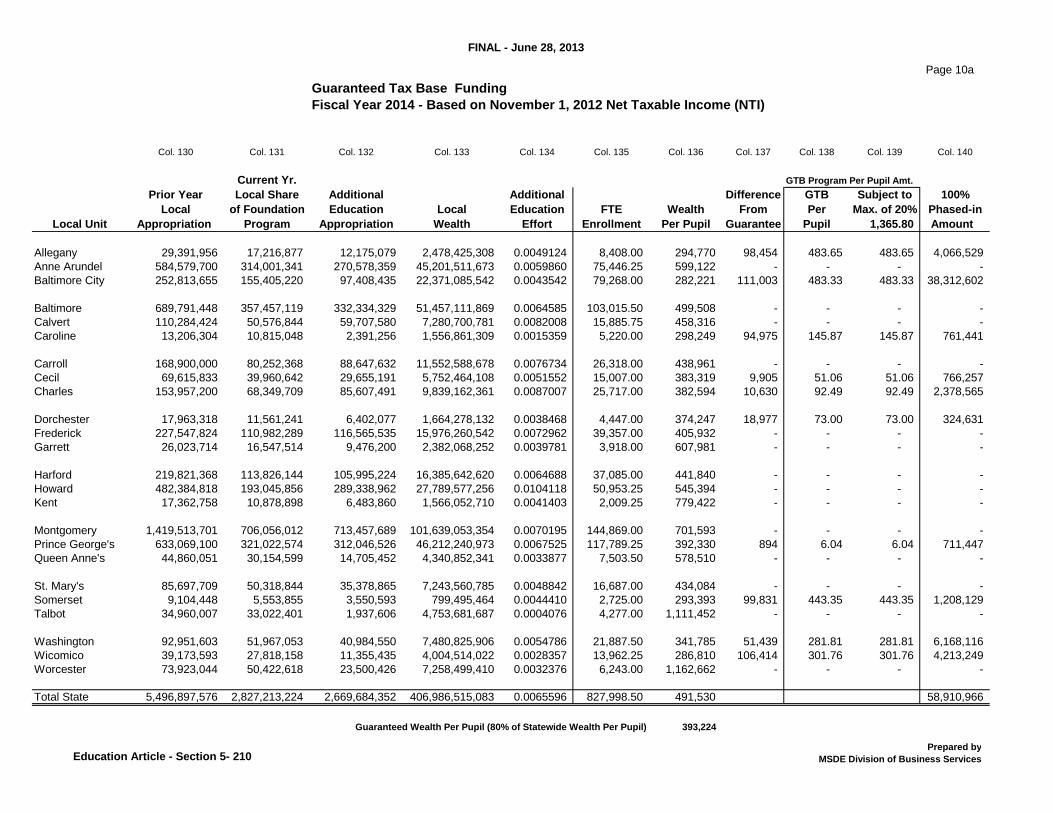
Guaranteed Tax Base Funding
Fiscal Year 2014 - Based on November 1, 2012 Net Taxable Income (NTI)
Col. 130 Col. 131 Col. 132 Col. 133 Col. 134 Col. 135 Col. 136 Col. 137 Col. 138 Col. 139 Col. 140
Current Yr. GTB Program Per Pupil Amt.
Prior Year Local Share Additional Additional Difference GTB Subject to 100%
Local of Foundation Education Local Education FTE Wealth From Per Max. of 20% Phased-in
Local Unit Appropriation Program Appropriation Wealth Effort Enrollment Per Pupil Guarantee Pupil 1,365.80 Amount
Allegany 29,391,956 17,216,877 12,175,079 2,478,425,308 0.0049124 8,408.00 294,770 98,454 483.65 483.65 4,066,529
Anne Arundel 584,579,700 314,001,341 270,578,359 45,201,511,673 0.0059860 75,446.25 599,122 - - - -
Baltimore City 252,813,655 155,405,220 97,408,435 22,371,085,542 0.0043542 79,268.00 282,221 111,003 483.33 483.33 38,312,602
Baltimore 689,791,448 357,457,119 332,334,329 51,457,111,869 0.0064585 103,015.50 499,508 - - - -
Calvert 110,284,424 50,576,844 59,707,580 7,280,700,781 0.0082008 15,885.75 458,316 - - - -
Caroline 13,206,304 10,815,048 2,391,256 1,556,861,309 0.0015359 5,220.00 298,249 94,975 145.87 145.87 761,441
Carroll 168,900,000 80,252,368 88,647,632 11,552,588,678 0.0076734 26,318.00 438,961 - - - -
Cecil 69,615,833 39,960,642 29,655,191 5,752,464,108 0.0051552 15,007.00 383,319 9,905 51.06 51.06 766,257
Charles 153,957,200 68,349,709 85,607,491 9,839,162,361 0.0087007 25,717.00 382,594 10,630 92.49 92.49 2,378,565
Dorchester 17,963,318 11,561,241 6,402,077 1,664,278,132 0.0038468 4,447.00 374,247 18,977 73.00 73.00 324,631
Frederick 227,547,824 110,982,289 116,565,535 15,976,260,542 0.0072962 39,357.00 405,932 - - - -
Garrett 26,023,714 16,547,514 9,476,200 2,382,068,252 0.0039781 3,918.00 607,981 - - - -
Harford 219,821,368 113,826,144 105,995,224 16,385,642,620 0.0064688 37,085.00 441,840 - - - -
Howard 482,384,818 193,045,856 289,338,962 27,789,577,256 0.0104118 50,953.25 545,394 - - - -
Kent 17,362,758 10,878,898 6,483,860 1,566,052,710 0.0041403 2,009.25 779,422 - - - -
Montgomery 1,419,513,701 706,056,012 713,457,689 101,639,053,354 0.0070195 144,869.00 701,593 - - - -
Prince George's 633,069,100 321,022,574 312,046,526 46,212,240,973 0.0067525 117,789.25 392,330 894 6.04 6.04 711,447
Queen Anne's 44,860,051 30,154,599 14,705,452 4,340,852,341 0.0033877 7,503.50 578,510 - - - -
St. Mary's 85,697,709 50,318,844 35,378,865 7,243,560,785 0.0048842 16,687.00 434,084 - - - -
Somerset 9,104,448 5,553,855 3,550,593 799,495,464 0.0044410 2,725.00 293,393 99,831 443.35 443.35 1,208,129
Talbot 34,960,007 33,022,401 1,937,606 4,753,681,687 0.0004076 4,277.00 1,111,452 - - - -
Washington 92,951,603 51,967,053 40,984,550 7,480,825,906 0.0054786 21,887.50 341,785 51,439 281.81 281.81 6,168,116
Wicomico 39,173,593 27,818,158 11,355,435 4,004,514,022 0.0028357 13,962.25 286,810 106,414 301.76 301.76 4,213,249
Worcester 73,923,044 50,422,618 23,500,426 7,258,499,410 0.0032376 6,243.00 1,162,662 - - - -
Total State 5,496,897,576 2,827,213,224 2,669,684,352 406,986,515,083 0.0065596 827,998.50 491,530 58,910,966
Guaranteed Wealth Per Pupil (80% of Statewide Wealth Per Pupil) 393,224
Education Article - Section 5- 210Prepared by
MSDE Division of Business Services
FINAL - June 28, 2013
Page 11
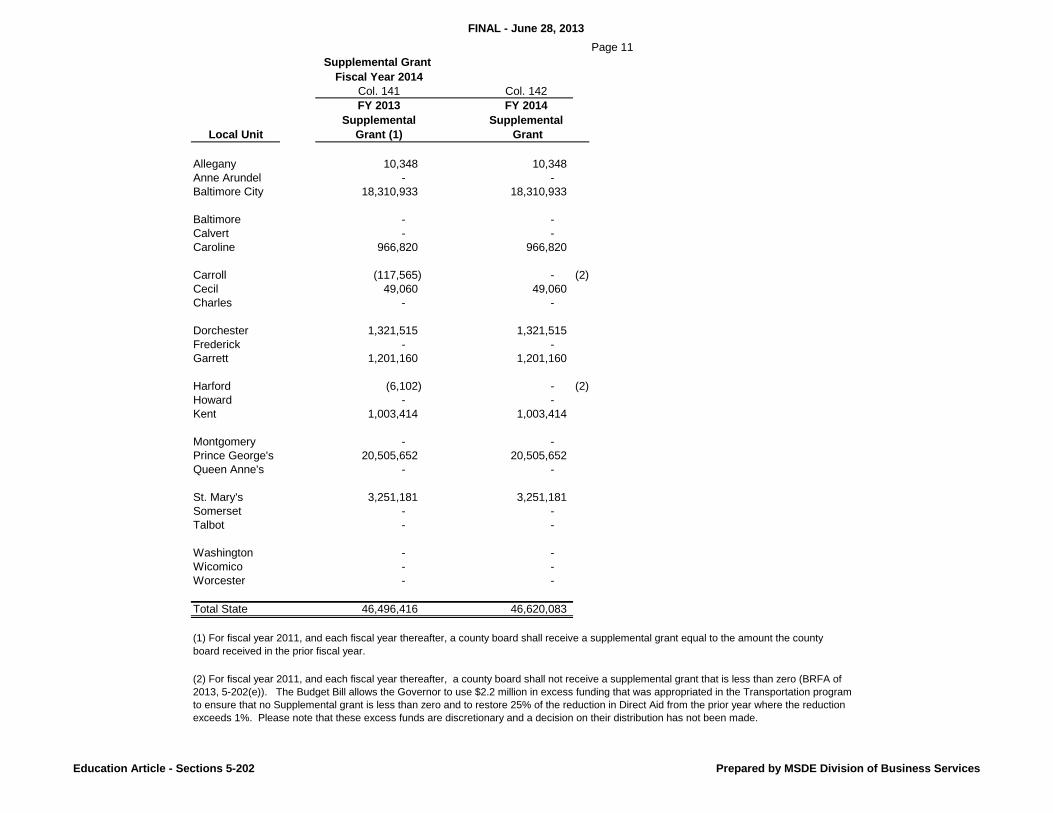
Supplemental Grant
Fiscal Year 2014
Col. 141 Col. 142
FY 2013 FY 2014
Supplemental Supplemental
Local Unit Grant (1) Grant
Allegany 10,348 10,348
Anne Arundel - -
Baltimore City 18,310,933 18,310,933
Baltimore - -
Calvert - -
Caroline 966,820 966,820
Carroll (117,565) - (2)
Cecil 49,060 49,060
Charles - -
Dorchester 1,321,515 1,321,515
Frederick - -
Garrett 1,201,160 1,201,160
Harford (6,102) - (2)
Howard - -
Kent 1,003,414 1,003,414
Montgomery - -
Prince George's 20,505,652 20,505,652
Queen Anne's - -
St. Mary's 3,251,181 3,251,181
Somerset - -
Talbot - -
Washington - -
Wicomico - -
Worcester - -
Total State 46,496,416 46,620,083
(1) For fiscal year 2011, and each fiscal year thereafter, a county board shall receive a supplemental grant equal to the amount the county
board received in the prior fiscal year.
(2) For fiscal year 2011, and each fiscal year thereafter, a county board shall not receive a supplemental grant that is less than zero (BRFA of
2013, 5-202(e)). The Budget Bill allows the Governor to use $2.2 million in excess funding that was appropriated in the Transportation program
to ensure that no Supplemental grant is less than zero and to restore 25% of the reduction in Direct Aid from the prior year where the reduction
exceeds 1%. Please note that these excess funds are discretionary and a decision on their distribution has not been made.
Education Article - Sections 5-202 Prepared by MSDE Division of Business Services
FINAL - June 28, 2013
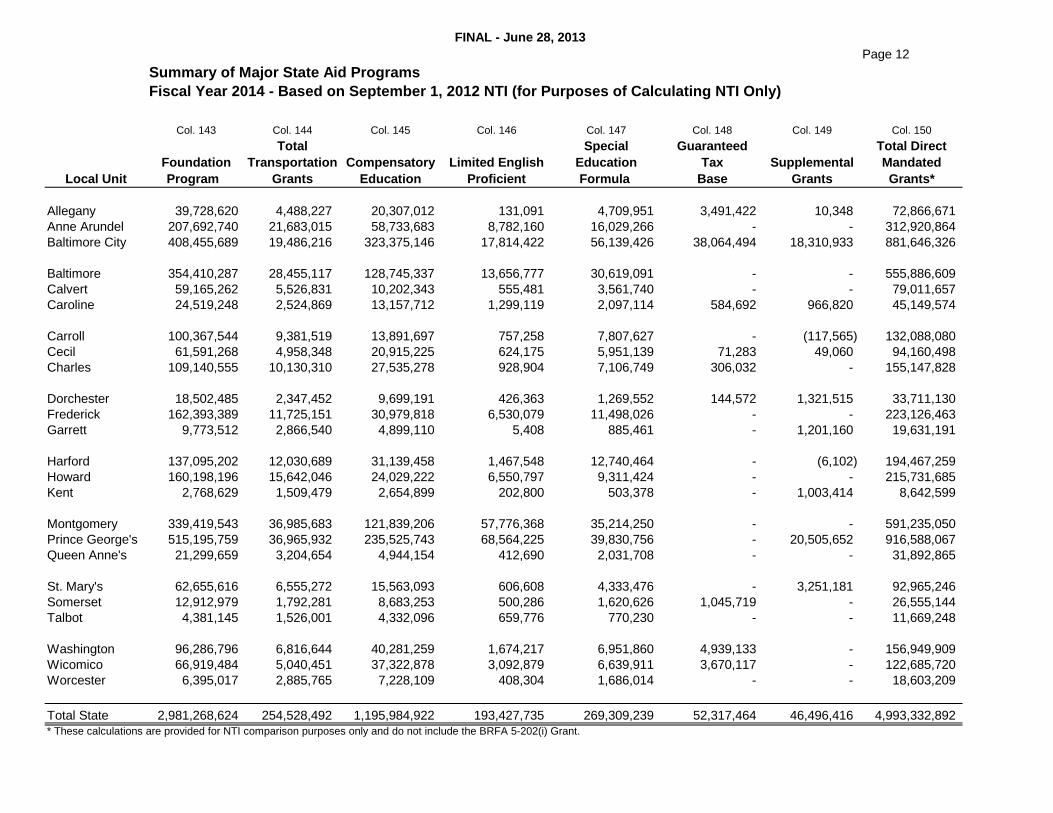
Page 12
Summary of Major State Aid Programs
Fiscal Year 2014 - Based on September 1, 2012 NTI (for Purposes of Calculating NTI Only)
Col. 143 Col. 144 Col. 145 Col. 146 Col. 147 Col. 148 Col. 149 Col. 150
Total Special Guaranteed Total Direct
Foundation Transportation Compensatory Limited English Education Tax Supplemental Mandated
Local Unit Program Grants Education Proficient Formula Base Grants Grants*
Allegany 39,728,620 4,488,227 20,307,012 131,091 4,709,951 3,491,422 10,348 72,866,671
Anne Arundel 207,692,740 21,683,015 58,733,683 8,782,160 16,029,266 - - 312,920,864
Baltimore City 408,455,689 19,486,216 323,375,146 17,814,422 56,139,426 38,064,494 18,310,933 881,646,326
Baltimore 354,410,287 28,455,117 128,745,337 13,656,777 30,619,091 - - 555,886,609
Calvert 59,165,262 5,526,831 10,202,343 555,481 3,561,740 - - 79,011,657
Caroline 24,519,248 2,524,869 13,157,712 1,299,119 2,097,114 584,692 966,820 45,149,574
Carroll 100,367,544 9,381,519 13,891,697 757,258 7,807,627 - (117,565) 132,088,080
Cecil 61,591,268 4,958,348 20,915,225 624,175 5,951,139 71,283 49,060 94,160,498
Charles 109,140,555 10,130,310 27,535,278 928,904 7,106,749 306,032 - 155,147,828
Dorchester 18,502,485 2,347,452 9,699,191 426,363 1,269,552 144,572 1,321,515 33,711,130
Frederick 162,393,389 11,725,151 30,979,818 6,530,079 11,498,026 - - 223,126,463
Garrett 9,773,512 2,866,540 4,899,110 5,408 885,461 - 1,201,160 19,631,191
Harford 137,095,202 12,030,689 31,139,458 1,467,548 12,740,464 - (6,102) 194,467,259
Howard 160,198,196 15,642,046 24,029,222 6,550,797 9,311,424 - - 215,731,685
Kent 2,768,629 1,509,479 2,654,899 202,800 503,378 - 1,003,414 8,642,599
Montgomery 339,419,543 36,985,683 121,839,206 57,776,368 35,214,250 - - 591,235,050
Prince George's 515,195,759 36,965,932 235,525,743 68,564,225 39,830,756 - 20,505,652 916,588,067
Queen Anne's 21,299,659 3,204,654 4,944,154 412,690 2,031,708 - - 31,892,865
St. Mary's 62,655,616 6,555,272 15,563,093 606,608 4,333,476 - 3,251,181 92,965,246
Somerset 12,912,979 1,792,281 8,683,253 500,286 1,620,626 1,045,719 - 26,555,144
Talbot 4,381,145 1,526,001 4,332,096 659,776 770,230 - - 11,669,248
Washington 96,286,796 6,816,644 40,281,259 1,674,217 6,951,860 4,939,133 - 156,949,909
Wicomico 66,919,484 5,040,451 37,322,878 3,092,879 6,639,911 3,670,117 - 122,685,720
Worcester 6,395,017 2,885,765 7,228,109 408,304 1,686,014 - - 18,603,209
Total State 2,981,268,624 254,528,492 1,195,984,922 193,427,735 269,309,239 52,317,464 46,496,416 4,993,332,892
* These calculations are provided for NTI comparison purposes only and do not include the BRFA 5-202(i) Grant.
FINAL - June 28, 2013
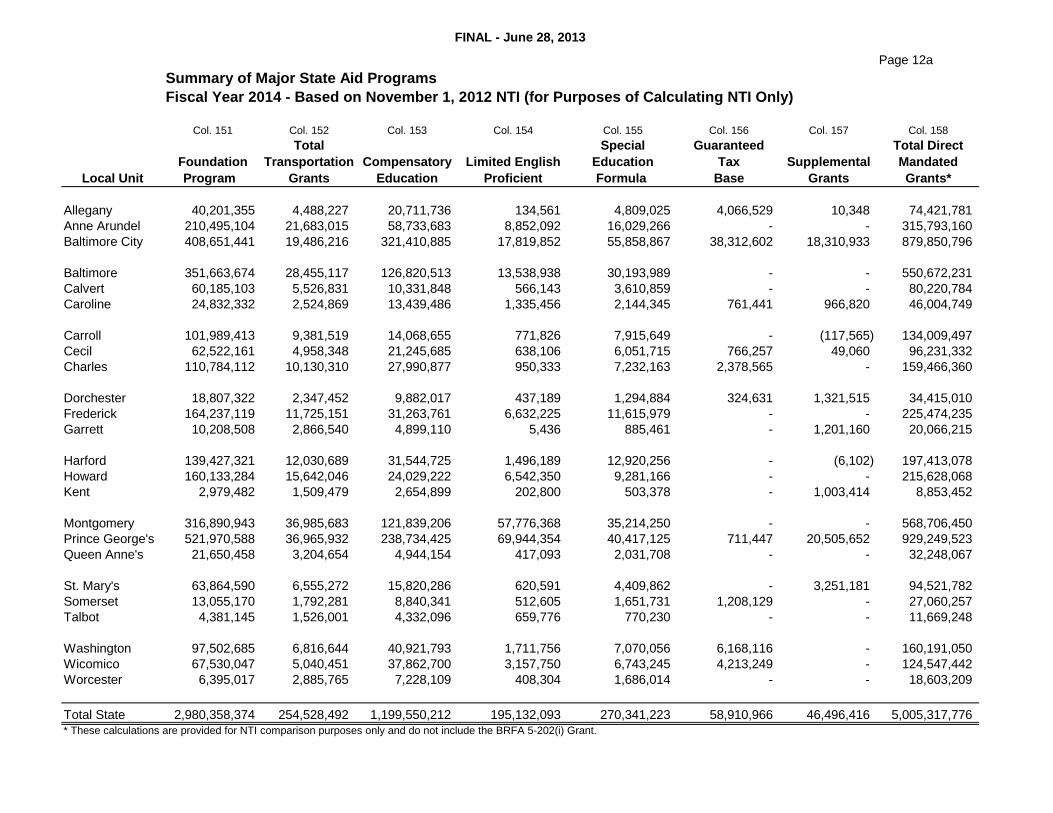
Page 12a
Summary of Major State Aid Programs
Fiscal Year 2014 - Based on November 1, 2012 NTI (for Purposes of Calculating NTI Only)
Col. 151 Col. 152 Col. 153 Col. 154 Col. 155 Col. 156 Col. 157 Col. 158
Total Special Guaranteed Total Direct
Foundation Transportation Compensatory Limited English Education Tax Supplemental Mandated
Local Unit Program Grants Education Proficient Formula Base Grants Grants*
Allegany 40,201,355 4,488,227 20,711,736 134,561 4,809,025 4,066,529 10,348 74,421,781
Anne Arundel 210,495,104 21,683,015 58,733,683 8,852,092 16,029,266 - - 315,793,160
Baltimore City 408,651,441 19,486,216 321,410,885 17,819,852 55,858,867 38,312,602 18,310,933 879,850,796
Baltimore 351,663,674 28,455,117 126,820,513 13,538,938 30,193,989 - - 550,672,231
Calvert 60,185,103 5,526,831 10,331,848 566,143 3,610,859 - - 80,220,784
Caroline 24,832,332 2,524,869 13,439,486 1,335,456 2,144,345 761,441 966,820 46,004,749
Carroll 101,989,413 9,381,519 14,068,655 771,826 7,915,649 - (117,565) 134,009,497
Cecil 62,522,161 4,958,348 21,245,685 638,106 6,051,715 766,257 49,060 96,231,332
Charles 110,784,112 10,130,310 27,990,877 950,333 7,232,163 2,378,565 - 159,466,360
Dorchester 18,807,322 2,347,452 9,882,017 437,189 1,294,884 324,631 1,321,515 34,415,010
Frederick 164,237,119 11,725,151 31,263,761 6,632,225 11,615,979 - - 225,474,235
Garrett 10,208,508 2,866,540 4,899,110 5,436 885,461 - 1,201,160 20,066,215
Harford 139,427,321 12,030,689 31,544,725 1,496,189 12,920,256 - (6,102) 197,413,078
Howard 160,133,284 15,642,046 24,029,222 6,542,350 9,281,166 - - 215,628,068
Kent 2,979,482 1,509,479 2,654,899 202,800 503,378 - 1,003,414 8,853,452
Montgomery 316,890,943 36,985,683 121,839,206 57,776,368 35,214,250 - - 568,706,450
Prince George's 521,970,588 36,965,932 238,734,425 69,944,354 40,417,125 711,447 20,505,652 929,249,523
Queen Anne's 21,650,458 3,204,654 4,944,154 417,093 2,031,708 - - 32,248,067
St. Mary's 63,864,590 6,555,272 15,820,286 620,591 4,409,862 - 3,251,181 94,521,782
Somerset 13,055,170 1,792,281 8,840,341 512,605 1,651,731 1,208,129 - 27,060,257
Talbot 4,381,145 1,526,001 4,332,096 659,776 770,230 - - 11,669,248
Washington 97,502,685 6,816,644 40,921,793 1,711,756 7,070,056 6,168,116 - 160,191,050
Wicomico 67,530,047 5,040,451 37,862,700 3,157,750 6,743,245 4,213,249 - 124,547,442
Worcester 6,395,017 2,885,765 7,228,109 408,304 1,686,014 - - 18,603,209
Total State 2,980,358,374 254,528,492 1,199,550,212 195,132,093 270,341,223 58,910,966 46,496,416 5,005,317,776
* These calculations are provided for NTI comparison purposes only and do not include the BRFA 5-202(i) Grant.
FINAL - June 28, 2013
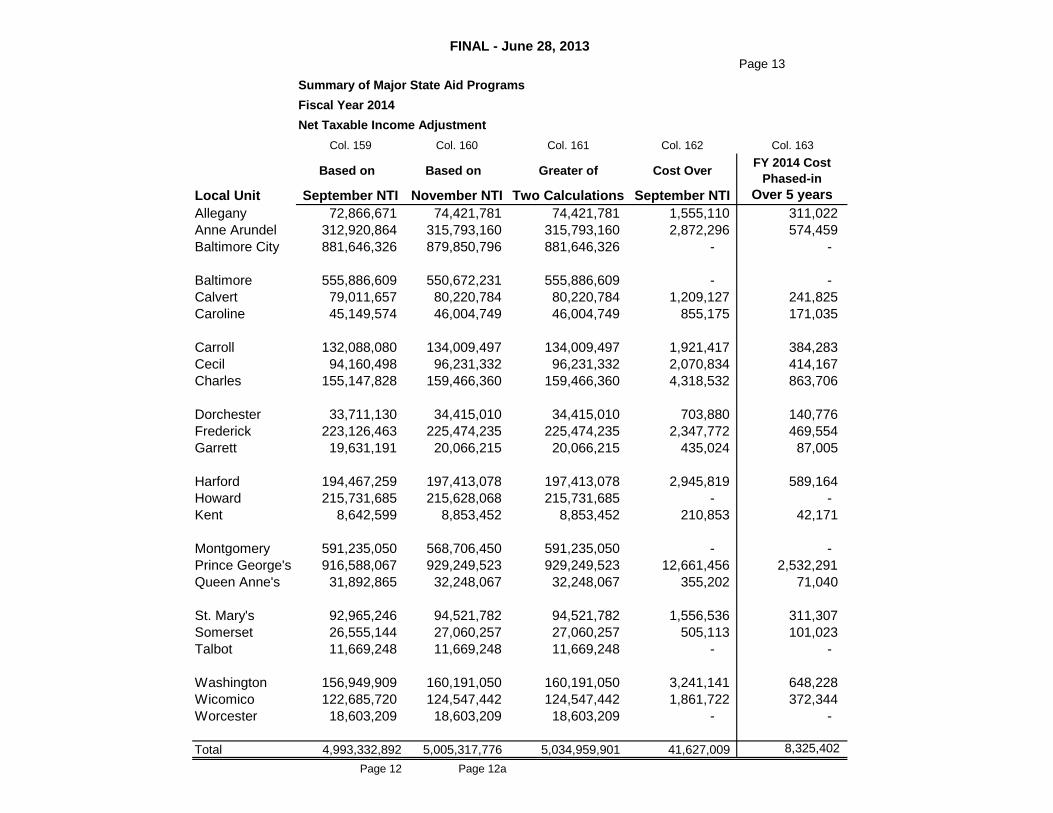
Page 13
Summary of Major State Aid Programs
Fiscal Year 2014
Net Taxable Income Adjustment
Col. 159 Col. 160 Col. 161 Col. 162 Col. 163
Based on Based on Greater of Cost OverFY 2014 Cost
Phased-in
Local Unit September NTI November NTI Two Calculations September NTI Over 5 years
Allegany 72,866,671 74,421,781 74,421,781 1,555,110 311,022
Anne Arundel 312,920,864 315,793,160 315,793,160 2,872,296 574,459
Baltimore City 881,646,326 879,850,796 881,646,326 - -
Baltimore 555,886,609 550,672,231 555,886,609 - -
Calvert 79,011,657 80,220,784 80,220,784 1,209,127 241,825
Caroline 45,149,574 46,004,749 46,004,749 855,175 171,035
Carroll 132,088,080 134,009,497 134,009,497 1,921,417 384,283
Cecil 94,160,498 96,231,332 96,231,332 2,070,834 414,167
Charles 155,147,828 159,466,360 159,466,360 4,318,532 863,706
Dorchester 33,711,130 34,415,010 34,415,010 703,880 140,776
Frederick 223,126,463 225,474,235 225,474,235 2,347,772 469,554
Garrett 19,631,191 20,066,215 20,066,215 435,024 87,005
Harford 194,467,259 197,413,078 197,413,078 2,945,819 589,164
Howard 215,731,685 215,628,068 215,731,685 - -
Kent 8,642,599 8,853,452 8,853,452 210,853 42,171
Montgomery 591,235,050 568,706,450 591,235,050 - -
Prince George's 916,588,067 929,249,523 929,249,523 12,661,456 2,532,291
Queen Anne's 31,892,865 32,248,067 32,248,067 355,202 71,040
St. Mary's 92,965,246 94,521,782 94,521,782 1,556,536 311,307
Somerset 26,555,144 27,060,257 27,060,257 505,113 101,023
Talbot 11,669,248 11,669,248 11,669,248 - -
Washington 156,949,909 160,191,050 160,191,050 3,241,141 648,228
Wicomico 122,685,720 124,547,442 124,547,442 1,861,722 372,344
Worcester 18,603,209 18,603,209 18,603,209 - -
Total 4,993,332,892 5,005,317,776 5,034,959,901 41,627,009 8,325,402
Page 12 Page 12a

FINAL - June 28, 2013
BRFA 5-202(i) Grants Page 14
Fiscal Year 2014
Col. 164 Col. 165 Col. 166 Col. 167 Col. 168
2014 Total 2013 Total Decrease in % BRFA 5-202(i)
Direct Education Direct Education Total Direct Education Change Grant*
Local Unit Aid Aid Aid
Allegany 73,177,693 73,109,557 68,136 0.1% 0
Anne Arundel 313,495,323 302,080,188 11,415,135 3.8% 0
Baltimore City 881,646,326 851,579,776 30,066,550 3.5% 0
Baltimore 555,886,609 533,170,995 22,715,614 4.3% 0
Calvert 79,253,482 79,968,126 (714,644) -0.9% 0
Caroline 45,320,609 43,872,469 1,448,140 3.3% 0
Carroll 132,472,363 135,475,290 (3,002,927) -2.2% 750,732
Cecil 94,574,665 95,305,757 (731,092) -0.8% 0
Charles 156,011,534 153,612,497 2,399,037 1.6% 0
Dorchester 33,851,906 32,353,764 1,498,142 4.6% 0
Frederick 223,596,017 219,787,595 3,808,422 1.7% 0
Garrett 19,718,196 20,910,168 (1,191,972) -5.7% 297,993
Harford 195,056,423 198,799,576 (3,743,153) -1.9% 935,788
Howard 215,731,685 215,054,667 677,018 0.3% 0
Kent 8,684,770 9,072,953 (388,183) -4.3% 97,046
Montgomery 591,235,050 576,338,558 14,896,492 2.6% 0
Prince George's 919,120,358 882,133,371 36,986,987 4.2% 0
Queen Anne's 31,963,905 31,025,844 938,061 3.0% 0
St. Mary's 93,276,553 93,273,400 3,153 0.0% 0
Somerset 26,656,167 23,100,106 3,556,061 15.4% 0
Talbot 11,669,248 11,407,933 261,315 2.3% 0
Washington 157,598,137 154,479,310 3,118,827 2.0% 0
Wicomico 123,058,064 118,425,903 4,632,161 3.9% 0
Worcester 18,603,209 18,173,454 429,755 2.4% 0
-
Total State 5,001,658,294 4,872,511,257 129,147,037 2,081,559
* Pursuant to the BRFA of 2013, this FY 2014 grant equals 25% of the decrease between FY 2013 Direct Student Aid and FY 2014 Direct Student Aid if the decrease
is greater than 1%. The Budget Bill allows the Governor to use $2.2 million in excess funding that was appropriated in the Transportation program to ensure that no
Supplemental grant is less than zero and to restore 25% of the reduction in Direct Aid from the prior year where the reduction exceeds 1%. Please note that these
excess funds are discretionary and a decision on their distribution has not been made.
FINAL - June 28, 2013
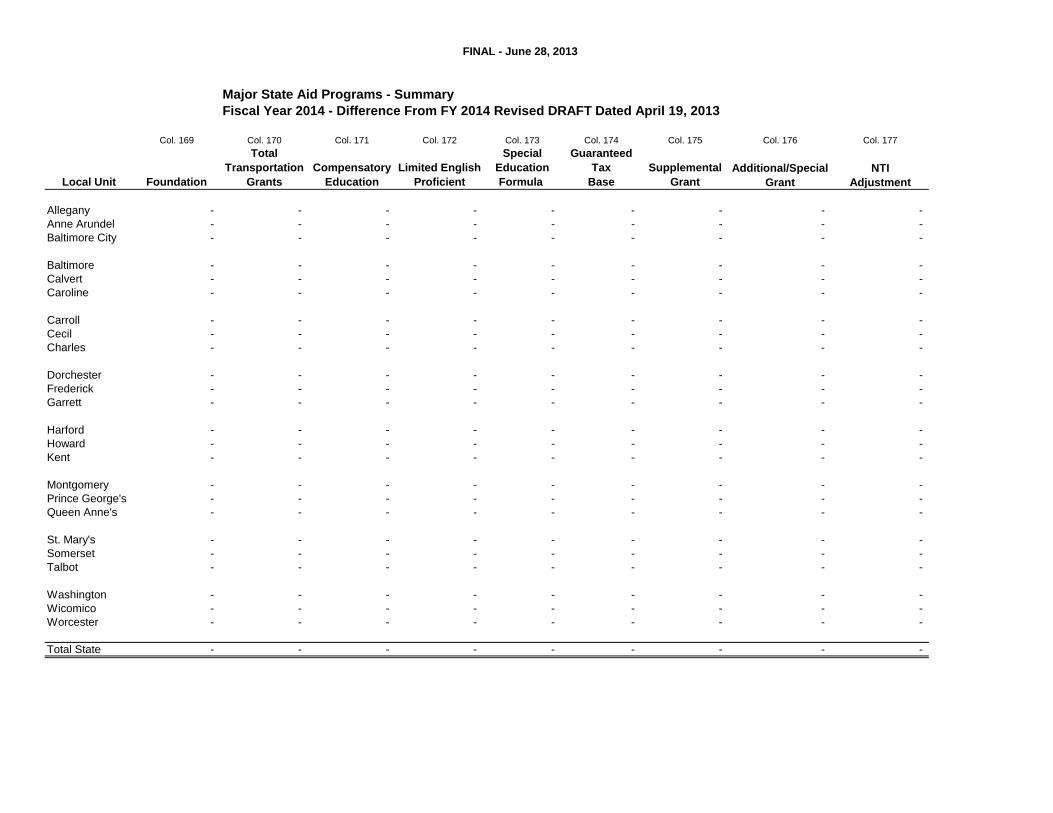
Major State Aid Programs - Summary
Fiscal Year 2014 - Difference From FY 2014 Revised DRAFT Dated April 19, 2013
Col. 169 Col. 170 Col. 171 Col. 172 Col. 173 Col. 174 Col. 175 Col. 176 Col. 177
Total Special Guaranteed
Transportation Compensatory Limited English Education Tax Supplemental Additional/Special NTI
Local Unit Foundation Grants Education Proficient Formula Base Grant Grant Adjustment
Allegany - - - - - - - - -
Anne Arundel - - - - - - - - -
Baltimore City - - - - - - - - -
Baltimore - - - - - - - - -
Calvert - - - - - - - - -
Caroline - - - - - - - - -
Carroll - - - - - - - - -
Cecil - - - - - - - - -
Charles - - - - - - - - -
Dorchester - - - - - - - - -
Frederick - - - - - - - - -
Garrett - - - - - - - - -
Harford - - - - - - - - -
Howard - - - - - - - - -
Kent - - - - - - - - -
Montgomery - - - - - - - - -
Prince George's - - - - - - - - -
Queen Anne's - - - - - - - - -
St. Mary's - - - - - - - - -
Somerset - - - - - - - - -
Talbot - - - - - - - - -
Washington - - - - - - - - -
Wicomico - - - - - - - - -
Worcester - - - - - - - - -
Total State - - - - - - - - -

FINAL - June 28, 2013
Page 15
Col. 178
Total Direct
Mandated
Grants
-
-
-
-
-
-
-
-
-
-
-
-
-
-
-
-
-
-
-
-
-
-
-
-
-
FINAL - June 28, 2013
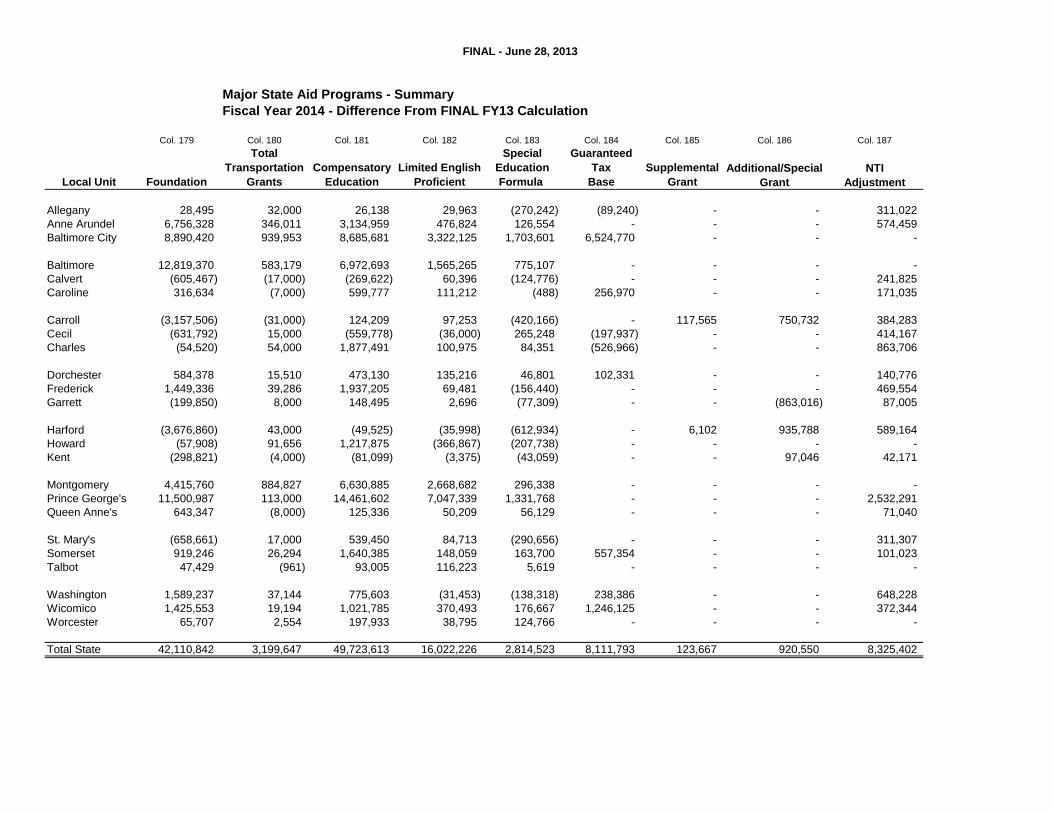
Major State Aid Programs - Summary
Fiscal Year 2014 - Difference From FINAL FY13 Calculation
Col. 179 Col. 180 Col. 181 Col. 182 Col. 183 Col. 184 Col. 185 Col. 186 Col. 187
Total Special Guaranteed
Transportation Compensatory Limited English Education Tax Supplemental Additional/Special NTI
Local Unit Foundation Grants Education Proficient Formula Base Grant Grant Adjustment
Allegany 28,495 32,000 26,138 29,963 (270,242) (89,240) - - 311,022
Anne Arundel 6,756,328 346,011 3,134,959 476,824 126,554 - - - 574,459
Baltimore City 8,890,420 939,953 8,685,681 3,322,125 1,703,601 6,524,770 - - -
Baltimore 12,819,370 583,179 6,972,693 1,565,265 775,107 - - - -
Calvert (605,467) (17,000) (269,622) 60,396 (124,776) - - - 241,825
Caroline 316,634 (7,000) 599,777 111,212 (488) 256,970 - - 171,035
Carroll (3,157,506) (31,000) 124,209 97,253 (420,166) - 117,565 750,732 384,283
Cecil (631,792) 15,000 (559,778) (36,000) 265,248 (197,937) - - 414,167
Charles (54,520) 54,000 1,877,491 100,975 84,351 (526,966) - - 863,706
Dorchester 584,378 15,510 473,130 135,216 46,801 102,331 - - 140,776
Frederick 1,449,336 39,286 1,937,205 69,481 (156,440) - - - 469,554
Garrett (199,850) 8,000 148,495 2,696 (77,309) - - (863,016) 87,005
Harford (3,676,860) 43,000 (49,525) (35,998) (612,934) - 6,102 935,788 589,164
Howard (57,908) 91,656 1,217,875 (366,867) (207,738) - - - -
Kent (298,821) (4,000) (81,099) (3,375) (43,059) - - 97,046 42,171
Montgomery 4,415,760 884,827 6,630,885 2,668,682 296,338 - - - -
Prince George's 11,500,987 113,000 14,461,602 7,047,339 1,331,768 - - - 2,532,291
Queen Anne's 643,347 (8,000) 125,336 50,209 56,129 - - - 71,040
St. Mary's (658,661) 17,000 539,450 84,713 (290,656) - - - 311,307
Somerset 919,246 26,294 1,640,385 148,059 163,700 557,354 - - 101,023
Talbot 47,429 (961) 93,005 116,223 5,619 - - - -
Washington 1,589,237 37,144 775,603 (31,453) (138,318) 238,386 - - 648,228
Wicomico 1,425,553 19,194 1,021,785 370,493 176,667 1,246,125 - - 372,344
Worcester 65,707 2,554 197,933 38,795 124,766 - - - -
Total State 42,110,842 3,199,647 49,723,613 16,022,226 2,814,523 8,111,793 123,667 920,550 8,325,402
FINAL - June 28, 2013
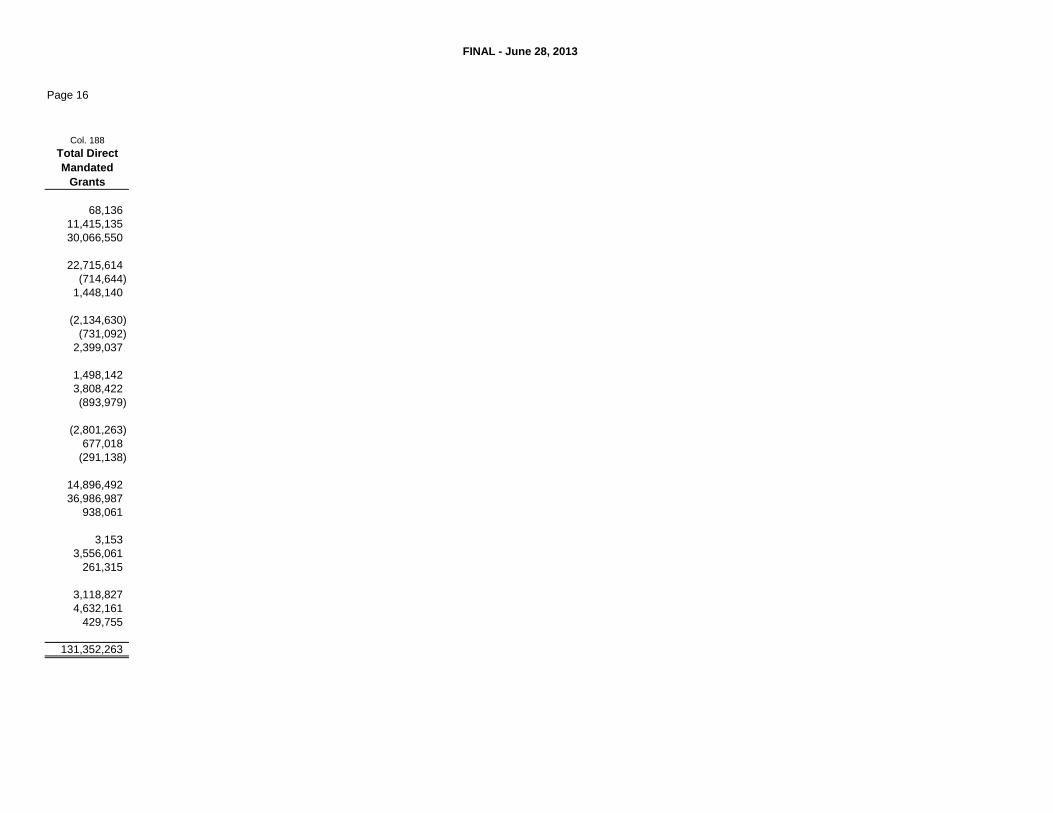
Page 16
Col. 188
Total Direct
Mandated
Grants
68,136
11,415,135
30,066,550
22,715,614
(714,644)
1,448,140
(2,134,630)
(731,092)
2,399,037
1,498,142
3,808,422
(893,979)
(2,801,263)
677,018
(291,138)
14,896,492
36,986,987
938,061
3,153
3,556,061
261,315
3,118,827
4,632,161
429,755
131,352,263