stand and deliver - nber
TRANSCRIPT

NBER WORKING PAPER SERIES
STAND AND DELIVER:EFFECTS OF BOSTON'S CHARTER HIGH SCHOOLS ON COLLEGE PREPARATION, ENTRY, AND CHOICE
Joshua D. AngristSarah R. CohodesSusan M. Dynarski
Parag A. PathakChristopher R. Walters
Working Paper 19275http://www.nber.org/papers/w19275
NATIONAL BUREAU OF ECONOMIC RESEARCH1050 Massachusetts Avenue
Cambridge, MA 02138July 2013
This research was funded by the US Department of Education through Institute for Education Sciencesgrant number 08120031 and by the New Schools Venture Fund. Grateful thanks go to Boston's charterschools, to Kamal Chavda and the Boston Public Schools, and to Carrie Conaway, Cliff Chuang, andthe staff of the Massachusetts Department of Elementary and Secondary Education for data and assistance.Caroline Hoxby, Tom Kane, and seminar participants at Chicago, Columbia, London School of Economics,National University of Singapore, NBER 2013 Summer Institute, Oberlin College, the Society of LaborEconomics 2013 meetings, Toulose School of Economics, Singapore Management University andUppsala provided helpful comments. Pathak thanks the National Science Foundation for research support.Annice Correia provided excellent research and administrative support. Daisy Sun and Peter Hull providedexpert research assistance. The views expressed here are those of the authors alone. The views expressedhere are those of the authors alone and do not necessarily reflect the views of the National Bureauof Economic Research.
NBER working papers are circulated for discussion and comment purposes. They have not been peer-reviewed or been subject to the review by the NBER Board of Directors that accompanies officialNBER publications.
© 2013 by Joshua D. Angrist, Sarah R. Cohodes, Susan M. Dynarski, Parag A. Pathak, and ChristopherR. Walters. All rights reserved. Short sections of text, not to exceed two paragraphs, may be quotedwithout explicit permission provided that full credit, including © notice, is given to the source.

Stand and Deliver: Effects of Boston's Charter High Schools on College Preparation, Entry,and ChoiceJoshua D. Angrist, Sarah R. Cohodes, Susan M. Dynarski, Parag A. Pathak, and ChristopherR. WaltersNBER Working Paper No. 19275July 2013, Revised September 2013JEL No. I21,I23,I24,I28
ABSTRACTWe use admissions lotteries to estimate the effects of attendance at Boston's charter high schools oncollege preparation, college attendance, and college choice. Charter attendance increases pass rateson the high-stakes exam required for high school graduation in Massachusetts, with especially largeeffects on the likelihood of qualifying for a state-sponsored college scholarship. Charter attendancehas little effect on the likelihood of taking the SAT, but shifts the distribution of scores rightward,moving students into higher quartiles of the state SAT score distribution. Boston's charter high schoolsalso increase the likelihood of taking an Advanced Placement (AP) exam, the number of AP examstaken, and scores on AP Calculus tests. Finally, charter attendance induces a substantial shift fromtwo- to four-year institutions, though the effect on overall college enrollment is modest. The increasein four-year enrollment is concentrated among four-year public institutions in Massachusetts. Thelarge gains generated by Boston's charter high schools are unlikely to be generated by changes in peercomposition or other peer effects.
Joshua D. AngristDepartment of Economics, E17-226MIT77 Massachusetts AvenueCambridge, MA 02139and [email protected]
Sarah R. CohodesJohn F. Kennedy School of GovernmentHarvard University79 JFK StreetCambridge, MA [email protected]
Susan M. DynarskiUniversity of MichiganWeill Hall735 South State StreetAnn Arbor, MI 48109-3091and [email protected]
Parag A. PathakDepartment of Economics, E17-240MIT77 Massachusetts AvenueCambridge, MA 02139and [email protected]
Christopher R. WaltersUniversity of California, Berkeley657 Evans HallBerkeley, CA [email protected]
An online appendix is available at:http://www.nber.org/data-appendix/w19275

1 Introduction
One of the most important questions in education research is whether the gains from interventions
for which we see short-term success can be sustained. For example, test score gains generated by
pre-school interventions, highly effective teachers, and elementary-school class size reductions often
appear to fade as students progress through school, though some of these gains may re-emerge later
in non-cognitive outcomes.1 The possibility of short-lived impacts is especially relevant for research
on charter schools, where charter operators who face high-stakes assessments have an incentive to
“teach to the test.” The fact that charters are subject to intense scrutiny and evaluation may even
create incentives for cheating (Jacob and Levitt, 2003), strategic instruction (Jacob, 2007), and a
focus on small groups of students that are pivotal for official accountability measures (Neal and
Schanzenbach, 2010).
The purpose of this paper is to assess the impact of attendance at Boston’s charter high
schools on outcomes where the link with human capital and future earnings seems likely to be
sustained and strong. Specifically, we focus on outcomes that are either essential to or facilitate
post-secondary schooling: high school graduation, the attainment of state competency thresholds,
scholarship qualification, Advanced Placement (AP) and SAT scores, college enrollment, and college
persistence. Importantly, most of these outcomes are less subject to strategic manipulation than
are the state’s test-based assessments. As in earlier work, the research design implemented here
exploits randomized enrollment lotteries at over-subscribed charter schools. The resulting estimates
are likely to provide reliable measures of average causal effects for charter applicants.
Our analysis focuses on Boston’s charter high schools. For our purposes, an analysis of high
schools is both a necessity and a virtue. It’s necessary to study high schools because most students
applying to charters in earlier grades are not yet old enough to generate data on post-secondary
1Currie and Thomas (2000) show that the effect of Head Start on test scores fades, while Garces et al. (2002) andDeming (2009) document long-term effects on educational attainment and non-schooling outcomes. While the effect ofsmaller classes on test scores diminishes after children return to larger classes (Krueger and Whitmore, 2001), positiveeffects re-emerge for post-secondary attainment (Dynarski et al., 2011) and financial well-being (Chetty et al., 2011a).Three randomized, preschool interventions show fading effects on cognitive tests but large impacts on labor marketattachment and crime reduction (Anderson, 2008). Teacher assignment and international educational interventionsalso appear to generate impacts that fade (see Kane and Staiger (2008); Jacob et al. (2010) for evidence on the firstand Andrabi et al. (2011); Banerjee et al. (2007) for evidence on the second), though there is some evidence thatteachers can influence later life outcomes (Chetty et al., 2011b).
1

outcomes. Charter high schools are also of substantial policy interest: a growing literature suggests
that high school may be too late for cost-effective human capital interventions (see, for example,
Cunha et al. (2010)). Consistent with this view, impact analyses of interventions for urban youth
have mostly generated disappointing results.2 We’re interested in ascertaining whether charter
schools, which are largely budget-neutral, can have a substantial impact on the life course of
affected students. The set of schools studied here comes from an earlier investigation of the effects
of charter attendance in Boston on test scores (Abdulkadiroglu et al., 2011). The high schools in our
earlier study, which enroll the bulk of charter high school students in Boston, generate statistically
and socially significant gains on state assessments in 10th grade. We turn here to the question of
whether these gains are sustained.
Our findings suggests that the gains from Boston’s high-performing charter high schools are
remarkably persistent. Charter school attendance increases the pass rate on the exam required for
high school graduation in Massachusetts, with especially large effects on the likelihood of qualifying
for a state-sponsored college scholarship. Lottery estimates also show gains on the SAT and on
Advanced Placement tests. Charter attendance boosts SAT scores sharply, especially in math,
while doubling the likelihood that a student sits for an AP exam and increasing the fraction of
students who pass AP Calculus. Our evidence suggests that charter attendance increases college
enrollment, but the number of charter applicants old enough to be in college is still too small for this
result to be conclusive. At the same time, charter attendance induces a clear shift from two-year to
four-year colleges, with gains most pronounced at four-year public institutions in Massachusetts.
An analysis of results by subgroup shows broadly distributed gains, with evidence of larger
effects for students who appear weaker at baseline. Finally, because Boston’s charter applicants are
positively selected relative to the traditional Boston Public School (BPS) population, we explore
the possibility that peer composition mediates charter effects. The results of this exploration are
inconsistent with the notion that changes in peer composition account for the main findings.
The next section provides background on Massachusetts charter schools and describes the data.
2For example, Dynarski et al. (1998) and Dynarski and Gleason (2002) document an array of discouraging findingsfor interventions meant to reduce dropout rates. See also Dynarski and Wood (1997) and Kemple and Snipes (2000)for results on alternative schools and career academies, where the findings are mixed at best.
2

Section 3 outlines our empirical strategy, and reports first-stage estimates and benchmark effects on
standardized test scores. Section 4 reviews findings for college preparation, while Section 5 discusses
effects on college enrollment, choice, and persistence. Section 6 reports effects in subgroups and
discusses our evidence on peer effects. The last section concludes.
2 Background and Data
2.1 Boston’s Charter Sector
Boston’s over-subscribed charter schools generate impressive score gains. Lottery estimates show
that each year spent at a charter middle school boosts scores by about a fifth of a standard deviation
in English Language Arts (ELA) and over a third of a standard deviation in math. High school
gains are just as large (Abdulkadiroglu et al., 2011). These effects are in line with those generated
by urban charters elsewhere in Massachusetts, as we’ve shown in studies of a Knowledge is Power
Program (KIPP) school in Lynn, Massachusetts (Angrist et al., 2010, 2012), and in an analysis of
charter lottery results from around the state (Angrist et al., 2011a,b).
A defining feature of Massachusetts’ successful urban charter schools appears to be adherence
to No Excuses pedagogy, an approach to urban education described in a book of the same name
(Thernstrom and Thernstrom, 2003). No Excuses schools emphasize discipline and comportment,
traditional reading and math skills, extended instruction time, and selective teacher hiring. Mas-
sachusetts’ No Excuses charters also make heavy use of Teach for America (TFA) participants and
alumni and provide extensive and ongoing feedback to teachers. Like most Boston charter schools,
the high schools studied here largely identify with the No Excuses approach, a fact documented
in Table 1.3 Another feature of the Massachusetts charter landscape is the state’s rigorous charter
authorization and monitoring process. To date the state has closed 12 charter schools after they
began operations and an additional 4 schools before they opened (Massachusetts Department of
Elementary and Secondary Education, 2013).4
3Other lottery-based evidence on No Excuses effectiveness includes the Dobbie and Fryer (2011a) study of acharter school in the Harlem Children’s Zone, the Dobbie and Fryer (2011b) study of a larger sample of New Yorkcharters, and results for a sample of KIPP schools from around the country (Tuttle et al., 2013).
4Two schools marked as closed in the state’s charter school factsheet have been consolidated under the charter of
3

Charter schools are a recent innovation; Massachusetts’ first charter schools opened in 1995.
Not surprisingly, therefore, most evidence on charter effectiveness comes from outcomes measured
while children are still enrolled in elementary and secondary school. An exception is Dobbie and
Fryer’s (2012) recent lottery-based study, which follows applicants to a single charter middle school
in the Harlem Children’s Zone, estimating effects on college enrollment while also looking at non-
educational outcomes related to crime and teen pregnancy. Dobbie and Fryer (2012) find that
Promise Academy students are more likely to go to college, while girls are less likely to get pregnant
and boys are less likely to be incarcerated. Earlier work by Booker et al. (2008) uses statistical
controls and distance instruments to identify the effects of charter school attendance on high school
graduation and college enrollment. Both empirical strategies suggest gains for charter students.
We complement this earlier work with new results on post-secondary preparation, enrollment, and
choice for a large cohort of charter high school lottery applicants.
2.2 Data and Sample
School Selection
We set out to study the effects of attendance at six charter high schools in Boston. These
schools generated the lottery-based estimates of charter high school achievement effects reported
in our earlier study (Abdulkadiroglu et al., 2011), and account for the bulk of charter high school
enrollment in Boston today.5 Two additional charter high schools serving Boston students in the
same period are now closed. One school that is still open has poor records and appears unsuitable
for a lottery-based analysis.
Table 1 describes features of the charter schools included in this study, as well as those of the
full set of charter high schools in Boston and Boston’s traditional public schools, including exam
schools. This table classifies charters according to whether they cover grades 9-12 or are limited
to grades 9-12. Boston’s charters run a longer school year and day than traditional public schools,
and make frequent use of Saturday school. As a result, charter school students receive about 1500
a third school; they remain in operation and are thus not counted in the school closure totals.5The six schools are Academy of the Pacific Rim Charter Public School, Boston Collegiate Charter School, Boston
Preparatory Charter Public School, City on a Hill Charter Public School, Codman Academy Charter Public School,and Match High School.
4

hours per year of instruction, compared to 1150 in the traditional public schools. Most of Boston’s
charters adhere to the No Excuses instructional approach. Panel B of Table 1 compares teacher
characteristics, per-pupil expenditure, and Title I eligibility. Charter teachers are younger than
their traditional public school counterparts: 76 percent of teachers in our analysis sample are 32
or younger, compared to 28 percent of public school teachers. Similarly, only 5 percent of (study
sample) charter teachers are 49 or older, while 35 percent of public school teachers are at least 49.
Charters appear to be close to budget-neutral, and their class sizes are smaller.6 All public schools
in Boston, including charters, qualify for Title I aid.
Student Data
Massachusetts charter schools admit students by lottery when they have more applicants than seats.
We collected lists of charter school applicants and information on the results of admissions lotteries
from individual charter schools. These lists were then matched to administrative records covering
all Massachusetts public school students. Our analysis sample is limited to charter applicants who
applied for a charter school seat from Fall 2002 through Fall 2009. Additional information on
applicant lotteries appears in Appendix Table A1 and in the Data Appendix.
We matched applicant records to administrative data using applicants’ names, cohorts, and
grades of application. Where available, information on date of birth, town of residence, race or
ethnicity, and gender was used to break ties. Among applicants eligible for our study, 94 percent
were matched to state data.7 Applicants were excluded from the analysis if they were disqualified
from the lottery (these are mostly applicants to the wrong grade). We also omit siblings of current
charter students, late applicants, and some out-of-area applicants. Students submitting charter
applications in multiple years appear only once in the sample, with data recorded for the first
application only. Information on baseline demographics and test scores comes from the most recent
6Per pupil expenditures are slightly larger at charter schools than BPS schools. However state generated PPEnumbers are only available at the district level, so it is not possible to report the high school only BPS PPE.Generally, PPE is higher at high schools than elementary schools (Heuer and Stullich, 2011). Charter and BPS perpupil spending is likely similar when grade level adjustments are made.
7Match rates differ little by win/loss status, a fact documented in Web Appendix Table B1. Web Appendix TableB2 shows that results for applicant cohorts where match rate differentials are largest (mostly recent cohorts withprojected graduation dates after 2009) are typically similar to those for the larger sample, though effects on readingscores are somewhat smaller for the balanced cohorts.
5

pre-lottery data available in the state database. In addition to providing demographic information
and scores on state assessments, state administrative records include AP and SAT scores for all
public school students tested in Massachusetts.
Information on college enrollment and choice comes from the National Student Clearinghouse
(NSC). The Massachusetts Department of Elementary and Secondary Education routinely requests
an NSC match for Massachusetts high school graduates; as described in the Data Appendix, we
combined the graduate files with supplemental information on non-graduates. NSC data record en-
rollment spells at participating post-secondary institutions, which account for 94% of Massachusetts
undergraduates. Missing schools mostly run small vocational and technical programs.
Different outcomes generate different follow-up horizons, depending on when in a student’s
schooling career they are collected. We define follow-up horizons based on each applicant co-
hort’s projected senior year of high school.8 The earliest information available on baseline (pre-
application) characteristics is from the school year ending in Spring 2002. The earliest outcome
data are therefore contributed by students projected to graduate in Spring 2006. Outcome-specific
samples range over projected senior years as follows:
• MCAS scores: These results are for students with projected senior years ending in Spring 2006
to Spring 2013; the outcome here is a 10th-grade score on the Massachusetts Comprehensive
Assessment System (MCAS) assessment. Some students retake 10th-grade MCAS tests in
a later grade, an outcome we also see. MCAS scores are standardized to the state score
distribution by grade, year, and subject. MCAS results include an analysis of effects on
state-determined competency standards and scholarship awards.
• AP and SAT scores: These results are for applicants with projected senior years 2007-2012,
including tests taken earlier than senior year. AP and SAT scores are in their original units
(AP scores run from 1-5; SAT subject scores run from 200-800).
• High school graduation: High school graduation data are for cohorts projected to finish
8The projected senior year equals eighth-grade-year plus 4 for applicants to City on a Hill, Codman Academy, andMatch (schools where applicants apply for 9th grade entry), 4th-grade-year plus 8 for applicants to Boston Collegiate(where applicants apply for 5th grade entry), and 5th-grade-year grade plus 7 for applicants to Academy of the PacificRim and Boston Preparatory (schools where applicants apply for 6th grade entry.)
6

between 2006 and 2012 (the most recent graduation year covered by state data is 2012).
We also see General Educational Development (GED) test-taking and results for GED exams
taken between 2006 and 2010.
• College outcomes: These are for students with projected senior years 2006-2011 (the most
recent cohort for which we have NSC data is the high school class of 2011).
Table 2 compares charter applicants with the full sample of traditional BPS 9th graders in
each outcome sample. Applicants tend to have higher baseline test scores than the traditional
BPS population, and are more likely to be black. Limited English proficient students are under-
represented among charter applicants, but the proportion of applicants identified as qualifying for
special education services is almost as high among applicants as in the traditional BPS population.9
3 Empirical Framework
We estimate the effects of charter school attendance on high school graduation rates, measures of
AP and SAT test-taking and scores, college enrollment and type, and college persistence. As a
benchmark, we also report results for 10th-grade MCAS scores, including effects on competency
thresholds in Massachusetts and eligibility for the state’s Adams Scholarship, which grants public
university tuition waivers to public high school students based on a combination of MCAS math
and ELA cutoffs.
Our lottery-based empirical strategy is motivated by the observation that charter attendance is a
choice variable that may be correlated with motivation, ability, or family background. Conventional
regression estimates of the effects of charter attendance may therefore fail to capture causal effects.
To eliminate selection bias, our empirical strategy uses randomly assigned charter lottery offers to
estimate the effects of attending charter schools. The second-stage equation for our lottery-based
9The percentage of BPS categorized as Limited English proficient in the 2011-12 school year across allgrades is 30.7%. This number is larger than the 12.0% we see in this sample because of a large-scalereassessment of students required by a 2010 settlement between BPS and the US Department of Justice. Seehttp://www.justice.gov/crt/about/edu/documents/bostonsettle.pdf for details, accessed July 2013.
7
two-stage least squares (2SLS) analysis links charter school attendance with outcomes as follows:
yi =∑j
δjdij + γ′Xi + ρCi + εi, (1)
where yi is the outcome of interest for student i, Xi is a vector including 10th-grade-year dummies
and a set of pre-lottery demographic characteristics (race, special education, limited English pro-
ficiency, subsidized lunch status, and a female-minority interaction) and εi is an error term. The
dij are dummy variables for all combinations of charter school lotteries (indexed by j) seen in the
lottery sample. In what follows, we refer to these combinations as “risk sets.” These are included
because the application mix determines the probability of receiving an offer, even when offers at
each school are randomly assigned.10 The variable of interest, Ci, indicates attendance at any of
the six charter schools in our lottery sample in 9th or 10th grade. The parameter ρ captures the
causal effect of charter school attendance.
We use charter offer variables as instruments. The initial offer instrument, Zi1, is a dummy
variable indicating offers made on the day of the charter school lottery. Because some applicants
who don’t receive offers on lottery day do so at a later date when their names are reached on a
randomly ordered wait list, we also code a second instrument, denoted ever offer, or Zi2. The
ever offer instrument indicates applicants who receive an offer at any time, whether on lottery day
or later. Applicants who receive an initial offer thus have both instruments switched on, while
those who receive later offers without an initial offer have only the ever offer instrument switched
on. Missing values for either instrument are coded as no offer. Because the model controls for
the pattern of schools and cohorts with lottery data of each type through application risk sets,
this convention is innocuous. Appendix Table A1 describes the schools and application cohorts for
which we observe ever and initial offers.
The first stage for our 2SLS procedure is:
Ci =∑j
µjdij + β′Xi + π1Zi1 + π2Zi2 + ηi, (2)
10For example, in a world with three charter schools and one entry cohort, there are 7 risk sets: all schools, eachschool, and any two.
8

where two separate parameters, π1 and π2, capture the effects of initial and eventual offers. As in
the second stage equation, the first stage includes risk set controls, 10th-grade-year dummies, and
baseline demographic characteristics. With two instruments used to estimate a single causal effect,
we can interpret 2SLS estimates as a statistically efficient weighted average of what we would get
from an estimation strategy that uses the instruments one at a time. Standard errors are clustered
at the 10th-grade-school-by-year level.
Randomly-assigned lottery offers are likely to be independent of student ability or family
background (within risk sets). Consistent with presumed random assignment, Columns (3) and
(4) of Table 2 show that pre-lottery demographics and test scores are similar for offered and non-
offered students. Differences in baseline characteristics by offer status are small and statistically
insignificant for all variables tested, and p-values from joint tests are high.
Although random assignment ensures apples-to-apples comparisons among all those who apply,
this statistical comparability is threatened by differential attrition between offered and non-offered
students. Appendix Table A2 documents an MCAS follow-up rate close to 80 percent. Moreover,
Panel B, which reports the effect of lottery offers on the likelihood students contribute an MCAS
score to our analysis sample, shows no significant effects of lottery offers on follow-up. Follow-up
rates for further downstream outcomes are largely determined by whether a student is seen in a
Massachusetts school in 12th grade. Here too, the estimates in Panel B are encouraging, with no
systematic difference between offered and non-offered students.
First Stage Estimates and an MCAS Benchmark
An admissions offer in a charter lottery boosts the probability of charter enrollment by 23 percentage
points. This can be seen in column (1) of Table 3, which reports ever-offer first stage estimates.
Column (2) shows that an initial offer boosts charter enrollment by an additional 13 points. The
overall first stage is therefore close to 40 percentage points for those who receive an offer on or
immediately following lottery day.11
The relationship between lottery offers and charter enrollment - the size of the first stage - is
11First stage estimates differ slightly across outcomes due to small changes in sample composition.
9

determined by the likelihood an applicant chooses to accept an offer (some accepted applicants opt
for a traditional public school, one of Boston’s pilot schools, or an exam school). Similarly, some
students who receive no offer in the lotteries for which we have data receive one at a later date.
The 2SLS estimates adjust for differences between offers and enrollment on both sides, with the
resulting estimates capturing causal effects for those who comply with (that is, enroll in a charter
school in response to) the offers recorded in our data (Imbens and Angrist, 1994).
As a starting point, Panel A of Table 3 also reports 2SLS estimates similar to those reported in
our earlier Boston study for 10th-grade MCAS scores (Abdulkadiroglu et al., 2011). Column (4),
which reports second-stage estimates of the parameter ρ from equation (1), shows that attendance
at the charter high schools in our sample boosts 10th-grade ELA scores by 0.4σ, that is, four-tenths
of a standard deviation, while raising math scores by more than half of a standard deviation.12
The analysis of longer-term outcomes necessarily covers fewer applicant cohorts than are avail-
able for an analysis of MCAS scores. As a check on the representativeness of the subsamples used
to produce the estimates of effects on later outcomes, we constructed 2SLS estimates of MCAS
effects for the subsamples of applicants contributing to our AP/SAT and college-going analyses
below. Estimates of effects on 10th-grade MCAS scores in the AP/SAT and college-going samples
in Panel B and C of Table 3 are similar to estimates for the full MCAS sample, suggesting that the
short-run effects of charter attendance are similar for older and more recent cohorts.
4 College Preparation
4.1 MCAS Thresholds
Charter school attendance has large effects on the likelihood applicants score in the upper two
MCAS score categories. Specifically, Table 4 documents large and statistically significant increases
in the likelihood charter applicants earn scores at a level deemed Proficient or Advanced. The gains
12The estimates reported in our earlier study, Abdulkadiroglu et al. (2011), are smaller than this because the formerare scaled to measure the effect of years of charter attendance, while those reported here show a charter enrollmenteffect, without adjusting for years attended. We opted for a dummy-endogenous-variable approach because thisproduces consistent specifications across outcomes, while sidestepping issues related to timing and reverse causality.High school graduation, for example, causes years of charter enrollment as well as vice versa.
10

here remain substantial whether measured by first attempts or final scores.
Since 2003, high school graduation in Massachusetts has been determined in part by 10th-
grade MCAS scores. The initial state competency standard required students to pass the “Needs
Improvement” threshold with scaled scores of 220 in both math and ELA; for the graduating class
of 2010 and onward, standards were increased to require “Proficient” scores of at least 240 in math,
ELA, and science.13 Consistent with the score gains documented in Table 3, charter attendance
appears to boost the likelihood of meeting competency standards, with a gain ranging from 10-18
points in each subject and overall.
Beginning with the high school class of 2005, the state has used the MCAS to determine
qualification for public-university tuition waivers, an award known as the Adams Scholarship.
Qualification for an Adams Scholarship requires an MCAS score in the “Advanced” category in
either ELA or math, a score that is at least “Proficient” in the subject where the Advanced
standard isn’t met, and a total MCAS score in the upper quartile of the distribution of scores
in a scholarship candidate’s home school district.14 Awardees qualify for a tuition waiver at a
Massachusetts public college or university.15 Charter attendance boosts the likelihood of qualifying
for an Adams Scholarship by 24 percentage points.
The nature of the charter-induced shift in the distribution of MCAS scores emerges clearly in
Figure 1. This figure plots estimated score distributions for lottery compliers, that is, for applicants
who take a charter seat when offered one in a lottery, but enroll in a traditional public school
otherwise. We plot densities for compliers because, as with our 2SLS estimates, such comparisons
are purged of the selection bias that contaminates an unadjusted contrast between those who do and
don’t enroll in a charter school. Comparisons for compliers therefore have a causal interpretation.
Complier distributions are estimated here by adapting methods introduced by Abadie (2002;
2003). Specifically, for a grid of values, v, in the support of an outcome variable, yi, we estimate
13See http://www.doe.mass.edu/mcas/graduation.html for details. The new rules include an exception for studentswho pass the needs improvement threshold only and also meet personal goals. We ignore this exception here.
14Charter school students can earn a scholarship in either the district of attendance (the charter school) or thedistrict of residence (Boston). The two standards differ due to the requirement for a score in the upper quartile ofthe district score distribution. The Adams Scholarship cutoff is defined here using BPS thresholds.
15Cohodes and Goodman (2013) estimate effects of Adams Scholarships on college enrollment and choice, showingthese appear to increase enrollment in public universities in spite of the fact that they cover only a small portion ofcollege costs.
11

equations of the form:
Kh(v − yi)(1 − Ci) =∑j
κ0j(v)dij + γ0(v)(1 − Ci) + u0iv (3)
Kh(v − yi)Ci =∑j
κ1j(v)dij + γ1(v)Ci + u1iv, (4)
where charter attendance Ci is treated as an endogenous regressor and instrumented with lottery
offers. Here Kh(v) = 1hK(v/h) is a kernel function with bandwidth h. The resulting estimates of
γ1(v) and γ0(v) describe densities for treated (charter) and untreated (non-charter) compliers.16
The x-axis in Figure 1 marks MCAS score category cutoffs; these occur at 20 point intervals.
Charter school attendance clearly pushes the first-attempt score distribution into the upper three
score groups. The effect of charter attendance on ELA scores is striking: very few non-charter
students achieve at an Advanced level, while many charter students are in the Advanced group.
Kolmogorov-Smirnov tests of distributional equality suggest that the distributional shifts docu-
mented in this figure are very unlikely to be a chance finding.
4.2 SAT Taking and Scores
The SAT is a major milestone for college-bound high school students and, for many, a major hurdle
on the path to college. Designed to be challenging for all takers, SAT scores are a special concern
for low-income and minority applicants. Gaps in SAT scores by race and socioeconomic status
that might be attributable to family background and school quality are further accentuated by the
willingness of higher income families to invest heavily in SAT preparation classes (see, e.g., Bowen
and Bok (2000)).
Many high schoolers in Boston’s traditional public schools take the SAT, and charter attendance
does little to change this rate. As can be seen in the first two columns of Table 5, nearly two-
thirds of non-charter students in our applicant sample take the SAT, while the estimated effect of
charter attendance on SAT taking is a modest 3 points, a gap far from statistical or quantitative
16The grid for v covers each percentile of the observed MCAS distribution; the kernel is Epanechnikov, withbandwidth twice the Silverman (1986) rule-of-thumb
12

significance.17
SAT scores are much lower in Boston than in the rest of the state, with fewer than 10% of
non-charter applicants scoring above the state median on the composite test, which is the sum of
math, verbal, and writing scores (column (5)). Three-quarters of non-charter applicants score in the
lowest quartile of the state distribution. Charter attendance increases the share of students scoring
above the bottom quartile by 12 percentage points (from 25% to 37%, column (6)).18 Gains in math
contribute most to this boost in composite scores (column (2)); effects on verbal and writing scores
are smaller, though the estimated shift of verbal scores out of the bottom quartile is statistically
significant (column (4)). Charter attendance also raises by 11 percentage points (from 9% to 20%)
the probability that applicants earn an SAT reasoning score (the sum of math and verbal) above
the state median, with math again the largest contributor to this gain.
Table 5 also reports SAT effects estimated in samples limited to those who take the test.
Because charter attendance has little effect on the decision to take the SAT, such conditional
comparisons are unlikely to be biased by compositional shifts. These conditional results show that
Boston’s charters have large and statistically significant effects on SAT scores, especially in math.
Specifically, charter attendance boosts average math scores by 52 points, a gain that amounts to
over four-tenths of a standard deviation in the US score distribution.19 This is almost as large (in
standard deviation units) as the MCAS math effect reported in Table 3, suggesting that the gains
in math skills demonstrated on the MCAS carry over to the SAT. Although charter attendance
has smaller effects on verbal and writing scores, the composite SAT score gain is estimated to be
about 100 points, a statistically significant result. The gain here amounts to almost one-third of
a standard deviation in the US composite score distribution. The corresponding effect on SAT
reasoning is 75 points, also a large gain.
The effect of charter attendance on the SAT score distribution is summarized in Figure 2, which
plots the distribution of SAT scores for treated and untreated lottery compliers (estimated as in
17Charter applicants are positively selected, as shown by their somewhat higher baseline test scores than the generalBPS population. Similarly, the SAT-taking rate among applicants of 0.63 exceeds the SAT-taking rate of 0.49 in thenon-charter BPS population (see columns (5) and (6) of Table 2).
18In this calculation we assign an SAT score of zero to those who do not take the test.19Means (and standard deviations) of the US SAT distribution in 2012 were 512 (117) in math, 496 (114) in verbal,
488 (114) in writing, 1010 (214) for reasoning and 1498 (316) for the composite.
13

Figure 1). Charter school attendance causes a pronounced rightward distributional shift in all three
SAT subjects, as well as for the composite score. Formal statistical tests of distributional equality
suggest these shifts are very unlikely to be a chance finding. On balance, Boston’s charter high
schools produce substantial gains on the SAT as well as the MCAS.
4.3 AP Taking and Scores
Advanced Placement coursework allows high schoolers to experience the rigor of college-level courses
and potentially earn college credit. Five of the six charter schools in our sample offer AP classes,
and one school requires that students pass AP exams in order to graduate. As shown in Table 6,
charter school attendance increases the probability that a student takes at least one AP exam by 29
percentage points. Consequently, over half of charter students take at least one AP test, compared
with about a quarter of the students in traditional public schools.
Charter attendance increases the average number of AP tests that students take by nearly a full
exam, a result that can be seen in the second row of the table. At the same time, gains in AP scores
are more modest. Charter school attendance increases the likelihood of taking a test and earning a
score of at least 2 by 15 percentage points, a statistically and quantitatively significant gain. But
a score of 3 or better is required to earn college credit, and many colleges and universities require
at least a 4. Charter attendance increases the probability of earning a score of 3 by a marginally
significant 9.6 percentage points, a large effect relative to the non-charter mean of 7 percent. At
the same time, charter attendance generates no significant increase in the likelihood of earning a 4
or 5.20 Note that by including zeros for non-takers in this analysis of score impact, we avoid bias
from possible composition effects due to the large effect of charter attendance on the likelihood
applicants take a test.
AP results by subject, reported in columns (3)-(10) of Table 6, show a large increase in the
likelihood charter applicants take tests in science, calculus, and history, three of the most common
categories of AP exams. Paralleling charters’ large effect on MCAS math scores, the clearest
20Some colleges, including the University of California, accept a 3 for college credit; however, both UMass-Amherstand UMass-Boston require at least a 4 on the AP Calculus exam for college credit, a threshold that most Bostonstudents do not meet.
14

AP score gains emerge for calculus. Charter attendance boosts the probability of taking the AP
calculus test by 21 percentage points, and increases the likelihood of earning a score of at least
2 by nearly 9 points. The corresponding impact on the likelihood of earning a 3 on AP calculus
is 7 percentage points; relative to the non-charter mean of 1.5 percent, this implies that charter
attendance more than quintuples the chances a student earns a 3 in calculus, though both the two-
plus and three-plus calculus effects are only marginally statistically significant. Charter attendance
increases test-taking in science and US history, with no corresponding score effect in these subjects.
Charter schools have little effect on AP English test-taking or scores.
4.4 High School Graduation
Does charter attendance also increase high school graduation rates? Perhaps surprisingly given the
gains in test score graduation requirements reported in Table 4, the estimates in Table 7 suggest not.
In fact, charter attendance reduces the likelihood a student graduates on time by 12.5 percentage
points, a statistically significant effect.21 This negative estimate falls to zero when the outcome is
graduation within five years of 9th-grade entry. Interestingly, charter schools appear no more likely
to cause students to repeat 9th, 10th, or 11th grade than are traditional public schools. This is
apparent from an analysis of effects on the likelihood of starting 10th, 11th, or 12th grade on time.
Instead, as can be seen in the repeat 12th grade estimate, it appears that charter students take
an additional 12th-grade year to graduate, perhaps due to more rigorous graduation requirements.
The subset of students taking an additional year in high school may be substituting the high school
year for remediation in community college, which is less expensive for the student.22
Some Massachusetts high school graduates earn a GED instead of a traditional diploma. GED
completion data are available for tests taken between 2006 and 2010, so our analysis here is limited
to students projected to graduate in this time period. Panel B of Table 7 shows the decline in
four-year graduation shrinks when GED diplomas are included, though this is mostly due to a
smaller estimate of the non-GED graduation effect in the sample with available GED data. At the
21On-time graduation dates are determined by counting from the entry grade to grade 12.22High school is less expensive for the student, but Masschusetts community college per-pupil expenditures are
around $10,000 per student, compared to about $14,000 in high school.
15

same time, consistent with the results in Panel A, five-year graduation rates including GEDs are
largely unaffected by charter attendance.
5 College Enrollment and Choice
The charter schools in this study focus on college readiness. Nearly half of the applicants in our
sample enroll in college immediately in the fall after graduation, while 60 percent start college
within a 18 months of expected graduation. While the estimated effect of charter attendance on
college attendance is positive, it is not large enough to generate a statistically significant finding.
This can be seen in the first row of Table 8, which reports enrollment rates and charter effects
for two subsamples. The first sample includes cohorts for whom we have college attendance data
for the fall immediately following their expected high school graduation (the “within 6 months”
sample). The second, smaller sample includes cohorts we can follow for an additional year (the
“within 18 months” sample). Columns (2) and (4) report enrollment effects on applicants who can
be followed in these two windows. Although substantial, the resulting estimates of 0.063 and 0.115
are not measured precisely enough to rule out a chance finding.
While the estimates of overall enrollment effects are inconclusive, the results in Table 8 show
a clear shift from two-year colleges to four-year colleges. Specifically, in the within 6 months
enrollment window, charter attendance decreases two-year attendance by 11 points, while increasing
four-year attendance by 17 points. The decline in two-year attendance is just 6 points in the
longer window, while the estimated gain in four-year attendance is unchanged. Gains in four-year
attendance are large enough to generate highly significant estimates, with confidence intervals well
away from zero.
The gains in four-year enrollment documented in Table 8 are driven entirely by increases in
attendance at public four-year schools, with no effect on private attendance. The last row of Panel
A in Table 8 shows that most of this gain is through enrollment at Massachusetts public colleges.
In fact, the Boston campus of the University of Massachusetts is the modal institution for former
charter students in our sample. The Adams Scholarship likely contributes to this pattern, though
college counseling may also play a role.
16

In a recent study, Cohodes and Goodman (2013) suggest Adams Scholarship awards tend to
reduce the selectivity of colleges chosen by scholarship winners. Panel B of Table 8 reports charter
effects on college enrollment by selectivity tier, as defined by the Barron’s ranking system. These
results show that charter attendance has little effect on the selectivity of schools charter applicants
choose to attend. College downgrading does not appear to be an unintended consequence of charter
attendance, perhaps because most of Boston’s Adams scholarship recipients come from lower-income
backgrounds. The Cohodes-Goodman findings are driven by higher-income students who might
otherwise have attended private schools.
In addition to college enrollment, we look briefly at college persistence, as measured by the
likelihood of enrolling for three or more semesters. The samples available for such an analysis are
necessarily smaller than those available to study college enrollment. The persistence results, re-
ported in Table 9, suggest charter attendance increases the fraction of students who attempt at least
three academic semesters by about 13 points, a marginally significant effect. The corresponding
estimate for the one year later sample is a little smaller, at 11 points, but less precisely estimated.
Estimates of effects on 4-plus semester enrollment are too imprecise to be useful.
Taken together, the estimates reported here show that charter high school attendance boosts
outcomes both in the short run (standardized test scores) and in the long run (college preparation
and choice). We summarize the relationship between short-run and long-run impacts in Figure 3.
Specifically, this figure plots MCAS estimates against estimates for longer-run outcomes for each of
the within-risk-set experiments in our charter lottery data. Each risk set is represented by a bubble,
with bubble sizes inversely proportional to the standard error of the MCAS estimate for that risk
set. SAT score gains track MCAS gains closely (Panel A). Likewise, risk sets where score gains
are larger also appear to generate larger enrollment effects, though here the relationship between
impacts is looser than for the two test scores (Panel B). These findings suggest that the short-run
effects of Boston’s charter high schools on MCAS scores are a reliable guide to their longer-run
effects.
17
6 Additional Results
6.1 Effects in Subgroups
We next turn to an investigation of effects by subgroup. Results for most outcomes are similar
for boys and girls, as can be seen in the estimates reported in columns (1) and (2) of Table 10.
Charters reduce the four-year high school graduation rate more for boys than for girls, but the
affected boys seem to catch up, as there is no effect on five-year graduation for either gender. Our
point estimates of effects on SAT scores and four-year college enrollment are large and positive
for both boys and girls, though these gender-specific effects are not precisely estimated. In view
of evidence that many educational interventions do not work well for males, this finding seems
noteworthy (Anderson, 2008; Legewie and DiPrete, 2012; Angrist et al., 2009; Deming et al., 2013).
MCAS, SAT, and four-year enrollment effects are larger for special-needs students than for other
applicants. In fact, SAT gains are roughly twice as large for special education students as they
are for other students, a pattern documented in Panel D of Table 10. Moreover, as in the analysis
for boys, charter attendance reduces the four-year high school graduation rate considerably in the
special education group, but has little effect on the five-year rate.23 This pattern of results suggests
that charters are likely to hold back the most at-risk students for an additional year of instruction.
As in the special-education analysis, columns (5) and (6) suggest that students with baseline
scores below the sample median are more likely to gain from charter attendance than are high-
scorers.24 Effects on MCAS scores are somewhat larger for below-median students, while the effect
on composite SAT scores is much larger for the lower-scoring group (138 points vs. 77 points). The
effect of charter attendance on four-year college enrollment is driven entirely by students whose
scores are below median at baseline, and much of the 4-year effect on this group (0.21 out of 0.29
percentage points) comes from an increase in the overall rate of college enrollment rather than a
shift from two-year to four-year institutions.
Columns (7) and (8) show a less-consistent pattern by poverty status (as proxied by qualification
23There is some overlap between male students and special education students: about 63% of special educationstudents in our sample are boys.
24Here we split the sample by whether the sum of baseline math and ELA scores is below the median of thismeasure in the full MCAS ELA sample.
18

for a subsidized lunch), with the disadvantaged group gaining more in terms of college enrollment
and AP-taking but less on the SAT. At the same time, the estimate for four-year college attendance
among subsidized lunch students is striking: charter attendance raises the probability of four-year
attendance by 22 percentage points in this group. This finding is notable given recent evidence
that qualified poor students often choose not to attend four-year institutions (Bowen et al., 2009;
Hoxby and Avery, 2012). Overall, Table 10 suggests that Boston’s charter high schools boost key
outcomes for most subgroups, with large effects on at-risk groups, including boys, special-education
students, and those who enter high school with low achievement.25
6.2 The Peer Channel
Charter schools are sometimes said to generate gains by the selective retention of higher performing
students (see, for example, Skinner (2009)). In this view, charter effectiveness is at least partly
attributed to a tendency to eject trouble-makers and stragglers, leaving a student population that
is easier to teach. Importantly, the causal interpretation of our lottery-based estimation strategy
is unaffected by selective retention because we follow all winners and losers, regardless of whether
they stay in charter. Moreover, the charter enrollment variable is “switched on” even for students
who spend only a single day enrolled in a charter school. Thus, outcomes for poor-performing
charter students who leave the school still count on the charter side of our IV estimation strategy.
At the same time, selective retention, if substantial, may lead to a favorable population mix
that generates positive peer effects on students who remain enrolled in charters. In other words,
charter schools may do well for most of their students in part because a few bad apples who
would otherwise be disruptive to all, or slow down the class, are encouraged to leave. While not
invalidating the evidence of gains reported here, this peer channel has different policy implications
than other explanations for charter effectiveness, such as differences in teacher quality or training.
We explore the peer channel by looking directly at school switching and how this affects peer
composition. School switching is defined as being observed in two or more schools after a lottery
25In addition to looking at heterogeneity in effects across subgroups of students, we also examined heterogeneityacross charter schools. Specifically, we asked whether our results are driven by any one charter school. AppendixTable A3 reports estimates for our key outcomes in samples that drop data for our six sample schools one-at-a-time.The results are similar across samples, suggesting that our findings are not due to the performance of any one charter.
19

application. As shown in column (1) of Table 11, Boston’s charter lottery applicants are highly
mobile: more than one-third of the sample changes schools by this measure. Column (2), which
reports 2SLS estimates of effects on school switching, shows that charter enrollment raises the
likelihood of a switch by about 12 percentage points, though this change is not significantly different
from zero. The switching effect increases to 15 percentage points, a marginally significant finding,
when switching is defined to omit natural transitional grades such as from fifth to sixth (some
charters have unusual grade structures, a fact that might alter transition rates).
Might this evidence of differential switching account for the charter school gains reported here?
Panel B assesses the explanatory power of the peer channel by showing the effects of charter
enrollment on peer quality throughout high school. Here, peer quality is defined as the average
baseline test score of the students with whom a lottery applicant attends school. Not surprisingly,
given the positive selection of charter applicants, charter enrollment is associated with increases in
peer achievement in the first post-lottery year: the (marginally significant) effect here is roughly
0.13σ in each subject. This composition effect would be even larger if not for the fact, documented
in the last row of Panel A, that charter enrollment reduces exam school enrollment. In other words,
the counterfactual for some charter students is an exam school, which also enrolls positively selected
peers.
Panel B also shows, however, that the positive effect of charter attendance on peer quality
falls through high school: the coefficients shrink as students progress through school and are not
significantly different from zero after the first year. The pattern of peer composition effects is driven,
in part, by increasing peer quality in the schools attended by those who lose charter lotteries. This
is documented in Figure 4, which plots the profile of mean peer quality for charter lottery compliers,
separately by treatment status. Mean peer quality for compliers is estimated using methods similar
to those used to construct the densities in figures 1 and 2.26 Figure 4 documents a large initial
gap in favor of lottery winners. This gaps closes with time, as peer quality rises more sharply for
compliers who lose the lottery. This pattern is likely driven by high dropout rates at traditional
public schools among students with the lowest baseline scores. These results suggest that the
26Specifically, we estimate versions of equations (3) and (4) that put the level of peer composition on the left handside, without kernel weighting.
20

paper’s results cannot be attributed to low-quality peers leaving charter schools. If anything, such
a dynamic is more pronounced at Boston’s traditional public schools. 27
7 Conclusion
Studies of many educational interventions show promising short-run gains followed by discourag-
ingly fast fadeout. This paper uses randomized admission lotteries to ask whether the substantial
short-run test score effects of Boston’s charter high schools translate into gains on longer-run
outcomes like SAT scores, Advanced Placement test-taking and scores, college attendance, and
college choice. Our estimates suggest that the effects of Boston’s charters are remarkably persistent.
Specifically, charter attendance raises the probability that students pass the score thresholds for
high-stakes exams required for high-school graduation, boosts the likelihood that students qualify
for an exam-based college scholarship, increases SAT scores, increases the frequency of AP test-
taking with modest gains in scores, and shifts students away from attending two-year institutions
and towards four-year attendance. The effect of charter attendance on the probability of attending
a four-year public institution in Massachusetts is particularly large. Moreover, these schools seems
to be highly effective for subgroups that are often difficult to serve, including boys, special education
students, and students with low achievement at high school entry.
In view of often-voiced concerns about the effect of charter schools on student attrition, we
explore a possible explanation for these gains in the form of school switching and peer effects.
Charter attendance increases school switching outside of transitional grades, but this does not
accentuate the effect of charter enrollment on peer composition. If anything, charter peers become
more like peers at traditional public schools as students progress through high school. As a result,
it seems unlikely that changes in peer composition are the primary driver of our findings.
These results suggest that the short-run test score impacts reported in our previous work on
27We also explored the importance of the peer channel by estimating 2SLS models where the endogenous variableis peer quality. The results of this analysis are reported in Web Appendix Table B3. These models imply that, inorder for peers to account for the estimated effect of charters, a 1σ increase in initial peer quality must improve astudent’s test score by between 2.5 and 2.8σ. This peer multiplier is implausibly large relative to peer effects estimatedelsewhere, including Hoxby (2000) (0.3-0.5σ), Hanushek et al. (2003) (0.15-0.24σ), and other studies summarized inSacerdote (2011)’s recent survey.
21

Boston’s charter schools are not driven by gaming or teaching to the test; rather, they seem
to represent increases in underlying human capital, with effects that generalize to a number of
other contexts. The cohorts of lottery applicants in our sample are too young to generate reliable
estimates of effects on college persistence or graduation. In future work, we plan to investigate the
effects of Boston’s charter schools on these outcomes, as well as longer-run labor market outcomes
like employment and earnings.
22

References
Abadie, A. (2002). Bootstrap tests for distributional treatment effects in instrumental variablesmodels. Journal of the American Statistical Association, 97(457).
Abadie, A. (2003). Semiparametric instrumental variable estimation of treatment response models.Journal of Econometrics, 113(2).
Abdulkadiroglu, A., Angrist, J., Dynarski, S., Kane, T. J., and Pathak, P. (2011). Accountabilityand flexibility in public schools: Evidence from Boston’s charters and pilots. The QuarterlyJournal of Economics, 126(2):699–748.
Anderson, M. L. (2008). Multiple inference and gender differences in the effects of early intervention:A reevaluation of the abecedarian, perry preschool, and early training projects. Journal of theAmerican statistical Association, 103(484):1481–1495.
Andrabi, T., Das, J., Ijaz Khwaja, A., and Zajonc, T. (2011). Do value-added estimates add value?accounting for learning dynamics. American Economic Journal: Applied Economics, 3(3):29–54.
Angrist, J. D., Cohodes, S. R., Dynarski, S. M., Fullerton, J., Kane, T. J., Pathak, P. A., andWalters, C. R. (2011a). Student achievement in Massachusetts’ charter schools. Center forEducation Policy Research at Harvard University.
Angrist, J. D., Dynarski, S. M., Kane, T. J., Pathak, P. A., and Walters, C. R. (2010). Inputs andimpacts in charter schools: KIPP Lynn. American Economic Review, 100(2):239–243.
Angrist, J. D., Dynarski, S. M., Kane, T. J., Pathak, P. A., and Walters, C. R. (2012). Whobenefits from KIPP? Journal of Policy Analysis and Management, 31(4):837–860.
Angrist, J. D., Lang, D., and Oreopoulos, P. (2009). Incentives and services for college achievement:Evidence from a randomized trial. American Economic Journal: Applied Economics, 1(1):136–163.
Angrist, J. D., Pathak, P. A., and Walters, C. R. (2011b). Explaining charter school effectiveness.Working Paper 17332, National Bureau of Economic Research, Cambridge, MA.
Banerjee, A. V., Cole, S., Duflo, E., and Linden, L. (2007). Remedying education: Evidence fromtwo randomized experiments in india. The Quarterly Journal of Economics, 122(3):1235–1264.
Booker, K., Sass, T. R., Gill, B., and Zimmer, R. (2008). Going beyond test scores: Evaluatingcharter school impact on educational attainment in Chicago and Florida. RAND, Santa Monica,CA.
Bowen, W. and Bok, D. (2000). The Shape of the River: Long-Term Consequences of ConsideringRace in College and University Admissions. Princeton University Press, Princeton, NJ.
Bowen, W. G., Chingos, M. M., and McPherson, M. S. (2009). Crossing the finish line: Completingcollege at America’s public universities. Princeton University Press, Princeton, NJ.
Chetty, R., Friedman, J. N., Hilger, N., Saez, E., Schanzenbach, D. W., and Yagan, D. (2011a). Howdoes your kindergarten classroom affect your earnings? Evidence from Project STAR. QuarterlyJournal of Economics, 126(4):1593–1660.
23

Chetty, R., Friedman, J. N., and Rockoff, J. E. (2011b). The long-term impacts of teachers: Teachervalue-added and student outcomes in adulthood. NBER Working Paper 17699, National Bureauof Economic Research.
Cohodes, S. and Goodman, J. (2013). Merit aid, college quality, and college completion:Massachusetts’ Adams scholarship as an in-kind subsidy. HKS Faculty Research Working PaperSeries RWP13-005.
Cunha, F., Heckman, J. J., and Schennach, S. M. (2010). Estimating the technology of cognitiveand noncognitive skill formation. Econometrica, 78(3):883–931.
Currie, J. and Thomas, D. (2000). School quality and the longer-term effects of head start. TheJournal of Human Resources, 35(4):755.
Deming, D. (2009). Early childhood intervention and life-cycle skill development: Evidence fromHead Start. American Economic Journal: Applied Economics, 1(3):111–134.
Deming, D. J., Hastings, J. S., Kane, T. J., and Staiger, D. O. (2013). School choice, school qualityand postsecondary attainment. The American Economic Review.
Dobbie, W. and Fryer, R. G. (2011a). Are high-quality schools enough to increase achievementamong the poor? Evidence from the Harlem Children’s Zone. American Economic Journal:Applied Economics, 3(3):158–187.
Dobbie, W. and Fryer, R. G. (2011b). Getting beneath the veil of effective schools: Evidencefrom New York City. Technical Report NBER Working Paper No. 17632, National Bureau ofEconomic Research, Cambridge, MA.
Dobbie, W. and Fryer, R. G. (2012). Are high quality schools enough to reduce social disparities?Evidence from the Harlem Children’s Zone. Unpublished manuscript, Harvard University.
Dynarski, M. and Gleason, P. (2002). How can we help? what we have learned from recent federaldropout prevention evaluations. Journal of Education for Students Placed At Risk, 7(1):43–69.
Dynarski, M., Gleason, P., Rangarajan, A., and Wood, R. (1998). Impacts of dropout preventionprograms. Technical report, Mathematica Policy Research, Inc., Princeton, NJ.
Dynarski, M. and Wood, R. (1997). Helping high-risk youths: Results for the alternative schoolsdemonstration program. Mathematica Policy Research, Inc. Princeton, NJ.
Dynarski, S. M., Hyman, J. M., and Schanzenbach, D. W. (2011). Experimental evidence onthe effect of childhood investments on postsecondary degree attainment and degree completion.Working Paper 17553, National Bureau of Economic Research, Cambridge, MA.
Garces, E., Thomas, D., and Currie, J. (2002). Longer-term effects of head start. The AmericanEconomic Review, 92(4):999–1012.
Hanushek, E., Kain, J., Markman, J. M., and Rivkin, S. (2003). Does peer ability affect studentachievement?
24

Heuer, R. and Stullich, S. (2011). Comparability of state and local expenditures among schoolswithin districts: A report from the study of school-level expenditures. Technical report, U.S.Department of Education, Office of Planning, Evaluation and Policy Development, Policy andProgram Studies Service.
Hoxby, C. (2000). Peer effects in the classroom: Learning from gender and race variation. NBERWorking Paper, 7867.
Hoxby, C. M. and Avery, C. (2012). The missing “one-offs”: The hidden supply of high-achieving,low-income students. NBER Working Paper 18586, National Bureau of Economic Research.
Imbens, G. W. and Angrist, J. D. (1994). Identification and estimation of local average treatmenteffects. Econometrica, 62(2):467–475.
Jacob, B. A. (2007). Test-based accountability and student achievement: An investigation ofdifferential performance on NAEP and state assessment. Working Paper 12817, National Bureauof Economic Research, Cambridge, MA.
Jacob, B. A., Lefgren, L., and Sims, D. P. (2010). The persistence of teacher-induced learning.Journal of Human Resources, 45(4):915–943.
Jacob, B. A. and Levitt, S. D. (2003). Rotten apples: An investigation of the prevalence andpredictors of teacher cheating. The Quarterly Journal of Economics, 118(3):843–877.
Kane, T. J. and Staiger, D. O. (2008). Estimating teacher impacts on student achievement: Anexperimental evaluation. Technical Report Working Paper 14607, National Bureau of EconomicResearch, Cambridge, MA.
Kemple, J. and Snipes, J. (2000). Career academies: Impacts on students’ engagement andperformance in high school. MDRC. New York.
Krueger, A. B. and Whitmore, D. M. (2001). The effect of attending a small class in the earlygrades on college-test taking and middle school test results: Evidence from project star. TheEconomic Journal, 111(468):1–28.
Legewie, J. and DiPrete, T. A. (2012). School context and the gender gap in educationalachievement. American Sociological Review, 77(3):463–485.
Massachusetts Department of Elementary and Secondary Education (2013). The Commenwealthof Massachusetts Department of Elementary and Secondary Education Massachusetts charterschools fact sheet.
Neal, D. and Schanzenbach, D. W. (2010). Left behind by design: Proficiency counts and test-basedaccountability. Review of Economics and Statistics, 92(2):263–283.
Sacerdote, B. (2011). Peer Effects in Education: How Might They Work, How Big Are They andHow Much Do We Know Thus Far?, volume 3 of Handbook of the Economics of Education,chapter 4, pages 249–277. Elsevier.
Silverman, B. W. (1986). Density estimation for statistics and data analysis, volume 26. CRCpress.
25

Skinner, K. (2009). Charter school succes or selective out-migration of low achievers? effectsof enrollment management on student achievement. Technical report, Massachusetts TeachersAssociation.
Thernstrom, A. M. and Thernstrom, S. (2003). No excuses: Closing the racial gap in learning.Simon & Schuster, New York.
Tuttle, C. C., Gill, B., Gleason, P., Knechtel, V., Nichols-Barrer, I., and Resch, A. (2013). KIPPmiddle schools: Impacts on achievement and other outcomes. Mathematica Policy Research,Princeton, NJ.
26

Figure 1: Complier Distributions for MCAS Scaled Scores
K-S test stat: 7.698K-S p-value: <0.001
0.0
1.0
2.0
3.0
4
200 210 220 230 240 250 260 270 280
First-attempt scaled grade 10 MCAS ELA score distribution
K-S test stat: 7.724K-S p-value: <0.001
.01
.02
.03
First-attempt scaled grade 10 MCAS math score distribution
Notes: This figure plots smoothed MCAS scaled score distributions for treated and untreated charter lottery compliers. The sample is restricted to lottery applicants who are projected to graduate between 2006 and 2013, assuming normal academic progress from baseline. Dotted vertical lines indicate MCAS performance category thresholds (220 for Needs Improvement, 240 for Proficient, and 260 for Advanced). Densities are estimated using an Epanechnikov kernel function with a bandwidth equal to twice the Silverman (1986) rule-of-thumb. Kolmogorov-Smirnov statistics and p-values are from bootstrap tests of distributional equality for treated and untreated compliers.
0
200 210 220 230 240 250 260 270 280
Untreated Compliers Treated Compliers

Figure 2: Complier Distributions for SAT Scores
K-S test stat: 1.962K-S p-value: 0.007
0.0
005
.001
.001
5
600 800 1000 1200 1400 1600 1800 2000 2200 2400
Composite SAT score distribution
K-S test stat: 1 67.004
SAT Writing score distribution
K-S test stat: 1.636K-S p-value: 0.012
0.0
01.0
02.0
03.0
04
200 300 400 500 600 700 800
SAT Reading score distribution
K-S test stat: 1 857
.004
SAT Math score distribution
Notes: This figure plots smoothed SAT score distributions for treated and untreated charter lottery compliers. The sample is restricted to lottery applicants who are projected to graduate between 2007 and 2012, assuming normal academic progress from baseline. Densities are estimated using an Epanechnikov kernel function with a bandwidth equal to twice the Silverman (1986) rule-of-thumb. Kolmogorov-Smirnov statistics and p-values are from bootstrap tests of distributional equality for treated and untreated compliers.
K S test stat: 1.67K-S p-value: 0.017
0.0
01.0
02.0
03
200 300 400 500 600 700 800
K-S test stat: 1.857K-S p-value: 0.013
0.0
01.0
02.0
03
200 300 400 500 600 700 800
Untreated Compliers Treated Compliers

Figure 3: Lottery Estimates of Effects within Risk Sets
5
55
5
1
2
2
23
3
3
33
3
43/5
3/5
3/53/5
3/6
-400
-200
020
040
0S
AT
Rea
soni
ng
-2 -1.5 -1 -.5 0 .5 1 1.5 2 2.5 3 3.510th-grade MCAS Composite
Panel A: MCAS Composite-SAT Reasoning
1
Panel B: MCAS Composite-Four-year Within 6 Months Enrollment
Notes: This figure plots within-risk-set lottery estimates of the effects of charter school attendance. Panel A plots effects on SAT Reasoning (Verbal + Math) against effects on MCAS Composite scores. Panel B plots effects on the probability of within 6 months enrollment in a four-year college against effects on MCAS Composite scores. The sample in Panel A includes students projected to graduate between 2007 through 2012 while the sample in Panel B includes students projected to graduate between 2006 through 2011. Data points are labeled by school number, with schools numbered in decreasing order of their MCAS math effects. Blue circles indicate risk sets in which students applied to one school, while red squares indicate risk sets in which students applied to two. Marker sizes are proportional to the inverse of the standard errors of the estimates on the x-axis. Estimates for a given risk set use the instrument (ever or initial offer) with the larger first-stage t-statistic. The sample excludes risk sets with first-stage t-statistics less than one; this restriction would remove all data for one school, so the largest risk set for that school is retained.
5
5
5
5
2
2
33
3
3
33
3/53/5
3/5
3/5
3/6
-1-.
50
.5F
our-
year
With
in 6
Mon
ths
Enr
ollm
ent
-3 -2.5 -2 -1.5 -1 -.5 0 .5 1 1.5 2 2.510th-grade MCAS Composite

Figure 4: Peer Quality For Charter Lottery Compliers
-.4
-.3
5-.
3
Peer Quality in ELA
-.4
5-.
4-.
35
Peer Quality in Math
Notes: This figure plots mean peer quality in the first, second, third and fourth years after the lottery for treated and untreated charter lottery compliers. The sample is restricted to lottery applicants who are projected to graduate between 2006 and 2012. Peer quality is measured as the average baseline score for other students in the same school and year.
-.5
-.4
5
1 2 3 4Post-lotto Year
-.5
5-.
5
1 2 3 4Post-lotto Year
Untreated Compliers Treated Compliers

Public High Schools
Charters Serving Grade 9-12
Charters Serving Grade 9-12 Only
Charters in the Study
Mean Mean Mean Mean(1) (2) (3) (4)
Number of years open - 14 15 14Days per year 180 190 189 191Average minutes per day 389 478 477 489Have Saturday school - 0.71 0.75 0.83Avg. math instructions (min) - 92.0 83.5 97.3Avg. reading instruction (min) - 92.0 89.8 97.3No Excuses - 0.71 0.75 0.83
Number of teachers 45 27 19 28Student/teacher ratio 14.6 13.0 13.6 13.3Proportion of teachers licensed in teaching assignment 0.97 0.63 0.71 0.58Proportion of teachers 32 and younger 0.28 0.71 0.71 0.76Proportion of teachers 49 and older 0.35 0.09 0.10 0.05Proportion of core classes taught by highly qualified teachers 0.93 0.97 0.98 0.97Avg. per-pupil expenditure $12,573 $13,694 $15,581* $13,499Title I eligible 1 1 1 1
N (schools) 21 7 4 6
Table 1: Boston School Characteristics
Panel A: Charter School Characteristics
Panel B: Comparison with Traditional Boston Public Schools
Notes: This table reports characteristics of Boston charter schools and Boston public schools operating in academic calendar year 2012-13. Charter school characteristics are obtained from a survey of school administrators. Panel B compares Boston charter high schools to Boston public high schools. Data on public schools are from http:\\www.doe.mass.edu. Boston public high schools (column 1) include Another Course to College, Boston Arts Academy, Boston Community Leadership Academy, Boston Latin Academy, Boston Latin School, Brighton High, Boston International High, Burke High, Charlestown High, Community Academy of Science and Health, Dorchester Academy, East Boston High, The English High, Excel High, Fenway High, Greater Egleston High, New Mission High, O'Bryant School of Math and Science, Quincy Upper, Snowden International High, and Urban Science Academy. Data for West Roxbury Academy and TechBoston Aacdemy are missing. Boston charters serving grade 9-12 (column 2) include Academy of the Pacific Rim, Boston Preparatory, City on a Hill, Codman Academy, Boston Collegiate High, Health Careers Academy, and Match. Boston charter high schools serving grade 9-12 only (column 3) are City on a Hill, Codman Academy, Match, Health Careers Academy. Charters in this study (column 4) include Academy of the Pacific Rim, Boston Preparatory, City on a Hill, Codman Academy, Boston Collegiate High, and Match. Statistics are based on data from the 2010-2011 school year. Average per pupil expenditures data is weighted by school enrollment and includes administration, instructional leadership, classroom and specialist teachers, other teaching services, professional development, instructional materials, equipment, and technology, guidance counseling and testing, pupil services, operations and management, and insurance and retirement programs. This statistic for the Boston Public Schools includes spending for all grade levels. The Boston Public Schools Expenditure statistic comes from MA DOE District Profiles Finance Table “Total Expenditure Per Pupil, All Funds, By Function.” The charter school finance data comes from MA DOE “FY2011 Charter School End of Year Financial Report Summary.” *This calculation excludes one of the 9-12 schools because we only have expenditure data for this school's middle and high school combined.

BPS 9th Graders BPS 9th Graders Lottery Applicants BPS 9th Graders Lottery ApplicantsMean Mean Ever Offer Initial Offer Mean Mean Mean Mean
(1) (2) (3) (4) (5) (6) (7) (8)Female 0.496 0.542 0.007 0.025 0.497 0.536 0.499 0.542
(0.021) (0.019)Black 0.421 0.614 -0.007 0.004 0.419 0.606 0.436 0.624
(0.021) (0.018)Hispanic 0.308 0.248 0.000 0.000 0.310 0.263 0.300 0.252
(0.018) (0.016)Asian 0.101 0.034 0.000 -0.004 0.100 0.033 0.099 0.035
(0.008) (0.006)Subsidized Lunch 0.743 0.728 0.020 0.015 0.749 0.738 0.744 0.738
(0.019) (0.017)Special Education 0.205 0.180 -0.005 0.009 0.199 0.180 0.201 0.175
(0.017) (0.015)Limited English Proficiency 0.120 0.035 0.003 0.002 0.112 0.037 0.118 0.033
(0.008) (0.007)Baseline MCAS ELA -0.489 -0.292 -0.008 -0.036 -0.473 -0.339 -0.450 -0.295
(0.037) (0.034)Baseline MCAS Math -0.427 -0.306 0.011 -0.021 -0.411 -0.329 -0.406 -0.334
(0.038) (0.034)
P-Value 0.947 0.902
Took any AP 0.267 0.312
Took SAT 0.493 0.642
On-time College Enrollment 0.367 0.479
Charter Attendance 0.297 0.280 0.275Ever Offer 0.654 0.639 0.618Initial Offer 0.314 0.310 0.296
N 29857 22467 2957 19674 2599
Table 2: Descriptive Statistics
Notes: This table shows descriptive statistics for charter lottery applicants and Boston Public School (BPS) students. Column (1) shows means for BPS attendees projected to graduate between 2006 and 2013, assuming normal academic progress from 8th grade. Column (2) shows means for charter applicants in the same projected graduation year range. Columns (5) and (6) show means for the AP/SAT sample (projected graduation dates 2007-2012). Columns (7) and (8) show means for the NSC (National Student Clearinghouse) sample (projected graduation dates 2006-2011). Columns (3) and (4) report coefficients from regressions of observed characteristics on ever and initial lottery offers, controlling for risk set indicators. The sample for these regressions is restricted to charter lottery applicants with follow-up MCAS ELA scores. P-values are from tests of the hypothesis that all coefficients are zero. Baseline grade is defined as 4th grade for Boston Collegiate applicants, 5th grade for Boston Preparatory and Academy of the Pacific Rim, and 8th grade for Match, Codman Academy and City on a Hill. Baseline grade for BPS 9th graders is 8th grade. On-time college enrollment is indicates enrollment by the semester after projected high school graduation, assuming normal academic progress from baseline.*significant at 10%; **significant at 5%; ***significant at 1%
2007-12 (AP/SAT outcome sample) 2006-11 (NSC outcome sample)Projected Senior Year
-
-
--
-
-
2006-13 (MCAS outcome sample)Lottery Applicants
3671
- - -
-
-
-

Outcome MeanEver Offer Initial Offer [s.d.] Effect
Subject (1) (2) (3) (4)
Standardized ELA 0.228*** 0.134*** -0.285 0.411***(0.041) (0.026) [0.833] (0.104)
N
Standardized Math 0.229*** 0.134*** -0.231 0.569***(0.041) (0.026) [0.911] (0.120)
N
Standardized ELA 0.230*** 0.123*** -0.298 0.345***(0.050) (0.031) [0.841] (0.130)
N
Standardized Math 0.232*** 0.122*** -0.234 0.477***(0.050) (0.031) [0.893] (0.156)
N
Standardized ELA 0.239*** 0.118*** -0.289 0.303**(0.054) (0.036) [0.833] (0.139)
N
Standardized Math 0.242*** 0.118*** -0.238 0.543***(0.054) (0.036) [0.894] (0.154)
N
Table 3: Lottery Estimates of Effects on 10th-Grade MCAS Scores by Projected Senior Year
3671
First Stage
Notes: This table reports 2SLS estimates of the effects of Boston charter attendance on 10th-grade MCAS test scores. The sample for each panel includes students projected to graduate in the year range specified in the panel title. The endogenous variable is an indicator for charter attendance in 9th or 10th grade. The instruments are ever offer and initial offer dummies. Initial offer is equal to one when a student is offered a seat in any charter school immediately following the lottery, while ever offer is equal to one for students offered seats at any time. All models control for risk sets, 10th grade calendar year dummies, race, sex, special education, limited English proficiency, subsidized lunch status, and a female by minority dummy. Standard errors are clustered at the school-year level in 10th grade. Means and standard deviations in column (3) are for non-charter students.*significant at 10%; **significant at 5%; ***significant at 1%
3615
Panel A: 2006-2013 (MCAS outcome sample)
Panel B: 2007-2012 (AP/SAT outcome sample)
2776
2732Panel C: 2006-2011 (NSC outcome sample)
2438
2399

Mean Effect Mean Effect(1) (2) (3) (4)
Needs Improvement or Higher 0.964 -0.016 0.990 -0.014(0.023) (0.011)
Proficient or Higher 0.659 0.170*** 0.661 0.167***(0.061) (0.061)
Advanced or Higher 0.091 0.187*** 0.091 0.190***(0.036) (0.036)
Meets Competency Determination 0.810 0.165*** 0.828 0.151***(0.053) (0.052)
N 3671
Needs Improvement or Higher 0.914 0.082** 0.977 0.031**(0.033) (0.015)
Proficient or Higher 0.642 0.172*** 0.645 0.148**(0.065) (0.065)
Advanced or Higher 0.319 0.267*** 0.319 0.267***(0.061) (0.061)
Meets Competency Determination 0.757 0.133** 0.799 0.101*(0.058) (0.056)
N 3615
Needs Improvement or Higher 0.903 0.080** 0.975 0.019(0.035) (0.016)
Proficient or Higher 0.542 0.173** 0.544 0.166**(0.071) (0.073)
Advanced or Higher 0.075 0.161*** 0.075 0.165***(0.035) (0.035)
Meets Competency Determination 0.694 0.177*** 0.741 0.144**(0.066) (0.066)
Eligible for Adams Scholarship 0.199 0.242***Using BPS Cutoffs (0.059)
N 3594
Table 4: Lottery Estimates of Effects on MCAS Performance CategoriesFirst Attempt Ever
Notes: This table reports 2SLS estimates of the effects of Boston charter attendance on 10th-grade MCAS performance categories and eligibility for the Adams Scholarship. The Competency Determination requires scaled scores of 220 in both ELA and math for the classes of 2006-2009, and scores of 240 in both subjects for the classes of 2010-2013. A student is eligible for the Adams Scholarship if he or she is proficient in both subjects, advanced in at least one subject, and scores among the top 25% of the Boston district on his or her first attempt. BPS cutoffs for projected graduation cohorts 2012 and 2013 are imputed with the 2011 cutoff. A student "needs improvement" if he or she scores at or above 220 on both tests; "is proficient" if he or she scores at or above 240 on both tests; and "is advanced" if he or she scores at or above 260 on both tests. See Table 3 notes for detailed regression specifications. Means are for non-charter attendees.*significant at 10%; **significant at 5%; ***significant at 1%
Panel B: MCAS Math
Panel A: MCAS ELA
Panel C: ELA and Math Combined

Mean Mean Mean[s.d.] Effect [s.d.] Effect [s.d.] Effect(1) (2) (3) (4) (5) (6)
Took SAT 0.634 0.033[0.482] (0.078)
0.253 0.135** 0.253 0.116*[0.435] (0.066) [0.435] (0.067)
Score Above MA Median 0.092 0.113** 0.082 0.100**[0.289] (0.049) [0.275] (0.040)
Score In MA Top Quartile 0.026 0.000 0.019 -0.009[0.160] (0.016) [0.137] (0.017)
N 2957
Average Score 846.4 75.2*** 1254.3 102.8**(For takers) [166.6] (29.1) [240.1] (42.9)
N 1897
Mean Mean Mean[s.d.] Effect [s.d.] Effect [s.d.] Effect(1) (2) (3) (4) (5) (6)
0.299 0.165** 0.263 0.121** 0.278 0.107[0.458] (0.080) [0.440] (0.061) [0.448] (0.067)
Score Above MA Median 0.116 0.144** 0.102 0.064 0.096 0.054[0.320] (0.057) [0.303] (0.046) [0.294] (0.041)
Score In MA Top Quartile 0.032 0.047* 0.025 -0.019 0.022 0.010[0.177] (0.028) [0.157] (0.021) [0.147] (0.021)
N 2957
Average Score 434.1 51.7*** 412.3 23.5 407.9 27.5*(For takers) [95.5] (16.9) [87.4] (15.7) [86.7] (16.2)
N 1897
Composite (2400)Table 5: Lottery Estimates of Effects on SAT Test-taking and Scores
Notes: This table reports 2SLS estimates of the effects of Boston charter attendance on SAT test-taking and scores. The sample includes students projected to graduate between 2007 and 2012. SAT outcomes are coded using the last test taken by each student. The average score outcomes restrict the sample to SAT takers. All other outcomes are equal to zero for non-SAT takers. Maximum possible scores are shown in parenthesis next to outcome labels. See Table 3 notes for detailed regression specifications. Means are for non-charter attendees.*significant at 10%; **significant at 5%; ***significant at 1%
Math (800) Verbal (800) Writing (800)
Reasoning (1600)Taking
Score Above MA Bottom Quartile
Score Above MA Bottom Quartile
-
-
-
-

Mean Effect Mean Effect Mean Effect Mean Effect Mean Effect(1) (2) (3) (4) (5) (6) (7) (8) (9) (10)
Took Exam 0.266 0.287*** 0.099 0.324*** 0.062 0.212*** 0.034 0.178* 0.147 0.076(0.073) (0.061) (0.070) (0.093) (0.078)
Number of Exams 0.512 0.963*** 0.112 0.314***(0.274) (0.070)
Score 2 or Higher 0.136 0.154** 0.028 0.044 0.018 0.087* 0.023 0.056 0.087 0.070(0.068) (0.032) (0.045) (0.048) (0.054)
Score 3 or Higher 0.070 0.096* 0.016 0.020 0.015 0.073* 0.014 0.028 0.023 0.034(0.052) (0.015) (0.040) (0.019) (0.027)
Score 4 or 5 0.039 0.008 0.009 -0.001 0.008 0.021 0.007 -0.010 0.009 0.003(0.033) (0.012) (0.019) (0.011) (0.012)
N 2957
Table 6: Lottery Estimates of Effects on Advanced Placement Test-taking and Scores English
Notes: This table reports 2SLS estimates of the effects of Boston charter attendance on AP test-taking and scores. The sample includes students projected to graduate between 2007 and 2012. Outcomes are equal to zero for students who never took AP exams. Science subjects include Biology, Chemistry, Physics B, Physics Mechanics, Physics Electricity/Magnetism, Computer Science A, Computer Science AB, and Environmental Science. Outcomes for Calculus combine Calculus AB and Calculus BC. Outcomes for English combine English Literature and English Language. See Table 3 notes for detailed regression specifications. Means are for non-charter attendees.*significant at 10%; **significant at 5%; ***significant at 1%
All AP Exams Calculus US HistoryScience

Mean Effect Mean Effect(1) (2) (3) (4)
Start 10th Grade On-time 0.896 -0.020 0.901 -0.004(0.027) (0.027)
Start 11th On-time 0.813 -0.033 0.837 -0.005(0.049) (0.047)
Start 12th On-time 0.780 0.002 0.820 0.010(0.057) (0.055)
N 3205 3030
Repeat 12th 0.076 0.144*** 0.075 0.153***(0.048) (0.052)
N 2599 2424
Four-year Graduation 0.688 -0.125** 0.728 -0.119*(0.063) (0.063)
N 3205 3030
Five-year Graduation 0.785 0.000 0.839 0.042(0.065) (0.060)
N 2599 2424
Four-year Graduation 0.693 -0.059 0.734 0.013(0.083) (0.113)
N 1887 1305
Four-year Graduation or GED 0.709 -0.039 0.748 -0.014(0.081) (0.112)
N 1884 1302
Five-year Graduation 0.789 0.072 0.847 0.149(0.099) (0.097)
N 1382 1282
Five-year Graduation or GED 0.825 0.019 0.875 0.069(0.094) (0.086)
N 1379 1279Notes: This table reports 2SLS estimates of the effects of Boston charter attendance on high school graduation and on-time grade progression. On-time grade progression (graduation) outcomes are equal to one if a student is observed in the relevant grade (graduates) by her projected year, assuming normal academic progress from baseline. The on-time outcome sample includes students projected to graduate between 2006 and 2012. Five-year graduation is equal to one if a student graduates by the year following her projected graduation year. Repeat 12th is one if a student repeats 12th grade for at least one academic year. The sample for repeat 12th and five-year graduation includes students projected to graduate by Spring 2011. Panel B shows effects on high school graduation and GED in the sample where GED outcomes are available (projected graduation dates 2006-2010). Four-year graduation or obtaining GED credential is equal to one if a student graduates or obtains GED credential before or in the spring of her projected graduation year. The sample includes students projected to graduate between 2006 and 2010. Columns (3) and (4) remove transferred or deceased applicants to match Massachusetts' official graduation rate definitions. See Table 3 notes for detailed regression specifications. Means are for non-charter attendees. *significant at 10%; **significant at 5%; ***significant at 1%
Table 7: Lottery Estimates of Effects on High School Graduation and Grade RepetitionExcl. Transferred and Deceased
Panel A: Grade Progression
Panel B: Graduation and GED

Mean Effect Mean Effect(1) (2) (3) (4)
Any 0.484 0.063 0.601 0.115(0.072) (0.084)
Two-year 0.121 -0.106** 0.183 -0.058(0.051) (0.064)
Four-year 0.363 0.170** 0.418 0.173**(0.070) (0.079)
Four-year Public 0.135 0.154*** 0.145 0.195***(0.059) (0.070)
Four-year Private 0.228 0.016 0.273 -0.022(0.076) (0.094)
Four-year Public In MA 0.116 0.116** 0.121 0.146**(0.054) (0.063)
Lowest Selectivity Tier Only 0.195 -0.025 0.284 0.032(0.056) (0.071)
Second Lowest Selectivity Tier Only 0.197 0.076 0.206 0.067(0.062) (0.068)
Top Three Selectivity Tiers 0.092 0.012 0.111 0.016(0.056) (0.055)
N 2599 1887
Within 6 Months
Notes: This table reports 2SLS estimates of the effects of Boston charter school attendance on college enrollment. Within 6 months enrollment (columns 1 and 2) is defined as enrollment by the semester following a student's projected high school graduation, while within 18 months enrollment (columns 3 and 4) is defined as enrollment within two fall semesters after projected graduation. The within 6 months enrollment sample includes students projected to graduate in 2011 or earlier. The within 18 months sample is restricted to students projected to graduate in 2010 or earlier. See Table 3 notes for detailed regression specifications. Means are for non-charter attendees.*significant at 10%; **significant at 5%; ***significant at 1%
Within 18 MonthsTable 8: Lottery Estimates of Effects on College Enrollment
Panel A: Any NSC-Covered School
Panel B: Barron's-Ranked Schools

Mean Effect Mean Effect Mean Effect(1) (2) (3) (4) (5) (6)
One academic semester 0.484 0.063 0.121 -0.106** 0.363 0.170**(0.072) (0.051) (0.070)
N 2599
Three academic semesters 0.358 0.118 0.064 -0.015 0.294 0.133*(0.080) (0.035) (0.072)
N 1887
One academic semester 0.601 0.115 0.183 -0.058 0.418 0.173**(0.084) (0.064) (0.079)
N 1887
Three academic semesters 0.462 0.018 0.128 -0.095 0.334 0.113(0.117) (0.073) (0.119)
N 1382
Table 9: Lottery Estimates of Effects on College Persistence
Panel A: Within 6 Months
Notes: This table reports 2SLS estimates of effects of Boston charter attendance on college persistence. Panel A shows estimates of effects on the probability of attempting one or three academic semesters on-time, that is, in the minimum possible time given a student's projected high school graduation date. Panel B shows corresponding estimates that allow one additional year to elapse before measurement of the outcome. See Table 3 notes for detailed regression specifications. Means are for non-charter attendees.*significant at 10%; **significant at 5%; ***significant at 1%
Panel B: Within 18 Months
Any Two-year Four-year

Boy Girl Yes No Below Median Above Median Yes NoOutcomes (1) (2) (3) (4) (5) (6) (7) (8)
Standardized ELA 0.446*** 0.372*** 0.529* 0.379*** 0.423*** 0.358*** 0.394*** 0.558***(0.164) (0.118) (0.272) (0.107) (0.144) (0.116) (0.116) (0.188)1682 1989 662 3009 1765 1762 2673 998
Standardized Math 0.498*** 0.615*** 0.676*** 0.551*** 0.570*** 0.497*** 0.526*** 0.748***(0.186) (0.145) (0.256) (0.128) (0.148) (0.132) (0.136) (0.223)
N 1653 1962 645 2970 1723 1734 2630 985
Took SAT -0.079 0.119 -0.137 0.067 -0.021 0.144 0.032 0.036(0.127) (0.090) (0.176) (0.080) (0.115) (0.091) (0.089) (0.135)
N 1371 1586 531 2426 1343 1314 2181 776
SAT Composite (2400) 90.0 96.8* 166.4** 91.8** 138.2*** 77.2 85.4** 216.7**(64.9) (52.2) (82.6) (45.2) (50.7) (50.4) (41.5) (94.9)
N 772 1125 249 1648 777 1034 1372 525
Took any AP 0.227** 0.320*** 0.293*** 0.278*** 0.269*** 0.333*** 0.320*** 0.135(0.106) (0.096) (0.108) (0.083) (0.086) (0.111) (0.075) (0.130)
Score 3 or Higher, any AP 0.148** 0.051 0.014 0.108* 0.034 0.180* 0.089 0.135(0.068) (0.072) (0.059) (0.065) (0.030) (0.103) (0.061) (0.088)
N 1371 1586 531 2426 1343 1314 2181 776
Four-year Graduation -0.225** -0.042 -0.433*** -0.076 -0.309*** 0.072 -0.109 -0.140(0.101) (0.082) (0.159) (0.069) (0.090) (0.086) (0.070) (0.136)
N 1474 1731 573 2632 1447 1429 2354 851
Five-year Graduation -0.022 -0.013 -0.089 0.018 -0.104 0.100 -0.018 0.084(0.097) (0.077) (0.167) (0.070) (0.091) (0.087) (0.074) (0.136)
N 1190 1409 454 2145 1168 1158 1918 681
Any 0.162 0.054 -0.038 0.125 0.213* -0.027 0.093 0.190(0.126) (0.103) (0.252) (0.088) (0.118) (0.131) (0.089) (0.190)
Four-year 0.165 0.173 0.253 0.152* 0.291*** -0.046 0.217** 0.028(0.119) (0.116) (0.238) (0.086) (0.111) (0.141) (0.085) (0.167)
N 866 1021 319 1568 842 832 1393 494
Special Education Subsidized Lunch
Panel A: 10th- Grade MCAS
Table 10: Lottery Estimates of Effects by SubgroupBaseline ScoresGender
Panel B: SAT Outcomes
Panel C: AP Outcomes
Panel D: High School Graduation Outcomes
Panel E: College Enrollment Within 18 Months
Notes: This table reports 2SLS estimates of the effects of Boston charter attendance by subgroup. The above- and below-median samples are constructed by splitting the sample by the median of the sum of baseline ELA and math scores, computed in the MCAS ELA outcome sample. See Table 3 notes for detailed regression specifications. Means are for non-charter attendees.*significant at 10%; **significant at 5%; ***significant at 1%

Mean Effect Mean Effect Mean Effect Mean Effect(1) (2) (3) (4) (5) (6) (7) (8)
Any switch 0.362 0.116(0.086)
N 3072
Switch excluding 0.330 0.151*transitional grades (0.082)
N 3063
Ever attend an exam school 0.145 -0.096**(0.042)
N 3205
Peer Baseline ELA -0.403 0.127* -0.357 0.065 -0.301 0.046 -0.277 0.022(0.068) (0.073) (0.075) (0.070)
Peer Baseline Math -0.407 0.131* -0.361 0.078 -0.298 0.076 -0.273 0.042(0.075) (0.079) (0.073) (0.075)
Peer Baseline Sum of ELA and Math -0.794 0.245* -0.703 0.151 -0.585 0.124 -0.537 0.066(0.140) (0.148) (0.143) (0.140)
N 3147 3188 2898 2744Notes: This table reports 2SLS estimates of the effects of Boston charter attendance on school switching and peer quality. The sample includes applicants projected to graduate between 2006 and 2012. The any switch outcome is one for students observed in two or more schools at any time after the lottery. The switch excluding transitional grades outcome is one for students who transition from one observed school to another at a grade other than the exit grade of the first school. Peer quality is measured as the average baseline score of other students in the same school and year. See Table 3 notes for detailed regression specifications. Means are for non-charter attendees.*significant at 10%; **significant at 5%; ***significant at 1%
Table 11: Lottery Estimates of Effects on School Switching and Peer Quality
Panel A: School Switching
Panel B: Peer QualityFirst Post-lotto Year Second Post-lotto Year Third Post-lotto Year Fourth Post-lotto Year

A Data Appendix
The data used for this study come from several sources. Lists of charter applicants and lotterywinners are constructed from records provided by individual charter schools. Information on schoolsattended and student demographics come from the Student Information Management System(SIMS), a centralized database that covers all public school students in Massachusetts. Test scoresare from the Massachusetts Comprehensive Assessment System (MCAS). Advanced Placement(AP) and Scholastic Aptitude Test (SAT) scores are provided by the College Board. Collegeattendance information comes from the National Student Clearinghouse (NSC). This Appendixdescribes each data source and details the procedures used to clean and match them.
Lottery Data
Data description and sample restrictionsOur sample of applicants is obtained from records of lotteries held at six Massachusetts charter
schools between 2002 and 2009. The participating schools and lottery years are listed in TableA1. A total of 26 school-specific entry cohorts are included in the analysis. Lotteries for threeparticipating schools, Match, Codman Academy and City on a Hill, were conducted for entry to9th grade; two schools, Boston Preparatory and Academy of the Pacific Rim, held lotteries for 6thgrade entry. Records for Boston Collegiate are from 5th grade lotteries.
The raw lottery records typically include applicants names, dates of birth, contact informationand other information used to define lottery groups, such as sibling status. The first five rowsin Table A1 show the sample restrictions we impose on the raw lottery records. We excludeduplicate applicants and applicants listed as applying to the wrong entry grade. We also drop lateapplicants, out-of-area applicants, and sibling applicants, as these groups are typically not includedin the standard lottery process. Imposing these restrictions reduces the number of lottery recordsfrom 9,256 to 8,851.
Lottery offers
In addition to the data described above, the lottery records also include information regardingoffered seats. We used this information to reconstruct indicator variables for whether lotteryparticipants received randomized offers. We make use of two sources of variation in charter offers,which differ in timing. The initial offer instrument captures offers made on the day of the charterschool lottery. The ever offer instrument captures offers made initially or later, as a consequence ofmovement down a randomly sequenced waiting list. The pattern of instrument availability acrossschools and applicant cohorts is documented in Panel B of Appendix Table A1. In some years, allapplicants eventually received offers, in which case only the initial offer instrument contributes tothe analysis; these cases are listed as No Variation for the ever offer instrument. As documentedin Table 2, initial and ever offer rates were 31 and 65 percent in our MCAS analysis sample, andthese rates were similar in the samples for other outcomes.
SIMS Data
Data descriptionOur study uses SIMS data from the 2001-2002 school year through the 2011-2012 school year.
Each year of data includes an October file and an end-of-year file. The SIMS records information on
42

demographics and schools attended for all students in Massachusetts public schools. An observationin the SIMS refers to a student in a school in a year, though there are some student-school-yearduplicates for students that switch grades or programs within a school and year. The SIMS includesa unique student identifier known as the SASID, which is used to match students from other datasources as described below.
Coding of demographics and attendance
The SIMS variables used in our analysis include grade, year, name, town of residence, date of birth,sex, race, special education and limited English proficiency status, free or reduced price lunch andschool attended. We constructed a wide-format data set that captures demographic and attendanceinformation for every student in each year in which he or she is present in Massachusetts publicschools. This file uses information from the longest-attended school in the first calendar year spentin each grade. Attendance ties were broken at random; this affects only 0.007 percent of records.Students classified as special education, limited English proficiency, or eligible for a free or reducedprice lunch in any record within a school-year-grade retain that designation for the entire school-year-grade. The SIMS also includes exit codes for the final time a student is observed in thedatabase. These codes are used to determine high school graduates and transfers.
We measure charter school attendance in 9th or 10th grade. A student is coded as attendinga charter in his or her 9th or 10th-grade year when there is any SIMS record reporting charterattendance in that year. Students who attend more than one charter school within a year areassigned to the charter they attended longest.
MCAS Data
We use MCAS data from the 2001-2002 school year through the 2011-2012 school year. Eachobservation in the MCAS database corresponds to a students test results in a particular grade andyear. The MCAS outcomes of interest are math and English Language Arts (ELA) tests in grade10. We also use baseline tests taken prior to charter application, which are from 4th grade or 8thgrade depending on a students application grade. The raw test score variables are standardized tohave mean zero and standard deviation one within a subject-grade-year in Massachusetts. We alsomake use of scaled scores, which are used to determine whether students meet MCAS thresholds,which are Needs Improvement, Proficient, and Advanced. Unless otherwise noted, we only use thefirst test taken in a particular subject and grade.
AP and SAT Data
We use AP and SAT data files provided to the Massachusetts Department of Elementary andSecondary Education by College Board. The AP and SAT files include scores on all AP exams andSAT tests for graduation cohorts 2007 and 2012; for student who took the SAT more than once,the file includes only the score for the most recent exam. The AP and SAT files also include SASIDidentifiers, which are used to merge these outcomes with the SIMS database.
GED Data
Information on GED test-taking is provided by the Massachusetts Department of Elementaryand Secondary Education’s GED Office. This data includes testing dates and outcomes (pass
43

or fail) for students taking tests from 2002 to 2010. The GED information is merged to the SIMSadministrative database by first, middle, and last name, and birth date. This procedure matched70 percent of GED tests to records in the SIMS database.
NSC Data
Data on college outcomes comes from the National Student Clearinghouse (NSC) database, whichcaptures enrollment for 94% of undergraduates in Massachusetts. We combine information fromthree separate searches of the NSC database:
• A 2010 search for all students in the SIMS database between 2002 and 2009 with projectedgraduation years earlier than 2014, assuming normal academic progress from the last observedgrade and year (not restricted to students who graduated high school);
• A 2011 search of students who graduated from Massachusetts public high schools in the classof 2010;
• A 2012 search of all students who graduated from Massachusetts public high schools in theclasses of 2003 through 2010;
• A 2013 search of students who graduated from Massachusetts public high schools in the classesof 2003 through 2012.
All students in our charter applicant sample were included in the 2010 NSC search, andMassachusetts high school graduates were included in multiple searches. College types are codedusing the first attended college after the last date a student is observed in the SIMS. NSC searcheswere conducted using criteria like name and date of birth; the NSC files also include SASIDs, whichare used to merge the college outcomes with the SIMS database.
Matching Data Sets
The MCAS, AP, SAT and NSC data files are merged to the master SIMS data file using the uniqueSASID identifier. The lottery records do not include SASIDs; these records are matched manuallyto the SIMS by name, application year and application grade. In some cases, this procedure did notproduce a unique match. We accepted some matches based on fewer criteria where the informationon grade, year and town of residence seemed to make sense.
Our matching procedure successfully located most applicants in the SIMS database. The sixthrow of Panel A of Table A1 reports the number of applicant records matched to the SIMS in eachapplicant cohort. The overall match rate across all cohorts was 94 percent (8,342/8,851).
Once matched to the SIMS, each student is associated with a unique SASID; at this point, wecan therefore determine which students applied to multiple schools in our lottery sample. Followingthe match, we reshape the lottery data set to contain a single record for each student. If studentsapplied in more than one year, we keep only records associated with the earliest year of application.Our lottery analysis also excludes students who did not attend a Boston Public Schools (BPS) schoolat baseline, as students applying from private schools have lower follow-up rates. This restrictioneliminates 22 percent of charter applicants. Of the remaining 4,700 charter applicants, 3,671 (78percent) contribute a score to our MCAS analysis.
44

Projected Senior Year 2006 2007 2008 2009 2010 2011 2012 2013 AllTotal number of records 600 450 940 883 1117 1533 1753 1980 9256Excluding disqualified applicants 600 450 940 883 1117 1530 1753 1968 9241Excluding late applicants 590 446 930 880 1117 1530 1733 1968 9194Excluding applicants from outside of area 590 446 930 880 1114 1529 1733 1950 9172Excluding siblings 570 437 905 864 1101 1482 1642 1850 8851Excluding records not matched to the SIMS 509 419 858 816 1055 1395 1547 1743 8342Reshaping to one record per student-year 437 419 632 594 799 1025 1100 1273 6279Excluding repeat applications 437 419 629 589 778 1004 1028 1164 6048In Boston schools at baseline 289 337 511 481 606 849 761 866 4700Excluding applicants without 10th-grade ELA 232 267 415 378 482 664 570 663 3671
Application Year/School Boston PreparatoryAcademy of Pacific Rim
Boston Collegiate
City on a Hill Codman Academy Match
6 6 5 9 9 92002 Ever Yes Not Oversubscribed Yes
Initial Yes Yes Yes2003 Ever Yes Yes
Initial Yes Yes2004 Ever Yes Not Oversubscribed Not Oversubscribed Yes
Initial Yes Yes Yes Yes2005 Ever Not Oversubscribed Yes Yes Yes Yes
Initial Yes Yes Yes Yes Yes2006 Ever Yes Yes Yes Yes
Initial Yes Yes Yes Yes2007 Ever Yes Yes
Initial Yes Yes2008 Ever Not Oversubscribed Yes Yes
Initial Yes Yes Yes2009 Ever Yes Yes Yes
Initial Yes Yes YesN 208 178 265 1889 148 2330
Incomplete Records
Incomplete Records
No Records
Entry grade
Table A1: Lottery RecordsPanel A: Lottery Records
Notes: Panel A summarizes the sample restrictions imposed for the lottery analysis. Disqualified applications are duplicate records and applications to the wrong grade. In Panel B, "Not Oversubscribed" indicates that every applicant received an offer in the relevant cohort. "Yes" means that lottery records with non-missing information on ever offer and initial offer were available, and that some applicants did not get offers. "Incomplete Records" indicates schools and years for which lottery records are inadequate to allow reliable coding of initial or ever offers. The last row shows the number of applicants to each school in the lottery sample excluding applicants without 10th-grade ELA (N = 3,671). Cohorts are too young for follow-up if they don't generate AP, SAT, high school graduation, or college-going outcomes in time for our study. For City on a Hill 2009 and Match 2008 applicants, we impute initial offer using 2008 City on a Hill and 2007 Match initial offer cutoffs. Starting in 2006, Academy of Pacific Rim has operating grades from 5 to 12.
Panel B: Comparison of Ever Offer and Initial Offer Records by Schools and Cohorts
Not Open
Not Open
Incomplete Records
No Records
No Records
No Records
Too Young for Follow-up
No Records No Records
No Records
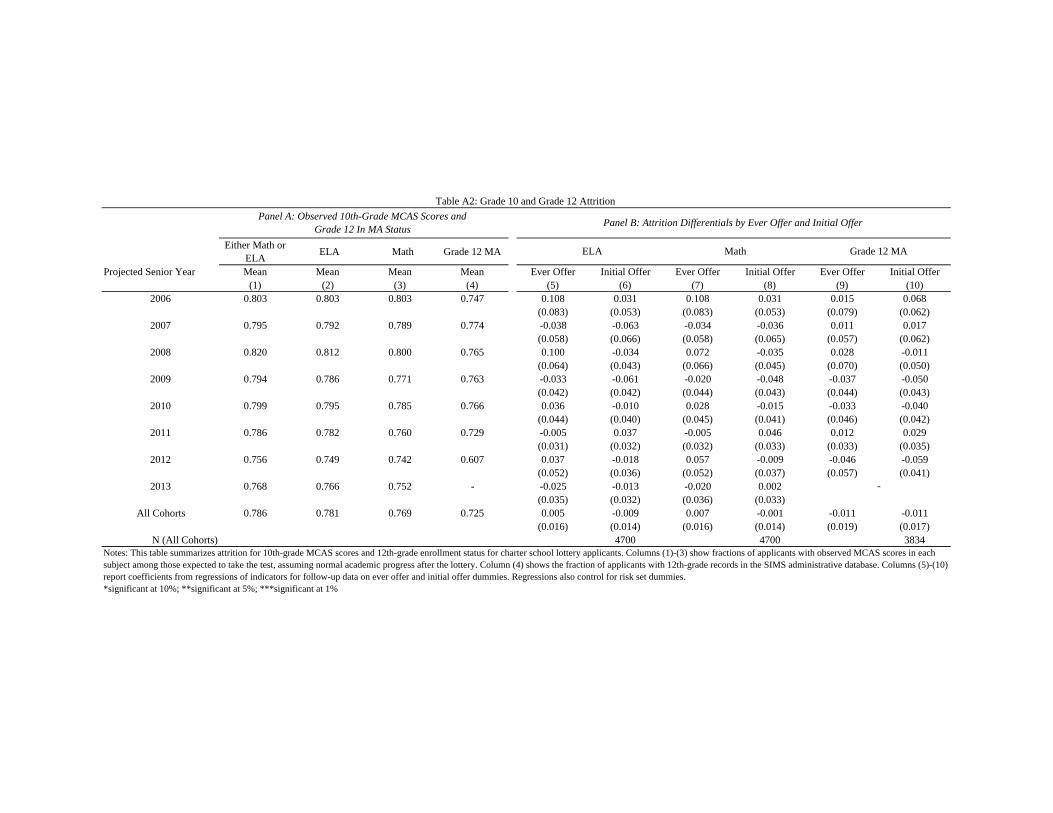
Either Math or ELA
ELA Math Grade 12 MA
Projected Senior Year Mean Mean Mean Mean Ever Offer Initial Offer Ever Offer Initial Offer Ever Offer Initial Offer (1) (2) (3) (4) (5) (6) (7) (8) (9) (10)
2006 0.803 0.803 0.803 0.747 0.108 0.031 0.108 0.031 0.015 0.068(0.083) (0.053) (0.083) (0.053) (0.079) (0.062)
2007 0.795 0.792 0.789 0.774 -0.038 -0.063 -0.034 -0.036 0.011 0.017(0.058) (0.066) (0.058) (0.065) (0.057) (0.062)
2008 0.820 0.812 0.800 0.765 0.100 -0.034 0.072 -0.035 0.028 -0.011(0.064) (0.043) (0.066) (0.045) (0.070) (0.050)
2009 0.794 0.786 0.771 0.763 -0.033 -0.061 -0.020 -0.048 -0.037 -0.050(0.042) (0.042) (0.044) (0.043) (0.044) (0.043)
2010 0.799 0.795 0.785 0.766 0.036 -0.010 0.028 -0.015 -0.033 -0.040(0.044) (0.040) (0.045) (0.041) (0.046) (0.042)
2011 0.786 0.782 0.760 0.729 -0.005 0.037 -0.005 0.046 0.012 0.029(0.031) (0.032) (0.032) (0.033) (0.033) (0.035)
2012 0.756 0.749 0.742 0.607 0.037 -0.018 0.057 -0.009 -0.046 -0.059(0.052) (0.036) (0.052) (0.037) (0.057) (0.041)
2013 0.768 0.766 0.752 - -0.025 -0.013 -0.020 0.002(0.035) (0.032) (0.036) (0.033)
All Cohorts 0.786 0.781 0.769 0.725 0.005 -0.009 0.007 -0.001 -0.011 -0.011(0.016) (0.014) (0.016) (0.014) (0.019) (0.017)
N (All Cohorts) 4700 4700 3834
Table A2: Grade 10 and Grade 12 Attrition
Panel B: Attrition Differentials by Ever Offer and Initial Offer
Notes: This table summarizes attrition for 10th-grade MCAS scores and 12th-grade enrollment status for charter school lottery applicants. Columns (1)-(3) show fractions of applicants with observed MCAS scores in each subject among those expected to take the test, assuming normal academic progress after the lottery. Column (4) shows the fraction of applicants with 12th-grade records in the SIMS administrative database. Columns (5)-(10) report coefficients from regressions of indicators for follow-up data on ever offer and initial offer dummies. Regressions also control for risk set dummies. *significant at 10%; **significant at 5%; ***significant at 1%
ELA Math Grade 12 MA
Panel A: Observed 10th-Grade MCAS Scores and Grade 12 In MA Status
-

Excl. School 1 Excl. School 2 Excl. School 3 Excl. School 4 Excl. School 5 Excl. School 6 All SchoolsEffect Effect Effect Effect Effect Effect Effect
(1) (2) (3) (4) (5) (6) (7)
Standardized ELA 0.398*** 0.357*** 0.401*** 0.416*** 0.392*** 0.409*** 0.411***(0.114) (0.136) (0.107) (0.105) (0.109) (0.157) (0.104)
Standardized Math 0.565*** 0.701*** 0.532*** 0.556*** 0.607*** 0.479** 0.569***(0.131) (0.159) (0.122) (0.121) (0.121) (0.189) (0.120)
Took SAT 0.018 0.077 0.024 0.022 0.042 0.009 0.033(0.083) (0.095) (0.077) (0.079) (0.080) (0.127) (0.078)
SAT Composite (2400) 95.6** 183.2*** 96.9** 99.6** 95.7** 66.6 102.8**(45.9) (56.0) (42.8) (43.6) (44.6) (64.1) (42.9)
Took any AP 0.316*** 0.412*** 0.279*** 0.291*** 0.295*** 0.085 0.287***(0.074) (0.103) (0.074) (0.073) (0.075) (0.137) (0.073)
Score 3 or Higher, any AP 0.089* 0.184*** 0.091* 0.093* 0.085 0.021 0.096*(0.052) (0.059) (0.052) (0.052) (0.054) (0.066) (0.052)
Four-year Graduation -0.128** -0.034 -0.129** -0.133** -0.117* -0.190* -0.125**(0.065) (0.089) (0.063) (0.063) (0.065) (0.100) (0.063)
Five-year Graduation -0.010 -0.045 0.001 0.004 0.000 0.088 0.000(0.068) (0.087) (0.065) (0.065) (0.065) (0.105) (0.065)
Any 0.102 0.045 0.115 0.115 0.115 0.305* 0.115(0.087) (0.108) (0.084) (0.087) (0.084) (0.169) (0.084)
Four-year 0.167** 0.098 0.173** 0.169** 0.173** 0.235 0.173**(0.081) (0.106) (0.079) (0.081) (0.079) (0.150) (0.079)
Panel E: College Enrollment Within 18 Months
Notes: This table reports 2SLS estimates of the effects of charter attendance, excluding data from each of the six schools in the sample at a time. See Table 1 notes for outcome sample descriptions and Table 3 notes for detailed regression specifications. Sample size is excluded to avoid identifying individual schools.*significant at 10%; **significant at 5%; ***significant at 1%
Panel A: 10th- Grade MCAS
Table A3: Lottery Estimates of Effects Excluding Each School
Panel D: High School Graduation Outcomes
Panel C: AP Outcomes
Panel B: SAT Outcomes
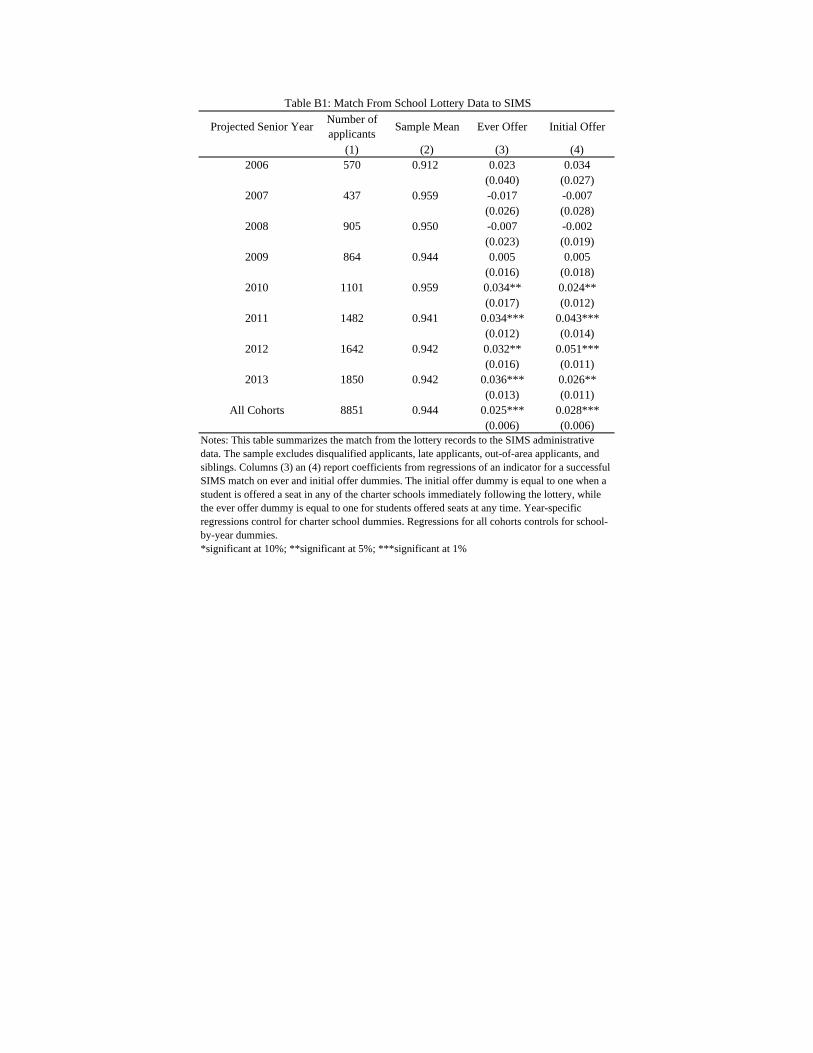
Projected Senior YearNumber of applicants
Sample Mean Ever Offer Initial Offer
(1) (2) (3) (4)2006 570 0.912 0.023 0.034
(0.040) (0.027)2007 437 0.959 -0.017 -0.007
(0.026) (0.028)2008 905 0.950 -0.007 -0.002
(0.023) (0.019)2009 864 0.944 0.005 0.005
(0.016) (0.018)2010 1101 0.959 0.034** 0.024**
(0.017) (0.012)2011 1482 0.941 0.034*** 0.043***
(0.012) (0.014)2012 1642 0.942 0.032** 0.051***
(0.016) (0.011)2013 1850 0.942 0.036*** 0.026**
(0.013) (0.011)All Cohorts 8851 0.944 0.025*** 0.028***
(0.006) (0.006)
Table B1: Match From School Lottery Data to SIMS
Notes: This table summarizes the match from the lottery records to the SIMS administrative data. The sample excludes disqualified applicants, late applicants, out-of-area applicants, and siblings. Columns (3) an (4) report coefficients from regressions of an indicator for a successful SIMS match on ever and initial offer dummies. The initial offer dummy is equal to one when a student is offered a seat in any of the charter schools immediately following the lottery, while the ever offer dummy is equal to one for students offered seats at any time. Year-specific regressions control for charter school dummies. Regressions for all cohorts controls for school-by-year dummies.*significant at 10%; **significant at 5%; ***significant at 1%

AllPre-2009 Post-2010
Effect Effect EffectOutcomes (1) (2) (3)
Standardized ELA 0.111 0.533*** 0.411***(0.196) (0.117) (0.104)1292 2379 3671
Standardized Math 0.450** 0.618*** 0.569***(0.210) (0.141) (0.120)
N 1278 2337 3615
Took SAT 0.153 -0.015 0.033(0.140) (0.094) (0.078)
N 1134 1823 2957
SAT Composite (2400) 61.9 123.8*** 102.8**(90.5) (44.8) (42.9)
N 722 1175 1897
Took any AP 0.345*** 0.258*** 0.287***(0.133) (0.095) (0.073)
Score 3 or Higher, any AP 0.137 0.079 0.096*(0.096) (0.063) (0.052)
N 1134 1823 2957
Four-year Graduation 0.002 -0.201*** -0.125**(0.116) (0.070) (0.063)
N 1382 1823 3205
Five-year Graduation 0.072 -0.050 0.000(0.099) (0.085) (0.065)
N 1382 1217 2599
Any 0.090 0.047 0.063(0.120) (0.084) (0.072)
Four-year 0.207* 0.158* 0.170**(0.114) (0.085) (0.070)
N 1382 1217 2599Notes: This table reports 2SLS estimates of the effects of Boston charter attendance in two subsamples split by projected senior year 2009. See Table 3 notes for detailed regression specifications. Means are for non-charter attendees.*significant at 10%; **significant at 5%; ***significant at 1%
Table B2: Lottery Estimates of Effects by Lottery CohortSubsamples by Projected Senior Year
Panel E: College Enrollment Within 18 Months
Panel D: High School Graduation Outcomes
Panel B: SAT Outcomes
Panel C: AP Outcomes
Panel A: 10th- Grade MCAS

Second StageEver Offer Initial Offer Effect
Subject (1) (2) (3)Standardized ELA 0.051* -0.010 2.840**
(0.026) (0.019) (1.325)N
First-stage F
Standardized Math 0.067** -0.020 2.502**(0.027) (0.020) (1.009)
NFirst-stage F
First StageTable B3: Peer Quality as the Endogenous Variable
Notes: This table reports first and second stage estimates of the effects of peer quality in 10th grade on MCAS test scores. The sample includes students projected to graduate in 2006 through 2013. The endogenous variable is peer quality in 10th-grade measured as the average baseline ELA (or math) scores for the peers in grade 10. The instruments are ever offer and initial offer dummies. Initial offer is equal to one when a student is offered a seat in any of the charter schools immediately following the lottery, while ever offer is equal to one for students offered seats at any time.All 2SLS regressions control for risk sets, 10th grade calendar year dummies, race, sex, special education, limited English proficiency, subsidized lunch status, and a female by minority dummy. Standard errors are clustered at the school-year level in 10th grade.*significant at 10%; **significant at 5%; ***significant at 1%
3.23615
1.93660