standard methods for research on apis mellifera gut symbionts · standard methods for research on...
TRANSCRIPT

REVIEW ARTICLE
Standard methods for research on Apis mellifera
gut symbionts
Philipp Engel1†, Rosalind R James2*, Ryuichi Koga1,4, Waldan K Kwong1, Quinn S McFrederick3
and Nancy A Moran1 1Ecology and Evolutionary Biology, Yale University, New Haven, CT, USA. 2USDA-ARS Pollinating Insects Research Unit, Logan, UT, USA. 3Integrative Biology, University of Texas, Austin, TX, USA. 4Bioproduction Research Institute, National Institute of Advanced Industrial Science and Technology, Tsukuba, Ibaraki 305-8566, Japan. Received 1 March 2013, accepted subject to revision 11 April 2013, accepted for publication 20 May 2013. †All authors are in alphabetical order.
*Corresponding author: Email: [email protected]
Summary
Gut microbes can play an important role in digestion, disease resistance, and the general health of animals, but little is known about the
biology of gut symbionts in Apis mellifera. As part of the BEEBOOK series describing honey bee research methods, we provide standard
protocols for studying gut symbionts. We describe non-culture-based approaches based on Next Generation Sequencing (NGS), methodology
that has greatly improved our ability to identify the microbial communities associated with honey bees. We also describe Fluorescent In Situ
Hybridization (FISH) microscopy, which allows a visual examination of the microenvironments where particular microbes occur. Culturing
methods are also described, as they allow the researcher to isolate particular bacteria of interest for further study or gene identification, and
enable the assignment of particular functions to particular gut community members. We hope these methods will help others advance the
state of knowledge regarding bee gut symbionts and the role they play in honey bee health.
Métodos estandar para investigar simbiontes intestinales de
Apis mellifera
Resumen
Los microbios intestinales pueden jugar un papel importante en la digestión, la resistencia a las enfermedades, y la salud general de los
animales, pero se conoce poco sobre la biología de los simbiontes intestinales en Apis mellifera. Como parte de la serie BEEBOOK que
describe los métodos de investigación en la abeja, ofrecemos protocolos estándar para el estudio de simbiontes intestinales. Se describen
métodos no basados en cultivos sino sobre la base de la secuenciación de nueva generación (NGS según sus siglas en inglés), metodología
que ha mejorado en gran medida nuestra capacidad para identificar las comunidades microbianas asociadas con la abeja de la miel. También
describimos la microscopía de hibridación in situ fluorescente (FISH), la cual permite un examen visual de los microambientes donde viven
microbios particulares. También se describen métodos de cultivo, que permiten al investigador aislar bacterias de interés particular para
posteriores estudios o para la identificación de genes, y permitir asignar funciones particulares a determinados miembros de la comunidad
intestinal. Esperamos que estos métodos ayudarán a otros a avanzar en el estado del conocimiento sobre simbiontes intestinales de abejas y
el papel que desempeñan en la salud de las abejas de la miel.
Journal of Apicultural Research 52(4): (2013) © IBRA 2013 DOI 10.3896/IBRA.1.52.4.07
Footnote: Please cite this paper as: ENGEL, P; JAMES, R R; KOGA, R; KWONG, W K; MCFREDERICK, Q S; MORAN, N A (2013) Standard methods for research on Apis mellifera gut symbionts. In V Dietemann; J D Ellis; P Neumann (Eds) The COLOSS BEEBOOK, Volume I: standard methods for Apis mellifera research.
Journal of Apicultural Research 52(4): http://dx.doi.org/10.3896/IBRA.1.52.4.07
2 Engel et al.
西方蜜蜂肠道共生体研究的标准方法
摘要
肠道微生物在动物的消化、抗病性和常规健康中起重要作用。然而,目前对于西方蜜蜂肠道共生体的生物学知之甚少。作为BEEBOOK蜜
蜂研究方法系列的一部分,我们为研究肠道共生体提供了标准方案。介绍了基于新一代测序(NGS)而免于生物培养的研究方法,该方法极大地
提高了我们鉴定蜜蜂相关微生物群落的能力。描述了荧光原位杂交(FISH)显微技术,该技术实现了对一些特殊微生物出现的微环境进行目视
检测。同时,也描述了一些培养方法,这些方法使得研究人员可分离出特定感兴趣的细菌,以供进一步研究或进行基因鉴定,并使得将特定的功
能与特定肠道菌群相联系成为可能。我们希望这些方法能帮助大家提升对于蜜蜂肠道共生体及其在蜜蜂健康方面所起作用的了解。
Keywords: COLOSS, BEEBOOK, fluorescent in situ hybridization, gut symbionts, methods, microbial culture, next generation sequencing, honey bee
1. Introduction
In honey bees, the gut is the primary location for digestion and food
processing, as well as the site of infection for a variety of pathogens,
including Paenibacillus larvae (de Graaf et al., 2013), Ascosphaera
apis (Jensen et al., 2013) Nosema ceranae (Fries et al., 2013), and
probably many of the honey bee viruses (de Miranda et al., 2013).
Biologists have increasingly recognized that gut microorganisms play a
beneficial role in many aspects of the health of animals, animals as
The COLOSS BEEBOOK: gut symbionts 3
diverse as mammals and insects. The role of symbiotic gut microbes
in digestion, resistance to infectious disease, and the general health of
honey bees, both individual bees and the colony at large, is an
intriguing area of research where much is still to be learned. In this
chapter we present a number of basic protocols for investigating the
microbial communities found in honey bee guts.
Traditional microbiological studies, from the time of Pasteur, have
relied on the axenic (pure) isolation of individual microbes, which
were then characterized based on their metabolic, biochemical, and
Table of Contents Page No.
1. Introduction 3
2. Bacterial community analysis using next-generation sequencing (NGS)
5
2.1. Extraction, PCR, and sequencing 5
2.1.1. Extraction of bacterial community DNA 5
2.1.2. Primer choice and 16S rRNA regions
6
2.1.3. PCR conditions 6
2.1.4. Library construction 6
2.1.5. Sequencing 7
2.2. Quality filtering and data analysis 7
2.2.1. Quality filtering 7
2.2.2. Identifying operational taxonomic units (OTUs) 7
2.2.3. Taxonomic assignment of OTUs 8
2.2.4. Alpha diversity 8
2.2.5. Exploratory techniques: beta diversity 9
2.2.6. Testing for significant differences in communities 9
3. Fluorescent in situ hybridization (FISH) for image analysis of specific microorganisms in the digestive tract
10
3.1. Designing probes 10
3.1.1. Probe sequence 10
3.1.2. Selecting fluorochromes 10
3.2. Preserving insect materials for FISH 11
3.3. Fixation, paraffin embedding, sectioning and mounting
11
3.3.1. Fixing honey bee gut samples from fresh bees 11
3.3.2. Fixing honey bee gut samples from preserved bees
12
3.3.3. Bleaching samples to reduce autofluorescence in the gut tissues
12
3.3.4. Dehydration, clearing, paraffin infiltration and embedding
12
3.3.5. Sectioning and mounting 12
3.4. Hybridization 13
3.4.1. Hybridization procedures 13
Page No.
3.4.2. FISH controls 13
3.4.3. Combining probes
13
3.4.4. Image acquisition and adjustments 13
3.5. Concluding remarks about FISH 14
4. Culture conditions for the dominant members of the bee gut microbiota
14
4.1. Genus Snodgrassella 14
4.1.1. Optimal growth conditions 14
4.1.2. Microbe characteristics 14
4.2. Genus Gilliamella 15
4.2.1. Optimal growth conditions 15
4.2.2. Gilliamella characteristics 15
4.3. Genus Frischella 15
4.3.1. Optimal growth conditions 15
4.3.2. Genus Frischella characteristics 15
4.4. Genus Lactobacillus 15
4.4.1. Optimal growth conditions
15
4.4.2. Lactobacillus characteristics 15
4.5. Genus Bifidobacterium 16
4.5.1. Optimal growth conditions 16
4.5.2. Bifidobacterium characteristics 16
4.6. Alpha-1 bacteria
16
4.6.1. Optimal growth conditions 16
4.6.2. Alpha-1 characteristics
16
4.7. Other bacteria
16
4.8. Preservation of bacterial cultures
16
5. Conclusions and outlook 17
6. Acknowledgements 18
7. References 18

4 Engel et al.
morphological characteristics. These culture-based studies remain the
foundation of microbiology. However, for most environmental
samples, estimates of microbial density based on microscopic counts
of cell numbers tend to be far higher than estimates based on colony-
forming units on culture plates (Staley and Konopka, 1985). Furthermore,
it has long been known that many microbes cannot be cultured in the
laboratory, or require specialized conditions yet to be discovered, but
no real solution to this problem existed for environmental microbiology
until molecular sequencing technology became available. Using
sequencing techniques, Rappé and Giovannoni (2003) showed that
the microorganisms readily cultured from a given environment are
only a tiny subset of the species actually living there. Typically, only
about 1% of bacteria from a given habitat will grow in culture (Staley
and Konopka, 1985). With attention to specific aspects of the culture
media and atmospheric conditions, more organisms might grow, but
consistently, many organisms sampled from most environments do
not appear in lab cultures (Stevenson et al., 2004). Therefore, good
estimates of "what is really there" in microbiology depend on non-
culture-based studies. Non-culture-based studies may be followed by
culturing efforts so that the microbes of interest can be isolated, and
thus better described chemically and morphologically, and to conduct
experiments with them. In addition, molecular methods such as
fluorescent in situ hybridization (FISH) can be used to locate specific
microorganisms in their precise locations within a sample; for
example, FISH can be used to identify where certain microbes occur
in the honey bee gut, or where infection takes place for a pathogen.
Numerous researchers have performed studies on organisms
cultured from bee guts and the hive, documenting a variety of
metabolic and functional activities (Gilliam and Prest, 1972, 1987;
Gilliam and Valentine, 1974; Gilliam et al., 1974; Gilliam, 1978; Evans
and Armstrong, 2006). However, non-culture-based surveys have
presented a contrasting view of the dominant members of the honey
bee gut microbiota, revealing that readily cultured, fully aerobic
organisms comprise only a small portion of the diversity of microbes
present. A set of eight major taxa dominate the honey bee gut
environment, and these fall within the Gammaproteobacteria,
Betaproteobacteria, Alphaproteobacteria, Lactobacillales, and
Actinomycetes. These eight bacterial taxa, which correspond to the
typical definition of bacterial species, have been found in A. mellifera
worldwide (Jeyaprakash et al., 2003; Mohr and Tebbe, 2006;
Babendreier et al., 2007; Cox-Foster et al., 2007; Martinson et al.,
2011; Cornman et al., 2012; Engel et al., 2012; Li et al., 2012;
Martinson et al., 2012; Moran et al., 2012; Sabree et al., 2012; Tian
et al., 2012). Close relatives of some of these taxa have been found in
other Apis species in Asia (Ahn et al., 2012; Li et al., 2012) and in
many species of bumble bees (Bombus) (Koch and Schmid-Hempel,
2011, 2012; Koch et al., 2012, 2013). These surveys used a variety of
sequencing methodologies, yet consistently retrieved a similar set
of organisms.
The primary molecule currently used for surveying microbial diversity
and verifying taxonomic identities is the small subunit ribosomal RNA,
which is referred to as the 16S rRNA in Bacteria and Archaea, and the
18S rRNA in Eukaryota. This molecule is present in all cells and
provides a molecular label for a particular species or taxon, and can
be compared against public databases to determine whether a
sampled sequence corresponds to previously studied organisms
(McDonald et al., 2012). The microbial community in a bee gut can be
determined by extracting the DNA, using targeted PCR to amplify the
bacterial rRNA genes present, followed by high throughput sequencing
technologies such as Illumina, 454 or others (Sogin et al., 2006;
Tringe and Hugenholtz, 2008), often called next-generation
sequencing (NGS) technologies. Bioinformatic searches are then used
to compare the resulting sequences to those previously identified and
stored in publically available databases. We present protocols for
these methods.
Sequencing technologies are becoming increasingly cost-effective
while also yielding improved data quality, primarily through an
increase in the length of the sequencing read. Longer and more
accurate sequences give higher quality information for identifying
microbial taxa. Because these technologies are evolving rapidly, we
give a generalized overview for the methods, recognizing that details
of techniques will change as these technologies, and the methods for
analysing the results, evolve. Our recommendations are for specific
techniques that are likely to remain static for some time, such as DNA
extraction, PCR, and a general approach for analysing microbial
communities.
The 16S rRNA can also be used to design in situ hybridization
probes. Many ribosomes are present in the cytoplasm of each cell,
and probes corresponding to diagnostic regions of the rRNA gene can
be used to selectively label and visualize specific cells containing the
corresponding RNA sequences. In addition, the 16S rRNA can be used
to identify bacteria isolated using culture-based methods. DNA can be
extracted from isolated colonies of the bacteria, amplified using
selective PCR, followed by sequencing. Again, a bioinformatic search
can then be used to compare the unknown sequence to those
previously identified and stored in publically available databases.
Metagenomics includes several approaches useful for studying
functions of gut biota, but is not included among our listed protocols.
The original use of the word "metagenomics" referred to cloning
relatively large fragments of DNA from community DNA samples, and
then attempting to screen these cloned fragments for functional
activities (Handelsman, 2004). A primary limitation of this approach is
that genes underlying many functional activities maybe present but
not expressed, although metagenomics can be an effective method
for detecting certain functions, such as antibiotic resistance (Tian et al.,
2012). Since major members of the bee microbiota can be cultured,
the study of cultured isolates may offer a more robust approach for
finding functional capabilities. Currently, metagenomics generally

refers to the use of deep sequencing of total genomic contents of a
microbial community to identify and compare the prevalence of
functional genes, such as those for enzymes associated with cellulose
or pectin degradation (e.g. Warnecke et al., 2007; Brulc et al., 2009;
Engel et al., 2012). Typically, metagenomic sequencing is combined
with a 16S rRNA gene sequencing approach, with the former being
used for inferring functional capabilities, and the latter used to infer
community membership and diversity. The study by Engel et al.
(2012) is the only example to date of using deep sequencing
metagenomics to understand functions of the bee gut microbiota.
Metagenomic methods encompass rapidly evolving approaches to
environmental microbiology. Since standard methodologies are still
under development at this time, these were not included here.
We provide here standard protocols for studying bee gut bacteria,
including NGS methods for surveying bacterial diversity, FISH
microscopy to precisely locate where these microorganisms occur in
the insect gut, and culturing methods for known gut symbionts.
Although we focus on bacteria, our methods can be extended to other
microorganisms and viruses, with appropriate changes in the
oligonucleotide primers used for diversity surveys and FISH.
2. Bacterial community analysis
using next-generation sequencing
(NGS)
Currently, one of the easiest and more cost effective tools available
for characterizing the microbial communities associated with honey
bee guts is sequencing the diversity of the 16S rRNA gene in honey
bee guts using NGS technology. NGS surveys have provided insights
into the composition of bee gut-associated bacterial communities,
symbiont host-specificity, and conditions conducive to the co-evolutionary
dynamics of bees and their associated microbes (Ahn et al., 2012;
Martinson et al., 2012; McFrederick et al., 2012; Moran et al., 2012;
Newton and Roeselers, 2012).
2.1. Extraction, PCR, and sequencing
2.1.1. Extraction of bacterial community DNA
Extraction is the first step towards identifying the microbial
communities present in a sample (Fig. 1). Extraction methods for
diverse bacterial communities must include a method to disrupt the
cell walls of spores and the more recalcitrant bacteria (Marmur, 1961).
We recommend using a method that includes bead-beating because
that is one of the best methods for cell disruption, and it has been the
method of choice for recent bee-associated NGS surveys (Mattila et al.,
2012; McFrederick et al., 2012; Moran et al., 2012).
1. First determine what you consider to be your sample: the
entire gut or part of the gut. It is very important to work in a
clean, sterile environment using sterile materials and tools.
Unless you intend to include the microbial community
occurring on the insect cuticle, it is imperative to disinfect and
clean the surface of the bees before dissections. Microbes and
their nucleic acids can be removed from bee cuticle using a
1% aqueous solution of chlorine (using either sodium dichloro
-s-triazinetrione-dihydrate (swimming pool or spa chlorine) or
sodium hyperchlorite (bleach)). Soak each bee for at least 2
min but not more than 7 min., then rinse three times in
sterile, purified water. This can be done in a 24 well plate on
a shaker table, or in a series of 1.5 ml disposable centrifuge
tubes with gentle mixing on a vortex mixer. It is important
that all of the chlorine be removed from the bees prior to
dissection because chlorine degrades DNA and thus can inhibit
the PCR reactions.
2. Once you obtain your sample, place it in a sterile 2 ml
microcentrifuge tube with a sterile 5 mm stainless steel bead
(QIAGEN, Valencia, CA), 500 μl of 0.1 mm glass beads
(Scientific Industries, Inc.;Bohemia, NY, USA), and 500 μl RLT
buffer (QIAGEN; Valencia, CA, USA) with 10 μl of β-
mercaptoethanol per ml buffer. Note that β-mercaptoethanol
(including the used buffer) must be handled as hazardous
waste.
3. Run in tissue lyser or bead beater at 30 Hz for 5 min.
4. Centrifuge samples briefly to separate the beads and the
buffer. If a foam layer has developed, it can be eliminated
with a longer centrifugation period (several minutes at 5000
rpm at 5°C).
5. In a new tube add 100 μl of 100% ethanol and 100 μl of
supernatant (200 μl of 100% ethanol and 200 μl of
supernatant may be used for small samples, but it is
important to treat all samples within a study the same so that
the data are comparable). Gently mix using a vortex mixer.
Centrifuge briefly, if needed, to consolidate the sample, which
may get spread around in the tube.
6. For DNA recovery, apply the sample from step 5 to a QIAamp
mini spin column and follow the tissue protocol of QIAamp
DNA minikit (QIAGEN, Valencia, CA) (starting at the step
where the supernatant is applied to the spin column, Step 7
on page 35 in the handbook published 4/2010).
7. Elute DNA in 30 μl of sterilized nanopure water, or in the
provided QIAGEN buffer AE if long-term storage at -20 is desired.
8. Quantify DNA and adjust to a standard concentration across
all samples. We have used 20 ng/μl, but higher concentrations
may be desirable with small samples.
5 The COLOSS BEEBOOK: gut symbionts
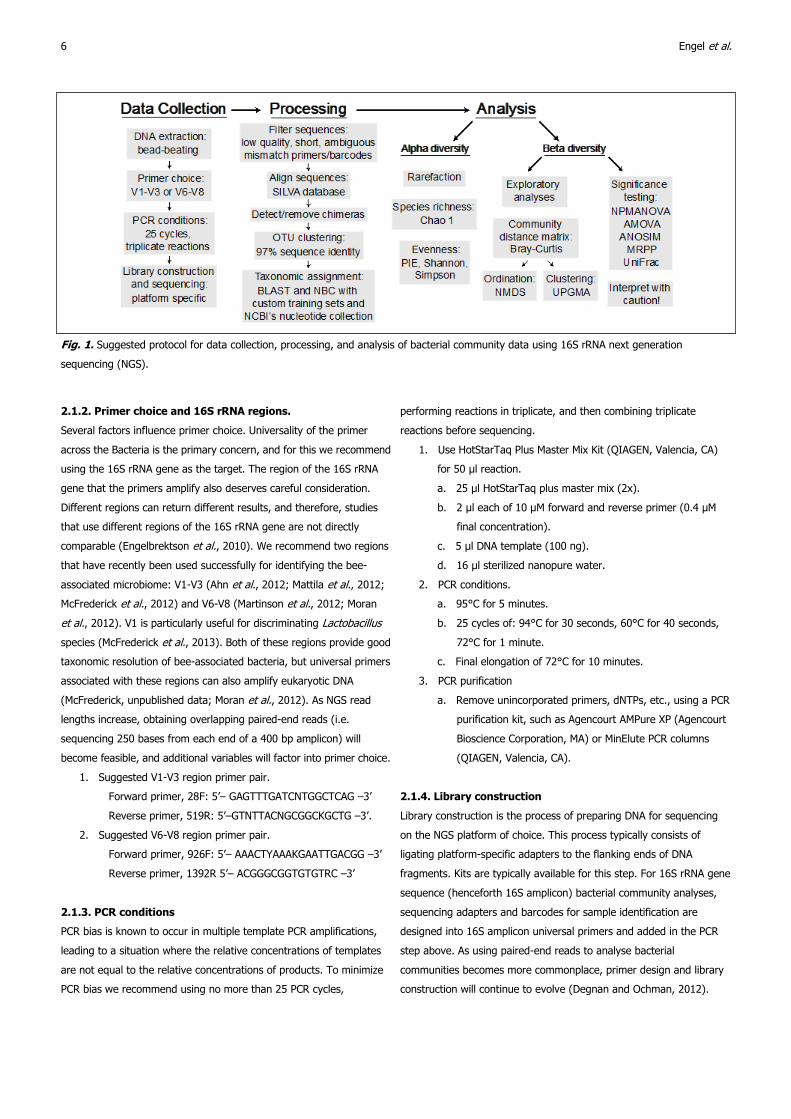
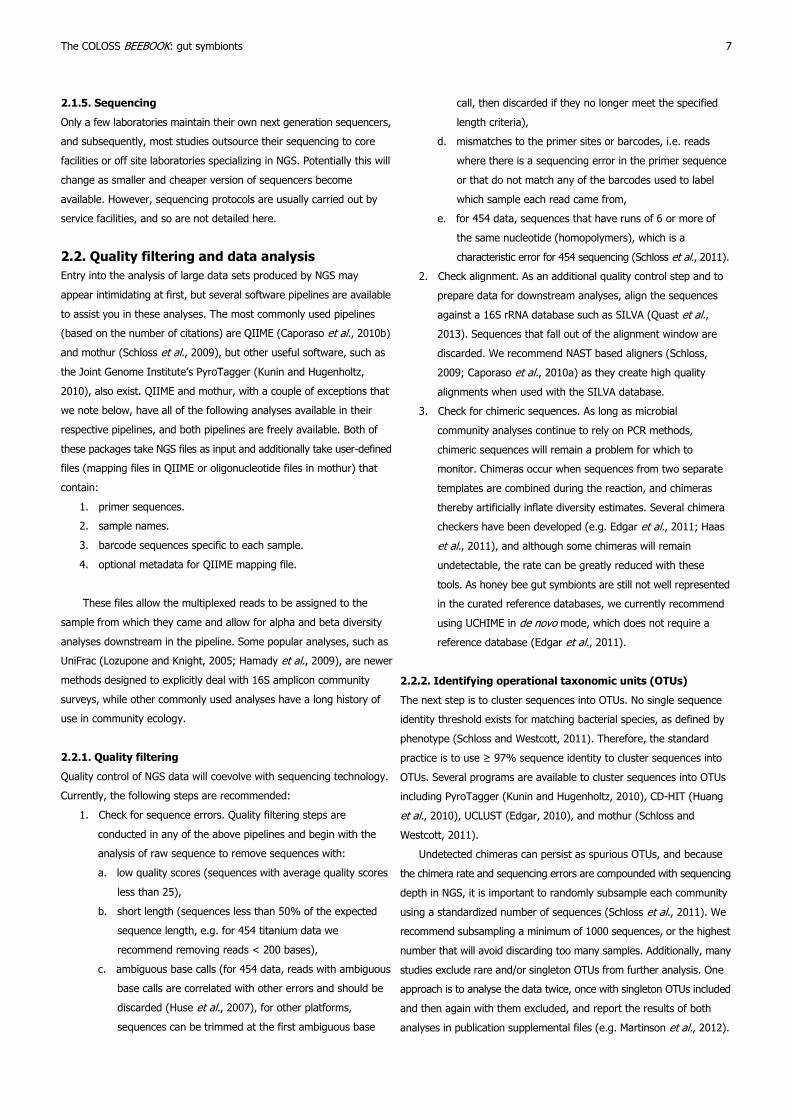
Fig. 1. Suggested protocol for data collection, processing, and analysis of bacterial community data using 16S rRNA next generation
sequencing (NGS).
2.1.2. Primer choice and 16S rRNA regions.
Several factors influence primer choice. Universality of the primer
across the Bacteria is the primary concern, and for this we recommend
using the 16S rRNA gene as the target. The region of the 16S rRNA
gene that the primers amplify also deserves careful consideration.
Different regions can return different results, and therefore, studies
that use different regions of the 16S rRNA gene are not directly
comparable (Engelbrektson et al., 2010). We recommend two regions
that have recently been used successfully for identifying the bee-
associated microbiome: V1-V3 (Ahn et al., 2012; Mattila et al., 2012;
McFrederick et al., 2012) and V6-V8 (Martinson et al., 2012; Moran
et al., 2012). V1 is particularly useful for discriminating Lactobacillus
species (McFrederick et al., 2013). Both of these regions provide good
taxonomic resolution of bee-associated bacteria, but universal primers
associated with these regions can also amplify eukaryotic DNA
(McFrederick, unpublished data; Moran et al., 2012). As NGS read
lengths increase, obtaining overlapping paired-end reads (i.e.
sequencing 250 bases from each end of a 400 bp amplicon) will
become feasible, and additional variables will factor into primer choice.
1. Suggested V1-V3 region primer pair.
Forward primer, 28F: 5’– GAGTTTGATCNTGGCTCAG –3’
Reverse primer, 519R: 5’–GTNTTACNGCGGCKGCTG –3’.
2. Suggested V6-V8 region primer pair.
Forward primer, 926F: 5’– AAACTYAAAKGAATTGACGG –3’
Reverse primer, 1392R 5’– ACGGGCGGTGTGTRC –3’
2.1.3. PCR conditions
PCR bias is known to occur in multiple template PCR amplifications,
leading to a situation where the relative concentrations of templates
are not equal to the relative concentrations of products. To minimize
PCR bias we recommend using no more than 25 PCR cycles,
6 Engel et al.
performing reactions in triplicate, and then combining triplicate
reactions before sequencing.
1. Use HotStarTaq Plus Master Mix Kit (QIAGEN, Valencia, CA)
for 50 μl reaction.
a. 25 μl HotStarTaq plus master mix (2x).
b. 2 μl each of 10 μM forward and reverse primer (0.4 μM
final concentration).
c. 5 μl DNA template (100 ng).
d. 16 μl sterilized nanopure water.
2. PCR conditions.
a. 95°C for 5 minutes.
b. 25 cycles of: 94°C for 30 seconds, 60°C for 40 seconds,
72°C for 1 minute.
c. Final elongation of 72°C for 10 minutes.
3. PCR purification
a. Remove unincorporated primers, dNTPs, etc., using a PCR
purification kit, such as Agencourt AMPure XP (Agencourt
Bioscience Corporation, MA) or MinElute PCR columns
(QIAGEN, Valencia, CA).
2.1.4. Library construction
Library construction is the process of preparing DNA for sequencing
on the NGS platform of choice. This process typically consists of
ligating platform-specific adapters to the flanking ends of DNA
fragments. Kits are typically available for this step. For 16S rRNA gene
sequence (henceforth 16S amplicon) bacterial community analyses,
sequencing adapters and barcodes for sample identification are
designed into 16S amplicon universal primers and added in the PCR
step above. As using paired-end reads to analyse bacterial
communities becomes more commonplace, primer design and library
construction will continue to evolve (Degnan and Ochman, 2012).
2.1.5. Sequencing
Only a few laboratories maintain their own next generation sequencers,
and subsequently, most studies outsource their sequencing to core
facilities or off site laboratories specializing in NGS. Potentially this will
change as smaller and cheaper version of sequencers become
available. However, sequencing protocols are usually carried out by
service facilities, and so are not detailed here.
2.2. Quality filtering and data analysis
Entry into the analysis of large data sets produced by NGS may
appear intimidating at first, but several software pipelines are available
to assist you in these analyses. The most commonly used pipelines
(based on the number of citations) are QIIME (Caporaso et al., 2010b)
and mothur (Schloss et al., 2009), but other useful software, such as
the Joint Genome Institute’s PyroTagger (Kunin and Hugenholtz,
2010), also exist. QIIME and mothur, with a couple of exceptions that
we note below, have all of the following analyses available in their
respective pipelines, and both pipelines are freely available. Both of
these packages take NGS files as input and additionally take user-defined
files (mapping files in QIIME or oligonucleotide files in mothur) that
contain:
1. primer sequences.
2. sample names.
3. barcode sequences specific to each sample.
4. optional metadata for QIIME mapping file.
These files allow the multiplexed reads to be assigned to the
sample from which they came and allow for alpha and beta diversity
analyses downstream in the pipeline. Some popular analyses, such as
UniFrac (Lozupone and Knight, 2005; Hamady et al., 2009), are newer
methods designed to explicitly deal with 16S amplicon community
surveys, while other commonly used analyses have a long history of
use in community ecology.
2.2.1. Quality filtering
Quality control of NGS data will coevolve with sequencing technology.
Currently, the following steps are recommended:
1. Check for sequence errors. Quality filtering steps are
conducted in any of the above pipelines and begin with the
analysis of raw sequence to remove sequences with:
a. low quality scores (sequences with average quality scores
less than 25),
b. short length (sequences less than 50% of the expected
sequence length, e.g. for 454 titanium data we
recommend removing reads < 200 bases),
c. ambiguous base calls (for 454 data, reads with ambiguous
base calls are correlated with other errors and should be
discarded (Huse et al., 2007), for other platforms,
sequences can be trimmed at the first ambiguous base
The COLOSS BEEBOOK: gut symbionts 7
call, then discarded if they no longer meet the specified
length criteria),
d. mismatches to the primer sites or barcodes, i.e. reads
where there is a sequencing error in the primer sequence
or that do not match any of the barcodes used to label
which sample each read came from,
e. for 454 data, sequences that have runs of 6 or more of
the same nucleotide (homopolymers), which is a
characteristic error for 454 sequencing (Schloss et al., 2011).
2. Check alignment. As an additional quality control step and to
prepare data for downstream analyses, align the sequences
against a 16S rRNA database such as SILVA (Quast et al.,
2013). Sequences that fall out of the alignment window are
discarded. We recommend NAST based aligners (Schloss,
2009; Caporaso et al., 2010a) as they create high quality
alignments when used with the SILVA database.
3. Check for chimeric sequences. As long as microbial
community analyses continue to rely on PCR methods,
chimeric sequences will remain a problem for which to
monitor. Chimeras occur when sequences from two separate
templates are combined during the reaction, and chimeras
thereby artificially inflate diversity estimates. Several chimera
checkers have been developed (e.g. Edgar et al., 2011; Haas
et al., 2011), and although some chimeras will remain
undetectable, the rate can be greatly reduced with these
tools. As honey bee gut symbionts are still not well represented
in the curated reference databases, we currently recommend
using UCHIME in de novo mode, which does not require a
reference database (Edgar et al., 2011).
2.2.2. Identifying operational taxonomic units (OTUs)
The next step is to cluster sequences into OTUs. No single sequence
identity threshold exists for matching bacterial species, as defined by
phenotype (Schloss and Westcott, 2011). Therefore, the standard
practice is to use ≥ 97% sequence identity to cluster sequences into
OTUs. Several programs are available to cluster sequences into OTUs
including PyroTagger (Kunin and Hugenholtz, 2010), CD-HIT (Huang
et al., 2010), UCLUST (Edgar, 2010), and mothur (Schloss and
Westcott, 2011).
Undetected chimeras can persist as spurious OTUs, and because
the chimera rate and sequencing errors are compounded with sequencing
depth in NGS, it is important to randomly subsample each community
using a standardized number of sequences (Schloss et al., 2011). We
recommend subsampling a minimum of 1000 sequences, or the highest
number that will avoid discarding too many samples. Additionally, many
studies exclude rare and/or singleton OTUs from further analysis. One
approach is to analyse the data twice, once with singleton OTUs included
and then again with them excluded, and report the results of both
analyses in publication supplemental files (e.g. Martinson et al., 2012).

2.2.3. Taxonomic assignment of OTUs
The most commonly used software programs for taxonomic assignment
of OTUs are the Ribosomal Database Project’s Naïve Bayesian
Classifier (NBC, (Wang et al., 2007)) and the Basic Local Alignment
Search Tool (BLAST, (Altschul et al., 1990)). The database against
which sequences are compared, however, appears to be more important
than the tool used to assign sequences to taxonomy (Newton and
Roeselers, 2012; Sabree et al., 2012). For example, many of the 16S
rRNA gene sequences from uncultured and undescribed honey bee
gut symbionts have not been incorporated into highly curated databases
such as SILVA and greengenes, and use of these databases may
result in inconsistent assignment of A. mellifera gut symbionts
(Newton and Roeselers, 2012). NBC classifications using custom
training sets that explicitly include representatives of A. mellifera gut
symbionts will obviate such inconsistencies (Newton and Roeselers,
2012) as will searches against the complete nucleotide collection at
NCBI (Sabree et al., 2012). Two of the A. mellifera core gut symbionts,
Gillamella apicola and Snodgrasella alvi, have recently been cultured
and formally described (Kwong and Moran, 2013), and are presently
represented in the greengenes, SILVA, and ribosomal database
project alignments. As formal description of the A. mellifera microbiota
expands, the highly curated alignments will more accurately classify
these sequences. Searches against NCBI’s nucleotide collection,
however, will continue to provide insight into uncultured sequences
that may be closely related to the query sequence and are recommended.
2.2.4. Alpha diversity
Estimators of within-community (alpha) diversity have been proposed
and refined for decades (Whittaker, 1972; Magurran, 2004). For NGS
surveys of bacterial symbionts, three measurements of alpha diversity
are commonly used: rarefaction curves, species richness estimators
(often in conjunction with rarefaction curves), and community
diversity indices. Bee-associated bacterial surveys commonly report all
three measures, but it should be noted that the abundance of 16S
amplicon sequences can be a poor predictor of relative bacterial
abundances (Amend et al., 2010). Estimates of within and between
community diversity that rely on 16S amplicon sequence abundance
should therefore be interpreted with caution. Recently, a method to
account for 16S gene copy number in estimating bacterial abundance
was developed (Kembel et al., 2012), which may help improve the
accuracy of bacterial diversity measurements based on 16S amplicons.
1. Species richness estimators estimate the total number of
species present in a community. The Chao 1 index is
commonly used, and is based upon the number of rare
classes (i.e. OTUs) found in a sample (Chao, 1984):
8 Engel et al.
where Sest is the estimated number of species, Sobs is the
observed number of species, f1 is the number of singleton
taxa (taxa represented by a single read in that community),
and f2 is the number of doubleton taxa. If a sample contains
many singletons, it is likely that more undetected OTUs exist,
and the Chao 1 index will estimate greater species richness
than it would for a sample without rare OTUs. Besides the
Chao1 estimator, mothur includes several other species
richness estimators and a wrapped version of CatchAll, which
calculates 12 different estimators and proposes a best
estimate of species richness (Bunge et al., 2012). QIIME also
includes the Chao1 estimator along with several other species
richness estimators.
2. Rarefaction curves are used to determine whether sampling
depth was sufficient to accurately characterize the bacterial
community being studied. To build rarefaction curves, each
community is randomly subsampled without replacement at
different intervals, and the average number of OTUs at each
interval is plotted against the size of the subsample (Gotelli
and Colwell, 2001). The point at which the number of OTUs
does not increase with further sampling is the point at which
enough samples have been taken to accurately characterize
the community. Mothur and QIIME will both calculate
rarefaction for observed and estimated species richness.
QIIME will additionally create graphs of rarefaction curves,
while mothur outputs results that can be imported into
graphing software.
3. Community diversity indices combine species richness and
abundance into a single value of evenness. Communities that
are numerically dominated by one or a few species exhibit low
evenness while communities where abundance is distributed
equally amongst species exhibit high evenness (Gotelli, 2008).
Two of the most widely used indices are the Shannon (or
Shannon-Wiener) index (Shannon, 1948) and Simpson’s index
(Simpson, 1949). A recommended index that is not sensitive
to sample size is the Probability of an Interspecific Encounter
(PIE [Hurlbert, 1971]):
where N is the sample size, pi is the proportion of the sample
that is made up of individuals of species i, and S is the
number of species in the sample. PIE is bounded between 0
(a community comprised of a single species), and 1 (a
community comprised of an infinite number of equally
abundant species), but is not currently included in either
mothur or QIIME. Both mothur and QIIME include multiple
community diversity indices.
dimensions as possible, while achieving stress values of less
than at least 0.20 and preferably less than 0.10 (Quinn and
Keough, 2002). Although currently not implemented in mothur
or QIIME, analyses such as canonical correspondence analysis
(CCA) relate environmental variables to ordination patterns
(Ramette, 2007). CCA can also be used to determine which
OTUs correspond with specific environmental variables.
3. Hierarchical community clustering. To visualize community
relatedness in the same format as a phylogenetic tree, we
recommend UPGMA, or the Unweighted Pair Group Method
with Arithmetic mean (Sokal and Michener 1958). Jackknife
support for the branching patterns in the resulting dendrogram
can be calculated in QIIME (Kuczynski et al., 2011), providing
an estimate of confidence in the clustering patterns.
2.2.6. Testing for significant differences in communities
Several analyses have been used to test for differences in microbial
community composition (Schloss, 2008). It is likely, however, that
new methods specifically developed for analysis of deeply sequenced
microbial communities will complement or even replace the existing
methods.
1. Non-parametric MANOVA (NPMANOVA, (Anderson, 2001),
also called Adonis in the vegan R package and QIIME) is a
non-parametric analyses of variance that has been used to
test for differences in microbial community composition. In
NPMANOVA and the following analyses the response variable
is the dissimilarity or distance matrix calculated above and the
independent variable is the group of samples being tested,
(e.g. samples grouped by different regions of the bee gut or
by an experimental treatment). Multiple response permutation
procedure (MRPP) is a related test for differences between
communities. NPMANOVA (Adonis) and MRPP are available in
QIIME and require:
a. a distance or dissimilarity matrix.
b. a mapping file.
c. a categories list that details the category in the mapping
file that will be tested (i.e. the independent variable).
2. AMOVA (Excoffier et al., 1992) is another non-parametric
analyses of variance that is available in mothur and tests
whether the variation in each sample differs from the variation
of the pooled samples. To run AMOVA mothur requires:
a. a distance or dissimilarity matrix.
b. a design file that lists the sample name and corresponding
group (i.e. the independent variable).
Although these tests are non-parametric, false positive results may be
problematic and results should be interpreted with caution.
2.2.5. Exploratory techniques: beta diversity
The main goal of most bacterial community studies is to compare the
composition of different communities (beta diversity). The communities
being compared differ in some trait or treatment, such as which section
of the gut the samples are from. There are numerous ways to visualize
and analyse beta diversity, and a thorough review of multivariate
techniques that are commonly used by microbial ecologists is presented
by Ramette (2007). The beta diversity analyses that have been used
in studies of bee-associated bacteria fall into two categories: exploratory
techniques and tests of significance. We recommend the following
steps for ordination and hierarchical clustering (exploratory techniques):
1. Determine the distance/dissimilarity matrix. The goal of
ordination and clustering is to visually compare community
composition. Both approaches utilize community distance
matrices as input, and these matrices are commonly
computed using two methods.
a. Bray-Curtis dissimilarity (Bray and Curtis, 1957):
where w is the sum of the of the lesser scores for only
those species which are present in both communities, a is
the sum of the measures of taxa in one community and b
is the sum of the measures of taxa in the other
community. When proportional abundance is used, a and
b equal 1 and the index collapses to 1-w.
b. UniFrac distances (Lozupone and Knight, 2005). UniFrac
distances are based on branches in a phylogenetic tree
that are either shared or unique amongst samples.
UniFrac distance matrices therefore depend on the quality
of the input tree, which can be problematic for short NGS
data (Ochman et al., 2010). Given that caveat, UniFrac
distances are commonly used, and can be calculated in
QIIME given an OTU table that lists the abundance of
each OTU in a sample and a phylogenetic tree.
2. Evaluate ordination patterns. The Bray-Curtis dissimilarity
matrix or UniFrac distance matrix is used as input for ordination
and clustering analyses. The two most common methods for
ordination of NGS bacterial community data are principal
coordinates (PCoA) and nonmetric multidimensional scaling
(NMDS). NMDS is recommended, as NMDS is non-parametric,
free of assumptions, and can reduce the data into fewer axes
than PCoA (Quinn and Keough, 2002; Ramette, 2007). The
number of axes for the NMDS ordination is determined beforehand,
and will likely be a tradeoff between interpretability and
goodness of fit (Quinn and Keough, 2002). When Kruskal’s
stress formula is used, it is recommended to use as few
The COLOSS BEEBOOK: gut symbionts 9
3. Fluorescent in situ hybridization
(FISH) for image analysis of
specific microorganisms in the
digestive tract
FISH with fluorescently labelled oligonucleotides targeting bacterial
rRNAs can be a very powerful tool for detecting specific bacteria in
various environmental samples such as active sludge, stool, clinical
specimens, animal tissues and so on (Wagner et al. 2003, Amann and
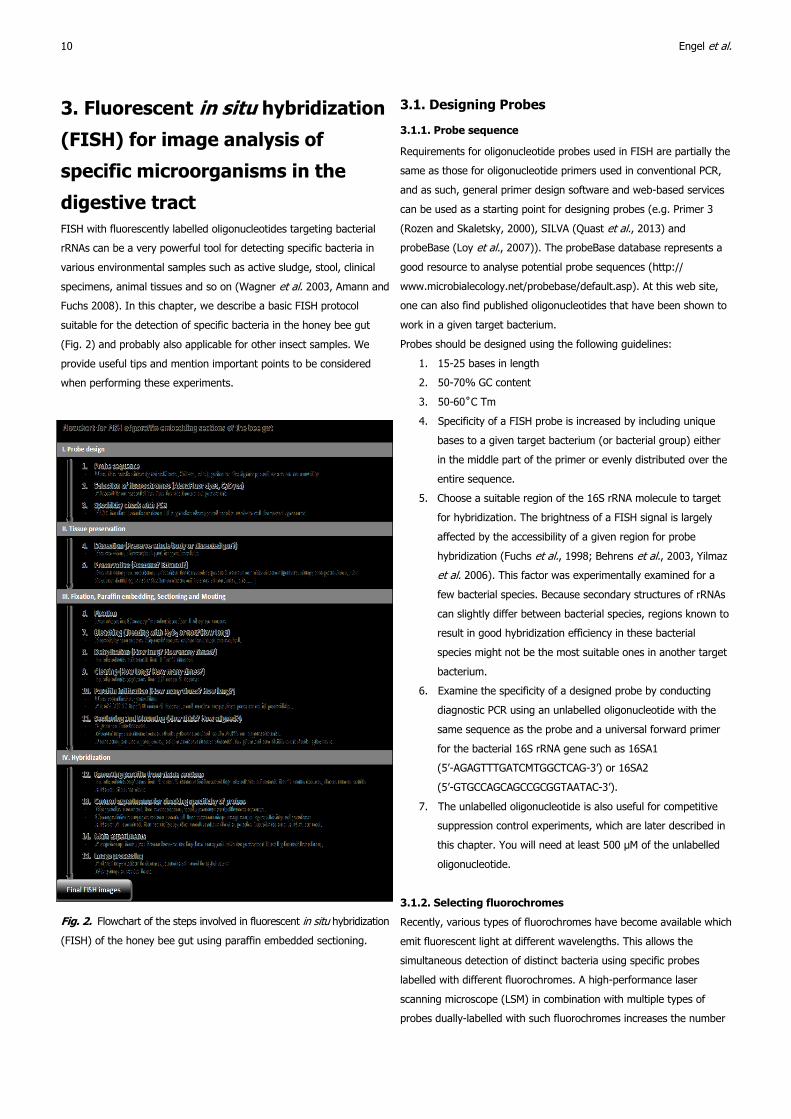
Fuchs 2008). In this chapter, we describe a basic FISH protocol
suitable for the detection of specific bacteria in the honey bee gut
(Fig. 2) and probably also applicable for other insect samples. We
provide useful tips and mention important points to be considered
when performing these experiments.
10 Engel et al.
3.1. Designing Probes
3.1.1. Probe sequence
Requirements for oligonucleotide probes used in FISH are partially the
same as those for oligonucleotide primers used in conventional PCR,
and as such, general primer design software and web-based services
can be used as a starting point for designing probes (e.g. Primer 3
(Rozen and Skaletsky, 2000), SILVA (Quast et al., 2013) and
probeBase (Loy et al., 2007)). The probeBase database represents a
good resource to analyse potential probe sequences (http://
www.microbialecology.net/probebase/default.asp). At this web site,
one can also find published oligonucleotides that have been shown to
work in a given target bacterium.
Probes should be designed using the following guidelines:
1. 15-25 bases in length
2. 50-70% GC content
3. 50-60˚C Tm
4. Specificity of a FISH probe is increased by including unique
bases to a given target bacterium (or bacterial group) either
in the middle part of the primer or evenly distributed over the
entire sequence.
5. Choose a suitable region of the 16S rRNA molecule to target
for hybridization. The brightness of a FISH signal is largely
affected by the accessibility of a given region for probe
hybridization (Fuchs et al., 1998; Behrens et al., 2003, Yilmaz
et al. 2006). This factor was experimentally examined for a
few bacterial species. Because secondary structures of rRNAs
can slightly differ between bacterial species, regions known to
result in good hybridization efficiency in these bacterial
species might not be the most suitable ones in another target
bacterium.
6. Examine the specificity of a designed probe by conducting
diagnostic PCR using an unlabelled oligonucleotide with the
same sequence as the probe and a universal forward primer
for the bacterial 16S rRNA gene such as 16SA1
(5’-AGAGTTTGATCMTGGCTCAG-3’) or 16SA2
(5’-GTGCCAGCAGCCGCGGTAATAC-3’).
7. The unlabelled oligonucleotide is also useful for competitive
suppression control experiments, which are later described in
this chapter. You will need at least 500 µM of the unlabelled
oligonucleotide.
3.1.2. Selecting fluorochromes
Recently, various types of fluorochromes have become available which
emit fluorescent light at different wavelengths. This allows the
simultaneous detection of distinct bacteria using specific probes
labelled with different fluorochromes. A high-performance laser
scanning microscope (LSM) in combination with multiple types of
probes dually-labelled with such fluorochromes increases the number
Fig. 2. Flowchart of the steps involved in fluorescent in situ hybridization
(FISH) of the honey bee gut using paraffin embedded sectioning.
of bacteria that can be detected simultaneously (Valm et al., 2011).
However, most of epifluorescence microscopes used routinely in
conventional laboratories may be equipped with only a few fluorescence
filters. This limits the number of fluorochromes that can be detected
unambiguously. Moreover, because insect tissues generally have
stronger autofluorescence in shorter (blue to green) wavelengths,
signals of fluorochromes emitting fluorescence in this wavelength
range tend to be obscured by the autofluorescence of the insect
tissue (Fukatsu et al., 1998; Koga et al., 2009). Accordingly, only
fluorochromes emitting longer wavelength light are generally suitable
as reporter dyes of FISH probes for insect materials (Table 1).
Green fluorochromes are sometimes allocated for counter
staining, especially when using LSM, because these microscopes are
typically not equipped with a laser generator to detect blue
fluorescence dyes such as DAPI. Different companies offer a broad
variety of fluorochromes for oligonucleotide labelling. Alexa Fluor®
dyes seem to outperform traditional fluorochromes, such as FITC,
TRITC or Cy™ Dyes, in fluorescence intensity and photo stability.
However, these patented dyes are relatively expensive, and for most
applications, other dyes will be sufficient to generate good results.
3.2. Preserving insect materials for FISH
Specimen quality can substantially influence the success of FISH
experiments. Immediately processed fresh insect specimens represent
the optimal material. The tissue should be dissected (see Carreck et al.,
2013) in an isotonic solution, such as phosphate buffered saline (PBS)
or Insect Ringer’s solution, before being fixed, as this will facilitate the
infiltration of reagents into tissue later. Dissection prior to fixation also
aids in orienting the specimen for later sectioning.
The COLOSS BEEBOOK: gut symbionts 11
However, insects are often collected in the field, and thus they cannot
immediately be processed. If the insects must be preserved before
FISH experiments can be performed, acetone and ethanol can be
used as preservatives. Acetone is an amphiphilic organic solvent that
deprives water from fresh tissue samples very quickly. This property
makes acetone an excellent preservative agent for insects with cuticle
exoskeletons that prevent efficient penetration of many aqueous
fixative agents (Fukatsu, 1999). However, acetone is not always the
best choice for FISH experiments, especially in case of bee gut
specimens. The major flaw of acetone is that tissues soaked in it
become brittle. This makes the dissection of an intact gut from whole
body preservations in acetone extremely challenging. Hence, absolute
ethanol is recommended if entire insects need to be preserved for
later dissection. However, if the desired tissue can be dissected prior
to preservation then acetone is the primary choice.
Use excessive amounts of preservative agent. The total volume of
insect tissue should be roughly 10% of the preservative volume.
These preservatives are highly volatile and their volume can decline
fairly quickly over time. Thus, be sure to check the volume periodically
in preserved specimens.
3.3. Fixation, paraffin embedding, sectioning and mounting
In histological analyses, paraffin sectioning is one of the most widely
used techniques, and many good protocols are available (e.g. Barbosa
(1974) or Presnell et al. (1997)). One can refer to these protocols to
learn the principles and details of different techniques. Here, we
describe the conditions useful for preparing paraffin sections of the
honey bee gut.
3.3.1. Fixing honey bee gut samples from fresh bees
1. Dissect the gut from the bee in PBS (0.8% NaCl [w/v], 0.02%
KCl [w/v], 0.115% Na2HPO4 [w/v], 0.02% KH2PO4 [w/v], pH
7.5) or Insect Ringer’s solution.
2. Freshly prepare formaldehyde fixative mixing 9 vol. of PBS
and 1 vol. of 40% formaldehyde solution (i.e. 4%
formaldehyde in PBS). It would be better to use more than 10
volumes of the fixative to that of a specimen.
3. Fix the tissue by soaking the gut samples in the freshly
prepared formaldehyde fixative, overnight at 4˚C.
4. After fixation, wash the tissue in PBS at least three times for
10 min at room temperature.
5. Follow with at least three washes in 75% ethanol for 30 min
at room temperature.
6. Transfer the gut samples to absolute ethanol for storage until
used. You can keep the samples in absolute ethanol at least a
week, and perhaps longer.
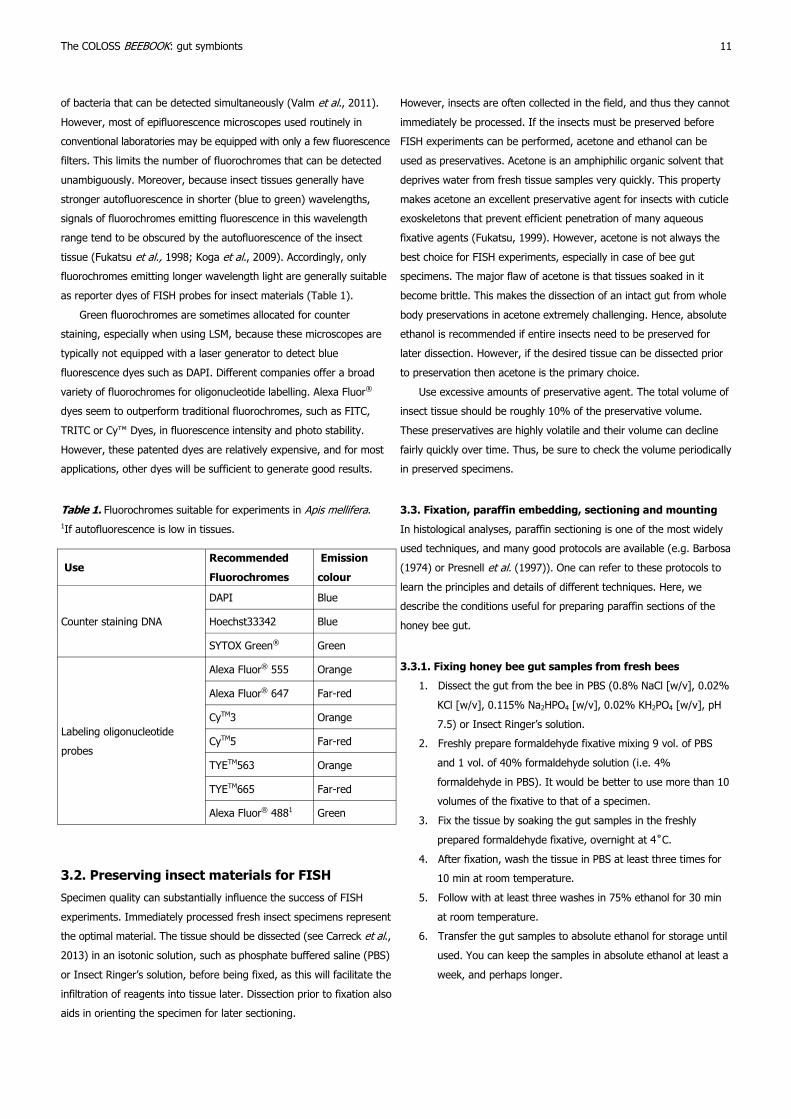
Use Recommended
Fluorochromes
Emission
colour
Counter staining DNA
DAPI Blue
Hoechst33342 Blue
SYTOX Green® Green
Labeling oligonucleotide
probes
Alexa Fluor® 555 Orange
Alexa Fluor® 647 Far-red
CyTM3 Orange
CyTM5 Far-red
TYETM563 Orange
TYETM665 Far-red
Alexa Fluor® 4881 Green
Table 1. Fluorochromes suitable for experiments in Apis mellifera.
1If autofluorescence is low in tissues.

3.3.2. Fixing honey bee gut samples from preserved bees
1. If the honey bees have been preserved in absolute ethanol or
acetone, the tissue has to be softened before dissection.
Achieve this by soaking and dissecting the specimen in
aqueous alcohol (usually 70-80% ethanol), then wash the gut
sample once more with absolute ethanol just prior to fixation.
(See 3.3.1 for working with fresh samples.)
2. Fix the samples by soaking them in Carnoy’s fixative (ethanol:
chloroform:acetic acid = 6: 3: 1 [v/v]) at room temperature,
overnight. Tissues can be exposed to Carnoy’s fixative for
longer time periods if autofluorescence from tissue needs to
be reduced further. However, this is not typically necessary
for honey bee gut tissues.
3. Then wash with absolute ethanol at least three times for 20
min at room temperature.
3.3.3. Bleaching samples to reduce autofluorescence in the
gut tissues
Autofluorescence can be reduced in tissues using hydrogen peroxide
(H2O2) (Koga et al., 2009), as described here. However,
autofluorescence is not very strong in honey bee gut tissue and H2O2
treatments produce oxygen bubbles in the lumen causing insufficient
penetration of the paraffin. Thus, bleaching with H2O2 is not
recommended unless autofluorescence is problematic in your tissues
for some reason.
1. Prepare a solution of H2O2-ethanol using 1 volume of 30%
H2O2 and 4 volume of absolute ethanol.
2. Soak the gut samples in the H2O2-ethanol for several days to
several weeks, changing the solution every two to three days.
During soaking, the colour of the tissue should become
lighter.
3. Wash with absolute ethanol at least three times for 20 min at
room temperature.
4. The specimen can be kept at -20˚C until use.
3.3.4. Dehydration, clearing, paraffin infiltration and
embedding
Complete replacement of water in tissues with paraffin is crucial for
obtaining high-quality sections. Firstly, water is replaced with an
amphiphilic solvent (e.g. ethanol). Then, this solvent will be replaced
with a hydrophobic solvent (e.g. xylene). Finally, the hydrophobic
solvent is replaced with paraffin. Longer exposure to each of the
different reagents will ensure complete replacement, but may also
adversely affect the tissues. Therefore, it is important to optimize
conditions, such as the exposure time for each solvent, depending on
the type of specimen. Here, we describe conditions for paraffin
embedding of the midgut and hindgut of the honey bee.
1. Dehydrate the gut tissues by soaking in absolute ethanol for 1 hr
at room temperature, repeat twice or more to ensure the
12 Engel et al.
replacement of water with ethanol in the tissue.
2. Clear dehydrated tissues by soaking in absolute xylene for 20 min
at room temperature; repeat twice more for a total of 3 washes.
3. Infiltrate paraffin into the tissues by applying liquid paraffin at
65-70˚C, 3 times for 1 hr.
4. Put the tissues in melted paraffin in a desired orientation and
‘snap cool’ it in ice-cold water. Do this in a mould (plastic or
metal), which has been pre-warmed to the same temperature
as the paraffin. Use a Pasteur pipette (also pre-warmed) to
pipette melted paraffin into the mould. Add the specimen into
the mould filled with paraffin, then ‘snap-cool’ it immediately
in the ice-cold water. After leaving it for 5 min in the ice-cold
water, the paraffin should have hardened and the block
including the embedded tissue can be removed from the mould.
Determine the direction of your sectioning (cross or sagital)
before embedding it in the paraffin block, and then remember the
orientation of the sample. Once embedded, the tissue is difficult to
see in solid paraffin. Thus, the orientation of the tissue should be
noted down for proper orientation of the block when preparing
sectioning later.
3.3.5. Sectioning and mounting
Use the following procedure to section paraffin-embedded tissues with
a microtome. The resulting sections should then be mounted onto
glass slides. In general, cutting tissue sections needs training and
practice. Therefore, we recommend consulting a person who is
experienced in histological techniques when using a microtome the
first time.
1. Remove (trim) excess parts of the paraffin block containing
the tissue to a few millimetres around the tissue. Use a scalpel
for trimming.
2. Fix the trimmed paraffin block onto the specimen holder of
the microtome for preparing tissue sections. The procedure of
fixing the paraffin block depends on the model of the
microtome. Please refer to the manual of the microtome.
3. Trim the paraffin block on the specimen holder again to make
the upper and lower sides of the block parallel to each other.
4. Mount the specimen holder onto the microtome.
5. Cut the paraffin block into 5 µm thick sections. You can adjust
the thickness of the sections to your purpose and type of
tissue. For example, you may have to use thicker sections
when preparing hindgut tissue that is filled with solid waste,
such as pollen shells.
6. Mount the sections on a commercially available glass slide
coated with aminosilane (APS) or equivalent. Place each
section on a separate slide. It is important to have several
slides with the same tissue sample section, so that different
stains can be used and controls can be included.

3.4. Hybridization
The protocol for conducting the hybridization is essentially the same
as described by Fukatsu et al. (1998) and Koga et al. (2009). Its use
in honey bee research is discussed further in Evans et al. (2013).
3.4.1. Hybridization procedures
1. Freshly prepare a hybridization buffer containing the probe(s)
(20 mM Tris-HCl [pH 8.0], 0.9M NaCl, 0.01% sodium dodecyl
sulphate, 30% formamide, 100 pmol/ml each of the probes,
10 µg/ml DAPI or equivalents). Prepare 150 µl of this solution
per slide.
2. Remove paraffin from the sections using absolute xylene
(soak for 3 min., and repeat this 3 times), followed by
absolute ethanol (soak for 3 min, twice), then rinse with
RNase-free water.
3. Apply 150 µl of the hybridization buffer onto the sections and
cover with a coverslip, taking care not to trap air bubbles.
4. Put the glass slides in a humidified chamber and leave at
room temperature, overnight, in the dark.
5. The next day, carefully remove the coverslip by applying
freshly prepared PBSTx (0.8% NaCl [w/v], 0.02% KCl [w/v],
0.115% Na2HPO4 [w/v], 0.02% KH2PO4 [w/v], 0.3% Triton X-
100 [v/v]) between the glass slide and coverslip using a wash
bottle.
6. Wash the slides with PBSTx with gentle agitation (~50 rounds
per minute) in the dark, 3 times for 10 min at room
temperature. You can use conventional staining trays or
containers.
7. Apply 100 µl of a commercially available antifade solution such
as SlowFade (Invitrogen) or DABCO-glycerol (prepared by
mixing 1.25 g of 1,4-Diazabicyclo[2.2.2]octane [DABCO],
10 mL of PBS and 90 mL of glycerol) directly onto the
specimen and cover the slide with a coverslip; avoid trapping
air bubbles.
8. Seal all sides of the coverslip with clear fingernail polish.
9. The samples are now ready for microscopy and should be
immediately analysed. These slides cannot be stored, because
the rRNA probes and fluorochromes are unstable, especially
when exposed to light.
3.4.2. FISH controls
Control experiments are necessary to validate the specificity of the
probes and to discriminate between the fluorescent signals of probes
and autofluorescence of insect tissues. All three of the following
control experiments should be conducted, because they are crucial for
verifying any FISH results obtained.
1. No probe control. Conduct hybridization without the
fluorescent probe(s) to examine the levels of autofluorescence
from the tissues.
The COLOSS BEEBOOK: gut symbionts 13
2. Competitive suppression control. Conduct hybridization with an
excess amount (usually 50x) of an unlabelled oligonucleotide
using the same sequence as a fluorescent probe to observe
sequence-specific, competitive suppression of the hybridization
signals.
3. RNase A control. Prior to hybridization, treat the tissue sections
with 10 µg/mL of RNase A in PBSTx at 37˚C for 30 min. Wash
the section with PBSTx and then conduct hybridization as
usual. The purpose of this control is to verify that the probe
specifically binds to RNA molecules.
3.4.3. Combining probes
Probes that do not overlap in their emission wavelengths can be
combined in the same sample to detect different bacteria
simultaneously (Fig. 3). Combining a universal eubacterial probe with
a more specific probe is also useful to detect the presence of
additional bacteria not identifiable with a specific probe.
3.4.4. Image acquisition and adjustments
FISH signals can be detected by using an epifluorescence microscope
using standard fluorescence microscopy procedure for your
instrument. Here is some basic information that might be helpful for
beginners.
1. Frequently, each channel (i.e. each signal from a given probe
or DNA counter-stain) is acquired as a black & white image.
Each of these images will later be coloured with a specific
colour (arbitrarily chosen) and merged, resulting in a single
pseudo-coloured image. Therefore, the actual fluorescent
colour seen can differ from that in the final images.
Fig. 3. Micrograph using fluorescent in situ hybridization (FISH) of
Snodgrassella alvi (green) and Firm-5 (blue) in an oblique section of
the honey bee ileum. The fluorescent tags used here were linked to
probes hybridizing with 16S rRNA specific to these bacterial types. In
addition, a DNA stain (white) was used to stain the honey bee nuclei.
Image prepared by W Kwong.
2. The probe will dissociate from the target RNA molecules over
time in the mounting media. Thus, after mounting in antifade
medium, observation should be conducted as soon as possible.
3. Minimize exposure of your slides to the excitation light to
prevent photobleaching of fluorochromes (i.e. reduction of
signal intensity).
4. Irradiation at higher magnification causes localized
photobleaching. This photobleached region will be observed
as a dark spot in a lower-magnified image. Therefore, images
should be acquired from lower to higher magnifications.
3.5. Concluding remarks about FISH
Preparing fine paraffin sections is the key to a successful FISH
experiment. However, this step requires technical proficiency and
practice. Therefore, whole-mount FISH (wFISH) (Koga et al., 2009)
might be an attractive alternative. This technique does not require
tissue sectioning, but a laser-scanning microscope is essential for
analysis. In addition, wFISH has several other limitations, such as
poor performance on large and thick specimens and vulnerability to
autofluorescence. A combination of both FISH techniques would be
optimal to obtain a comprehensive picture of the structural
organization of microbial communities in the gut environment of bees
and other insects.
4. Culture conditions for the dominant
members of the bee gut microbiota
Culture-independent studies show that the gut microbiota of the
honey bee is dominated by only 8 or so groups of bacteria (Martinson
et al., 2011; Ahn et al., 2012; Moran et al., 2012). Given the difficulty
of drawing delineations between species when it comes to bacteria,
each “group” may actually represent one or more species. Nonetheless,
these groups are valid in that they comprise distinct phylogenetic
clades, and the bacteria within each clade are found in association
with bees and not with other animals or environmental sources
(Martinson et al., 2011; Ahn et al., 2012; McFrederick et al., 2012).
Bacteria from each of these groups can be cultured on standard
microbiological media if supplied with the correct growth conditions.
Recent culture-based studies have begun to support the findings of
culture-independent surveys, giving due recognition to the dominant
members of the microbiota (Olofsson and Vásquez, 2008; Engel et al.,
2012; Tian et al., 2012; Vásquez et al., 2012; Kwong and Moran,
2013). By combining the low-bias culture-independent analysis of
bacterial communities and the powerful molecular tools available in
culture-based approaches, a rigorous study of the microbial associates
of bees can be realized.
The following is a brief overview of the current state of knowledge
regarding the cultivation of the bee gut microbiota for each of the
14 Engel et al.
dominant groups. All bacteria described here can be cultured by
plating homogenized guts (aseptically removed from the bee using
methods described in Section 2.1.1.) onto a suitable medium (often a
standard nutrient-enriched agar that can be purchased from
commercial suppliers). The plates are then incubated for several days,
typically at 35-37°C, to allow growth of bacterial colonies.
Most of the bacteria associated with honey bee guts require a
low-O2 atmosphere for optimal growth. To supply these conditions,
plates may be incubated in dedicated CO2 incubators or sealed in
pouches or jars with CO2-generating packets. Bacteria that require
anaerobic conditions can be grown in dedicated anaerobic chambers
by displacing air with nitrogen gas, or in sealed pouches or jars with
the appropriate packets for generating anaerobic atmospheres.
Packets for both CO2 and anaerobic atmospheres are available from
commercial suppliers such as BD Biosciences’s GasPak system
(Franklin Lakes, NJ, USA) and Oxoid’s CO2Gen and AneroGen
(Basingstoke, Hampshire, UK). Identification of bacterial isolates
should be carried out by DNA sequencing (as described in section
2.1.2. and 2.1.3.) rather than by phenotypic observations, as traits
such as colony morphology and biochemical activities may be
heterogeneous among members of the same species.
A word of caution, culturing methods will always lead to bias in
what is recovered, and this bias is affected by the culture conditions
you select. What is presented here is a general guide to methods that
have successfully cultured some members of each dominant group,
but it is important to recognize that these techniques may not always
capture the full strain diversity within each group.
4.1. Genus Snodgrassella
4.1.1. Optimal growth conditions
1. Atmosphere of 5% CO2
2. Temperature of 35-37°C
3. Culture media: trypticase soy agar, trypticase soy agar + 5%
defibrinated sheep blood, heart infusion agar, brain heart
infusion agar, and LB agar; grows weakly in trypticase soy
broth (Kwong and Moran, 2013).
4.1.2. Microbe characteristics
Colonies smooth, white, round, ~1mm diameter, and form within 2
days (Fig. 4). Cells are Gram negative, rod-shaped, and non-motile.
Snodgrassella can use citric acid or malic acid as the main carbon
source; are positive for catalase and nitrate reductase activity,
negative for oxidase.
The sole species described for this genus is Snodgrassella alvi, a
member of the family Neisseriaceae and class Betaproteobacteria
(Martinson et al., 2012; Kwong and Moran, 2013). In early publications
(Babendreier et al., 2007; Martinson et al., 2011; Moran et al., 2012),
S. alvi is referred to as the “Beta” or “Betaproteobacteria”.
Snodgrassella alvi strains have been isolated from honey bees and

The species strain described for this group is Frischella perrara
(Strain PEB0191), a member of the family Orbaceae and class
Gammaproteobacteria. Although in the same family as Gilliamella, its
closest relatives are in the Orbus genus. Frischella perrara was
referred to as “Gamma-2” or “Gammaproteobacteria 2” (Babendreier
et al., 2007; Martinson et al., 2011; Moran et al., 2012), and has
recently been formally named (Engel et al., 2013). Frischella has been
isolated from A. mellifera but has not been detected in bumble bees
(Koch and Schmid-Hempel, 2011). The type strain is PEB0191T and
can be procured from bacterial culture collections (accession BAA-
2450T at ATCC, or 14821T at NCIMB). Frischella is present in most
adult workers and has been estimated to comprise up to 13% of the
gut bacteria (Moran et al., 2012).
4.4. Genus Lactobacillus
4.4.1. Optimal growth conditions
1. Atmosphere can be aerobic or anaerobic
2. Temperature of 35-37°C
3. Culture media: tryptone soy broth agar (Oxoid; Basingstoke,
Hampshire, UK), tomato juice agar (Oxoid; Basingstoke,
Hampshire, UK), Rogosa agar (Merck), and MRS (de Man-
Rogosa-Sharpe) agar (Oxoid; Basingstoke, Hampshire, UK),
Lactobacillus Carrying Media (Efthymiou and Hansen, 1962)
and MRS broth supplemented with 0.5% L-cysteine or 20%
fructose (Olofsson & Vásquez, 2008; Forsgren et al. 2010).
4.4.2. Lactobacillus characteristics
Cells of the Lactobacillus genus can vary from long and slender rods
to short coccobacilli rods (Hammes and Hertel, 2009). Colony
morphologies also vary, but are typically convex, smooth, and opaque
without pigment (Hammes and Hertel, 2009). The bee-associated
Lactobacillus are negative for catalase and sporulation, positively
Gram-staining, and produce lactic acid by homofermentation
(Olofsson and Vásquez, 2008). The Lactobacillus kunkeei clade is
fructophilic, preferentially utilizing fructose over glucose as the carbon
source (Neveling et al., 2012).
Lactobacillus species are ubiquitous in nature and are commonly
found in association with many animals, plants, and foodstuffs.
Lactobacilli are widely considered probiotic, meaning their presence is
beneficial to the health of the host organism (Kleerebezem and
Vaughan, 2009). The bee-associated Lactobacillus fall into two main
clades, “Firm-4” and “Firm-5” (Babriendier et al., 2007; Martinson et
al., 2011; Moran et al., 2012). These clades are only distantly related
to other Lactobacillus, with 16S rRNA identities ~90% (Olofsson and
Vásquez, 2008; Vásquez et al., 2012), and thus may eventually be
classified as novel species.
Another species, L. kunkeei, may be the most frequently
recovered member of Lactobacillus in culturing experiments (Tajabadi
et al., 2011; Vásquez et al., 2012; Neveling et al., 2012). However,
culture-independent studies show “Firm-4” and “Firm-5” are the
bumble bees, and the type strain is S. alvi wkB2T (Kwong and Moran,
2013). The type strain can be procured from bacterial culture collections
(accession BAA-2449T at the American Type Culture Collection in
Manassas, VA, USA [ATTC] or 14803T at the National Collection of
Industrial, Food, and Marine Bacteria in Aberdeen, UK [NCIMB]).
Snodgrassella has been estimated to comprise 0.6-39% of bacteria in
the guts of individual workers (Moran et al., 2012).
4.2. Genus Gilliamella
4.2.1. Optimal growth conditions
1. Atmosphere of 5% CO2
2. Temperature of 35-37°C
3. Culture media: trypticase soy agar or broth, trypticase soy
agar + 5% defibrinated sheep blood, heart infusion agar, and
LB agar (Kwong and Moran, 2013).
4.2.2. Gilliamella characteristics
Smooth, white, round colonies ~2.5mm diameter that form within 2
days incubation; however, colony morphology can vary between
strains (Fig. 4). Cells are Gram negative, rod-shaped, non-motile, and
may form filament chains. Gilliamella is negative for catalase, nitrate
reductase, and oxidase (Kwong and Moran, 2013).
The sole species described for this genus is Gilliamella apicola, a
member of the family Orbaceae and class Gammaproteobacteria
(Martinson et al., 2012; Kwong and Moran, 2013). In early
publications (Babendreier et al., 2007; Martinson et al., 2011; Moran
et al., 2012), G. apicola is referred to as the “Gamma-1” or
“Gammaproteobacteria-1”. G. apicola strains have been isolated from
honey bees and bumble bees, and the type strain is G. apicola wkB1T
(Kwong and Moran, 2013). The type strain can be procured from
bacterial culture collections (accession BAA-2448T at ATCC, or 14804T
at NCIMB). Gilliamella has been estimated to comprise 0.6-30% of
bacteria in the guts of individual workers (Moran et al., 2012).
4.3. Genus Frischella
4.3.1. Optimal growth conditions
1. Atmosphere of 5% CO2, or anaerobic
2. Temperature of 35-37°C
3. Culture media: trypticase soy agar + 5% defibrinated sheep
blood, heart infusion agar, brain heart infusion agar, and
trypticase soy broth (Engel et al., 2013).
4.3.2. Frischella characteristics
Frischella are facultative anaerobic, but will not grow in fully aerobic
conditions (Engel et al., 2013). These bacteria produce smooth,
round, flat, semi-transparent colonies of ~1mm diameter in about 3
days (Fig. 4). Cells are rod-shaped and may form filaments or chains.
Frischella can obtain carbon through fermentation of glucose,
fructose, and mannose. They are positive for catalase and negative
for nitrate reductase and oxidase.
The COLOSS BEEBOOK: gut symbionts 15

dominant bee gut lactobacilli, not L. kunkeei (Moran et al., 2012;
Ahn et al., 2012). L. kunkeei has also been found on flowers (Neveling
et al., 2012) and wine (Edwards et al., 1998), suggesting they may
have other naturally occurring habitats outside the bee gut
(McFrederick et al., 2012). Lactobacillus is the most abundant group
in the bee gut and has been estimated to comprise 20-99% of
bacteria in individual workers (Moran et al., 2012).
4.5. Genus Bifidobacterium
4.5.1. Optimal growth conditions
1. Atmosphere that is aerobic or anaerobic
2. Temperature of 37°C
3. Culture media: blood agar, peptone-yeast extract-glucose
broth (Biavati et al., 1982), MRS medium (Olofsson &
Vásquez, 2008; Bottacini et al. 2012).
4.5.2. Bifidobacterium characteristics
Bifidobacterium are typically anaerobic or microaerophilic; however,
members of the bee gut Bifidobacterium have been found to grow
aerobically (Bottacini et al., 2012). Colonies appear within 2 days and
are punctiform, convex, smooth, and greyish-white (Biavati et al.,
1982) (Fig. 4). The bee gut Bifidobacterium are negative for catalase
and sporulation, Gram positive, and produce lactic and acetic acid
(Olofsson and Vásquez, 2008).
Like Lactobacilli, Bifidobacteria are common members of animal
gut microbial communities and have been used as probiotics
(Kleerebezem and Vaughan, 2009). Three species of Bifidobacterium
specific to honey bees have been described: B. asteroides, B. coryneforme,
and B. indicum (Scardovi and Trovatelli, 1969; Biavati et al., 1982;
Felis and Dellaglio, 2007). Other species have been found in bumble
bees (Killer et al., 2011). The type strains are available from ATCC:
B. asteroides 25910T, B. coryneforme 25911T, and B. indicum 25912T.
The genome of B. asteroides strain PRL2011 has been sequenced
(Bottacini et al., 2012). Bifidobacterium is present in most adult
workers and has been estimated to comprise up to 15% of the gut
bacteria (Moran et al., 2012).
4.6. Alpha-1 bacteria
4.6.1. Optimal growth conditions
1. Atmosphere of 5% CO2
2. Temperature of 35-37°C
3. Culture media: trypticase soy agar, trypticase soy agar + 5%
defibrinated sheep blood, and heart infusion agar (PE,
unpublished).
4.6.2. Alpha-1 characteristics
This group of bacteria has not been formally described, but in our
experience they form smooth, round, white colonies after 1 day of
growth (Fig. 4; PE, unpublished). The Alpha-1 group belongs to the
class Alphaproteobacteria and is related to several ant-associated
bacteria and to Bartonella, a genus that includes opportunistic
intracellular parasites (Jeyaprakash et al., 2003; Babriendier et al.,
2007; Martinson et al., 2011). Alpha-1 is typically found at low
frequency (< 4 %) in the honey bee gut and are probably not present
in all individuals (Moran et al., 2012).
4.7. Other bacteria
Alpha-2.1 and Alpha-2.2 (Martinson et al., 2011) are two other groups
within the Alphaproteobacteria commonly found in the bee gut.
Alpha-2.1 is related to Gluconobacter and Acetobacteraceae, while
Alpha-2.2 is related to Saccharibacter floricola, a bacterium associated
with flowers (Martinson et al., 2011). Members of both of these
groups have been cultured (Mohr and Tebbe, 2007), although they
remain poorly studied. These two groups are typically found at low
frequency in the bee gut (< 6%), although they appear to be present
in most individuals (Moran et al., 2012).
Other bacterial genera may also be recovered from culturing
efforts, such as Pantoea (Loncaric et al., 2009) and Bacillus (Evans
and Armstrong, 2006). However, these likely represent transient
members of the bee microbiota, as they are not among the dominant
groups found in culture-independent studies.
4.8. Preservation of bacterial cultures
Cryopreservation is a standard practice for the long-term storage of
bacterial cultures. Although a wide range of preservation methods are
available, the protocol described here is sufficient for general strain
archival purposes.
1. Streak out the strain on a plate and incubate for 1 day or until
it is dense enough to harvest. Liquid media may also be used,
if the strain is able to grow in it.
2. Prepare the cryoprotectant: Sterilize a 30% (v/v) glycerol
solution by autoclaving at 121°C for 15-20 min.
3. Harvest the culture and resuspend in 500 µl of suitable liquid
media (ex. for Snodgrassella, use trypticase soy broth).
4. Add the resuspended culture (500 µl) and 30% glycerol (500 µl)
to a 2 ml microfuge tube and mix thoroughly. Cryotubes
designed for storage at low temperatures, such as Nunc
Cryotubes (Sigma-Aldrich; St. Louis, MO, USA), are
recommended.
5. Store frozen at -80°C.
6. To reactivate frozen bacteria, remove tube from freezer. Do
not thaw; keep tube on ice or dry ice, or work quickly. Scrape
a small amount of frozen culture out of the tube using a
sterile tool (an inoculation loop or toothpick works well), and
streak out on a fresh agar plate. Return tube to -80°C, and
incubate the plate in the optimal conditions for your strain.
16 Engel et al.

5. Conclusions and outlook
We have described key methods for studying symbiotic microorganisms
in honey bee guts. Non-culture-based approaches in general, and NGS
sequencing in particular, have greatly improved our capabilities when
it comes to identifying the microbial communities associated with
honey bees. FISH microscopy provides a means to visually examine
the microenvironments where particular microbes occur. Culturing
The COLOSS BEEBOOK: gut symbionts 17
methods are also important, allowing researchers to isolate particular
bacteria of interest for further study or gene identification, and
enabling the assignment of particular functions to particular gut
community members. The culture conditions required for bacterial
species found in the honey bee gut, as described here, clearly show
that these gut symbionts tend to require low oxygen conditions, as is
the case for many microbes isolated from the intestines of mammals,
Fig. 4. Examples of dominant gut microbiota isolated from Apis mellifera: a) Snodgrassella alvi wkB2T; b) Gilliamella apicola wkB7 (left) and
G. apicola wkB1T (right); c) Frischella perrara PEB0191T, grown anaerobically; d) Bifidobacterium strain wkB3 (left) and Alpha-1 strain
PEB0122 (right); e) enlargements of 1x1 cm sections for (left to right) S. alvi wkB2T, G. apicola wkB7, G. apicola wkB1T, F. perrara PEB0191T,
and Bifidobacterium wkB3/Alpha-1 PEB0122. Strains grown on heart infusion agar + 5% sheep blood at 37ºC and 5% CO2 for 48 h, or as indicated.
Images by W Kwong and P Engel.

but not always true for insect gut symbionts. Also, the bacterial
symbionts in the digestive tracts of honey bees require fairly high
culturing temperatures, but temperatures consistent with honey bee
colonies. The techniques described in this chapter focus on bacterial
communities, but can easily be adapted for other microbial groups, for
the study of pathogens, or to elucidate interactions between
potentially beneficial gut microorganisms and pathogens. In addition,
many of these methods can readily be used to study the gut
microbiota of other bee species, allowing for comparative studies
across hosts. We hope the methods we describe will help others
advance the state of knowledge regarding bee gut symbionts, an
intriguing area of research.
6. Acknowledgements
We thank J Ellis for inviting us to prepare this chapter and providing
editorial support, and K Hammond for assisting with the references
and formatting. QSM was supported by the National Science
Foundation Grant PRFB-1003133 during the preparation of this work.
The COLOSS (Prevention of honey bee COlony LOSSes) network aims
to explain and prevent massive honey bee colony losses. It was funded
through the COST Action FA0803. COST (European Cooperation in
Science and Technology) is a unique means for European researchers
to jointly develop their own ideas and new initiatives across all
scientific disciplines through trans-European networking of nationally
funded research activities. Based on a pan-European intergovernmental
framework for cooperation in science and technology, COST has
contributed since its creation more than 40 years ago to closing the
gap between science, policy makers and society throughout Europe
and beyond. COST is supported by the EU Seventh Framework
Programme for research, technological development and
demonstration activities (Official Journal L 412, 30 December 2006).
The European Science Foundation as implementing agent of COST
provides the COST Office through an EC Grant Agreement. The
Council of the European Union provides the COST Secretariat. The
COLOSS network is now supported by the Ricola Foundation - Nature
& Culture.
7. References
AHN, J H; HONG, I P; BOK, J I; KIM, B Y; SONG, J; WEON, H Y
(2012) Pyrosequencing analysis of the bacterial communities in
the guts of honey bees Apis cerana and Apis mellifera in Korea.
Journal of Microbiology 50(5): 735-45.
http://dx.doi.org/10.1007/s12275-012-2188-0
ALTSCHUL, S F; GISH, W; MILLER, W; MYERS, E W; LIPMAN, D J (1990)
Basic local alignment search tool. The Journal of Molecular Biology
215(3): 403–410. http://dx.doi.org/10.1016/S0022-2836(05)80360-2
AMANN, R; FUCHS, B M (2008) Single-cell identification in microbial
communities by improved fluorescence in situ hybridization
techniques. Nature Reviews Microbiology 6(5): 339–348.
http://dx.doi.org/10.1038/nrmicro1888
AMEND, A S; SEIFERT, K A; BRUNS, T D (2010) Quantifying microbial
communities with 454 pyrosequencing: does read abundance
count? Molecular Ecology 19(24): 5555–5565.
http://dx.doi.org/10.1111/j.1365-294X.2010.04898.x
ANDERSON, M J (2001) A new method for non-parametric
multivariate analysis of variance. Austral Ecology 26(1): 32–46.
http://dx.doi.org/10.1111/j.1442-9993.2001.01070.pp.x
BABENDREIER, D; JOLLER, D; ROMEIS, J; BIGLER, F; WIDMER, F
(2007) Bacterial community structures in honey bee intestines and
their response to two insecticidal proteins. FEMS Microbiology
Ecology 59(3): 600–610.
http://dx.doi.org/10.1111/j.1574-6941.2006.00249.x
BARBOSA, P (1974) Manual of basic techniques in insect histology.
Autumn Publishers; Amherst, Massachusetts, USA. 245 pp.
BEHRENS, S; FUCHS, B M; MUELLER, F; AMANN, R (2003) Is the in
situ accessibility of the 16S rRNA of Escherichia coli for Cy3-
labeled oligonucleotide probes predicted by a three-dimensional
structure model of the 30S ribosomal subunit? Applied and
Environmental Microbiology 69(8): 4935–4941.
http://dx.doi.org/10.1128/AEM.69.8.4935-4941.2003
BIAVATI, B; SCARDOVI, V; MOORE, W E C (1982) Electrophoretic
patterns of proteins in the genus Bifidobacterium and proposal of
four new species. International Journal of Systematic and
Evolutionary Microbiology 32(3): 358-373.
http://dx.doi.org/10.1099/00207713-32-3-358
BOTTACINI, F; MILANI, C; TURRON, I F; SÁNCHEZ, B; FORONI, E;
DURANTI, S; SERAFINI, F; VIAPPIANI, A; STRATI, F; FERRARINI, A;
DELLEDONNE, M; HENRISSAT, B; COUTINHO, P; FITZGERALD, G F;
MARGOLLES, A; VAN SINDEREN, D; VENTURA, M (2012)
Bifidobacterium asteroides PRL2011 genome analysis reveals clues
for colonization of the insect gut. PLoS One. 7(9): e44229.
http://dx.doi.org/10.1371/journal.pone.0044229
BRAY, J R; CURTIS, J T (1957) An ordination of the upland forest
communities of southern Wisconsin. Ecological Monographs 27(4):
325–349.
http://dx.doi.org/10.2307/1942268
BRULC, J M; ANTONOPOULOS, D A; BERG MILLER, M E; WILSON, M K;
YANNARELL, A C (2009) Gene-centric metagenomics of the
fiber-adherent bovine rumen microbiome reveals forage specific
glycoside hydrolases. Proceedings of the National Academy of
Science 106(6): 1948-1953.
BUNGE, J; WOODARD, L; BÖHNING, D; FOSTER, J A; CONNOLLY, S;
ALLEN, H K (2012) Estimating population diversity with CatchAll.
Bioinformatics 28(7): 1045–1047.
http://dx.doi.org/10.1093/bioinformatics/bts075
18 Engel et al.

CAPORASO, J G; BITTINGER, K; BUSHMAN, F D; DESANTIS, T Z;
ANDERSEN, G L; KNIGHT, R (2010a) PyNAST: a flexible tool for
aligning sequences to a template alignment. Bioinformatics 26(2):
266–267. http://dx.doi.org/10.1093/bioinformatics/btp636
CAPORASO, J G; KUCZYNSKI, J; STOMBAUGH, J; BITTINGER, K;
BUSHMAN, F D; COSTELLO, E K; FIERER, N; PEÑA, A G;
GOODRICH, J K; GORDON, J I; HUTTLEY, G A; KELLEY, S T;
KNIGHTS, D; KOENIG, J E; LEY, R E; LOZUPONE, C A;
MCDONALD, D; MUEGGE, B D; PIRRUNG, M; REEDER, J;
SEVINSKY, J R; TURNBAUGH, P J; WALTERS, W A; WIDMANN, J;
YATSUNENKO, T; ZANEVELD, J; KNIGHT, R (2010b) QIIME allows
analysis of high-throughput community sequencing data. Nature
Methods 7(5): 335–336.
http://dx.doi.org/10.1038/nmeth.f.303
CARRECK, N L; ANDREE, M; BRENT, C S; COX-FOSTER, D; DADE, H A;
ELLIS, J D; HATJINA, F; VANENGELSDORP, D (2013) Standard
methods for Apis mellifera anatomy and dissection. In V
Dietemann; J D Ellis; P Neumann (Eds) The COLOSS BEEBOOK,
Volume I: standard methods for Apis mellifera research. Journal
of Apicultural Research 52(4):
http://dx.doi.org/10.3896/IBRA.1.52.4.03
CHAO, A (1984) Nonparametric estimation of the number of classes in
a population. Scandinavian Journal of Statistics 11(4): 265–270.
http://dx.doi.org/10.2307/4615964
CORNMAN, R S; TARPY, D R; CHEN, Y; JEFFREYS, L; LOPEZ, D;
PETTIS, J S; VANENGELSDORP, D; EVANS, J D (2012) Pathogen
webs in collapsing honey bee colonies. PloS One 7(8):e43562.
http://dx.doi.org/10.1371/journal.pone.0043562
COX-FOSTER, D L; CONLAN, S; HOLMES, E C; PALACIOS, G; EVANS, J D;
MORAN, N A QUAN, P L; BRIESE, T; HORNIG, M; GEISER, D M;
MARTINSON, V; VANENGELSDORP, D; KALKSTEIN, A L;
DRYSDALE, A; HUI, J; ZHAI, J; CUI, L; HUTCHISON, S K;
SIMONS, J F; EGHOLM, M; PETTIS, J S; LIPKIN, W I (2007) A
metagenomic survey of microbes in honey bee colony collapse
disorder. Science. 318(5848): 283–287.
http://dx.doi.org/10.1126/science.1146498
DEGNAN, P H; OCHMAN H (2012) Illumina-based analysis of microbial
community diversity. The ISME Journal 6(1): 183–194.
http://dx.doi.org/10.1038/ismej.2011.74
DE GRAAF, D C; ALIPPI, A M; ANTÚNEZ, K; ARONSTEIN, K A; BUDGE, G;
DE KOKER, D; DE SMET, L; DINGMAN, D W; EVANS, J D;
FOSTER, L J; FÜNFHAUS, A; GARCIA-GONZALEZ, E; GREGORC, A;
HUMAN, H; MURRAY, K D; NGUYEN, B K; POPPINGA, L; SPIVAK, M;
VANENGELSDORP, D; WILKINS, S; GENERSCH, E (2013) Standard
methods for American foulbrood research. In V Dietemann; J D Ellis;
P Neumann (Eds) The COLOSS BEEBOOK, Volume II: standard
methods for Apis mellifera pest and pathogen research. Journal of
Apicultural Research 52(1):
http://dx.doi.org/10.3896/IBRA.1.52.1.11
The COLOSS BEEBOOK: gut symbionts 19
DE MIRANDA, J R; BAILEY, L; BALL, B V; BLANCHARD, P; BUDGE, G;
CHEJANOVSKY, N; CHEN, Y-P; GAUTHIER, L; GENERSCH, E;
DE GRAAF, D; RIBIÈRE, M; RYABOV, E; DE SMET, L; VAN DER
STEEN, J J M (2013) Standard methods for virus research in Apis
mellifera. In V Dietemann; J D Ellis; P Neumann (Eds) The
COLOSS BEEBOOK, Volume II: standard methods for Apis
mellifera pest and pathogen research. Journal of Apicultural
Research 52(4): http://dx.doi.org/10.3896/IBRA.1.52.4.22
EDGAR, R C (2010) Search and clustering orders of magnitude faster
than BLAST. Bioinformatics 26(19): 2460–2461.
http://dx.doi.org/10.1093/bioinformatics/btq461
EDGAR, R C; HAAS, B J; CLEMENTE, J C; QUINCE, C; KNIGHT, R
(2011) UCHIME improves sensitivity and speed of chimera
detection. Bioinformatics 27(16): 2194–2200.
http://dx.doi.org/10.1093/bioinformatics/btr381
EDWARDS, C G; HAAG, K M; COLLINS, M D; HUTSON, R A; HUANG, Y C
(1998) Lactobacillus kunkeei sp. nov.: a spoilage organism
associated with grape juice fermentations. Journal of Applied
Microbiology 84(5): 698-702.
http://dx.doi.org/10.1046/j.1365-2672.1998.00399.x
EFTHYMIOU, C; HANSEN, P A (1962) An antigenic analysis of
Lactobacillus acidophilus. The Journal of Infectious Diseases 110
(3): 258–267. http://dx.doi.org/10.1093/infdis/110.3.258
ENGEL, P E; KWONG, W; MORAN, N A (2013) Frischella perrara, gen.
nov., sp. nov. a gammaproteobacterium isolated from the gut of
Apis mellifera. International Journal of Systematic and
Evolutionary Microbiology (in press).
ENGEL, P; MARTINSON, V G; MORAN, N A (2012) Functional diversity
within the simple gut microbiota of the honey bee. Proceedings of
the National Academy of Sciences of the United States of America
109(27): 11002-11007.
http://dx.doi.org/10.1073/pnas.1202970109
ENGELBREKTSON, A; KUNIN, V; WRIGHTON, K C; ZVENIGORODSKY, N;
CHEN, F; OCHMAN, H; HUGENHOLTZ, P (2010) Experimental
factors affecting PCR-based estimates of microbial species
richness and evenness. The ISME Journal 4(5): 642–647.
http://dx.doi.org/10.1038/ismej.2009.153
EVANS, J D; ARMSTRONG, T N (2006) Antagonistic interactions
between honey bee bacterial symbionts and implications for disease.
BMC Ecology 6: 4. http://dx.doi.org/10.1186/1472-6785-6-4
EVANS, J D; SCHWARZ, R S; CHEN, Y P; BUDGE, G; CORNMAN, R S;
DE LA RUA, P; DE MIRANDA, J R; FORET, S; FOSTER, L;
GAUTHIER, L; GENERSCH, E; GISDER, S; JAROSCH, A;
KUCHARSKI, R; LOPEZ, D; LUN, C M; MORITZ, R F A; MALESZKA, R;
MUÑOZ, I; PINTO, M A (2013) Standard methodologies for
molecular research in Apis mellifera. In V Dietemann; J D Ellis;
P Neumann (Eds) The COLOSS BEEBOOK, Volume I: standard
methods for Apis mellifera research. Journal of Apicultural
Research 52(4):http://dx.doi.org/10.3896/IBRA.1.52.4.11

EXCOFFIER, L; SMOUSE, P E; QUATTRO, J M (1992) Analysis of
molecular variance inferred from metric distances among DNA
haplotypes: application to human mitochondrial DNA restriction
data. Genetics 131(2): 479–491.
FELIS, G E; DELLAGLIO, F (2007) Taxonomy of Lactobacilli and
Bifidobacteria. Current Issues in Intestinal Microbiology 8(2): 44–61.
FORSGREN, E; OLOFSSON, T C; VÁSQUEZ, A; FRIES, I (2010) Novel
lactic acid bacteria inhibiting Paenibacillus larvae in honey bee
larvae. Apidologie 41(1): 99-108.
http://dx.doi.org/10.1051/apido/2009065
FRIES, I; CHAUZAT, M-P; CHEN, Y-P; DOUBLET, V; GENERSCH, E;
GISDER, S; HIGES, M; MCMAHON, D P; MARTÍN-HERNÁNDEZ, R;
NATSOPOULOU, M; PAXTON, R J; TANNER, G; WEBSTER, T C;
WILLIAMS, G R (2013) Standard methods for Nosema research.
In V Dietemann; J D Ellis; P Neumann (Eds) The COLOSS
BEEBOOK: Volume II: Standard methods for Apis mellifera pest
and pathogen research. Journal of Apicultural Research 52(1):
http://dx.doi.org/10.3896/IBRA.1.52.1.14
FUCHS, B M; WALLNER, G; BEISKER, W; SCHWIPPL, I; LUDWIG, W;
AMANN, R (1998) Flow cytometric analysis of the in situ
accessibility of Escherichia coli 16S rRNA for fluorescently labelled
oligonucleotide probes. Applied and Environmental Microbiology
64(12): 4973–4982.
http://dx.doi.org/10.1128/AEM.67.2.961-968.2001
FUKATSU, T (1999) Acetone preservation: a practical technique for
molecular analysis. Molecular Ecology 8(11): 1935–1945.
http://dx.doi.org/10.1046/j.1365-294x.1999.00795.x
FUKATSU, T; WATANABE, K; SEKIGUCHI, Y (1998) Specific detection
of intracellular symbiotic bacteria of aphids by oligonucleotide-
probed in situ hybridization. Applied Entomology and Zoology. 33
(3): 461–472.
GILLIAM, M (1978) Bacteria belonging to the genus Bacillus isolated
from selected organs of queen honey bees, Apis mellifera. Journal
of Invertebrate Pathology 31(3): 389–391.
http://dx.doi.org/10.1016/0022-2011(78)90235-5
GILLIAM, M; PREST, D B (1972) Fungi isolated from the intestinal
contents of foraging worker honey bees, Apis mellifera. Journal of
Invertebrate Pathology 20(1): 101–103.
http://dx.doi.org/10.1016/0022-2011(72)90087-0
GILLIAM, M; PREST, D B (1987) Microbiology of faeces of the larval
honey bee, Apis mellifera. Journal of Invertebrate Pathology 49
(1): 70–75. http://dx.doi.org/10.1016/0022-2011(87)90127-3
GILLIAM, M; VALENTINE, D K (1974) Enterobacteriaceae isolated
from foraging worker honey bees, Apis mellifera. Journal of
Invertebrate Pathology 23(1): 38–41.
http://dx.doi.org/10.1016/0022-2011(74)90069-X
GILLIAM, M; WICKERHAM, L J; MORTON, H L; MARTIN, R D (1974)
Yeasts isolated from honey bees, Apis mellifera, fed 2,4-D and
antibiotics. Journal of Invertebrate Pathology 24(3): 349–356.
http://dx.doi.org/10.1016/0022-2011(74)90143-8
20 Engel et al.
GOTELLI, N J (2008) A primer of ecology (4th Ed.). Sinauer Associates,
Inc.; Sunderland, Massachusetts, USA. 290 pp.
GOTELLI, N J; COLWELL, R K (2001) Quantifying biodiversity:
procedures and pitfalls in the measurement and comparison of
species richness. Ecology Letters 4(4): 379–391.
http://dx.doi.org/10.1046/j.1461-0248.2001.00230.x
HAAS, B J; GEVERS, D; EARL, A M; FELDGARDEN, M; WARD, D V;
GIANNOUKOS, G; CIULLA, D; TABBAA, D; HIGHLANDER, S K;
SODERGREN, E; METHÉ, B; DESANTIS, T Z; HUMAN
MICROBIOME CONSORTIUM; PETROSINO, J F; KNIGHT, R;
BIRREN, B W (2011) Chimeric 16S rRNA sequence formation and
detection in Sanger and 454-pyrosequenced PCR amplicons.
Genome Research 21(3): 494–504.
http://dx.doi.org/10.1101/gr.112730.110
HAMADY, M; LOZUPONE, C; KNIGHT, R (2009) Fast UniFrac: facilitating
high-throughput phylogenetic analyses of microbial communities
including analysis of pyrosequencing and PhyloChip data. The ISME
Journal 4(1): 17–27. http://dx.doi.org/10.1038/ismej.2009.97
HAMMES, W P; HERTEL, C (2009) Genus Lactobacillus Beijerinck
1901, 212AL. In P De Vos; G M Garrity; D Jones; N R Krieg;
W Ludwig; F A Rainey; K Schleifer; W B Whitman (Eds). Bergey's
manual of systematic bacteriology (2nd Ed.). Vol. 3, The
Firmicutes. Springer; New York, USA. pp 465–490.
HANDELSMAN, J (2004) Metagenomics: application of genomics to
uncultured microorganisms. Microbiology and Molecular Biology
Reviews 68(4): 669-685.
http://dx.doi.org/10.1128/MMBR.68.4.669-685.2004
HUANG, Y; NIU, B; GAO, Y; FU, L; LI, W (2010) CD-HIT Suite: a web
server for clustering and comparing biological sequences.
Bioinformatics 26(5): 680–682.
http://dx.doi.org/10.1093/bioinformatics/btq003
HURLBERT, S H (1971) The nonconcept of species diversity: a critique
and alternative parameters. Ecology 52(4): 577–586.
http://dx.doi.org/10.2307/1934145
HUSE, S; HUBER, J; MORRISON, H (2007) Accuracy and quality of
massively parallel DNA pyrosequencing. Genome Biology 8(7): R143.
http://dx.doi.org/10.1186/genomebiology.com/2007/8/7/R143
JENSEN, A B; ARONSTEIN, K; FLORES, J M; VOJVODIC, S; PALACIO, M A;
SPIVAK, M (2013) Standard methods for fungal brood disease
research. In V Dietemann; J D Ellis, P Neumann (Eds) The
COLOSS BEEBOOK: Volume II: Standard methods for Apis
mellifera pest and pathogen research. Journal of Apicultural
Research 52(1):
http://dx.doi.org/10.3896/IBRA.1.52.1.13
JEYAPRAKASH, A; HOY, M A; ALLSOPP, M H (2003) Bacterial diversity
in worker adults of Apis mellifera capensis and Apis mellifera
scutellata (Insecta: Hymenoptera) assessed using 16S rRNA
sequences. Journal of Invertebrate Pathology 84(2): 96–103.
http://dx.doi.org/10.1016/j.jip.2003.08.007

KEMBEL, S W; WU, M; EISEN, J A; GREEN, J L (2012) Incorporating
16S gene copy number information improves estimates of
microbial diversity and abundance. PLoS Computational Biology 8
(10): e1002743. http://dx.doi.org/10.1371/jounnal.pcbi.1002743
KILLER, J; KOPEČNÝ, J; MRÁZEK, J; KOPPOVÁ, I; HAVLÍK, J; BENADA, O;
KOTT, T (2011) Bifidobacterium actinocoloniiforme sp. nov. and
Bifidobacterium bohemicum sp. nov., from the bumble bee
digestive tract. International Journal of Systematic and
Evolutionary Microbiology 61(6): 1315–1321.
http://dx.doi.org/10.1099/ijs.0.022525-0
KLEEREBEZEM, M; VAUGHAN, E E (2009) Probiotic and gut lactobacilli
and bifidobacteria: molecular approaches to study diversity and
activity. Annual Review of Microbiology 63: 269-290.
http://dx.doi.org/10.1146/annurev.micro.091208.073341
KOCH, H; ABROL, D P; LI, J; SCHMID-HEMPEL, P (2013) Diversity and
evolutionary patterns of bacterial gut associates of corbiculate
bees. Molecular Ecology 22(7): 2028-2044.
http://dx.doi.org/10.1111/mec.12209
KOCH, H; CISAROVSKY, G; SCHMID-HEMPEL, P (2012) Ecological
effects on gut bacterial communities in wild bumble bee colonies.
Journal of Animal Ecology 81(6): 1202–1210.
http://dx.doi.org/10.1111/j.1365-2656.2012.02004.x
KOCH, H; SCHMID-HEMPEL, P (2011) Bacterial communities in central
European bumble bees: low diversity and high specificity.
Molecular Ecology 62(1): 121–133.
http://dx.doi.org/10.1007/s00248-011-9854-3
KOCH, H; SCHMID-HEMPEL, P (2012) Gut microbiota instead of host
genotype drive the specificity in the interaction of a natural host-
parasite system. Ecology Letters 15(10): 1095–1103.
http://dx.doi.org/10.1111/j.1461-0248.2012.01831.x
KOGA, R; TSUCHIDA, T; FUKATSU, T (2009) Quenching
autofluorescence of insect tissues for in situ detection of
endosymbionts. Applied Entomology and Zoology 44(2): 281-291.
http://dx.doi.org/10.1303/aez.2009.281
KUCZYNSKI, J; STOMBAUGH, J; WALTERS, W A; GONZÁLEZ, A;
CAPORASO, J G; KNIGHT, R (2011) Using QIIME to analyse 16S
rRNA gene sequences from microbial communities. Current
Protocols in Bioinformatics Unit 10.7: 1-20.
http://dx.doi.org/10.1002/0471250953.bi1007s36
KUNIN, V; HUGENHOLTZ, P (2010) PyroTagger: A fast, accurate
pipeline for analysis of rRNA amplicon pyrosequence data. The
Open Journal 1: 1–8.
KWONG, W K; MORAN, N A (2013) Cultivation and characterization of
the gut symbionts of honey bees and bumble bees: Snodgrassella
alvi gen. nov., sp. nov., a member of the Neisseriaceae family of
the Betaproteobacteria; and Gilliamella apicola gen. nov., sp.
nov., a member of Orbaceae fam. nov., Orbales ord. nov., a sister
taxon to the Enterobacteriales order of the Gammaproteobacteria.
International Journal of Systematic and Evolutionary Microbiology,
62: 2008-2018. http://dx.doi.org/10.1099/ijs.0.044875-0
The COLOSS BEEBOOK: gut symbionts 21
LI, J; QIN, H; WU, J; SADD, B M; WANG, X; EVANS, J D; PENG, W;
CHEN, Y (2012) The prevalence of parasites and pathogens in
Asian honey bees Apis cerana in China. PloS one 7(11):e47955.
http://dx.doi.org/10.1371/journal.pone.0047955
LONCARIC, I; HEIGL, H; LICEK, E; MOOSBECKHOFER, R; BUSSE, H J;
ROSENGARTEN, R (2009) Typing of Pantoea agglomerans isolated
from colonies of honey bees (Apis mellifera) and culturability of
selected strains from honey. Apidologie 40(1): 40-54.
http://dx.doi.org/10.1051/apido/2008062
LOY, A; MAIXNER, F; WAGNER, M; HORN, M (2007) probeBase--an
online resource for rRNA-targeted oligonucleotide probes: new
features 2007. Nucleic Acids Research 35(suppl 1): D800–4.
http://dx.doi.org/10.1093/nar/gkl856
LOZUPONE, C; KNIGHT, R (2005) UniFrac: a new phylogenetic
method for comparing microbial communities. Applied and
Environmental Microbiology 71(12): 8228–8235.
http://dx.doi.org/10.1128/AEM.71.12.8228-8235.2005
MAGURRAN, A E (2004) Measuring biological diversity. Blackwell
Publishing; Malden, Massachusetts, USA. 264 pp.
MARMUR, J (1961) A procedure for the isolation of deoxyribonucleic
acid from micro-organisms. Journal of Molecular Biology 3(2): 208
–218. http://dx.doi.org/10.1016/S0022-2836(61)80047-8
MARTINSON, V G; DANFORTH, B N; MINCKLEY, R L; RUEPPELL, O;
TINGEK, S; MORAN, N A (2011) A simple and distinctive
microbiota associated with honey bees and bumble bees.
Molecular Ecology 20(3): 619-628.
http://dx.doi.org/10.1111/j.1365-294X.2010.04959.x
MARTINSON, V G; MOY, J; MORAN, N A (2012) Establishment of
characteristic gut bacteria during development of the honey bee
worker. Applied and Environmental Microbiology 78(8): 2830–
2840. http://dx.doi.org/10.1128/AEM.07810-11
MATTILA, H R; RIOS, D; WALKER-SPERLING, V E; ROESELERS, G;
NEWTON, I L (2012) Characterization of the active microbiotas
associated with honey bees reveals healthier and broader
communities when colonies are genetically diverse. PLoS One 7
(3): e32962. http://dx.doi.org/10.1371/journal.pone.0032962
MCDONALD, D; PRICE, M N; GOODRICH, J; NAWROCKI, E P;
DESANTIS, T Z; PROBST, A; ANDERSEN, G L; KNIGHT, R;
HUGENHOLTZ, P (2012) An improved Greengenes taxonomy with
explicit ranks for ecological and evolutionary analyses of Bacteria
and Archaea. The ISME Journal 6(3): 610–618.
http://dx.doi.org/10.1038/ismej.2011.139
MCFREDERICK, Q S; WCISLO, W T; TAYLOR, D R; ISHAK, H D;
DOWD, S E; MUELLER, U G (2012) Environment or kin: whence do
bees obtain acidophilic bacteria? Molecular Ecology 21(7): 1754-1768.
http://dx.doi.org/10.1111/j.1365-294X.2012.05496.x
MCFREDERICK, Q S; CANNONE, J J; GUTELL, R R; KELLNER, K;
PLOWES, R M; MUELLER, U G (2013) Host specificity between
Hymenoptera and Lactobacilli is the exception rather than the
rule. Applied and Environmental Microbiology 79(6): 1803-1812.
MOHR, K I; TEBBE, C C (2006) Diversity and phylotype consistency of
bacteria in the guts of three bee species (Apoidea) at an oilseed
rape field. Environmental Microbiology 8(2): 258–272.
http://dx.doi.org/10.1111/j.1462-2920.2005.00893.x
MOHR, K I; TEBBE, C C (2007) Field study results on the probability
and risk of a horizontal gene transfer from transgenic herbicide-
resistant oilseed rape pollen to gut bacteria of bees. Applied
Microbiology and Biotechnology 75(3): 573-82.
http://dx.doi.org/10.1007/s00253-007-0846-7
MORAN, N A; HANSEN, A K; POWELL, J E; SABREE, Z L (2012)
Distinctive gut microbiota of honey bees assessed using deep
sampling from individual worker bees. PLoS One 7(4): e36393.
http://dx.doi.org/10.1371/journal.pone.0036393
NEVELING, D P; ENDO, A; DICKS, L M (2012) Fructophilic
Lactobacillus kunkeei and Lactobacillus brevis isolated from fresh
flowers, bees and bee-hives. Current Microbiology 65(5): 507-15.
http://dx.doi.org/10.1007/s00284-012-0186-4
NEWTON, I L; ROESELERS, G (2012) The effect of training set on the
classification of honey bee gut microbiota using the Naïve
Bayesian Classifier. BMC Microbiology 12: 221.
http://dx.doi.org/10.1186/1471-2180-12-221
OCHMAN, H; WOROBEY, M; KUO, C H; NDJANGO, J B N; PEETERS, M;
HAHN, B H; HUGENHOLTZ, P (2010) Evolutionary relationships of
wild hominids recapitulated by gut microbial communities. PLoS
Biology 8(11): e1000546.
http://dx.doi.org/10.1371/journal.pbio.1000546
OLOFSSON, T C; VÁSQUEZ, A (2008) Detection and identification of a
novel lactic acid bacterial flora within the honey stomach of the
honey bee Apis mellifera. Current Microbiology 57(4): 356-363.
http://dx.doi.org/10.1007/s00284-008-9202-0
PRESNELL, J K; SCHREIBMAN, M P; HUMASON, G L (1997) Humason's
animal tissue techniques (5th Ed.). Johns Hopkins University
Press; Baltimore, USA. 572 pp
QUAST, C; PRUESSE, E; YILMAZ, P; GERKEN, J; SCHWEER, T; YARZA,
P; PEPLIES, J; GLÖCKNER, F O (2013) The SILVA ribosomal RNA
gene database project: improved data processing and web-based
tools. Nucleic Acids Research 41(D1): D590–D596.
http://dx.doi.org/10.1093/nar/gks1219
QUINN, G P; KEOUGH, M J (2002) Experimental design and data
analysis for biologists. Cambridge University Press; Cambridge,
UK. 556 pp.
RAMETTE, A (2007) Multivariate analyses in microbial ecology. FEMS
Microbiology Ecology 62(2): 142–160.
http://dx.doi.org/10.1111/j.1574-6941.2007.00375.x
RAPPÉ, M S; GIOVANNONI, S J (2003) The uncultured microbial
majority. Annual Review of Microbiology 57: 369–394.
http://dx.doi.org/10.1146/annurev.micro.57.030502.090759
22 Engel et al.
ROZEN, S; SKALETSKY, H (2000) Primer3 on the WWW for general
users and for biologist programmers. Methods in Molecular
Biology 132: 365–386.
http://dx.doi.org/10.1385/1-59259-192-2:365
SABREE, Z L; HANSEN, A K; MORAN, N A (2012) Independent studies
using deep sequencing resolve the same set of core bacterial
species dominating gut communities of honey bees. PloS One 7
(7): e41250. http://dx.doi.org/10.1371/journal.pone.0041250
SCARDOVI, V; TROVATELLI, L D (1969) New species of bifid bacteria
from Apis mellifera L. and Apis indica F. A contribution to the
taxonomy and biochemistry of the genus Bifidobacterium.
Zentralblatt fur Bakteriologie, Parasitenkunde,
Infektionskrankheiten und Hygiene. 123: 64-88.
SCHLOSS, P D (2008) Evaluating different approaches that test
whether microbial communities have the same structure. The
ISME Journal 2(3): 265–275.
http://dx.doi.org/10.1038/ismej.2008.5
SCHLOSS, P D (2009) A high-throughput DNA sequence aligner for
microbial ecology studies. PLoS One 4(12): e8230.
http://dx.doi.org/10.1371/journal.pone.0008230
SCHLOSS, P D; GEVERS, D; WESTCOTT, S L (2011) Reducing the
effects of PCR amplification and sequencing artifacts on 16S rRNA
-based studies. PLoS One 6(12): e27310.
http://dx.doi.org/10.1371/journal.pone.0027310
SCHLOSS, P D; WESTCOTT, S L (2011) Assessing and improving
methods used in operational taxonomic unit-based approaches for
16S rRNA gene sequence analysis. Applied and Environmental
Microbiology 77(10): 3219–3226.
http://dx.doi.org/10.1128/AEM.02810-10
SCHLOSS, P D; WESTCOTT, S L; RYABIN, T; HALL, J R; HARTMANN, M;
HOLLISTER, E B; LESNIEWSKI, R A; OAKLEY, B B; PARKS, D H;
ROBINSON, C J; SAHL, J W; STRES, B; THALLINGER, G G;
VAN HORN, D J; WEBER, C F (2009) Introducing mothur: open-
source, platform-independent, community-supported software for
describing and comparing microbial communities. Applied and
Environmental Microbiology 75(23): 7537–7541.
http://dx.doi.org/10.1128/AEM.01541-09
SHANNON, C E (1948) A mathematical theory of communication. The
Bell System Technical Journal, 27: 379–423, 623–656.
SIMPSON, E H (1949) Measurement of diversity. Nature 163: 688.
http://dx.doi.org/10.1038/163688a0
SOGIN, M L; MORRISON, H G; HUBER, J A; MARK WELCH, D;
HUSE, S M; NEAL, P R; ARRIETA, J M; HERNDL, G J (2006)
Microbial diversity in the deep sea and the underexplored "rare
biosphere". Proceedings of the National Academy of Sciences of
the United States of America 103(32): 12115–12120.
http://dx.doi.org/10.1073/pnas.0605127103

SOKAL, R R; MICHENER, C (1958) A statistical method for evaluating
systematic relationships. The University of Kansas Science Bulletin
38(2): 1409–1438.
STALEY, J T; KONOPKA, A (1985) Measurement of in situ activities of
nonphotosynthetic microorganisms in aquatic and terrestrial
habitats. Annual Review of Microbiology 39: 321–346.
http://dx.doi.org/10.1146/annurev.mi.39.100185.001541
STEVENSON, B S; EICHORST, S A; WERTZ, J T; SCHMIDT, T M;
BREZNAK, J A (2004) New strategies for cultivation and detection
of previously uncultured microbes. Applied and Environmental
Microbiology 70(4): 4748-4755.
http://dx.doi.org/10.1128/AEM.70.8.4748-4755.2004
TAJABADI, N; MARDAN, M; ABDUL MANAP, M Y; SHUHAIMI, M;
MEIMANDIPOUR, A; NATEGHI, L (2011) Detection and
identification of Lactobacillus bacteria found in the honey stomach
of the giant honey bee Apis dorsata. Apidologie 42(5): 642-649.
http://dx.doi.org/10.1007/s13592-011-0069-x
TIAN, B; FADHIL, N H; POWELL, J E; KWONG, W K; MORAN, N A.
(2012) Long-term exposure to antibiotics has caused
accumulation of resistance determinants in the gut microbiota of
honey bees. mBio 3(6): e00377-12.
http://dx.doi.org/10.1128/mBio.00377-12
TRINGE, S G; HUGENHOLTZ, P (2008) A renaissance for the
pioneering 16S rRNA gene. Current Opinions in Microbiology 11
(5): 442–446. http://dx.doi.org/10.1016/j.mib.2008.09.011
VALM, A M; MARK WELCH, J L; RIEKEN, C W; HASEGAWA, Y; SOGIN,
M L; OLDENBOURG, R; DEWHIRST, F E; BORISY, G G (2011)
Systems-level analysis of microbial community organization
through combinatorial labelling and spectral imaging. Proceedings
of the National Academy of Sciences of the United States of
America 108(10): 4152–4157.
http://dx.doi.org/10.1073/pnas.1101134108
The COLOSS BEEBOOK: gut symbionts 23
VÁSQUEZ, A; FORSGREN, E; FRIES, I; PAXTON, R J; FLABERG, E;
SZEKELY, L; OLOFSSON, T C (2012) Symbionts as major
modulators of insect health: lactic acid bacteria and honey bees.
PLoS One. 7(3):e33188.
http://dx.doi.org/10.1371/journal.pone.0033188
WAGNER, M; HORN, M; DAIMS, H (2003) Fluorescence in situ
hybridisation for the identification and characterisation of
prokaryotes. Current Opinion in Microbiology 6(3): 302–309.
http://dx.doi.org/10.1016/S1369-5274(03)00054-7
WANG, Q; GARRITY, G M; TIEDJE, J M; COLE, J R (2007) Naïve
Bayesian Classifier for rapid assignment of rRNA sequences into
the new bacterial taxonomy. Applied and Environmental
Microbiology 73(16): 5261–5267.
http://dx.doi.org/10.1128/AEM.00062-07
WARNECKE, F; LUGINBUHL, P; IVANOVA, N; GHASSEMIAN, M;
RICHARDSON, T H (2007) Metagenomic and functional analysis of
hindgut microbiota of a wood-feeding higher termite. Nature 450
(7169): 560-565.
WHITTAKER, R H (1972) Evolution and measurement of species
diversity. Taxon 21(2/3): 213–251.
YILMAZ, L S; ÖKTEN, H E; NOGUERA D R (2006) Making all parts of
the 16S rRNA of Escherichia coli accessible in situ to single DNA
oligonucleotides. Applied and Environmental Microbiology 72(1):
733-744. http://dx.doi.org/10.1128/AEM/72.1.733-744.2006

Journal of Apicultural Research 52(4) © IBRA 2013