star’s presentations at the 2007 ams annual meeting · 12/01/2007 · slide 1 star’s...
TRANSCRIPT
Slide 1
STAR’s Presentations at the 2007 AMS Annual Meeting
San Antonio, TX14 – 18 January 2007
1. Hillger and Schmit2. Hillger and DeMaria3. Kuligowski4. Kuligowski and Davenport5. Lindsey and Grasso6. Maturi et al.7. Maturi et al.8. Reale and Dutton9. Schmit et al.10. Schmit et al.11. Schmit et al.12. Souiservon, Jelenak and Chang13. Sun et al.14. Wang and Cao15. Wolf, Zhou and Goldberg16. Zhan et al.17. Zheng et al.18. Zhou, Wolf and Goldberg19. Zhu et al.
AMS 2007
Slide 2
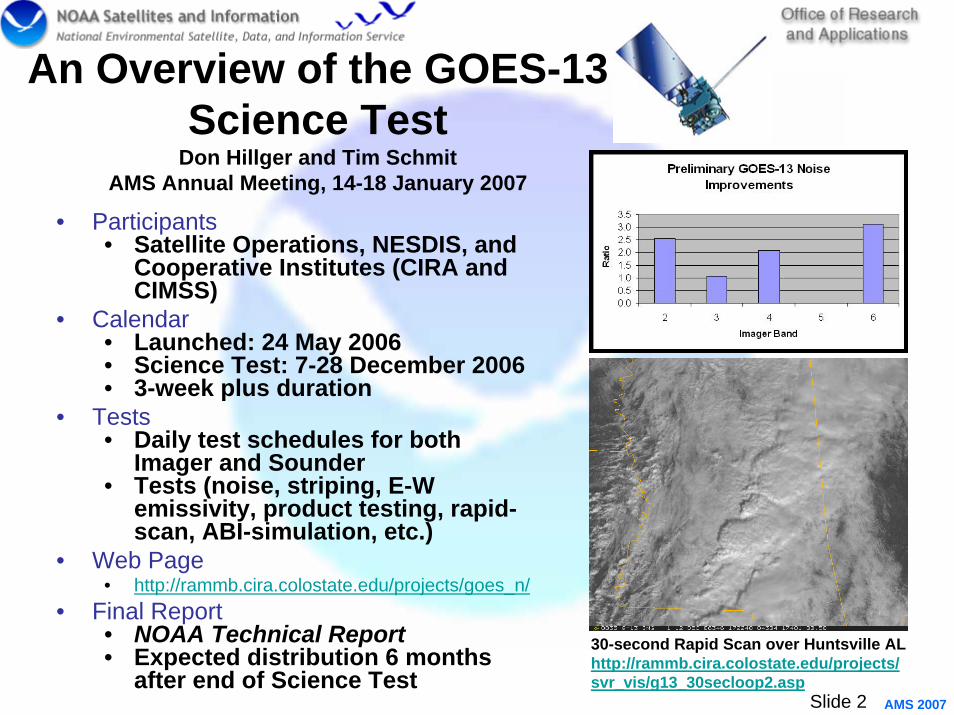
An Overview of the GOES-13 Science Test
Don Hillger and Tim SchmitAMS Annual Meeting, 14-18 January 2007
• Participants• Satellite Operations, NESDIS, and
Cooperative Institutes (CIRA and CIMSS)
• Calendar• Launched: 24 May 2006• Science Test: 7-28 December 2006• 3-week plus duration
• Tests• Daily test schedules for both
Imager and Sounder• Tests (noise, striping, E-W
emissivity, product testing, rapid-scan, ABI-simulation, etc.)
• Web Page• http://rammb.cira.colostate.edu/projects/goes_n/
• Final Report• NOAA Technical Report• Expected distribution 6 months
after end of Science Test30-second Rapid Scan over Huntsville AL http://rammb.cira.colostate.edu/projects/svr_vis/g13_30secloop2.asp
AMS 2007

Slide 3
GOES-R ABI Color Product DevelopmentDon Hillger and Mark DeMaria – AMS Annual Meeting, 14-18 January 2007
• New product development for GOES-R Advanced Baseline Imager (ABI) Risk Reduction• Initial focus
• daytime fog/stratus product• blowing-dust detection product
• Apply thee-color techniques• Utilizing MODIS and MSG proxy data
• Web-based demonstration planned• Quasi-operational product forum
• Future applications• volcanic ash and smoke monitoring
Thee-Color Product Name
Red component
Green component
Blue component
Modified 3-color fog/stratus
product
0.6 µm albedo
1.6 µm albedo
Shortwave (3.9 µm) albedo
Modified 3-color blowing-dust
product(8.7, 3.9, 10.8, and 12.0 µm)
PCI-2 (of 4 PCIs)
PCI-4 (of 4 PCIs)
PCI-3 (of 4 PCIs)
AMS 2007
Slide 4
3rd Symposium on Future National Operational Environmental Satellites:Poster – The GOES-R Hydrology Algorithm Team: Progress and Plans
R. J. Kuligowski
• GOES-R Algorithm Working Group (AWG)– Develop, demonstrate, recommend end-to-end capabilities for GOES-R
ground segment– Provide sustained post-launch validation and product enhancements
• Hydrology Algorithm Team– One of 16 Algorithm Teams– Provide recommended, demonstrated, and validated algorithms for
processing GOES-R observations into• Probability of rainfall (0-3 h)• Rainfall potential (0-3 h)• Rainfall Rate / QPE
– Members from NOAA, NASA, ESSIC, UC-Irvine• Basic Steps
– Intercompare candidate QPE and nowcasting algorithms using SEVIRI data and ground validation over Europe, Africa, South America
– Select (and modify, as needed) the best-performing algorithms– Code and document to meet operational specs
AMS 2007

Slide 5
21st Conference on Hydrology:Oral – The New NESDIS Hydro-Estimator Algorithm
R. J. Kuligowski and J. C. Davenport
• Background– Original Hydro-Estimator replaced the Auto-Estimator in 2002 as
NESDIS’ operational automated satellite rainfall algorithm– Limitations of the Hydro-Estimator sometimes necessitate significant
manual intervention by SAB analysts; much of the benefit of an automated algorithm is lost
• Approach– Gathered 6 weeks of collocated satellite and radar-rain gauge data from
May and August-October 2003– Used statistical analysis to improve selection of HE predictors and their
relationships with observed rain / no rain discrimination and rainfall rate• Results
– Far more challenging than initially anticipated, in part due to deficiencies in the assumption that cloud-top height is related to rainfall rate
– Improved version is nearly complete and almost ready for operational testing AMS 2007

Slide 6
Modeling GOES-R 6.185-10.35 µm brightness temperature differences above cold thunderstorm tops
Daniel T. Lindsey, NOAA/NESDIS/RAMMBLouie Grasso, CIRA
• Synthetic imagery has been created by using a cloud model and an observational operator to simulate a severe weather outbreak from 8 May 2003
• GOES-R ABI’s 6.185 and 10.35 µm channels are shown above, and regions where their difference is positive are colored red (above right)
• This is an example of a simulated GOES-R product; it is very important that additional products of this nature are created before the launch of GOES-R
• Sensitivity tests also performed to explain the mechanism behind positive differences (shown on poster)
AMS 2007

Slide 7
Threshold-based cloud mask
23rd Interactive Information Processing Systems (IIPS) Satellite Applications Session:ORAL– Bayesian Cloud Mask for GOES-SST Operational Products
E. Maturi, A. Harris, C. Merchant, C. Old, J. MittazApplication of Bayes Theorem to…• Estimate the probability of a
particular pixel being clear of cloud • Inputs include:
– Satellite observed brightness temperature (BT)
– A measure of local texture– Channel BTs calculated for the given
location and view angle• Applies
– NCEP GFS Surface and upper air data
– CRTM fast radiative transfer model • Result is used in generation of
– Operational GOES-11/12 SST Products
• Future improvements– Radiance bias correction to improve
match between modeled & observed BTs (also improves SST retrieval)
– Extension to SEVIRI and ABI
AMS 2007
Bayesian cloud mask

Slide 8
Third Symposium on Future National Operational Environmental Satellites:P1.33– Adapting Operational GOES-SST Algorithms to MSG-SEVIRI for GOES-R Risk Reduction
E. Maturi, A. Harris, W. Smith, J. Mittaz
• GOES-SST Algorithms extended to SEVIRI data– Radiative Transfer Methodology (RTM)– Bayesian Cloud Mask– Radiance Bias Correction techniques
• Methods for RT Bias Correction– Expected vs. observed brightness temperatures distributions as modeled using NWP
fields– RTM and cross-instrument comparisons of hyperspectral and broadband radiometer
data• Test on AIRS/MODS and IASI/AVHRR
• Validation– Radiance data will be collected, reprocessed to SST and compared to the operational
product• Results
– Operational MSG-SEVIRI SST Algorithms (including radiance bias methodology) in place to test on ABI data when they become available
AMS 2007

Slide 9
3.5 A Candidate GCOS Atmospheric Reference Observations Network (GARON) Consisting of ARM, BSRN and WMO Reporting Sites and Satellite /
In-situ Data Collection Strategies
* Tony RealeNOAA/NESDISWashington DC
Ellsworth G. DuttonNOAA, Earth System Research Laboratory, Global Monitoring Division
Boulder, CO 80305
87th AMS Annual Meeting, San Antonio14th Symposium on Meteorological Observation and Instrumentation
2:30 PM Tuesday, Jan 16th
AMS 2007

Slide 10
Reference Network Mandate: Characterize measurements? Synchronized data?Monitor Climate?
NOAA/GCOS Workshops (Boulder-05, Seattle 06) to define reference network for Climate…
AMS 2007

Slide 11
Third Symposium: Future National Operational Environmental Satellite Systems:
Oral – The ABI (Advanced Baseline Imager) on GOES-RTimothy J. Schmit, J. Gurka, W. P. Menzel, and M. M. Gunshor
• The ABI improves over the current GOES Imager -- spectral, temporal, spatial and radiometric performance.
• Improved Spectral Coverage– 16 bands
• Improved Spatial resolution – 0.5 – 2 km
• Improved Spatial coverage– Routine Full disk/CONUS scans
• Improved Temporal coverage– 5 times faster scanning
• Improved Radiometrics– Visible on-orbit calibration Full Disk with stepped-edge
16 spectral bands
AMS 2007

Slide 12
Third Symposium: Future National Operational Environmental Satellite Systems Poster – The GOES-R ABI (Advanced Baseline Imager) and continuation of
GOES-N class sounder productsTimothy J. Schmit, James J. Gurka, Jun Li, Kevin Schrab
With no HES (HyperspectralEnvironmental Suite) on GOES-R, the question becomes how to produce legacy GOES Sounder products. These can be generated from ABI data with comparable attributes as today’s sounder, when using short-term numerical model forecasts. High-spectral resolution IR data are still needed to improve the products.
Relative vertical information. In general, the moisture content information is similar between the ABI and the current GOES Sounder. This information content analysis does not account for any spatial or temporal differences.
AMS 2007

Slide 13
Third Symposium: Future National Operational Environmental Satellite Systems:
Poster – GOES-R BASELINE INSTRUMENTSTimothy J. Schmit, James J. Gurka, Thomas M. Renkevens, Mat Gunshor
and Jun LiGOES-R baseline instruments:
• ABI Advanced Baseline Imager • GLM Geostationary Lightning Mapper • SIS Solar Imaging Suite • SEISS Space Environment In-Situ
Suite • MAG Magnetometer • AUX Auxiliary Services
LRIT--Low Rate Information transmission EMWIN--Emergency Managers Weather
Information Network DCS--Data Collection System SAR-- Search and Rescue
The great amount of information from the GOES-R series will both offer a continuation of current product and services, and also allow for improved or new capabilities.
Simulated SXI (Solar X-ray Imager)
image: (Courtesy of SOHO EIT, a joint
NASA/ESA program; and Steve Hill/NOAA
SEC).
Lightning Climatology, NASA
HES de-manifested from GOES-RAMS 2007

Slide 14
11th Symposium on Integrated Observing and Assimilation Systems for the Atmosphere, Oceans, and Land Surface:
Poster – An Ocean Surface Wind Vector Model For WindSat Microwave Radiometer Using Dual-Polarization
S. Soisuvarn, Z. Jelenak and P. S. Chang• Objective
– Develop GMF using WindSat’s V- and H-Pol brightness temperature measurement (10,18 and 37 GHz).
– GMF are a function of SST, wind speed and wind direction.
• Data and Approach– QuikSCAT wind vector used as a surface
truth.– SST surface truth from (1) GDAS and (2)
WindSat’s retrieved.– TB combination (A*TBV-TBH) less
sensitive to the atmosphere.• A parameter being a function of frequency,
brightness temp, and SST• Conclusion and Future Work
– WindSat’s retrieved SST may used in the GMF without external source
– Implement the GMF with 3rd and 4th
Stokes’ parameter wind vector retrieval.
AMS 2007(1) (2)
10 GHz
18 GHz
37 GHz

Slide 15
14th Symposium on Meteorological Observation & Instrumentation Talk – MODIS Infrared channel Spectral response Function calibration with Co-located AIRS
Haibing Sun, W. Wolf, C. Barnet, Lihang. Zhou and M. Goldberg
-30.9 -30.8 -30.7 -30.6 -30.5 -30.4 -30.3 -30.2 -30.1 -30
40.1
40.2
40.3
40.4
-30.9 -30.8 -30.7 -30.6 -30.5 -30.4 -30.3 -30.2 -30.1 -30
40.1
40.2
40.3
40.4
0.1
0.2
0.3
0.4
0.5
0.6
0.7
0.8
0.9
1
0.1
0.2
0.3
0.4
0.5
0.6
0.7
0.8
0.9
-30.9 -30.8 -30.7 -30.6 -30.5 -30.4 -30.3 -30.2 -30.1 -30Collocated MODIS observation
40.1
40.2
40.3
40.4
Simplized AIRS EFOV SRF .Fp=1
Simulated AIRS EFOV SRF Fp=1
WRadRad ii
AIRSMODIS ∑=
AMS 2007
700 705 710 715 720 725 730 735 740MODIS channel 35 Spectrum
40
60
80
100
120
AIR
S R
adia
nce
0.00
0.20
0.40
0.60
0.80
1.00
MO
DIS
IR
Cha
nnel
(35)
R
SF
MODIS Channel 35 Spectrum Response Function
SPEC35
0 10 20 30 40 50 60 70 80 90 100 110 120Channel 36 Modis( AIRS channel)
0.000
0.200
0.400
0.600
0.800
1.000Retrieval with constraintComparing with simulated noise free data and real dataU=0.05 AVE:1 SVD:6
U=0.05 AVE:1 SVD:6
Real data U=0.05 AVE:1 SVD:8
SVD: 6==> 8With Less constraint, More 'high frequenvy' component can be kept.
Algorithm:Individual MODIS IR channel :
The noise constraint is necessary
and very important in this algorithms.
Data set Optimization: Co-located MODIS–AIRS Date/ Uniform sense. Apply the AIRS spatial response function
Deficient Matrix Equation Optimization:
Constraint Retrieval algorithm : Constraint Retrieval/Selection.

Slide 16
14th Symposium on Meteorological Observation and Instrumentation:Presentation – On-orbit Verification of Infrared Sounders on Metop-A
Likun Wang and Changyong Cao
HIRS nadir
AIRS Nadir
• Using Simultaneous Nadir Overpass (SNO) observations – AIRS vs. HIRS/Metop-A– AIRS vs. IASI– Occur in the polar regions – Mid to low end of BT range– Preliminary results
• Inter-sensor calibration– HIRS vs. IASI on Metop-A– On the same satellite– Covers all BT range
• Purpose: – Better characterize the biases
between instruments– Establish calibration links for
infrared sounding data including historical HIRS data AIRS convolved HIRS Ch5 HIRS Ch 5
AMS 2007

Slide 17
Third Symposium on Future National Operational Environmental Poster 1.19 – GOES-R AWG Integration Team (AIT): Interface with the
System Prime W. W. Wolf, Lihang Zhou, M. Goldberg
• Interface with the System Prime– Coordinate activities between the AWG and the System Prime.– Deliver/Migrate AWG product systems to the System Prime.– Work with the System Prime to test the migrated product systems.– Aid the System Prime with the integration of the product systems into
the GOES-R operational framework.
• AIT Will Deliver Product Systems and Will Provide:– System flowcharts.– Code breakdowns.– Points of parallelization within the code.– Combined product systems.
• Information Required by the AIT from the System Prime:– Interface between AWG Product Systems and the operational
framework.– Error handling calls.– Tools used in the operational environment.– Specific operational functions.
AMS 2007
Slide 18
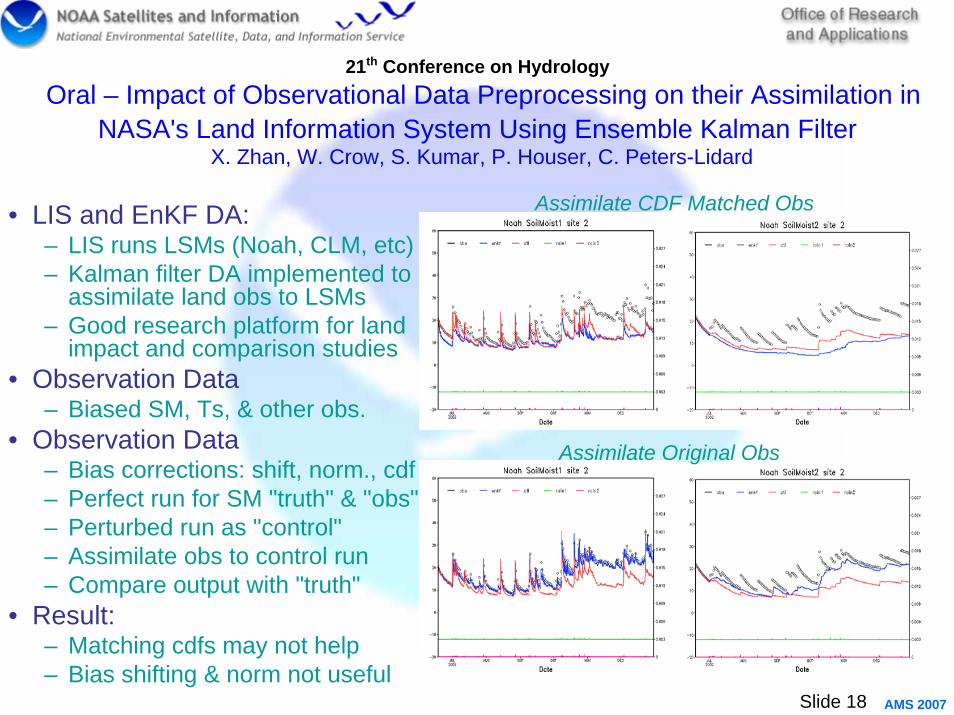
21th Conference on HydrologyOral – Impact of Observational Data Preprocessing on their Assimilation in
NASA's Land Information System Using Ensemble Kalman FilterX. Zhan, W. Crow, S. Kumar, P. Houser, C. Peters-Lidard
• LIS and EnKF DA:– LIS runs LSMs (Noah, CLM, etc)– Kalman filter DA implemented to
assimilate land obs to LSMs– Good research platform for land
impact and comparison studies• Observation Data
– Biased SM, Ts, & other obs.• Observation Data
– Bias corrections: shift, norm., cdf– Perfect run for SM "truth" & "obs"– Perturbed run as "control"– Assimilate obs to control run– Compare output with "truth"
• Result:– Matching cdfs may not help– Bias shifting & norm not useful
AMS 2007
Assimilate CDF Matched Obs
Assimilate Original Obs

Slide 19
11th Symposium on Integrated Observing and Assimilation Systems for the Atmosphere, Oceans, and Land Surface (IOAS-AOLS):
Oral – Applications in Exploiting Synthetic Aperture Radar for Hurricane Initialization and SimulationW. Zheng, X. Li, C-Z. Zou and W. Pichel
• SAR wind retrieval with CMOD5:– SAR image: fine structure– NOGAPS: misplace the location– MM5 & AOML: similar but some
difference– C-band SAR: two heavy rain
bands cause higher radar backscatter (red dots), and no significant impacts over other region
• Impact study for Rita case– Improvement of model
initialization with SAR wind retrieval (WRF-3DVAR)
– 60-h simulations with WRF
AMS 2007
Slide 20
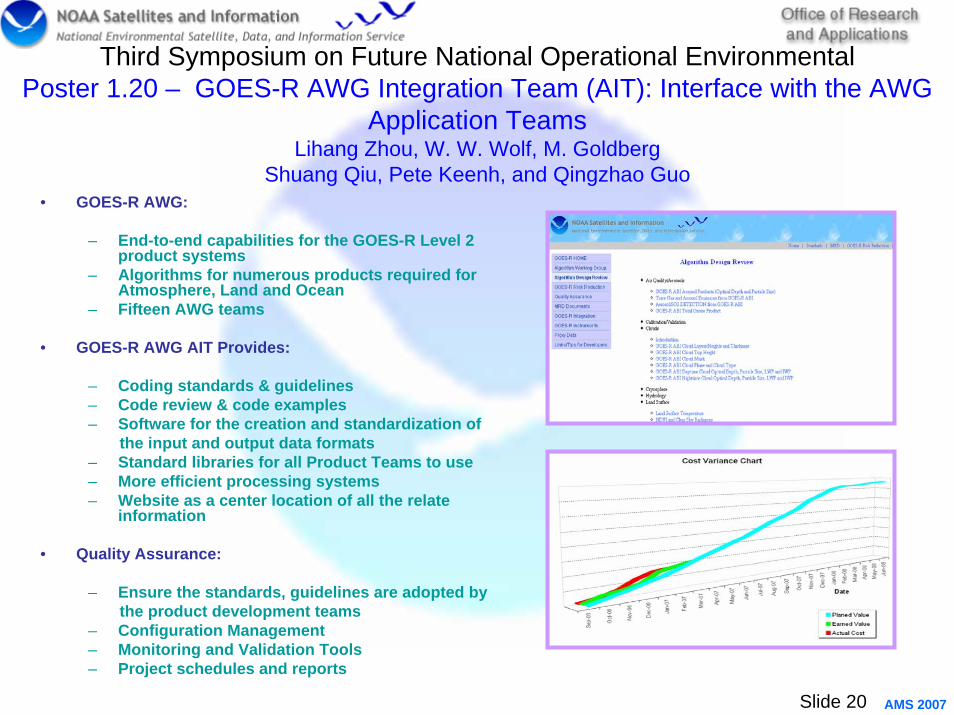
Third Symposium on Future National Operational Environmental Poster 1.20 – GOES-R AWG Integration Team (AIT): Interface with the AWG
Application Teams Lihang Zhou, W. W. Wolf, M. Goldberg
Shuang Qiu, Pete Keenh, and Qingzhao Guo• GOES-R AWG:
– End-to-end capabilities for the GOES-R Level 2 product systems
– Algorithms for numerous products required for Atmosphere, Land and Ocean
– Fifteen AWG teams
• GOES-R AWG AIT Provides:
– Coding standards & guidelines– Code review & code examples– Software for the creation and standardization of
the input and output data formats– Standard libraries for all Product Teams to use– More efficient processing systems– Website as a center location of all the relate
information
• Quality Assurance:
– Ensure the standards, guidelines are adopted by the product development teams
– Configuration Management– Monitoring and Validation Tools– Project schedules and reports
AMS 2007

Slide 21
Third Symposium on Future National Operational Environmental Satellites :Poster – GOES-R Proxy Data Management System
T. Zhu, F. Weng, M. Kim, M. Goldberg, CIRA Team, P. Dong, B. Ruston
– delivery of simulation and observation-based GOES- R levele1B data,
– development of visualization tools for various formats of proxy data,
– design of a GOES-R Observing System Simulation Experiment (OSSE) framework for demonstrating the potential impacts of GOES-R data on NWP forecasts.
AMS 2007
Proxy Data Integration andAssessments
Simulationbased
Observationbased
VIIRS to ABI
SEVIRI to ABI
ABI Simulated Scene from Retrievals
MODIS toABI
ABI Simulated
Scene from NWP
• GOES-R Proxy Dataset– MSG SEVIRI data,– ABI simulated from SEVIRI,– GOES-08/10 matchup with SURFRAD, – MODIS land surface emissivity daily,– AERONET and MODIS mtachup data,– Cloudsat data matched with ECMWF and MONDIS,– Mesoscale model (MM5) simulation data.
Centralized Proxy Data Concept
• Vison• The GOES-R Algorithm Working Group (AWG) program requests a high quality of proxy
data for algorithm developments, testing and assessments. The central tasks in the proxy data management system will be: