stat 13, intro. to statistical methods for the life and ...frederic/13/sum17/day04.pdfstat 13,...
TRANSCRIPT

Stat 13, Intro. to Statistical Methods for the Life and Health Sciences.
1. Hand in hw1.2. Summary of song time estimate and single quantitative variable testing. 3. Significance level, type I and type II errors. 4. Power. 5. Confidence Intervals for a proportion and the dog sniffing cancer example.6. CIs for a proportion and the Affordable Care Act example. 7. CIs for a population mean and the used cars example.
Start reading chapter 4.http://www.stat.ucla.edu/~frederic/13/sum17 .HW2 is due Tue Jul 18 and is problems 2.3.15, 3.3.18, and 4.1.23.
1

1.HandinHW1!2.Summaryofsongtimeexample.• Whenwetestasinglequantitativevariable,ourhypothesishasthefollowingform:– H0:μ=somenumber– Ha:μ≠somenumber,µ<somethingorµ>something.
• Wecangetourdata(ormean,samplesize,andSDforourdata)andusetheTheory-BasedInferencetodeterminethep-value.
• Thep-valuewegetwiththistesthasthesamegeneralmeaningasfromatestforasingleproportion.

3.Significancelevel,Type1andType2errors
Section2.3

SignificanceLevel
• Wethinkofap-valueastellingussomethingaboutthestrengthofevidencefromatestofsignificance.
• Thelowerthep-valuethestrongertheevidence.• Somepeoplethinkofthisinmoreblackandwhiteterms.Eitherwerejectthenullornot.

SignificanceLevel
• Thevaluethatweusetodeterminehowsmallap-valueneedstobetoprovideconvincingevidencewhetherornottorejectthenullhypothesisiscalledthesignificancelevel.
• Werejectthenullwhenthep-valueislessthanorequalto(≤)thesignificancelevel.
• ThesignificancelevelisoftenrepresentedbytheGreekletteralpha,α.

SignificanceLevel
• Typicallyweuse0.05foroursignificancelevel.Thereisnothingmagicalabout0.05.Wecouldsetupourtesttomakeit– hardertorejectthenull(smallersignificancelevelsay0.01)or
– easier(largersignificancelevelsay0.10).

TypeIandTypeIIerrors
• Inmedicaltests:– AtypeIerrorisafalsepositive.(concludesomeonehasadiseasewhentheydon’t.)
– AtypeIIerrorisafalsenegative.(concludesomeonedoesnothaveadiseasewhentheyactuallydo.)
• Thesetypesoferrorscanhaveverydifferentconsequences.

TypeIandTypeIIErrors
•

TypeIandTypeIIerrors

TheprobabilityofaTypeIerror
• TheprobabilityofatypeIerroristhesignificancelevel.
• Supposethesignificancelevelis0.05.Ifthenullistruewewouldrejectit5%ofthetimeandthusmakeatypeIerror5%ofthetime.
• Ifyoumakethesignificancelevellower,youhavereducedtheprobabilityofmakingatypeIerror,buthaveincreasedtheprobabilityofmakingatypeIIerror.

TheprobabilityofaTypeIIerror• TheprobabilityofatypeIIerrorismoredifficulttocalculate.
• Infact,theprobabilityofatypeIIerrorisnotevenafixednumber.Itdependsonthevalueofthetrueparameter.
• TheprobabilityofatypeIIerrorcanbeveryhighif:– Thetruevalueoftheparameterandthevalueyouaretestingareclose.
– Thesamplesizeissmall.

4.Power.
• Poweris1– P(TypeIIerror).Usuallyexpressedasafunctionofµ.
• RecallTypeIandTypeIIerrors.– AtypeIerrorisafalsepositive.Rejectingthenullwhenitistrue.
– AtypeIIerrorisafalsenegative.Failingtorejectthenullwhenthenullisfalse.

Power• Theprobabilityofrejectingthenullhypothesiswhenitisfalseiscalledthepower ofatest.
• Poweris1minustheprobabilityoftypeIIerror.• Wewantatestwithhighpowerandthisisaidedby– Alargeeffectsize,i.e.trueµfarfromtheparameterinthenullhypothesis.
– Alargesamplesize.– Asmallstandarddeviation.– Significancelevel.Ahighersign.levelmeansgreaterpower.ThedownsideisthatyouincreasethechanceofmakingatypeIerror.

5.Estimationandconfidenceintervals.
Chapter3
ChapterOverview
• Sofar,wecanonlysaythingslike– “Wehavestrongevidencethatthelong-runfrequencyofdeathwithin30daysafterahearttransplantatSt.George'sHospitalisgreaterthan15%.”
– “Wedonothavestrongevidencekidshaveapreferencebetweencandyandatoywhentrick-or-treating.”
• Wewantamethodthatsays– “Ibelieve68to75%ofallelectionscanbecorrectlypredictedbythecompetentfacemethod.”

ConfidenceIntervals
• Intervalestimatesofapopulationparameterarecalledconfidenceintervals.
• Wewillfindconfidenceintervalsthreeways.– Throughaseriesoftestsofsignificancetoseewhichproportionsareplausiblevaluesfortheparameter.
– Usingthestandarddeviationofthesimulatednulldistributiontohelpusdeterminethewidthoftheinterval.
– Throughtraditionaltheory-basedmethods.
StatisticalInference:ConfidenceIntervals
Section3.1

CanDogsSniffOutCancer?
Section3.1

CanDogsSniffOutCancer?Sonoda etal.(2011).Marine,adogoriginallytrainedforwaterrescues,wastestedtoseeifshecoulddetectifapatienthadcolorectalcancerbysmellingasampleoftheirbreath.• Shefirstsmellsabagfromapatientwithcolorectalcancer.
• Thenshesmells5othersamples;4fromnormalpatientsand1 fromapersonwithcolorectalcancer
• Sheistrainedtositnexttothebagthatmatchesthescentoftheinitialbag(the“cancerscent”)bybeingrewardedwithatennisball.

CanDogsSniffOutCancer?InSonoda etal.(2011).Marinewastestedin33trials.• Nullhypothesis:Marineisrandomlyguessing
whichbagisthecancerspecimen(𝜋 =0.20)• Alternativehypothesis:Marinecandetectcancer
betterthanguessing(𝜋 >0.20)
𝜋 representsherlong-runprobabilityofidentifyingthecancerspecimen.

CanDogsSniffOutCancer?• 30outof33trialsresultedinMarinecorrectlyidentifyingthebagfromthecancerpatient
• Sooursampleproportionis
�̂� = %&%%≈ 0.909
• DoyouthinkMarinecandetectcancer?• Whatsortofp-valuewillweget?

CanDogsSniffOutCancer?Oursampleproportionliesmorethan10standarddeviationsabovethemeanandhenceourp-value~ 0.

CanDogsSniffOutCancer?
• CanweestimateMarine’slongrunfrequencyofpickingthecorrectspecimen?
• Sinceoursampleproportionisabout0.909,itisplausiblethat0.909isavalueforthisfrequency.Whataboutothervalues?
• IsitplausiblethatMarine’sfrequencyisactually0.70andshehadaluckyday?
• Isasampleproportionof0.909unlikelyif𝜋 =0.70?

CanDogsSniffOutCancer?
• H0:𝜋 =0.70 Ha:𝜋 ≠0.70• Wegetasmallp-value(0.0090)sowecanessentiallyruleout0.70asherlongrunfrequency.

CanDogsSniffOutCancer?
• Whatabout0.80?• Is0.909unlikelyif𝜋 =0.80?

CanDogsSniffOutCancer?
• H0:𝜋 =0.80Ha:𝜋 ≠0.80• Wegetalargep-value(0.1470)so0.80isaplausible valueforMarine’slong-runfrequency.

Developingarangeofplausiblevalues
• Ifwegetasmallp-value(likewedidwith0.70)wewillconcludethatthevalueunderthenullisnotplausible.Thisiswhenwerejectthenullhypothesis.
• Ifwegetalargep-value(likewedidwith0.80)wewillconcludethevalueunderthenullisplausible.Thisiswhenwecan’trejectthenull.
Developingarangeofplausiblevalues
• Onecouldusesoftware(liketheone-proportionappletthebookrecommends)tofindarangeofplausiblevaluesforMarine’slongtermprobabilityofchoosingthecorrectspecimen.
• Wewillkeepthesampleproportionthesameandchangethepossiblevaluesof𝜋.
• Wewilluse0.05asourcutoffvalueforifap-valueissmallorlarge.(Recallthatthisiscalledthesignificancelevel.)

CanDogsSniffOutCancer?• Itturnsoutvaluesbetween0.761and0.974areplausiblevaluesforMarine’sprobabilityofpickingthecorrectspecimen.
Probabilityundernull 0.759 0.760 0.761 0.762
……0.973 0.974 0.975 0.976
p-value 0.042 0.043 0.063 0.063 0.059 0.054 0.049 0.044
Plausible? No No Yes Yes ………Yes Yes Yes No No

CanDogsSniffOutCancer?
• (0.761,0.974)iscalledaconfidenceinterval.• Sinceweused5%asoursignificancelevel,thisisa95%confidenceinterval.(100%− 5%)
• 95%istheconfidencelevelassociatedwiththeintervalofplausiblevalues.

CanDogsSniffOutCancer?
• Wewouldsayweare95%confidentthatMarine’sprobabilityofcorrectlypickingthebagwithbreathfromthecancerpatientfromamong5bagsisbetween0.761and0.974.
• ThisisamoreprecisestatementthanourinitialsignificancetestwhichconcludedMarine’sprobabilitywasmorethan0.20.
• Sidenote: We do not say P{π is in (.761, .974)} = 95%, because π is not random. The interval is random, and would change with a different sample. If we calculate an interval this way, then P(interval contains π) = 95%.

ConfidenceLevel• Ifweincreasetheconfidencelevelfrom95%to99%,whatwillhappentothewidthoftheconfidenceinterval?

CanDogsSniffOutCancer?
• Sincetheconfidencelevelgivesanindicationofhowsurewearethatwecapturedtheactualvalueoftheparameterinourinterval,tobemoresureourintervalshouldbewider.
• Howwouldweobtainawiderintervalofplausiblevaluestorepresenta99%confidencelevel?– Usea1%significancelevel inthetests.– Valuesthatcorrespondto2-sidedp-valueslargerthan0.01shouldnowbeinourinterval.

6.2SDandTheory-BasedConfidenceIntervalsforaSingleProportionand
ACAexample.Section3.2

Introduction• Section3.1foundconfidenceintervalsbydoingrepeatedtestsofsignificance(changingthevalueinthenullhypothesis)tofindarangeofvaluesthatwereplausibleforthepopulationparameter(longrunprobabilityorpopulationproportion).
• Thisisaverytediouswaytoconstructaconfidenceinterval.
• Wewillnowlookattwootherswaytoconstructconfidenceintervals[2SD andTheory-Based].

TheAffordableCareActExample3.2

TheAffordableCareAct
• ANovember2013Galluppollbasedonarandomsampleof1,034adultsaskedwhethertheAffordableCareActhadaffectedtherespondentsortheirfamily.
• 69%ofthesample respondedthattheacthadnoeffect. (Thisnumberwentdownto59%inMay2014and54%inOct2014.)
• WhatcanwesayabouttheproportionofalladultAmericansthatwouldsaytheacthadnoeffect?

TheAffordableCareAct
• Wecouldconstructaconfidenceintervaljustlikewedidlasttime.
• Wefindweare95%confidentthattheproportionofalladultAmericansthatfeltunaffectedbytheACAisbetween0.661and0.717.
Probabilityundernull 0.659 0.660 0.661 ………… 0.717 0.718 0.719
Two-sidedp-value 0.0388 0.0453 0.0514 ………… 0.0517 0.0458 0.0365
Plausiblevalue(0.05)? No No Yes ………… Yes No No
Shortcut?
• Themethodweusedlasttimetofindourintervalofplausiblevaluesfortheparameteristediousandtimeconsuming.
• Mighttherebeashortcut?• Oursampleproportionshouldbethemiddleofourconfidenceinterval.
• Wejustneedawaytofindouthowwideitshouldbe.

2SDmethod
• Whenastatisticisnormallydistributed,about95%ofthevaluesfallwithin2standarddeviationsofitsmeanwiththeother5%outsidethisregion

2SDmethod
• Sowecouldsaythataparametervalueisplausibleifitiswithin2standarddeviations(SD)fromourbestestimateoftheparameter,ourobservedsamplestatistic.
• Thisgivesusthesimpleformulafora95%confidenceintervalof
𝒑, ± 𝟐𝑺𝑫

WheredowegettheSD?
• NulldistributionforACAwithπ =0.5.
2SDmethod
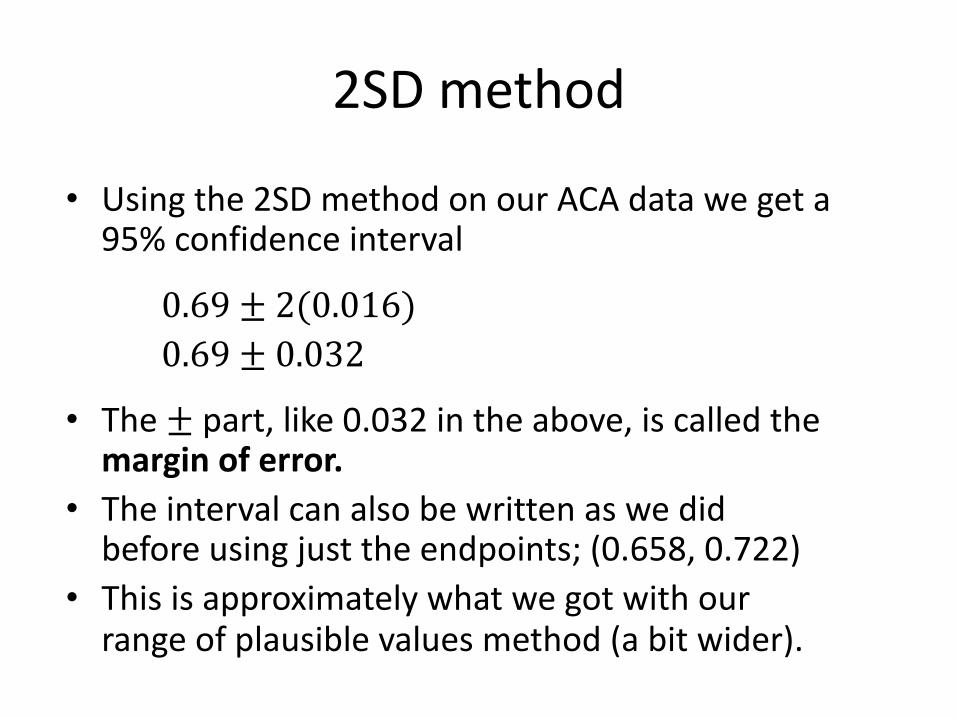
• Usingthe2SDmethodonourACAdatawegeta95%confidenceinterval
0.69 ± 2(0.016)0.69 ± 0.032
• The± part,like0.032intheabove,iscalledthemarginoferror.
• Theintervalcanalsobewrittenaswedidbeforeusingjusttheendpoints;(0.658,0.722)
• Thisisapproximatelywhatwegotwithourrangeofplausiblevaluesmethod(abitwider).

Theory-BasedMethods
• The2SDmethodonlygivesusa95%confidenceinterval
• Ifwewantadifferentlevelofconfidence,wecanusetherangeofplausiblevalues(hard)ortheory-basedmethods(easy).
• Thetheory-basedmethodisvalidprovidedthereareatleast10successesand10failuresinyoursample.
Theory-BasedMethods
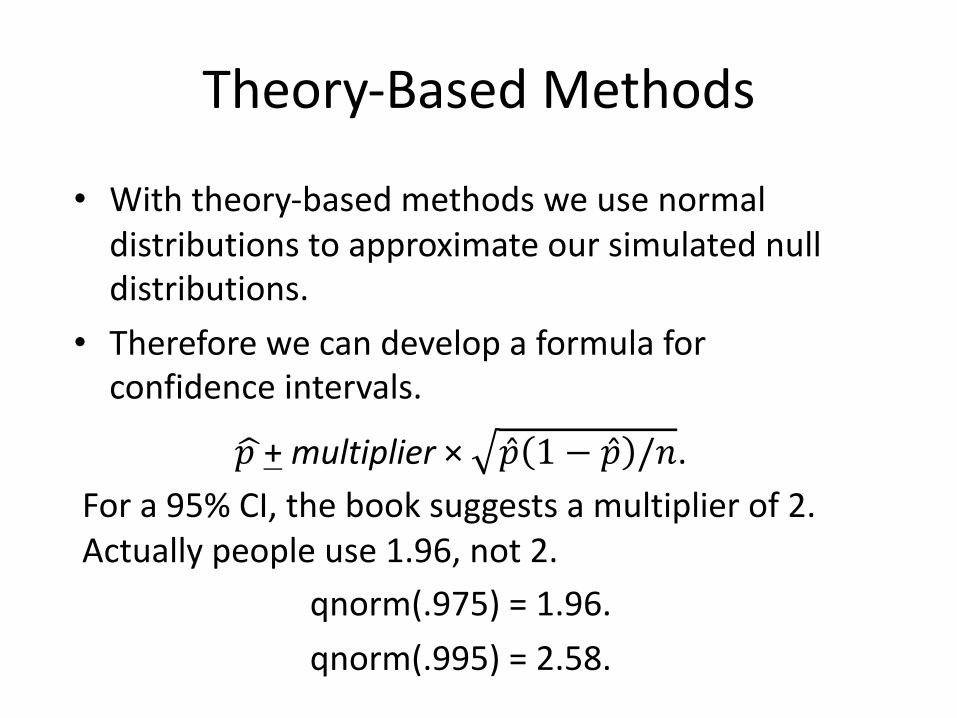
• Withtheory-basedmethodsweusenormaldistributionstoapproximateoursimulatednulldistributions.
• Thereforewecandevelopaformulaforconfidenceintervals.
𝑝,+multiplier × �̂� 1 − �̂� /𝑛� .Fora95%CI,thebooksuggestsamultiplierof2.Actuallypeopleuse1.96,not2.
qnorm(.975)=1.96.qnorm(.995)=2.58.

• Let’scheckoutthisexampleusingthetheory-basedmethod.
• Remember69%of1034respondentswerenotaffected.
𝑝,+multiplier × �̂� 1 − �̂� /𝑛�
=69%+ 2x .69(1 − .69)/1034�
=69%+ 2.88%.With1.96insteadof2itwouldbe69%+ 2.82%.
7.2SDandTheory-BasedConfidenceIntervalsforaSingleMeanandused
carexample.Section3.3

UsedCars
Example3.3

UsedCars
Thefollowinghistogramdisplaysdataforthesellingpriceof102HondaCivicsthatwerelistedforsaleontheInternetinJuly2006.

UsedCars• Theaverageofthissampleis�̅� =$13,292withastandarddeviationofs =$4,535.
• Whatcanwesayaboutμ,theaveragepriceofallusedHondaCivics?

UsedCars• Whileweshouldbecautiousaboutoursamplebeingrepresentativeofthepopulation,let’streatitassuch.
• μmightnotequal$13,292(thesamplemean),butitshouldbeclose.
• Todeterminehowclose,wecanconstructaconfidenceinterval.

ConfidenceIntervals• Rememberthebasicformofaconfidenceintervalis:
statistic± multiplier× (SDofstatistic)
SDofstatisticisalsocalledStandardError(SE).• Inourcase,thestatisticis�̅� sowearewriteour2SDconfidenceintervalas:
�̅� ± 2(SE)

ConfidenceIntervals• ItisimportanttonotethattheSDof�̅� (theSE)andtheSDofoursample(s =$4,535)arenotthesame.
• Thereismorevariabilityinthedata(thecar-to-carvariability)thaninsamplemeans.
• TheSEis𝑠 𝑛�⁄ .Whichmeanswecanwritea2SDconfidenceintervalas:
�̅� ± 2×𝑠𝑛�
• Thismethodwillbevalidwhenthenulldistributionisbell-shaped.

SummaryStatistics
• Atheory-basedconfidenceintervalisquitesimilarexceptitusesamultiplierthatisbasedonat-distributionandisdependentonthesamplesizeandconfidencelevel.
• Fortheory-basedconfidenceintervalforapopulationmean(calledaone-samplet-interval)tobevalid,theobservationsshouldbe(approx.)independent,andeitherthepopulationshouldbenormalornshouldbelarge.Checkthesampledistributionforskewandasymetry.

ConfidenceIntervals
• Wefindour95%CIforthemeanpriceofallusedHondaCivicsisfrom$12,401.20to$14,182.80.
• NoticethatthisisamuchnarrowerrangethanthepricesofallusedCivics.
• Fora99%confidenceinterval,itwouldbewider.Themultiplierwouldbe2.6insteadof1.96.

FactorsthatAffecttheWidthofaConfidenceInterval
Section3.4

FactorsAffectingConfidenceIntervalWidths
• Levelofconfidence(e.g.,90%vs.95%)– Asweincreasetheconfidencelevel,weincreasethewidthoftheinterval.
• Samplesize– Assamplesizeincreases,variabilitydecreasesandhencethestandarderrorwillbesmaller.Thiswillresultinanarrowerinterval.
• Samplestandarddeviation– Alargerstandarddeviation,s,willyieldawiderinterval.
– Forsampleproportions,widerintervalswhen�̂� iscloserto0.5. s=√[�̂� (1-�̂�)].

LevelofConfidence
• Ifwehaveawiderinterval,weshouldbemoreconfidentthatwehavecapturedthepopulationproportionorpopulationmean.
• Wecouldseethiswithrepeatedtestsofsignificance.– Ahigherconfidencelevelcorrespondstoalowersignificancelevel,andonemustgofarthertotheleftandfarthertotherightinourtablestogetourconfidenceinterval.

SampleSize
• Weknowassamplesizeincreases,thevariability(andthusstandarddeviation)inournulldistributiondecreases
n =90(SD=0.054) n =361(SD=0.026) n =1444(SD=0.013)Samplesize 90 361 1444
SDofnulldistr. 0.053 0.027 0.013
Margin of error 2xSD=0.106 2× SD=0.054 2× SD=0.026
Confidenceinterval (0.091,0.303) (0.143,0.251) (0.171,0.223)

SampleSize• (Witheverythingelsestayingthesame)increasingthesamplesizewillmakeaconfidenceintervalnarrower.
Notice:• Theobservedsampleproportionisthemidpoint.(thatwon’tchange)
• Marginoferrorisamultipleofthestandarddeviation soasthestandarddeviationdecreases,sowillthemarginoferror.

Valueof𝑝B(orthevalueusedforπ underthenull)
• Asthevaluethatisusedunderthenullgetsfartherawayfrom0.5,thestandarddeviationofthenulldistributiondecreases.
• Whenthisstandarddeviationisusedinthe2SDmethod,theintervalgetsgraduallynarrower.

StandardDeviation• Supposewearetakingrepeatedsamplesofapopulation.• Howdoweestimatewhatthestandarddeviationofthenull
distribution(standarderror)willbe?𝑠 𝑛�⁄ .
Meansofsamplesofsize10.

StandardDeviation
• TheSDofthenulldistributionisapproximatedby𝑠 𝑛�⁄ .• Rememberthat2(𝑠 𝑛)�⁄ isapproximatelythemarginoferror
fora95%confidenceinterval,soasthestandarddeviationofthesampledata(s)increasessodoesthewidthoftheconfidenceinterval.
• Intuitivelythisshouldmakesense,morevariabilityinthedatashouldbereflectedbyawiderconfidenceinterval.

FormulasforTheory-BasedConfidenceIntervals
�̂� +𝑚𝑢𝑙𝑡𝑖𝑝𝑙𝑖𝑒𝑟× JB KLJBM
� �̅� ± 𝑚𝑢𝑙𝑡𝑖𝑝𝑙𝑖𝑒𝑟× N
M�
• Thewidthoftheconfidenceintervalincreasesaslevelofconfidenceincreases(multiplier)
• Thewidthoftheconfidenceintervaldecreasesasthesamplesizeincreases
• Thevalue�̂�alsohasamoresubtleeffect.Thefartheritisfrom0.5thesmallerthewidth.
• Thewidthoftheconfidenceintervalincreasesasthesamplestandarddeviationincreases.

Whatdoes95%confidencemean?
• Ifwerepeatedlysampledfromapopulationandconstructed95%confidenceintervals,95%ofourintervalswillcontainthepopulationparameter.
• Noticetheintervalistherandomeventhere.

Whatdoes95%confidencemean?
• Supposea95%confidenceintervalforameanis2.5to4.3.Wewouldsayweare95%confidentthatthepopulationmeanisbetween2.5and4.3.– Doesthatmeanthat95%ofthedatafallbetween2.5and4.3?• No
– Doesthatmeanthatinrepeatedsampling,95%ofthesamplemeanswillfallbetween2.5and4.3?• No
– Doesthatmeanthatthereisa95%chancethepopulationmeanisbetween2.5and4.3?• Notquitebutclose.

Whatdoes95%confidencemean?
• Whatdoesitmeanwhenwesayweare95%confidentthatthepopulationmeanisbetween2.5and4.3?– Itmeansthatifwerepeatedthisprocess(takingrandomsamplesofthesamesizefromthesamepopulationandcomputing95%confidenceintervalsforthepopulationmean)repeatedly,95%oftheconfidenceintervalswefindwouldcontainthepopulationmean.
– P(confidenceintervalcontainsµ)=95%.