State Designation Programs - Vermont Legislature€¦ · 14/12/2017 · 4 Habitat homes. Winooski: Mill House Redevelopment 25 Market Rate Apartments. 10 Townhouses. Burlington:
20
State Designation Programs [overview and role in supporting strong communities and environmental health] Chris Cochran + Dale Azaria Department of Housing and Community Development December, 13 2017
State Designation Programs[overview and role in supporting strong communities and environmental health]
Chris Cochran + Dale Azaria Department of Housing and Community Development December, 13 2017
Presenter
Presentation Notes
Vermont’s traditional settlement pattern – compact centers surrounded by rural lands is what makes Vermont---Vermont. Many communities started near water bodies for ease of trade or to generate power. They quickly became the economic engines of Vermont. They embody 100s of years of public investments in roads, sewers, factories, housing, and public buildings. This is why most of the Vermont’s jobs are located in centers. They are where most us go to for entertainment and to shop.
Supports state land use goals Enables more transportation and housing options Provides a greater return on public infrastructure
investments Protects the environment and working lands Improves air and water quality Promotes healthy communities
Why Designate Centers?
Presenter
Presentation Notes
There are 5 state designation programs designed for different purposes -- 23 Downtowns, 141 Village Centers, 2 New Town Centers, 5 Neighborhood Development Areas, and 6 Growth Centers There are 177 centers designated statewide.
Vermont Downtown Board
Presenter
Presentation Notes
All the state designations are reviewed and approved by a diverse group of stakeholders that includes state agencies, the NRB, RPCs, municipalities, the Vermont Chamber, historic preservation and environmental advocates.
Size of Downtowns
Burlington: 208 ACRES
Bristol: 23.5 ACRES
75% of Vermont’s downtowns are under 100 acres.
25%100 + ACRES
50%50-100 ACRES
25%<50 ACRES
- Vermont Center for Geographic Information 2017
Presenter
Presentation Notes
This chart aggregates the acreage of the state designations into square miles. And it shows the relative size of the designations. The designations combined = 25.3 square miles total, or 1/400 of Vermont’s total land area. A square mile is 640 acres. The District of Columbia is 68.25 square miles. All the state designated lands are about 1/3 the size of the District.
Area of Designated Centers is 1/400 total area of Vermont
Growth Centers12 sq. miles
Villages8 sq. miles
Downtowns3 sq. miles
Neighborhoods2 sq. miles
New Town Cent.0.3 sq. miles
Vermont9623 sq. miles
Relative Size of Land Areas
- Vermont Center for Geographic Information 2017
Presenter
Presentation Notes
Presenter
Presentation Notes
The goal of all the designations is to encourage well planned, compact, multistory development. This strategy creates more housing choices close to jobs, stores, services and educational opportunities – strengthening communities, the Vermont brand and our quality of life. The increased development density, mix of uses, and activity has other co-benefits. It reduces pressure to build in our scenic and working landscapes. It saves money by reducing long-term infrastructure maintenance costs. It helps get folks out of their cars and make public transit work. This gets more people walking and biking, which promotes healthy lifestyles. Fewer vehicle miles traveled reduces GHGs, creates cleaner water and air, saves energy and money, and helps us meet the goals in the State’s Comprehensive Energy Plan It also supports more housing options for different life stages. Compact development also encourages community involvement, cohesion, and connections.
Presenter
Presentation Notes
Whereas auto-oriented development limits transportation options, does not use land or infrastructure efficiently and leads to reliance on single occupancy vehicles.
- Wildlands and Woodlands Farmlands and Communities 2017
Presenter
Presentation Notes
When Vermont’s permitting process treats development in designated centers the same as development in a farm field or on a rural hilltop, it tips development decisions decisively in favor of greenfield development -- and away from designated centers. Construction in designated areas tends to be more expensive than building in greenfields due to increased land costs, contaminated soils, coordinating infrastructure and shared facilities, staging construction in tight locations, greater need for creative design solutions, and meeting the concerns of a larger number of neighboring landowners. All these factors increase risk and many developers look to our rural or suburban areas where there fewer constraints and the time and cost of development is less. Many rural and suburban projects are intentionally designed to avoid Act 250 review. This sets the stage for increased parcelization and forest fragmentation.
Cost of Development
Schools$435
Schools$232
Rural/SuburbanTown Annual Cost, per Household
DowntownTown Annual Cost, per Household
- Sustainable Prosperity 2015
Presenter
Presentation Notes
While developing in rural and suburban areas is often cheaper and easier for developers, it is not for the rest of us. The cost to maintain roads, sewers, water, libraries -- and providing fire protection, policing, and schools in spread out areas is not inexpensive. Studies show that compact development can save taxpayers millions in capital costs and municipal services.
Median Household Annual Vehicle Miles Traveled by Area
24246
21495
20980
19262
14934
10195
8078
0 10,000 20,000
Exurbs in Chittenden County
Outside of Centers
State Median
Village Centers
1/2 mile from Downtowns
Downtowns
Designated Neighborhoods
- American Household Travel Survey 2009
Presenter
Presentation Notes
Speaking of cost — transportation is not cheap — Exurb households drive about three times more than households close a downtown. All that extra driving has a big impact on household budgets, family stress, and personal health, worker productivity and the environment.
Transportation
52%
Thermal
Total Energy Cost for Vermont Households
25%
23%Electricity (non-thermal)
- Vermont Energy Investment Corporation 2016
Presenter
Presentation Notes
We all know that Vermont’s housing market is tight. The limited amount of housing options at all price points affects housing prices and affordability. Many Vermonters must live in rural areas where housing costs tend to be lower. The true cost of housing includes transportation. Long commutes to work or school disproportionately affects lower-income families. In many cases, the cost of car ownership and fuel cancel out much of the household budget savings from lower home prices. This can bring the real cost of rural housing closer to the cost of a residence in or near a state designated center.
I would walk to work, school, shopping or otheractivities if they were close enough…
- Resource Systems Group 2012 [n=519 ]
91%
Presenter
Presentation Notes
There is a growing market demand for housing close to where we work or go to school or shop -- but there are not enough housing opportunities to meet the need.
Priority Housing Projects Jurisdiction
Downtown
New Town Center
Neighborhood Development Area
Growth Center
No permit or amendment needed
No permit amendment needed if the new development complies with existing conditions
- 10 V.S.A. §6081 (p)(2)
- 10 V.S.A. §6081 (p)(1)
Presenter
Presentation Notes
The Legislature created the Act 250 Priority Housing Project exemption to encourage more compact development in state designated centers. Act 250 is typically triggered by the development of 10 or more housing units. PHP jurisdictional thresholds exempt qualified ‘mixed-use’ and ‘mixed-income’ housing developments from Act 250 review. Currently these thresholds cap the number of units based on the size of the community. No permit or permit amendment is needed within Vermont’s downtowns. Once jurisdiction attaches, the parcel is subject to Act 250 review in perpetuity. The legislature made a change last year to address this issue. In the other centers listed in the slide – no permit amendment is needed if a PHP can meet all of the existing permit conditions. In some instances the permit conditions will have to be modified. For example, there might be changes to a landscaping plan that was required to screen the existing development from a neighboring property. Perhaps the landscaping plan is where the new housing will go. In that case, the developer would have to notify the parties to the existing permit of the proposed changes and give them an opportunity to object.
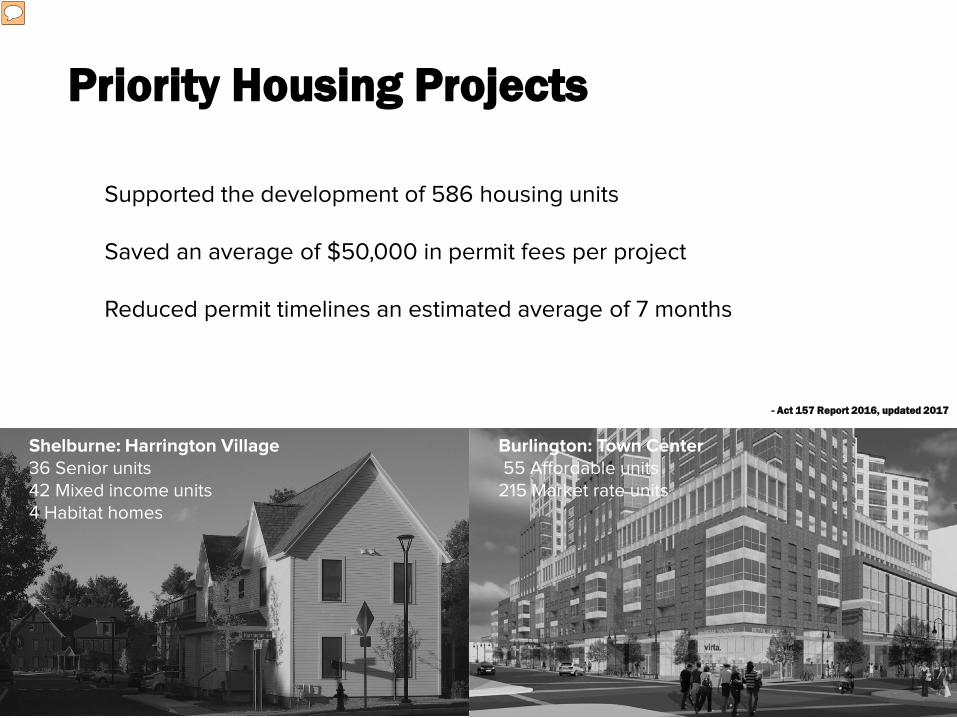
Supported the development of 586 housing units
Saved an average of $50,000 in permit fees per project
Reduced permit timelines an estimated average of 7 months
Priority Housing Projects
Shelburne: Harrington Village36 Senior units42 Mixed income units4 Habitat homes
Winooski: Mill House Redevelopment25 Market Rate Apartments10 Townhouses
Burlington: Town Center55 Affordable units215 Market rate units
- Act 157 Report 2016, updated 2017
Presenter
Presentation Notes
The data shows how the PHP exemption has encouraged the type of housing development Vermonters want. While the fee savings reduce cost help, developers value the reduced risk and the time saved – especially when appeals are factored in. The developer for Town Center in Burlington estimated the appeals on his project would take 1-2 years. Vermont has a short building season. Constructing a project in winter increases cost by at least 10%. These costs are typically passed on to the owner or renter.
Priority Housing Projects Flowchart
Presenter
Presentation Notes
This is page 1 of 2…. While the PHP process has helped a produce more housing in state designated centers – a simpler and better solutions are needed ensure we can meet the state’s housing needs.
Despite PHPs and the work of many Vermont-based institutions to improve and increase the supply of housing in Vermont – there’s a growing gap between existing housing availability and need Vermont’s households are getting smaller – which means more units are needed. This housing challenge is viewed as a serious problem by most Vermont employers. In a 2017 statewide survey, VHFA found that most employers viewed the cost and availability of housing as an obstacle to economic development. 74% believe that housing is a serious obstacle. 14% believe that housing is a minor obstacle. 12% believe that housing is not an obstacle.
42.7
Presenter
Presentation Notes
This is Vermont's median age. Half of Vermonters are younger and half are older. By contrast, the median American is a full five years younger -- 38 years old. Vermont’s downtowns are attractive places to live for younger and older Vermonters. Many older and retired Vermonters are seeking a downtown home ownership or rental options – which increases competition in low vacancy markets.
650
324
599500
1997
1071
850
561
274
1094
0
500
1000
1500
2000
2500
<30% 30-50% 50-80% 80-95% 95-120%
Under 55 Senior
Median Income Household Income
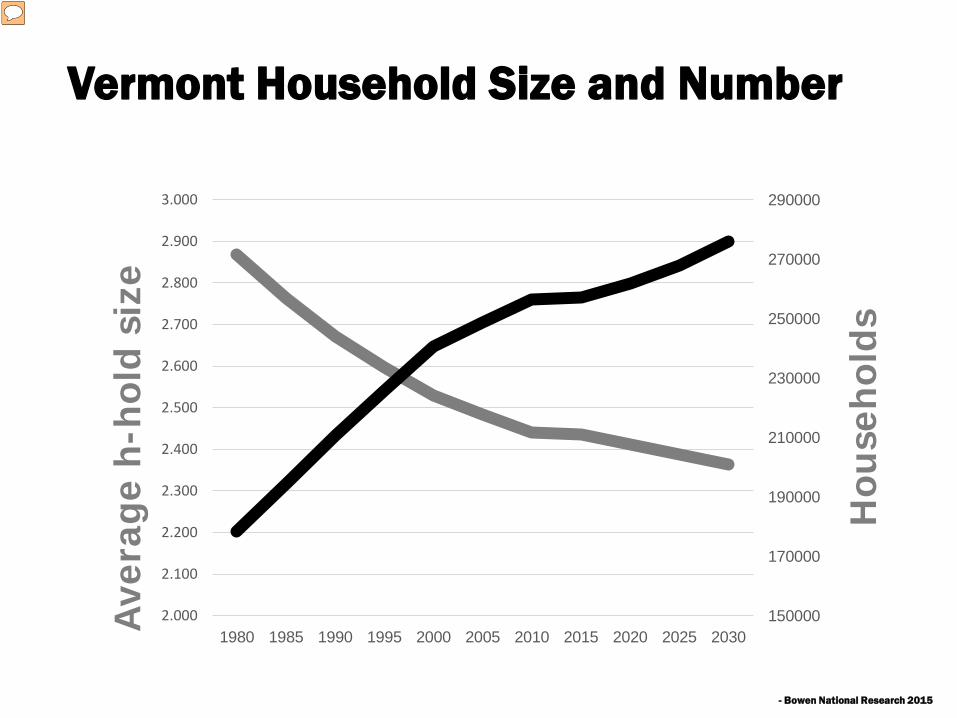
Vermont Housing Gap 2015-2020
Hou
sing
Gap
- Bowen National Research 2015
Presenter
Presentation Notes
Vermont's most recent housing needs assessments shows we need nearly 8,000 more units to close the gap. The largest housing need is for incomes between 95% and 120% of median income. The investment of the recent $35M housing bond primarily benefits households under 80% of median income. Regulatory incentives are an important and effective tool to ensure Vermont builds more housing in a way that enhances on our traditional settlement pattern and supports our environmental goals and standards.